Severe infections emerge from commensal bacteria by adaptive evolution
- University of Oxford, United Kingdom
- Oxford University Hospitals NHS Foundation Trust, United Kingdom
- Royal Sussex County Hospital, United Kingdom
- Brighton and Sussex Medical School, University of Sussex, United Kingdom
- NIHR Health Protection Unit in Healthcare Associated Infections and Antimicrobial Resistance at University of Oxford in partnership with Public Health England, United Kingdom
- University of Bristol, United Kingdom
- Public Health England, United Kingdom
- National Institute for Health Research, Oxford Biomedical Research Centre, United Kingdom
- Jenner Institute, United Kingdom
- Oxford Martin School, University of Oxford, United Kingdom
Figures
Figure 1 with 1 supplement
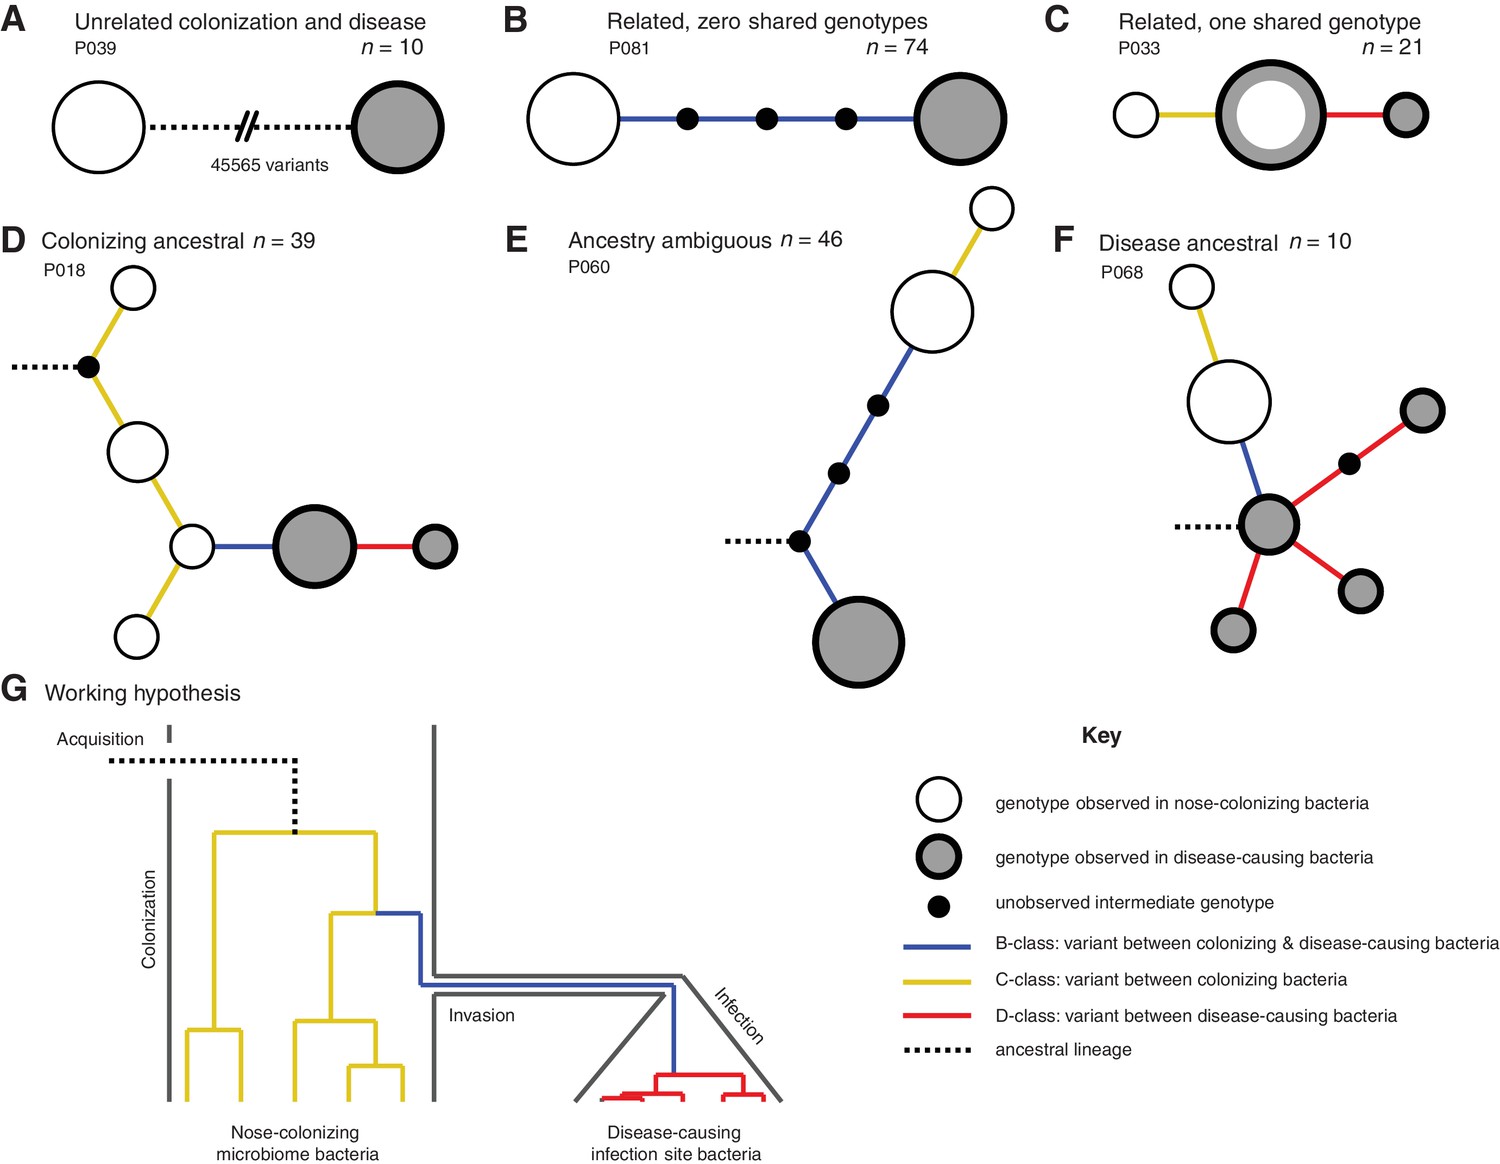
Infection-causing S. aureus form closely related but distinct populations descended from nose-colonizing bacteria in the majority of infections.
Bacteria sampled from the nose and infection site of 105 patients formed one of three population structures, illustrated with example haplotrees: (A) Unrelated populations differentiated by many variants. (B) Highly related populations separated by few variants. (C) Highly related populations with one genotype in common. Reconstructing the ancestral genotype in each patient helped identify the ancestral population: (D) Nose-colonizing bacteria ancestral. (E) Ambiguous ancestral population. (F) Infection site bacteria ancestral. (G) Phylogeny illustrating the working hypothesis that variants differentiating highly related nose-colonizing and infection-causing bacteria would be enriched for variants that promote, or are promoted by, infection. In A–F, haplotree nodes represent observed genotypes sampled from the nose (white) or infection site (grey), with area proportional to genotype frequency, or unobserved intermediate genotypes (black). Edges represent mutations. Patient identifiers and sample sizes (n) are given. In A–G, edge color indicates that mutations occurring on those branches correspond to B-class variants between nose-colonizing and infection-causing bacteria (blue), C-class variants among nose-colonizing bacteria (gold) or D-class variants among infection-causing bacteria (red). Black dashed edges indicate ancestral lineages. A B C.
Figure 1—figure supplement 1
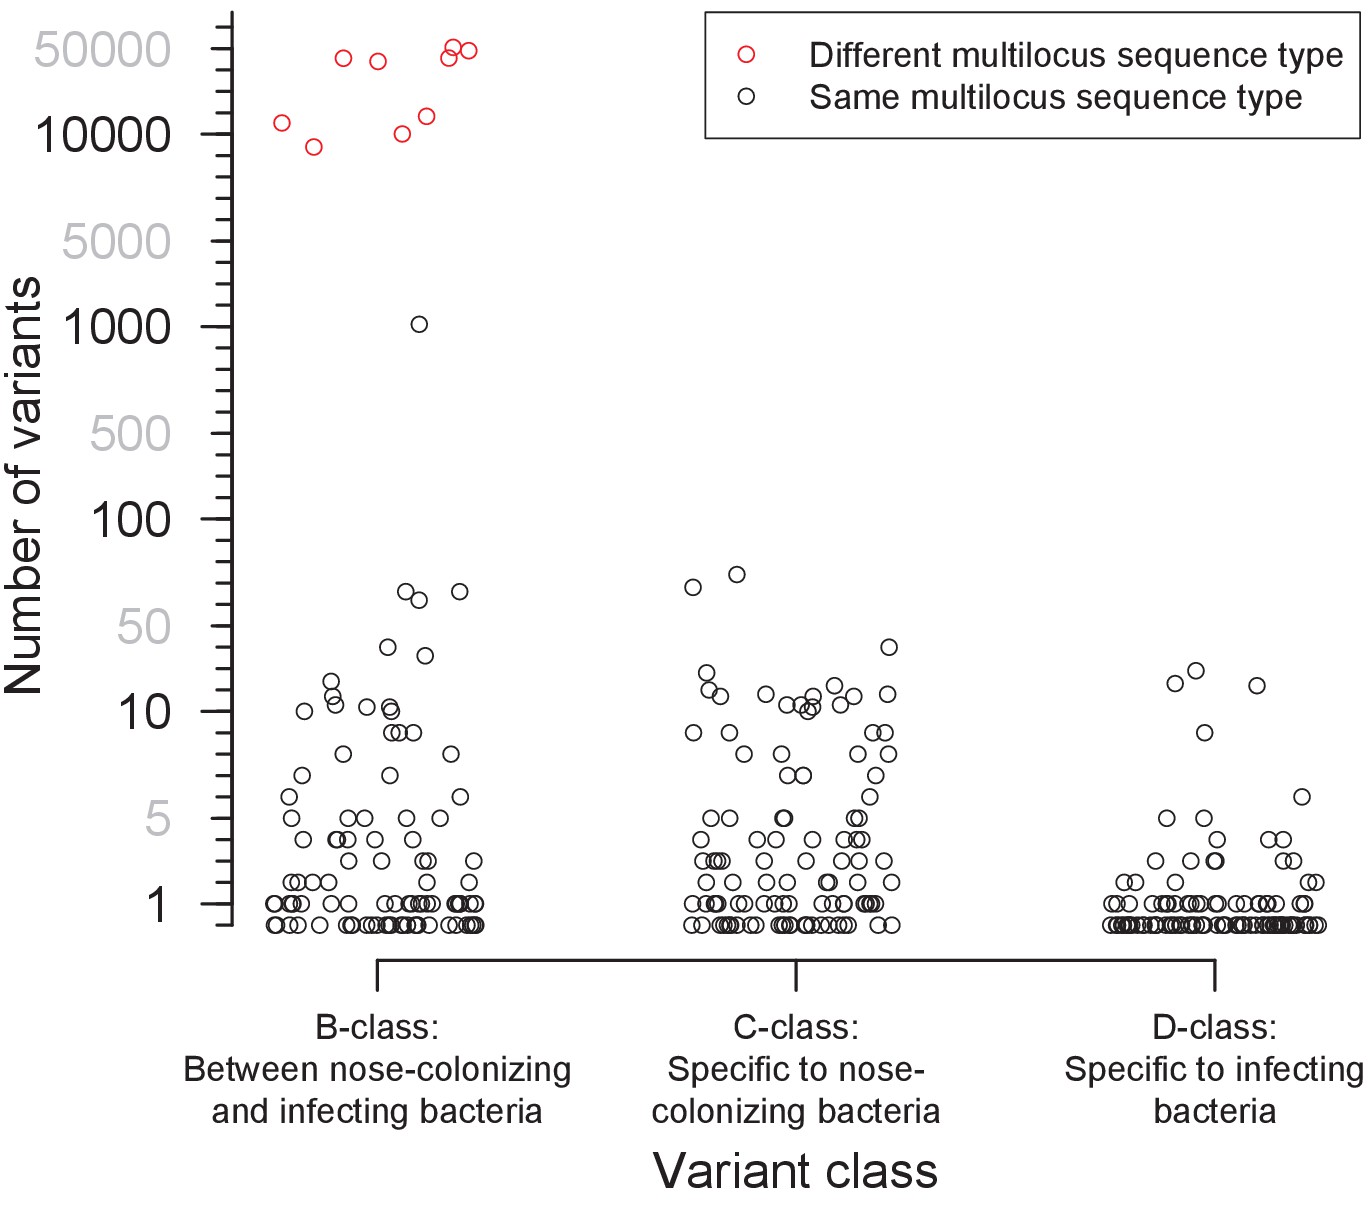
Distribution of the number of variants identified within 105 severely infected patients, by class.
Three classes of variants were identified: those representing genuine differences between nose-colonizing and infection populations (B-class), variants specific to the nose-colonizing population (C-class) and variants specific to the disease-causing infection population (D-class). The number of variants is shown on a piecewise-linear axis, with horizontal positioning permuted to assist visualization. Where nose-colonizing and infecting bacteria possessed different multilocus sequence types, the number of variants between those populations is colored red. When the number of B-class variants was 66 or less, nose-colonizing and infecting bacteria were considered related, since a similar range of (C-class) diversity was observed within the nose-colonizing populations of bacteria with the same multilocus sequence type. When the number of B-class variants was 1104 or more, nose-colonizing and infecting bacteria were considered unrelated.
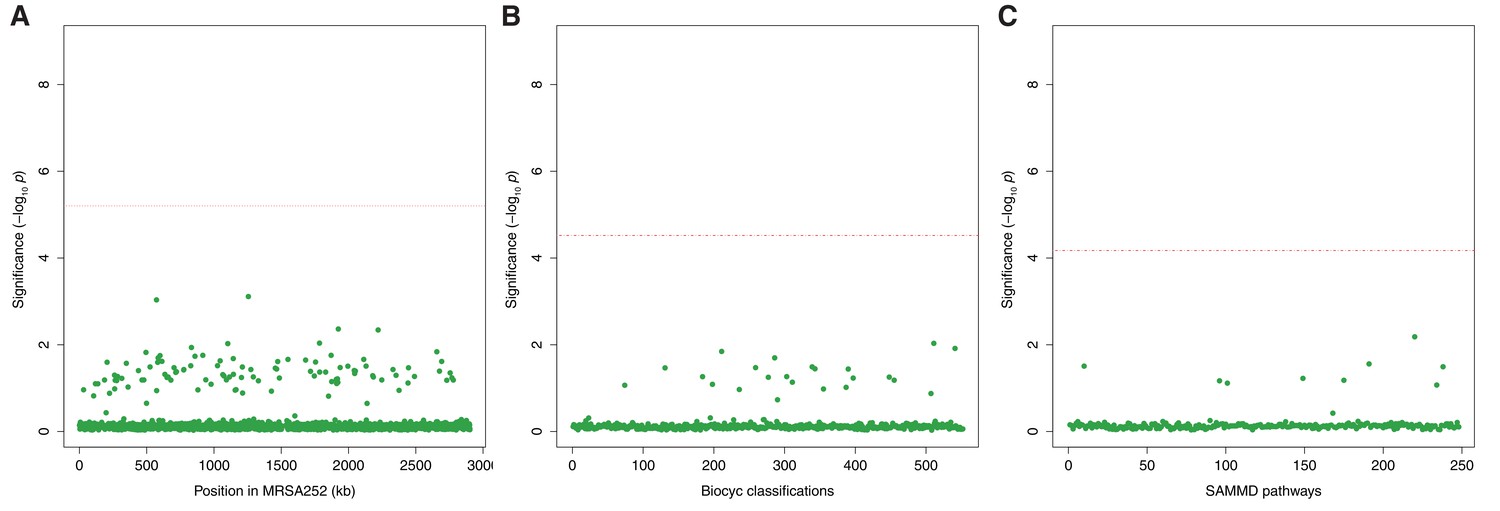
Figure 2 with 3 supplements
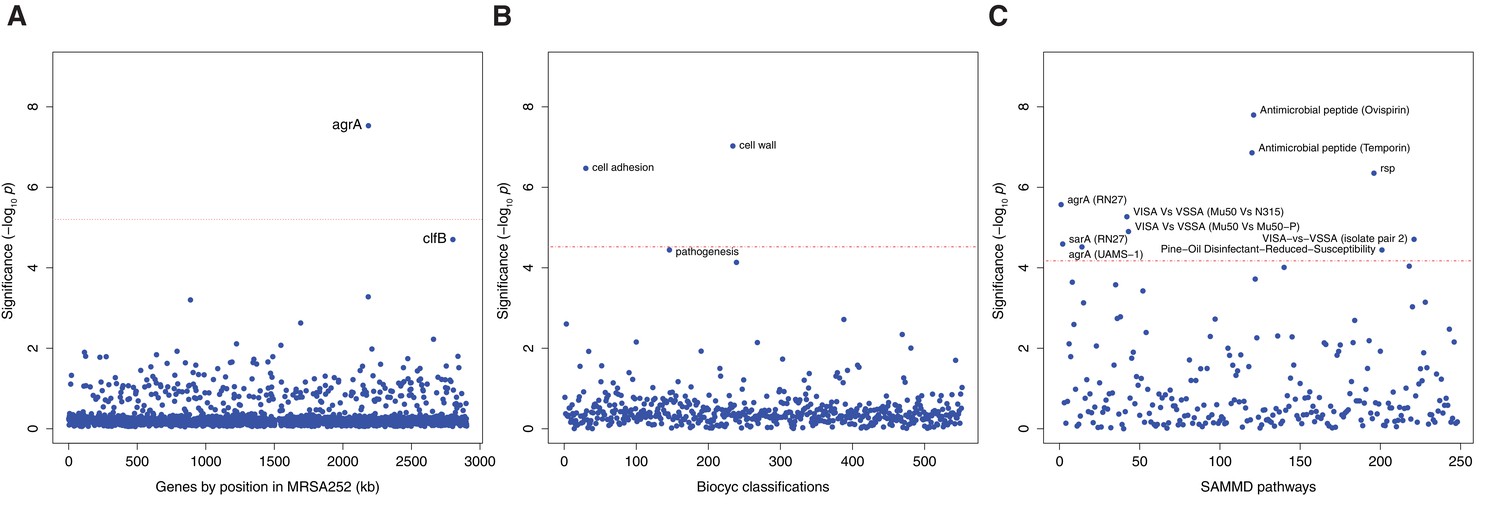
Genes, ontologies and pathways enriched for protein-altering substitutions between nose-colonizing and infection-causing bacteria within infected patients.
(A) Significance of enrichment of 2650 individual genes. (B) Significance of enrichment of 552 gene sets defined by BioCyc gene ontologies. (C) Significance of enrichment of 248 gene sets defined by SAMMD expression pathways. Genes, pathways and ontologies that approach or exceed a Bonferroni-corrected significance threshold of α = 0.05, weighted for the number of tests per category, (red lines) are named.
Figure 2—figure supplement 1
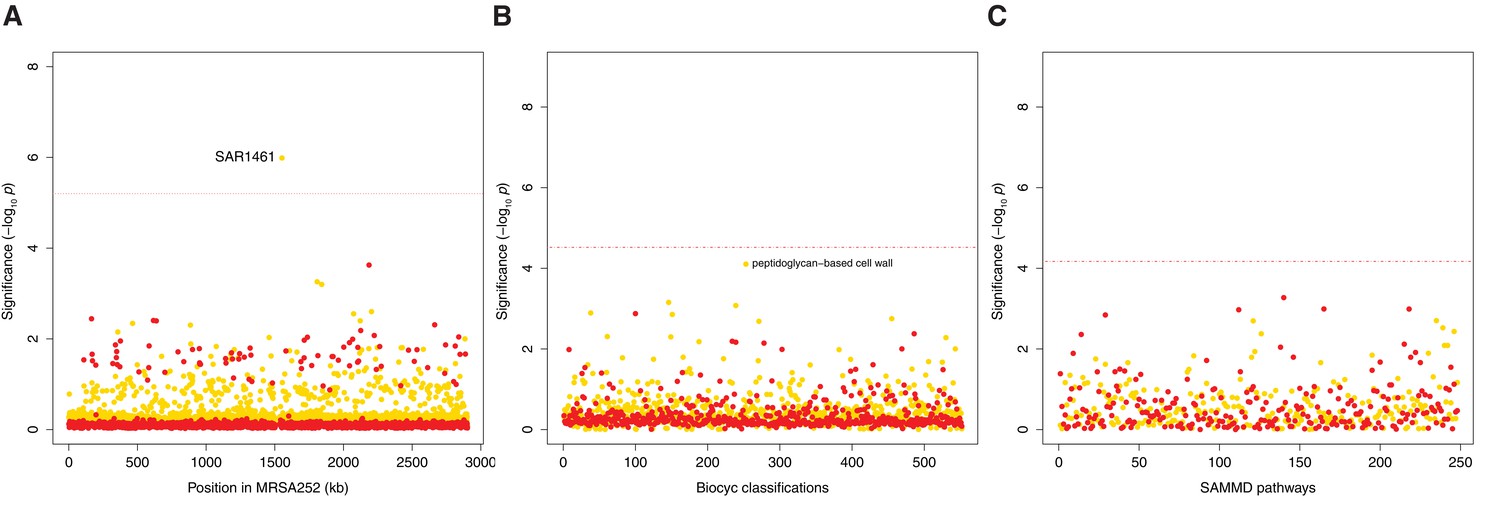
Genes, ontologies and pathways enriched for protein-altering transient variants within nose-colonizing and infection-causing bacteria.
(A) Significance of enrichment of 2650 individual genes. SAR1461 encodes Pbp2, penicillin-binding protein 2. (B) Significance of enrichment of 552 gene sets defined by BioCyc gene ontologies. (C) Significance of enrichment of 248 gene sets defined by SAMMD expression pathways. C-class variants among nose-colonizing bacteria are colored gold, D-class variants among infection-causing bacteria are colored red. Genes, pathways and ontologies that approach or exceed a Bonferroni-corrected significance threshold of α = 0.05, weighted for the number of tests per category, (red lines) are named.
Figure 2—figure supplement 2
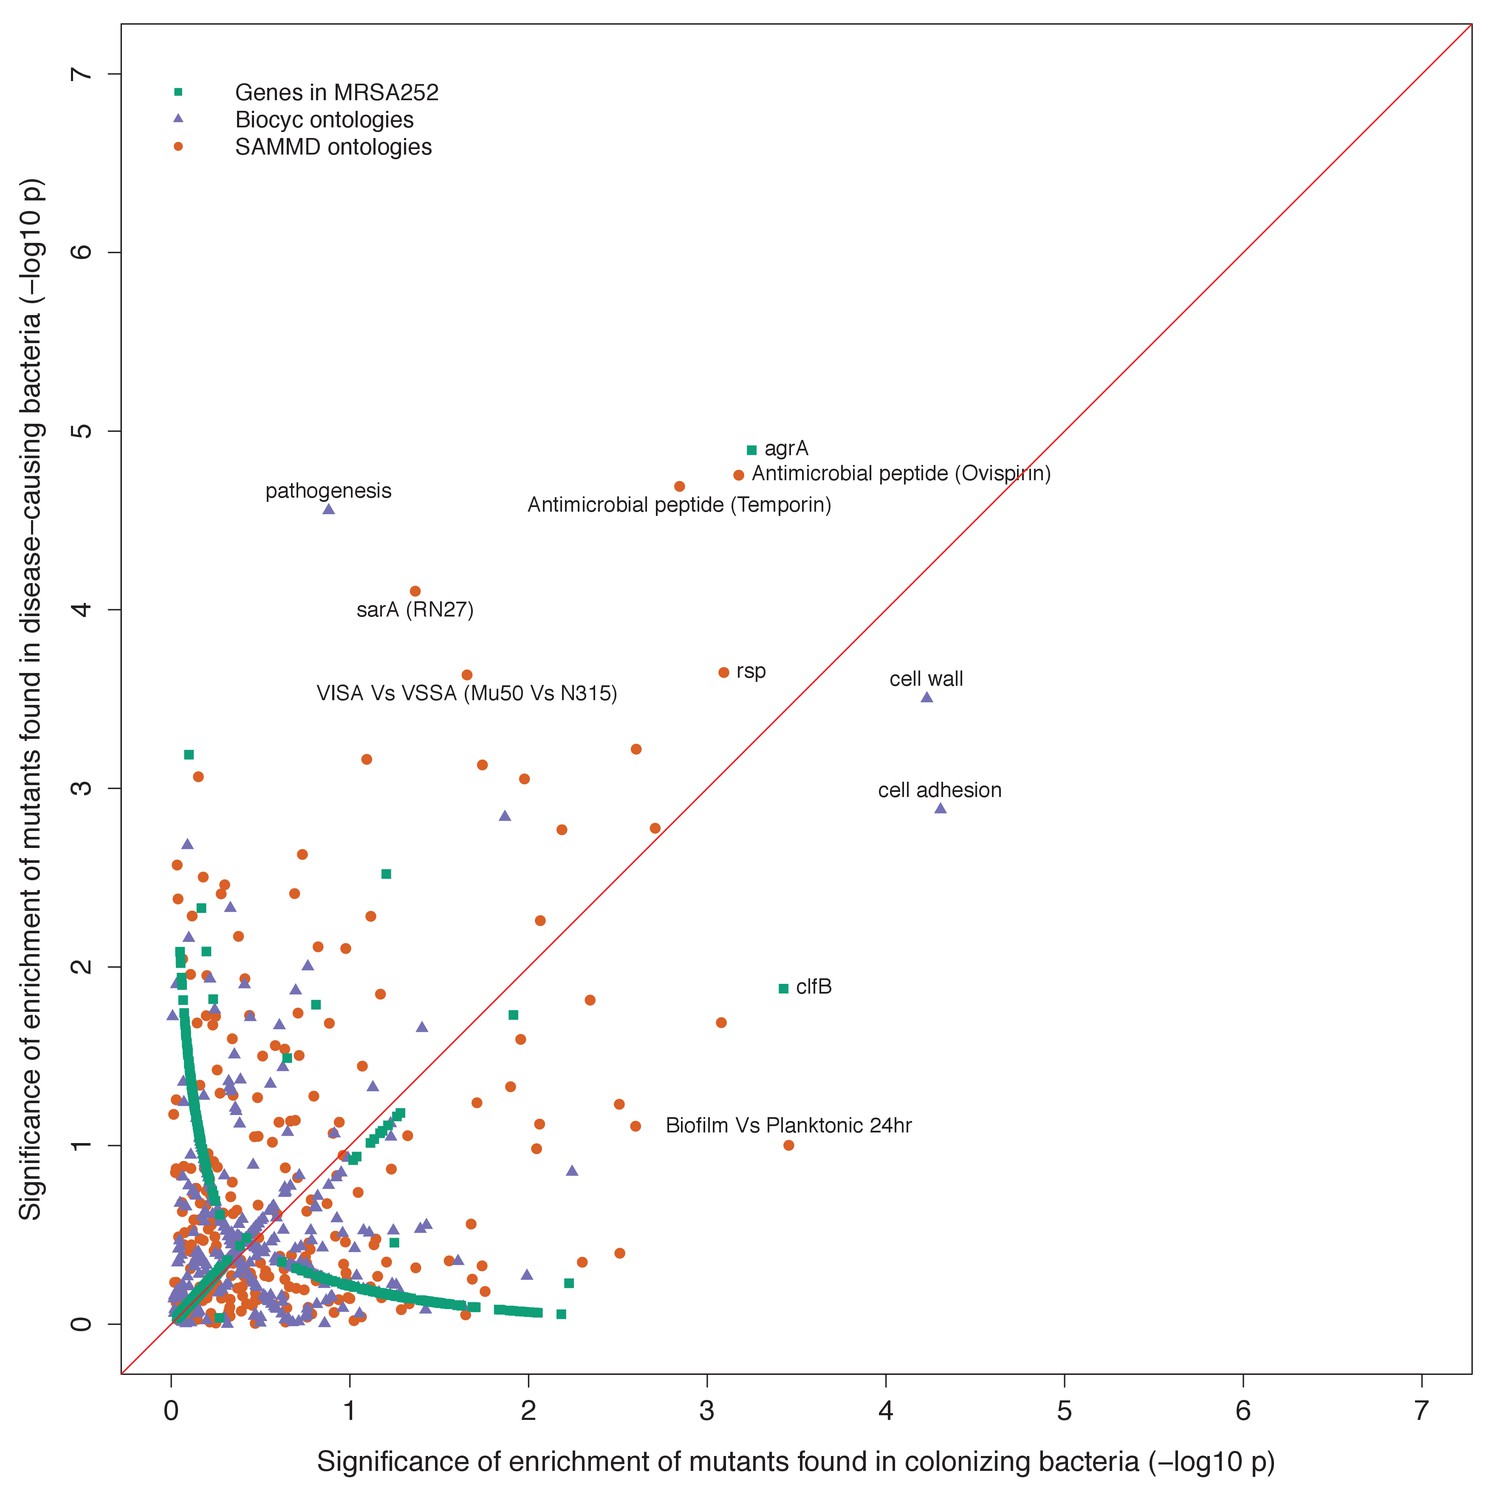
Gene set enrichment analysis of B-class mutants occurring in the nose or the infection site.
Each point indicates the –log10 p-values of two tests for enrichment of protein-altering variants found among mutants in nose-colonizing bacteria vs infection-causing bacteria. The shape of each point represents the type of enrichment tested (squares: within 2650 genes in MRSA252, triangles: 552 BioCyc gene ontologies, circles: 248 SAMMD expression pathways). A line of 1:1 correspondence is plotted in red. A -log10p-value above 5.2, 4.5 or 4.2 was considered genome-wide significant for loci, gene ontologies or expression pathways, respectively.
Figure 2—figure supplement 3
Genes, ontologies and pathways enriched for protein-altering variants among longitudinally sampled asymptomatic nasal carriers.
(A) Significance of enrichment of 2650 individual genes. (B) Significance of enrichment of 552 gene sets defined by BioCyc gene ontologies. (C) Significance of enrichment of 248 gene sets defined by SAMMD expression pathways. Genes, pathways and ontologies that approach or exceed a Bonferroni-corrected significance threshold of α = 0.05, weighted for the number of tests per category, (red lines) are named.
Figure 3 with 2 supplements
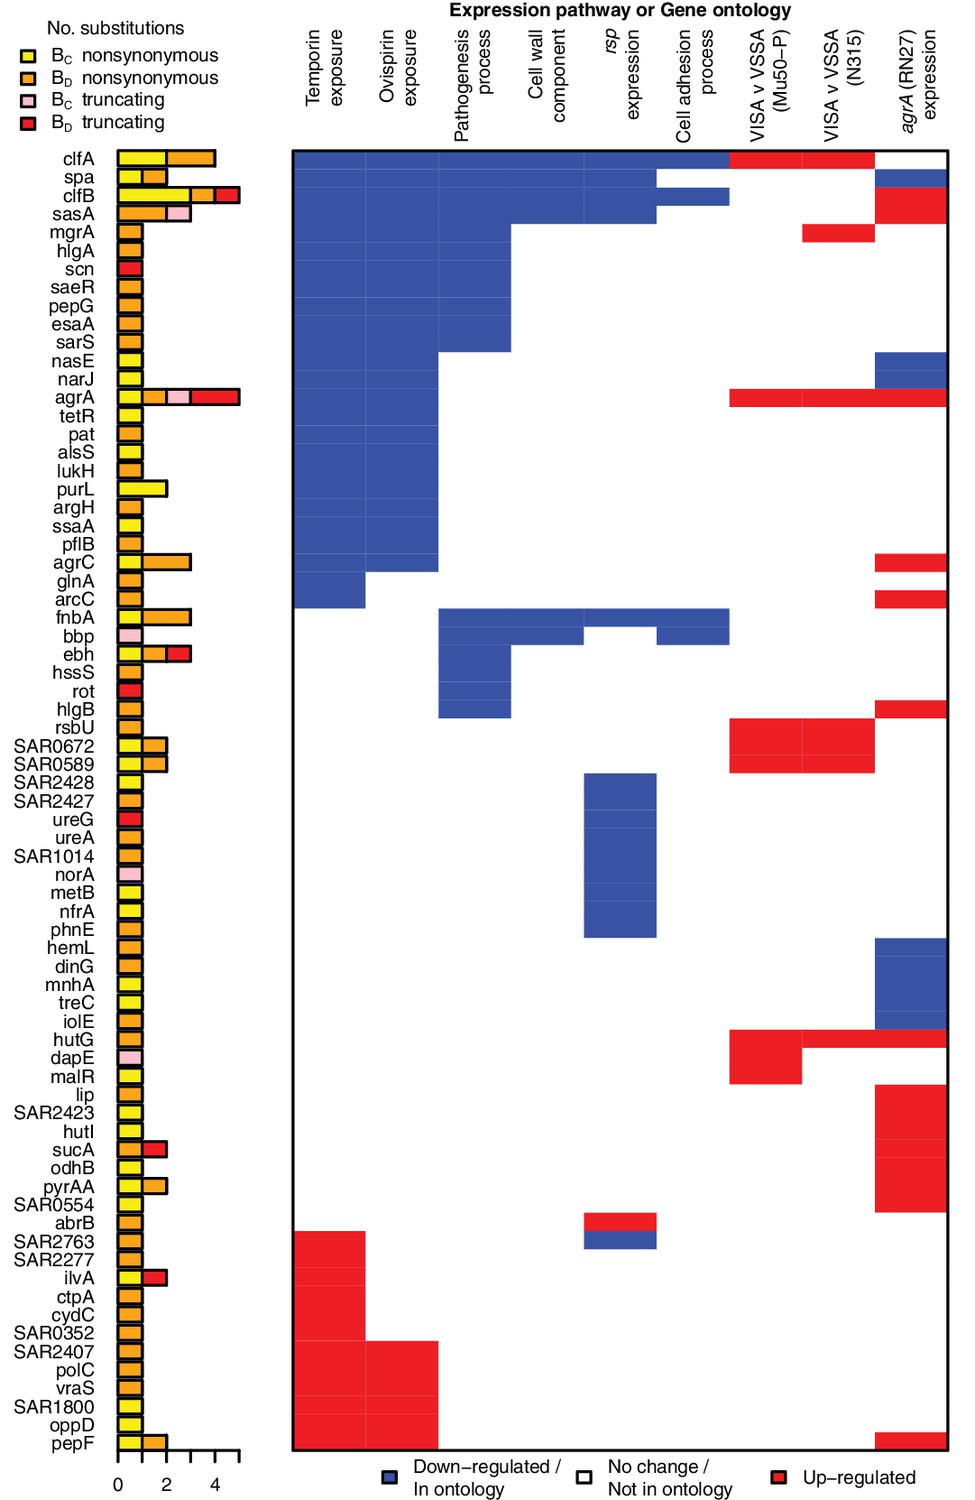
All genes contributing to the pathways and ontologies most significantly enriched for protein-altering substitutions between nose-colonizing and infection-causing bacteria.
The pathogenesis ontology, in which significant enrichments were observed in infection-causing but not nose-colonizing bacteria, is shown for comparison. Every gene with at least one substitution between nose-colonizing and infection-causing bacteria and which was up- (red) or down- regulated (blue) in one of the pathways or a member of one of the ontologies (blue) is shown. To the left, the number of altering (yellow/orange) and truncating (pink/red) B-class variants is shown, broken down by the population in which the mutant allele was found: nose (BC; yellow/pink) or infection site (BD; orange/red).
Figure 3—figure supplement 1
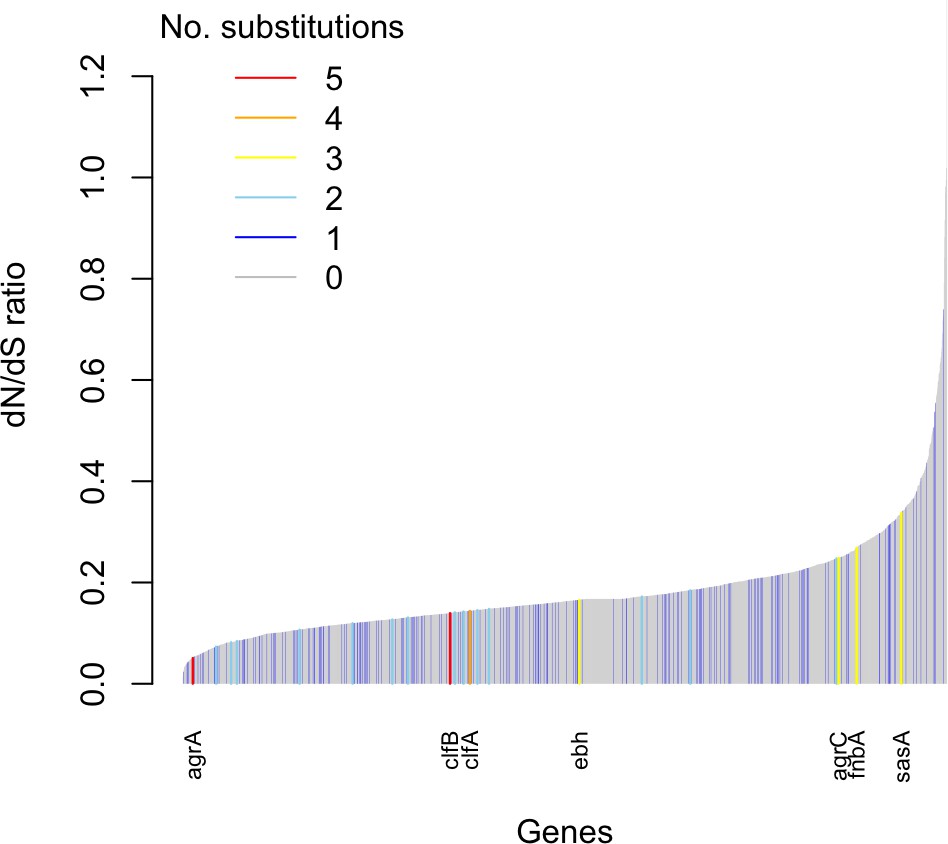
Genes enriched for substitutions between nose-colonizing and infection-causing bacteria within patients are not the most rapidly evolving at the species level.
An estimate of the dN/dS ratio between unrelated bacteria is shown for each gene, color-coded by the number of protein-altering substitutions between nose-colonizing and infection-causing bacteria within patients. There was a negative Spearman rank correlation between dN/dS ratio and substitutions within patients (ρ = –0.04, p=0.02).
Figure 3—figure supplement 2
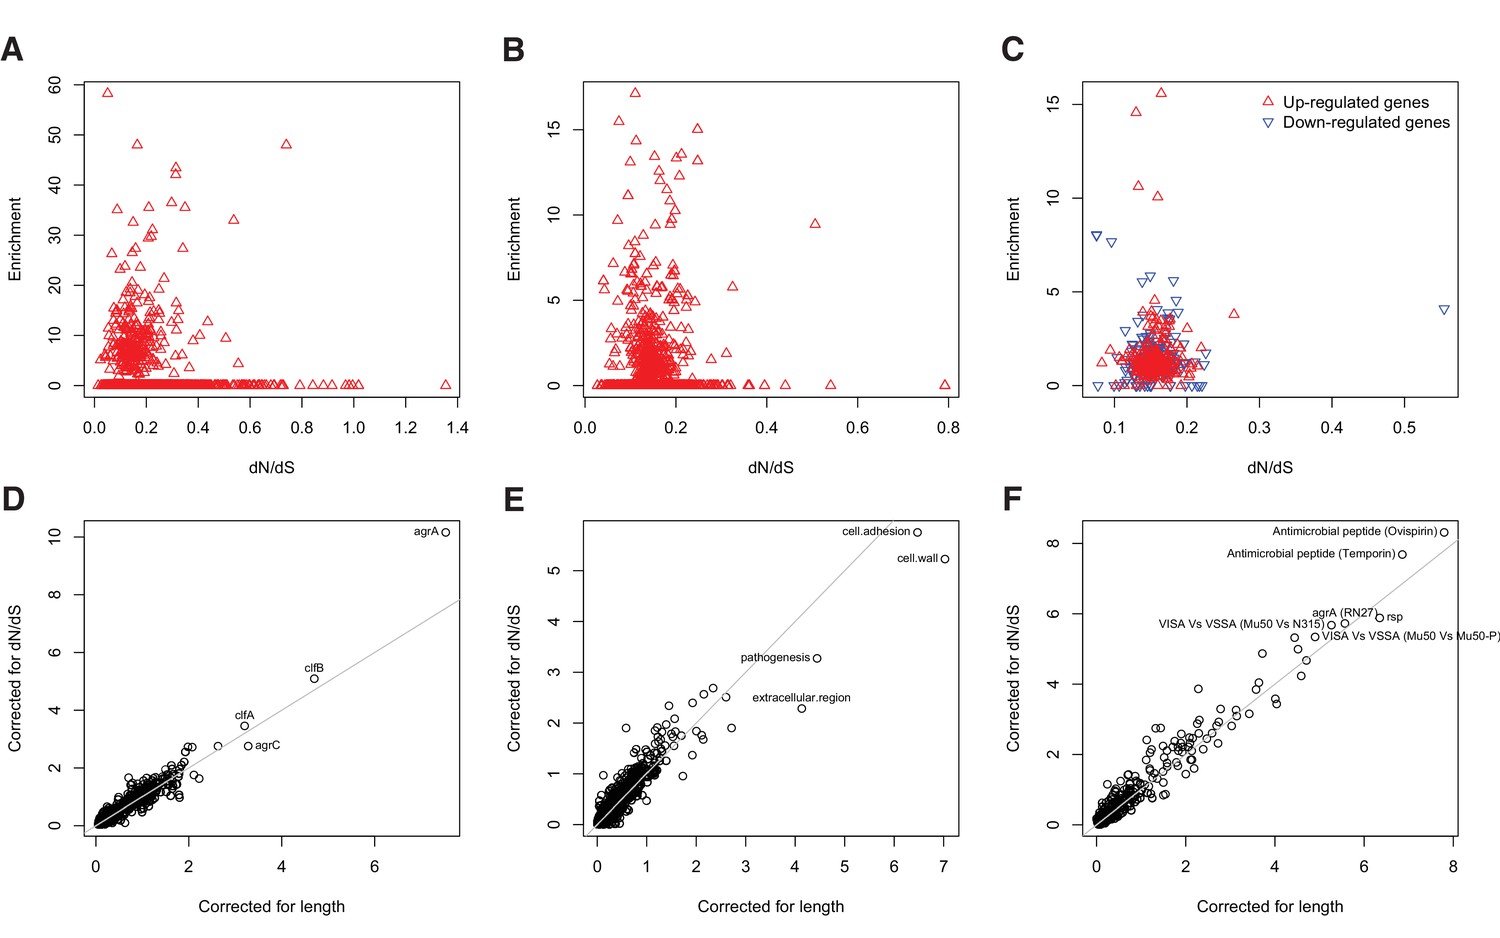
Gene set enrichment analysis is robust to species-level differences in dN/dS between genes.
For every locus, expression pathway and gene ontology, we estimated dN/dS between unrelated S. aureus. There was no relationship between dN/dS and enrichment of protein-altering substitutions between nose-colonizing and infection-causing bacteria in (A) loci, (B) ontologies nor (C) pathways (non-significant correlations, p>0.05). When we incorporated variability in dN/dS between genes in the gene set enrichment analyses, the results were robust for (D) loci, (E) ontologies and (F) pathways, showing only small differences in significance (-log10 p-value) between the analyses that correct for locus length only (horizontal axes) and those that correct for locus length and dN/dS (vertical axes).
Tables
Table 1
Distribution of infection types and relatedness of nose-colonizing and infecting S. aureus among 105 patients revealed by genomic comparison.
https://doi.org/10.7554/eLife.30637.002| Infection sites | Relation of nose-colonizing to infecting bacteria | ||
|---|---|---|---|
| Unrelated (≥1104 variants) | Closely related (≤66 variants) | ||
| Zero shared genotypes | One shared genotype | ||
| Bloodstream | 4 | 43 | 8 |
| Soft tissue | 4 | 23 | 10 |
| Bone and joint | 2 | 8 | 3 |
| Total | 10 | 74 | 21 |
Table 2
Cross-classification of variants within patients by phylogenetic position and predicted functional effect, and comparison to asymptomatic nose carriers.
Neutrality indices (McDonald and Kreitman, 1991; Rand and Kann, 1996) were defined as the odds ratio of mutation counts relative to synonymous variants in patients versus asymptomatic nose carriers (Reference Panel I). Those significant at p<0.05 and p<0.005 are emboldened and underlined respectively.
| Number of variants (Neutrality index) | ||||||
|---|---|---|---|---|---|---|
| Phylogenetic position | Synonymous | Non-synonymous | Protein truncating | Non-coding | Total | |
| Patients with severe infections (n = 105) | ||||||
| Between nose-colonization and infection site (B-class) | 93 | 265 (1.1) | 39 (3.1) | 140 (1.2) | 537 | |
| Within nose-colonization (C-class) | 93 | 325 (1.3) | 59 (4.7) | 145 (1.3) | 622 | |
| Within infection site (D-class) | 26 | 82 (1.2) | 15 (4.3) | 40 (1.3) | 163 | |
| Total | 212 | 672 (1.2) | 113 (3.9) | 325 (1.3) | 1322 | |
| Asymptomatic carriers (Golubchik et al., 2013) (Reference panel I, for comparison, n = 13) | ||||||
| Within nose-colonization (C-class) | 37 | 97 | 5 | 45 | 184 | |
Table 3
Genes, gene ontologies and expression pathways exhibiting the most significant enrichments or depletions of protein-altering B-class variants separating nose and infection site bacteria.
Enrichments below one represent depletions. The total number of variants and genes available for analysis differed by database. A -log10 p-value above 5.2, 4.5 or 4.2 was considered genome-wide significant for loci, gene ontologies or expression pathways respectively (in bold).
| Gene group | No. protein-altering B-class variants | Cumulative lengthof genes (kb) | Enrichment | Significance (-log10 p value) | |||
|---|---|---|---|---|---|---|---|
| Locus | |||||||
| agrA | 5 | 0.7 | 58.27 | 7.53 | |||
| clfB | 5 | 2.6 | 15.87 | 4.70 | |||
| Total | 289 | 2363.8 | |||||
| BioCyc Gene Ontology (Caspi et al., 2016) | |||||||
| Cell wall | 18 | 30.9 | 5.02 | 7.03 | |||
| Cell adhesion | 13 | 17.2 | 6.44 | 6.47 | |||
| Pathogenesis | 31 | 112.5 | 2.41 | 4.44 | |||
| Total | 288 | 2359.3 | |||||
| SAMMD Expression Pathway | Down-regulated | Up-regulated | Down-regulated | Up-regulated | Down-regulated | Up-regulated | |
| Ovispirin-1 (Pietiäinen et al., 2009) | 40 | 7 | 121.2 | 142.9 | 2.65 | 0.39 | 7.80 |
| Temporin L (Pietiäinen et al., 2009) | 42 | 14 | 125.1 | 156.1 | 2.78 | 0.74 | 6.86 |
| rsp (Lei et al., 2011) | 27 | 1 | 61.1 | 13.7 | 3.61 | 0.60 | 6.35 |
| agrA (RN27) (Dunman et al., 2001) | 9 | 30 | 41.0 | 85.0 | 1.83 | 2.94 | 5.57 |
| VISA-vs-VSSA (Mu50 vs N315) (Cui et al., 2005) | 0 | 17 | 0 | 34.4 | 0 | 3.95 | 5.27 |
| VISA-vs-VSSA (Mu50 vs Mu50-P) (Cui et al., 2005) | 0 | 17 | 0 | 36.7 | 0 | 3.70 | 4.90 |
| VISA-vs-VSSA (isolate pair 2) (Howden et al., 2008) | 14 | 3 | 26.9 | 59.7 | 4.06 | 0.39 | 4.71 |
| sarA (RN27) (Dunman et al., 2001) | 6 | 23 | 49.9 | 57.7 | 0.97 | 3.22 | 4.59 |
| agrA (UAMS-1 OD 1.0) (Cassat et al., 2006) | 0 | 5 | 0 | 2.7 | 0 | 14.57 | 4.52 |
| Pine-Oil Disinfectant-Reduced-Susceptibility (Lamichhane-Khadka et al., 2008) | 17 | 5 | 36.4 | 23.6 | 3.76 | 1.70 | 4.44 |
| Total | 275 | 2093.5 | |||||
Additional files
-
Supplementary file 1
List of all cultures included in the site, the site of infection (and any known source if bloodstream), number of isolates sequenced from each site, ST or CC by in silico MLST, number of variants found at each site and the mean pair-wise difference comparing isolates.
- https://doi.org/10.7554/eLife.30637.014
-
Supplementary file 2
List of all variants found within patients with S. aureus infections, location on shared reference (MRSA252), or position and reference genome name and accession number if variant could not be localized on MRSA252.
Each variant is described by the alleles found, its location in gene, the predicted effect on gene product and the location of the variant on the phylogenetic tree.
- https://doi.org/10.7554/eLife.30637.015
-
Supplementary file 3
Neutrality indices show signals of adaptation among the genes, gene ontologies and expression pathways most significantly enriched for protein-altering B-class variants.
Neutrality indices (NIs, 41,42) were calculated as the odds ratio of the number of protein-altering to synonymous variants among B-class versus C/D-class variants. These tests are less powerful than the Poisson regression likelihood ratio tests used to detect gene or gene set enrichment of protein-altering B-class variants (Table 3); we present them to demonstrate that the direction of enrichment was consistent with adaptation (NI > 1). To mitigate the reduced power, we calculated the expected numbers of protein-altering B-class variants from the numbers of protein-altering C/D-class variants, synonymous B-class variants and synonymous C/D-class variants by pooling them across all genes. This was justified by the absence of evidence for within-patient recombination and lack of enrichment signals among synonymous variants and C/D class protein-altering variants. A one-tailed Poisson test in R (R Core Team, 2015) was used to test NI > 1 (significant NIs at p<0.05 in bold).
- https://doi.org/10.7554/eLife.30637.016
-
Supplementary file 4
List of all variants found within long term asymptomatic carriers, location on shared reference (MRSA252), or position and reference genome name and accession number if variant was not localized on MRSA252.
Each variant is described by the alleles found, its location in gene and the predicted effect on gene product.
- https://doi.org/10.7554/eLife.30637.017
-
Supplementary file 5
For all ontologies showing enrichment in within-patient BD-class variants, we identified the genes with variants contributing to the signal.
We counted the number of protein-altering variants in these genes within patients, and compared to the number in long-term asymptomatic carriers. p-Values calculated using Fisher’s exact test. *Variant totals are different for SAMMD pathways (rsp, agrA, sarA) and BioCyc ontologies (cell wall, cell adhesion, pathogenesis) because pathway information is available for a different number of loci in each database.
- https://doi.org/10.7554/eLife.30637.018
-
Transparent reporting form
- https://doi.org/10.7554/eLife.30637.019
Download links
A two-part list of links to download the article, or parts of the article, in various formats.
Downloads (link to download the article as PDF)
Open citations (links to open the citations from this article in various online reference manager services)
Cite this article (links to download the citations from this article in formats compatible with various reference manager tools)
Severe infections emerge from commensal bacteria by adaptive evolution
eLife 6:e30637.
https://doi.org/10.7554/eLife.30637


