BMPs direct sensory interneuron identity in the developing spinal cord using signal-specific not morphogenic activities
- University of California, United States
- California State University, United States
- University of Southern California, United States
Figures
Figure 1 with 1 supplement
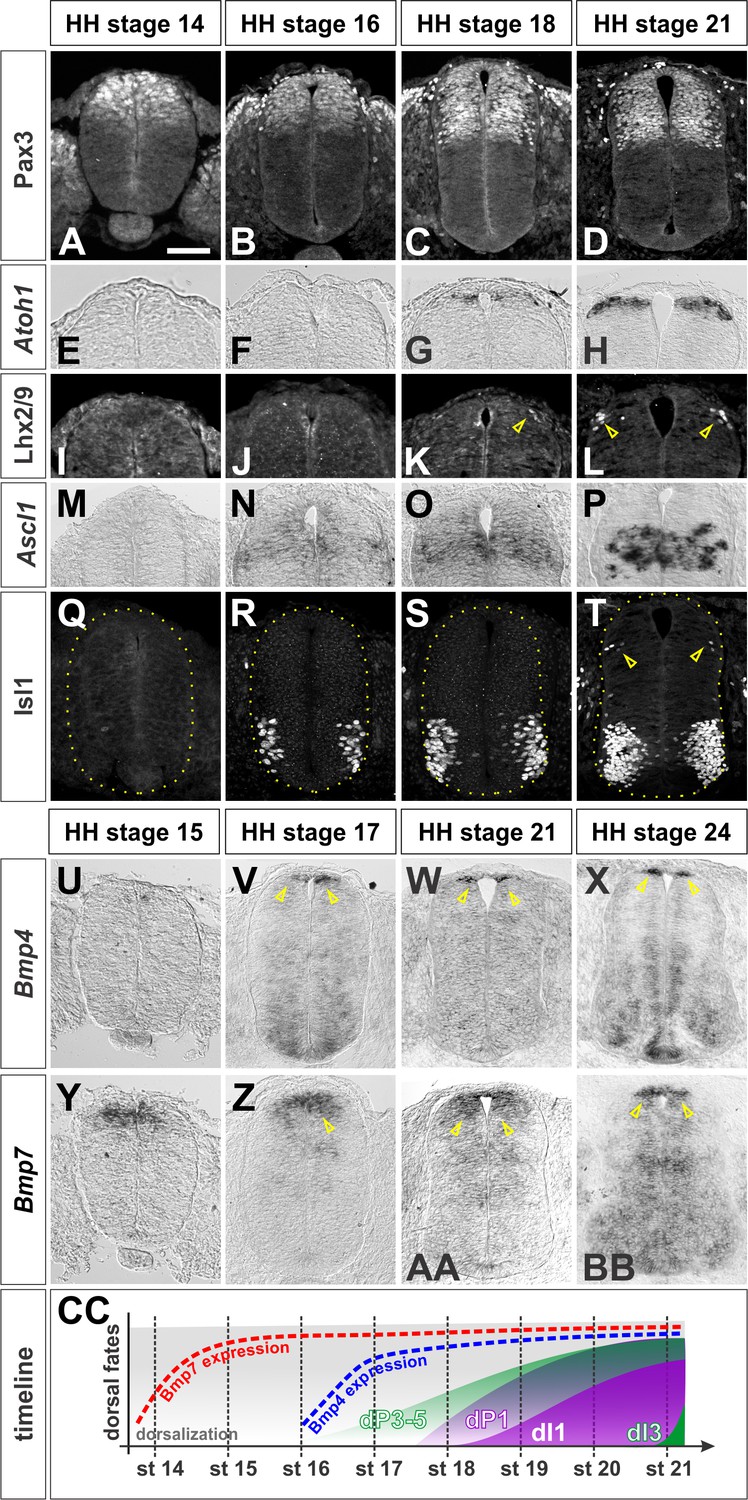
Timeline of dorsal patterning in the chicken spinal cord.
Brachial (A, B, E, F, G, H, I, J, K, L, M, N, Q, U, X, Y, BB) or thoracic (C, D, O, P, R, S, T, V, W, Z, AA) level transverse sections from Hamburger-Hamilton (HH) stage 14–24 chicken spinal cords processed for immunohistochemistry (A–D, I-–L, Q–T) or in situ hybridization (E–H, M–P, U–BB). (A–D) Pax3 is present in dorsal progenitors prior to HH stage 14 and persists throughout dorsal spinal cord patterning and differentiation. (E–H) Atoh1 expression in dP1 progenitors begins prior to HH stage 18. (I–L) Lhx2/9+ dI1 neurons start to be born at the brachial-most levels of HH stage 18 embryos. (M–P) Ascl1 expression in dP3-5 progenitors begins prior to HH stage 16. (Q–T) Isl1+ dI3 neurons are born starting from HH stage 21. (U–X) Bmp4 is expressed in cells flanking the RP prior to HH stage 17 and stays tightly localized to this region in the dorsal spinal cord. (Y–BB) Bmp7 expression starts at ~HH stage 14, and it is expressed more broadly in the dorsal-most spinal cord, including the RP. (CC)A timeline summarizing the onset of Bmp expression and generation of dI1 and dI3 neurons. Scale bar: 50 µm.
Figure 1—figure supplement 1
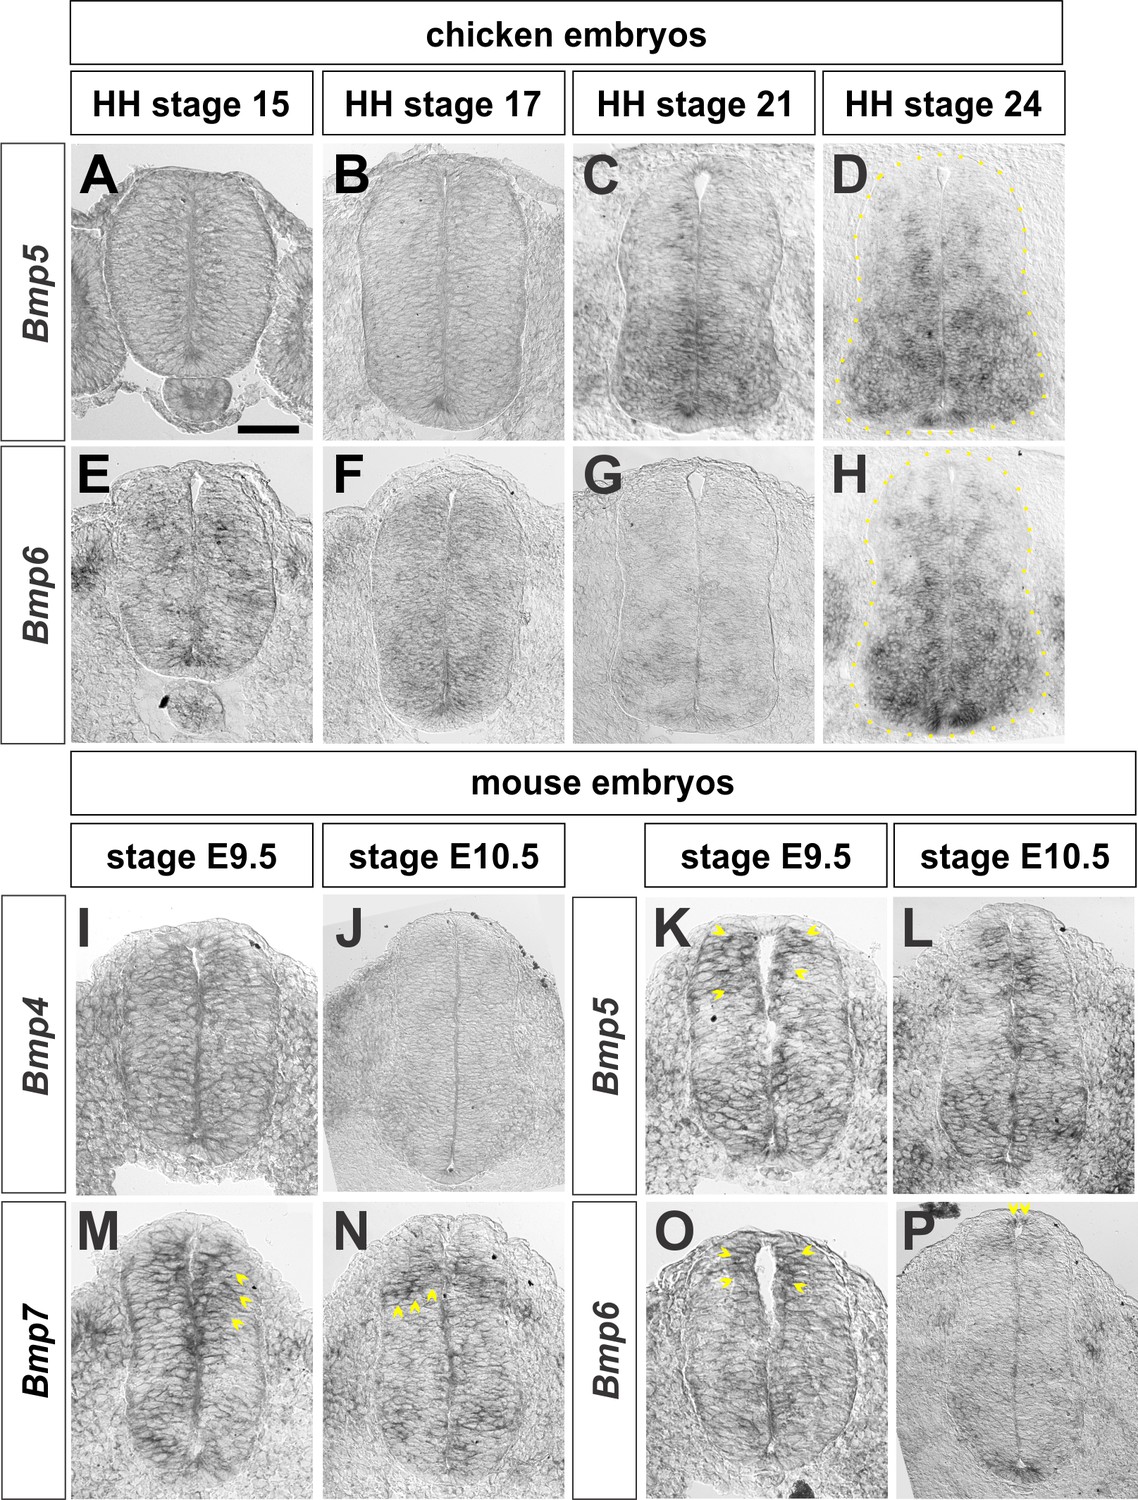
Expression of Bmps in chicken and mouse embryos.
Brachial (A–I, K, M, O) or thoracic (J, L, N, P) level transverse sections from Hamburger Hamilton (HH) stage 14–24 chicken spinal cords or embryonic (E) day 9.5–10.5 mouse embryonic spinal cord processed for in situ hybridization (A–P). (A–D) Bmp5 expression begins around HH stage 21 and is expressed broadly throughout the intermediate and ventral spinal cord. (E–H) Bmp6 expression starts prior to HH stage 15 and persists through HH stage 24. (I–J) Bmp4 has non-specific expression in the spinal cord at E9.5 and is restricted to epidermal ectoderm outside of the spinal cord by E10.5. (K–L) Bmp5 is expressed throughout the dorsal spinal cord at E9.5 (arrows, K) and E10.5. (M-N) Bmp7 is expressed in the dorsal spinal cord at E9.5 (arrows, M) and E10.5 (arrows, N). (O–P) Bmp6 is expressed in the RP and dorsal-most spinal cord at E9.5 (arrows, O) and E10.5 (arrows, P). Scale bar: 40 µm.
Figure 2 with 4 supplements
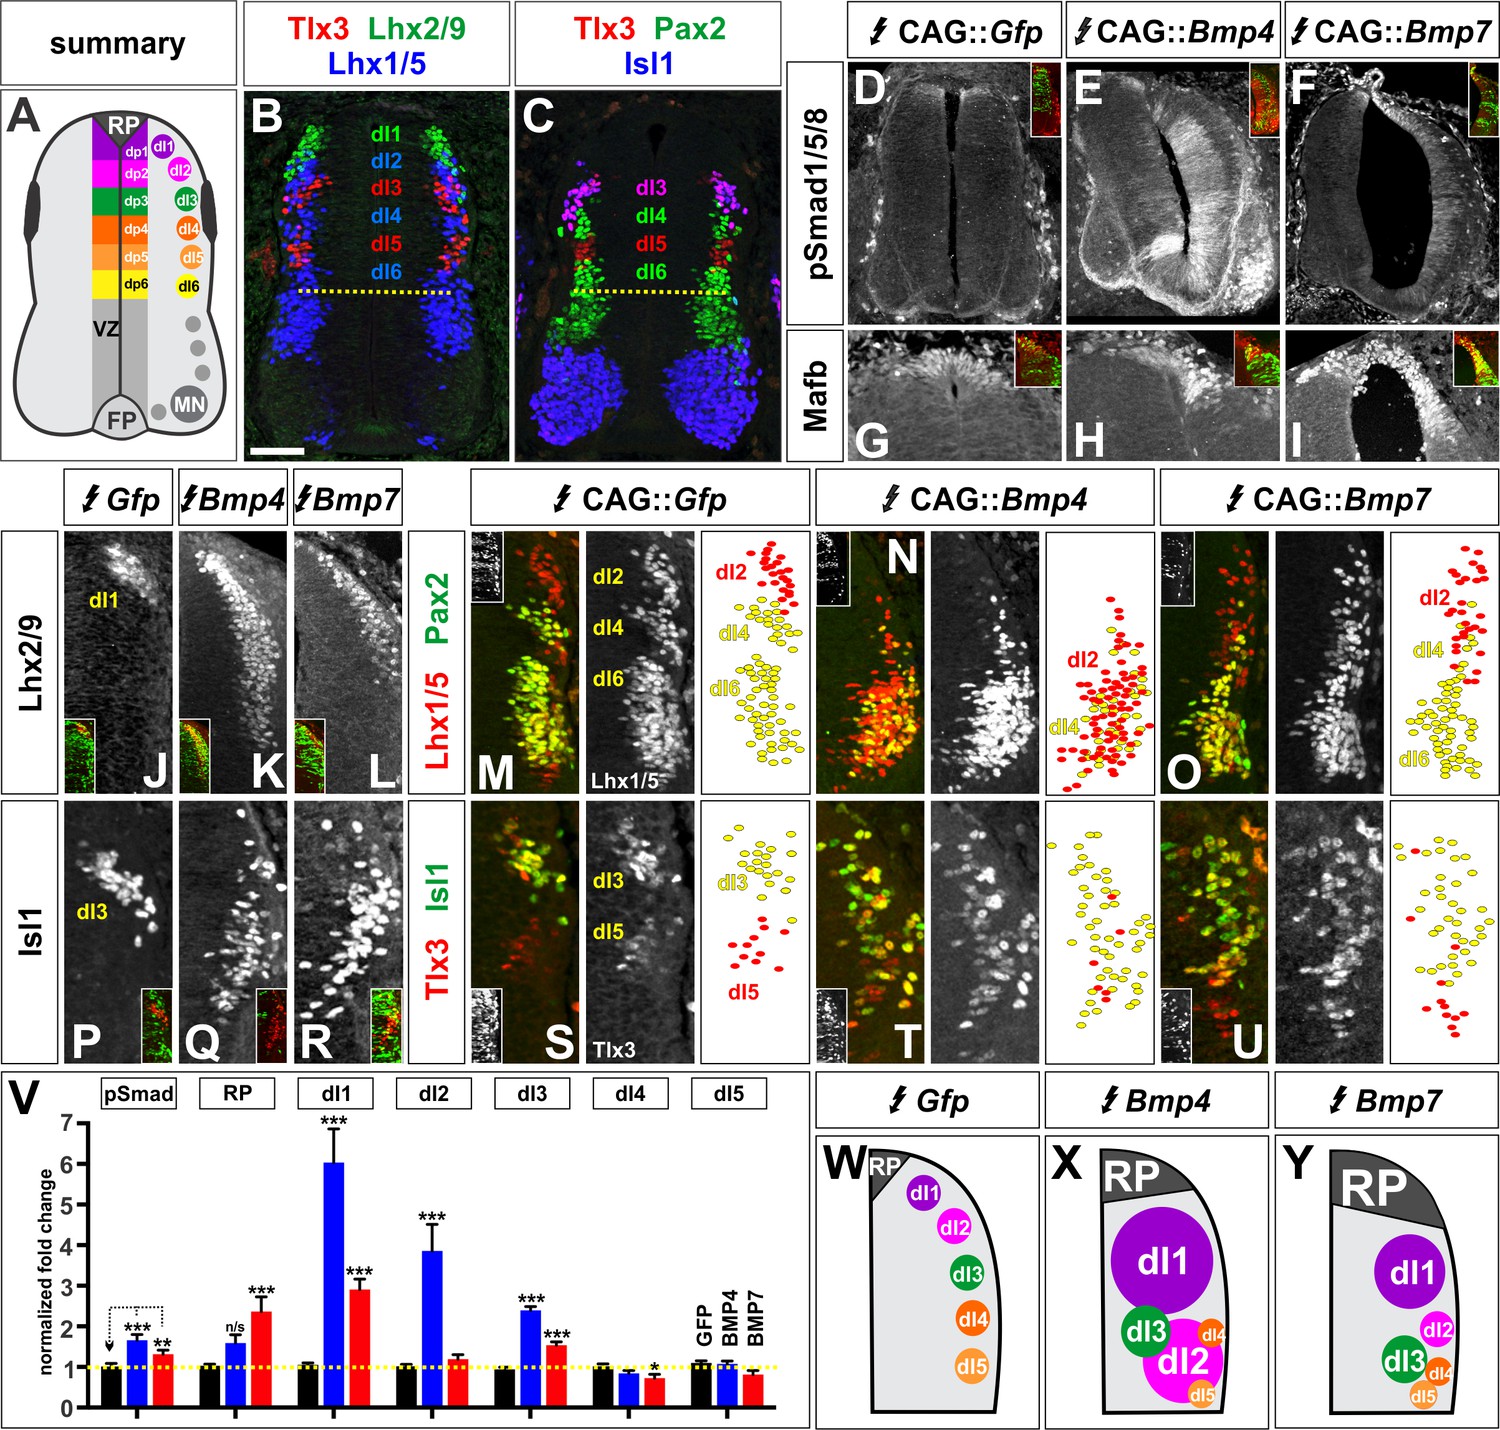
BMP4 and BMP7 direct distinct dorsal IN identities in vivo.
(A–C) Summary of dorsal progenitors (dP1-6) and post-mitotic neurons (dI1-6) in the developing spinal cord. The combinatorial use of antibodies against Lhx2/9 (green), Lhx1/5 (blue), Isl1 (blue), Pax2 (green) and Tlx3 (red) permit the unambiguous identification of dI1-dI5. (D–U) Chicken spinal cords were electroporated at HH stage 15 with Gfp (D, G, J, M, P, S), Bmp4 (E, H, K, N, Q, T) or Bmp7 (F, I, L, O, R, U), under control of the CAG enhancer (Miyazaki et al., 1989), and incubated until HH stage 25. Thoracic transverse sections were labeled with antibodies against Tlx3 (red, S–U), Lhx2/9 (red, J–L), Lhx1/5 (red,M–O), Isl1 (red P-R; green, S–U) or Pax2 (green M-O), pSmad1/5/8 (red, D–F) and Mafb (red, G–I). (D–F) Ectopic expression of Bmp4 (n = 52 sections from 5 embryos, p<0.0001) more effectively activates the R-Smads (Smad1/5/8) than Bmp7 (n = 30 sections 4 embryos, p<0.005), while the expression of Gfp has no effect (n = 37 sections from 4 embryos, p>0.72). (G–I) Mis-expression of Bmp4 or Bmp7 has dramatic, but distinct, effects on dorsal cell differentiation. Specifically, the ectopic expression of Bmp7 (I, n = 28 sections from 4 embryos, p<7.01×10⁻⁵) resulted in consistently more Mafb+ RP cells than Bmp4 (H, n = 37 sections from 5 embryos, p<0.12), and the Gfp control (G, n=36 sections from 2 embryos, p>0.67). (J–L, P–R) Mis-expression of Bmp4 however, most effectively directs cells towards the Lhx2/9+ dI1 (K, n = 28 sections from 3 embryos, p<0.0001) and Isl1+ dI3 fates (Q, 91 sections from 5 embryos, p<0.0001) compared to Bmp7 (dI1, L, n = 26 sections from 3 embryos, p<0.0001; dI3, R, n = 59 sections from 5 embryos, p<5.58×10⁻⁶). Mis-expression of Gfp has no effect (dI1, J, n = 46 sections from 3 embryos, p>0.47; dI3, P, n = 45 sections from 3 embryos, p>0.46). (P–R) Bmp4 (N, n = 47 sections from 3 embryos, p<0.0001) is the only BMP sufficient to direct cells toward an Lhx1/5+ dI2 identity, while Bmp7 can suppress Pax2+ dI4 fate (O, n = 24 sections from 3 embryos, p<0.01). The ectopic expression of Gfp has no effect (M, n = 35 sections from 3 embryos, p>0.77). Note that the presence of Bhlhlb5 (Skaggs et al., 2011), permitted the Pax2+ Lhx1/5- Bhlhb5- dI4s to be unambiguously distinguished from the Pax2- Lhx1/5+ Bhlhb5- dI2s and the Pax2+ Lhx1/5+ Bhlhb5+ dI6s (data not shown). (S–U) The mis-expression of the BMPs has no effect on the Tlx3+ dI5 fate (S, GFP: n = 38 sections from 3 embryos p>0.16; BMP4: T, n = 50 sections from 4 embryos, p>0.39; BMP7: U, n = 29 sections from 3 embryos, p>0.08) fates. (V) Quantification of the fold change in cell number normalized to Gfp control. The probability Bmp4 and Bmp7 misexpression result in the same distribution of cellular activities is p<0.0002 (Fisher test). (W–Y) Summary of the cellular changes directed by BMP4 and BMP7. We found that there are there are spatial organizational changes for Bmp4, but not Bmp7, misexpression. While the RP, dI1 and dI3 populations remain in the correct spatial order with respect to each other, the dI2s both expand and change location, such that they are intermingled with/ventral to the dI3 population. Probability of similarity between control and experimental groups, *=p<0.05, **p<0.005, ***p<0.0005. Student’s t-test or Mann-Whitney test. Scale bar: 65 µm.
-
Figure 2—source data 1
BMP4 and BMP7 direct distinct dorsal IN identities in vivo (experimental data).
- https://doi.org/10.7554/eLife.30647.009
Figure 2—figure supplement 1
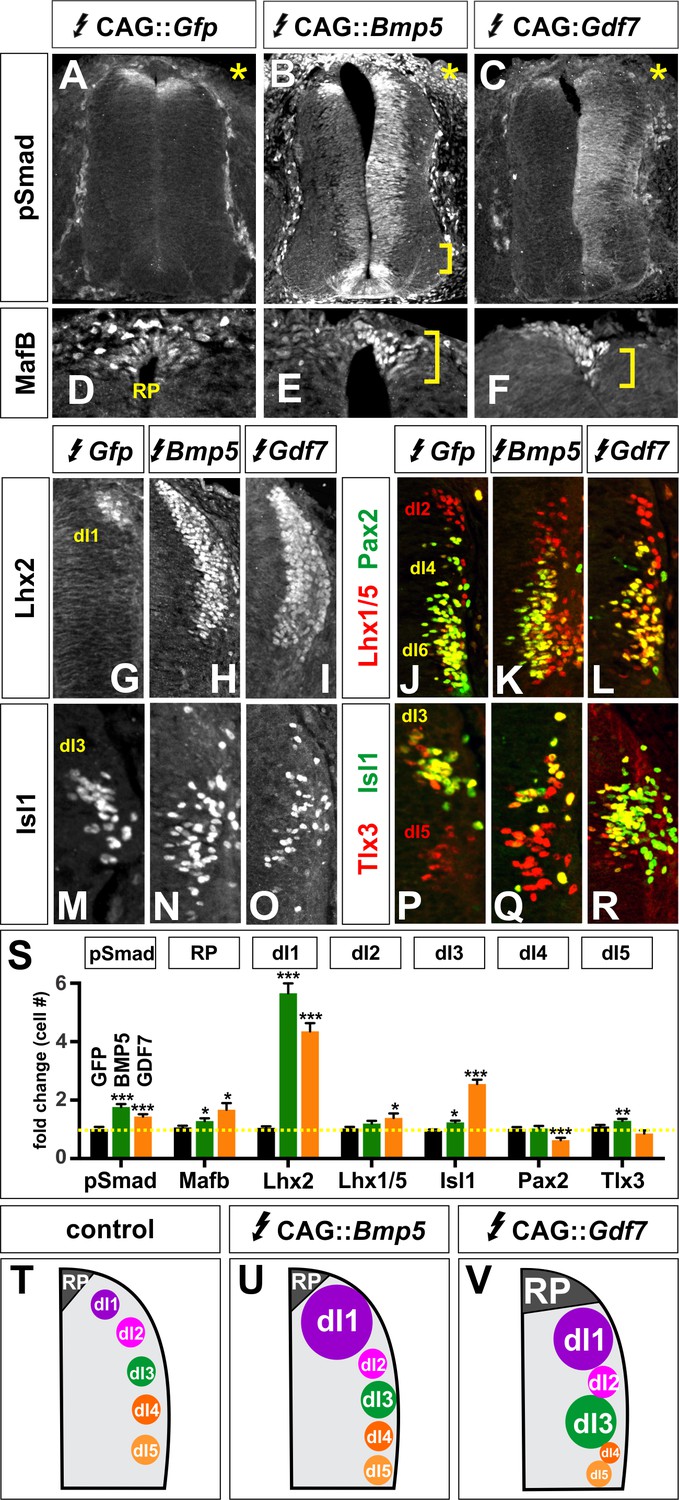
Other BMPs have unique activities specifying dorsal IN populations.
(A–R) Chicken spinal cords were electroporated with Gfp (A, D, G, J, M, P), Bmp5 (B, E, H, K, N, Q) or Gdf7 (F, I, L, O, R) at HH stage 15 and incubated until HH stage 25. Thoracic transverse sections were labeled with antibodies against Lhx2/9 (G–I), Isl1 (M–R), Lhx1/5 (red, J–L), Pax2 (green, J–L) and Tlx3 (red, P–R). (A–C) Misexpression of Bmp5 (n = 44 sections from 3 embryos) and Gdf7 (n = 34 sections from 3 embryos) increases pSmad1/5/8 activity up to 2-fold, whereas misexpression of Gfp has no effect. In all experiments the Gfp control had no effect on cellular identity (n as for Figure 2). (D–F) Misexpression of Bmp5 (n = 35 sections from 3 embryos) and Gdf7 (n = 30 sections from 4 embryos) modestly increases the numbers of Mafb+ RP cells. (G–I) Ectopic expression of both Bmp5 (n = 34 sections from 3 embryos) and Gdf7 increase the number of Lhx2/9+ dI1s (n = 40 sections from 5 embryos). (J–L) Gdf7 modestly increases the number of dI2s (n = 24 sections from 3 embryos) and decreases the number of dI4s (n = 23 sections from 4 embryos) while neither Bmp5 (Lhx1/5: n = 43 sections from 3 embryos; Pax2: n = 27 sections from 3 embryos). (M–O) Gdf7 (n = 48 sections from 4 embryos) is much more effective than Bmp5 (n = 54 sections from 3 embryos) at increasing the number of dI3s. (P–R) Bmp5 can modestly increase the number of dI5s (n = 54 sections from 3 embryos), while neither Gdf7 (n = 29 sections from 3 embryos). (S) Quantification of the fold change in cell number normalized to the Gfp control. (T–V) Models for the different activities of BMP5 and BMP6. Probability of similarity between control and experimental groups, *p<0.05, **p<0.005,***p<0.0005, Student’s t-test. Scale bar: 70 µm.
Figure 2—figure supplement 2
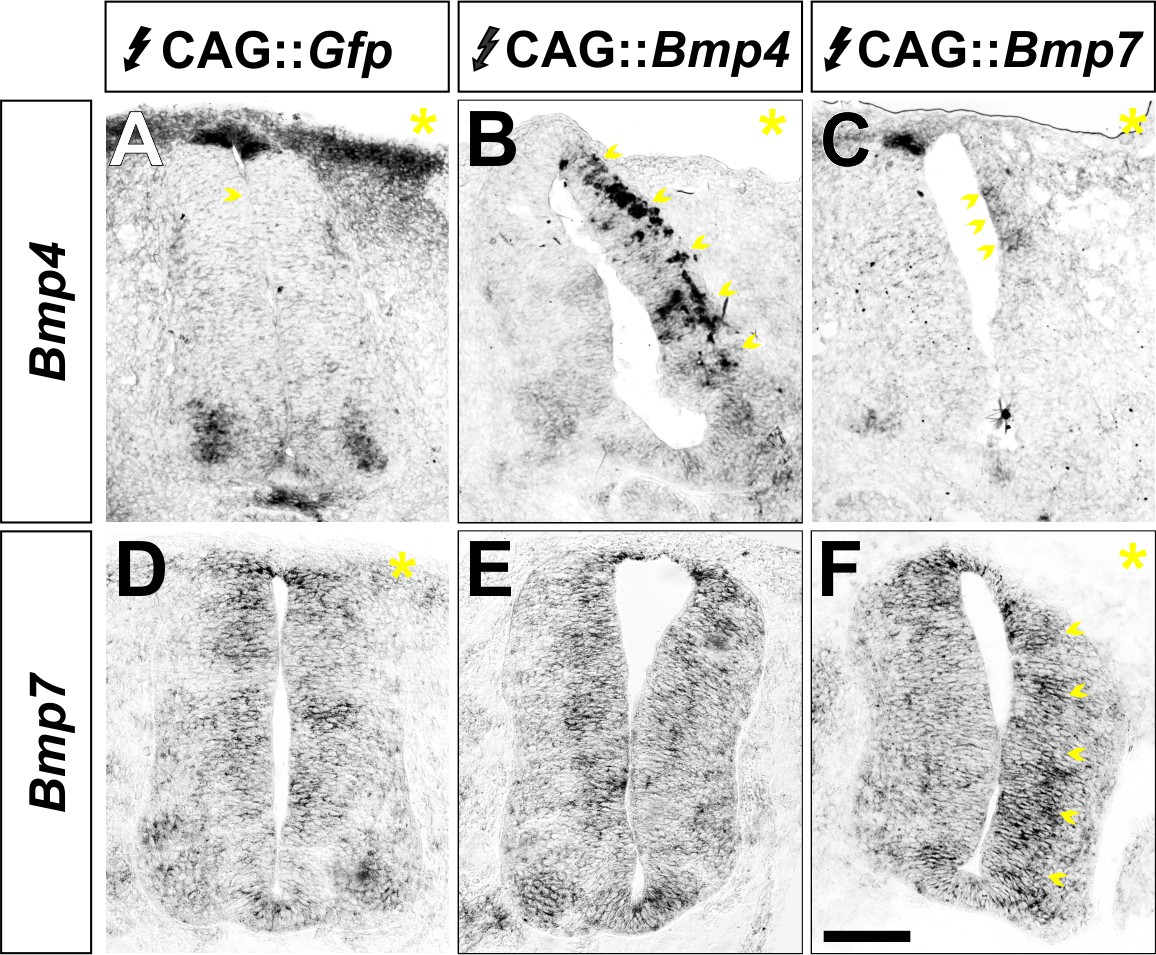
BMP misexpression alters the expression of the electroporated BMP.
(A–F) Chicken spinal cords were electroporated with CAG::Gfp (A, D), CAG::Bmp4 (B, E) or CAG::Bmp7 (C, F) at HH stage 15 and incubated until HH stage 25. Transverse sections were processed for in situ hybridization with probes for Bmp4 and Bmp7 expression. The yellow asterisk indicates the electroporated side. Increased Bmp4 expression was only observed on the embryos electroporated with CAG::Bmp4 (arrows, B). The levels of endogenous Bmp7 in the CAG::Bmp4 electroporated spinal cords are indistinguishable from control (E). Similarly, increased Bmp7 expression was only observed in embryos electroporated with CAG::Bmp7 (arrows, F). Endogenous Bmp4 expression is elongated and more diffuse in CAG::Bmp7 spinal cords (arrows, C), presumably as a result of the increase in RP cells.
Figure 2—figure supplement 3
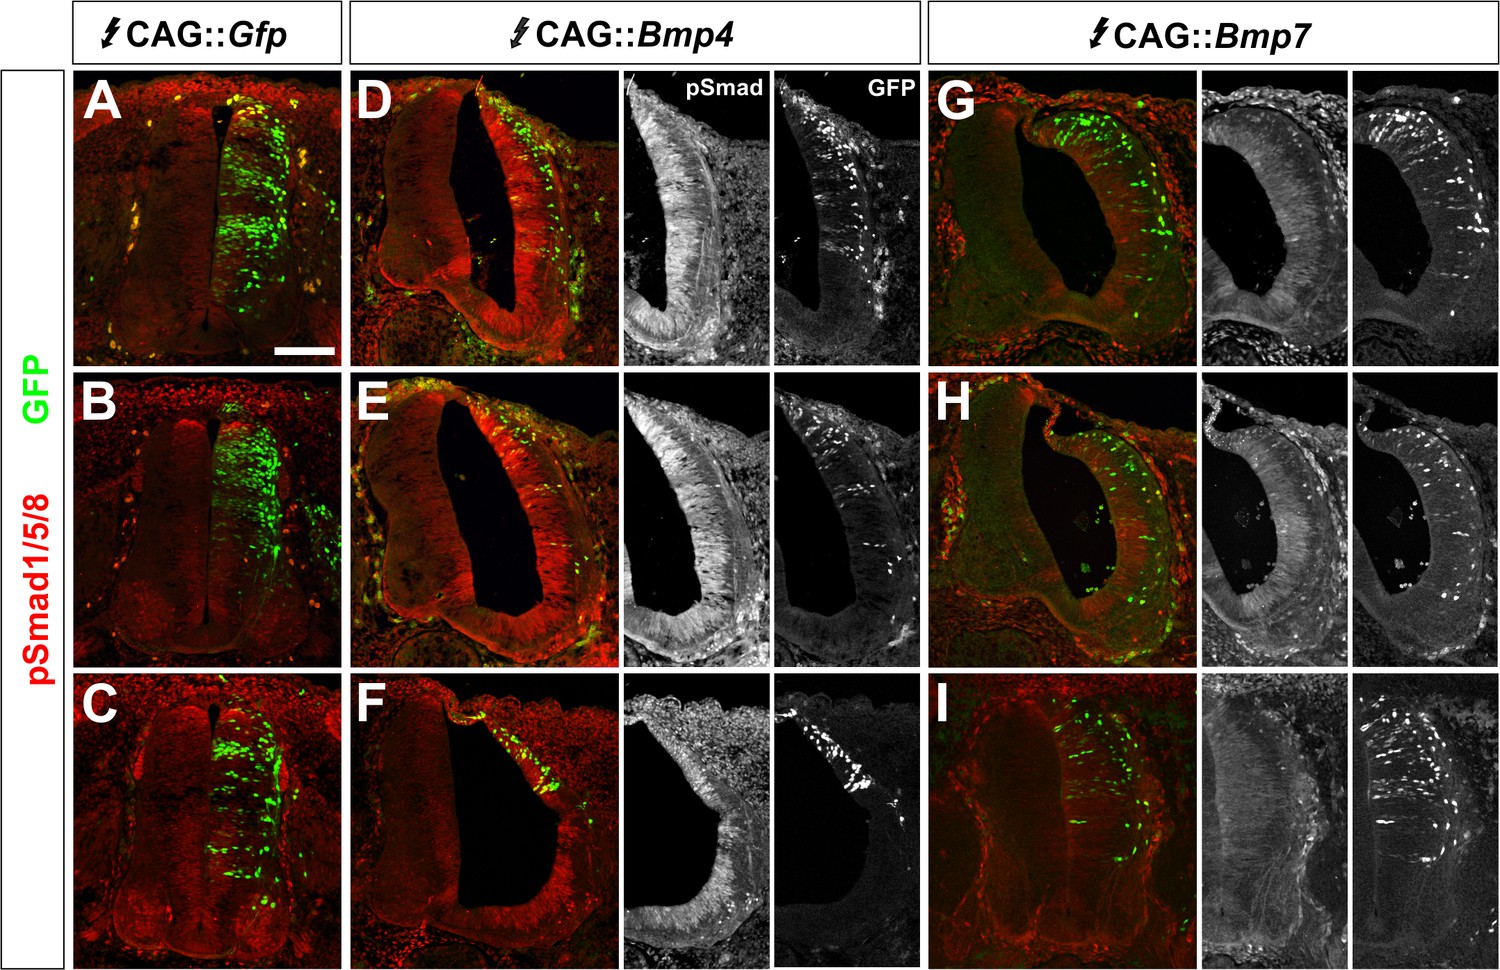
BMP misexpression results in consistent alterations in the levels of pSmad1/5/8.
(A–I) Chicken spinal cords were electroporated at HH stage 15 with high concentrations (>500 ng/μl) of CAG::Gfp (A, D, G), CAG::Bmp4 (B, E, H) or CAG::Bmp7 (C, F, I) and incubated until HH stage 25. Transverse sections of brachial spinal cord were labeled with an antibody against pSmad1/5/8 (red, A–I). The presence of GFP (green) indicates the extent and pattern of the electroporated cells. (A–C) Electroporation of CAG::Gfp had no effect on endogenous pSmad1/5/8 activity. (D–F) In contrast, the electroporation of CAG::Bmp4 dramatically increased the level of pSmad1/5/8 staining throughout the spinal cord. Localized electroporation (F) increased pSmad levels to a similar extent as observed for broader patterns of electroporation (D, E). (G–I) Similarly, different patterns of CAG::Bmp7 electroporation result in the same lower levels of increased Smad1/5/8 activity throughout the spinal cord.
Figure 2—figure supplement 4
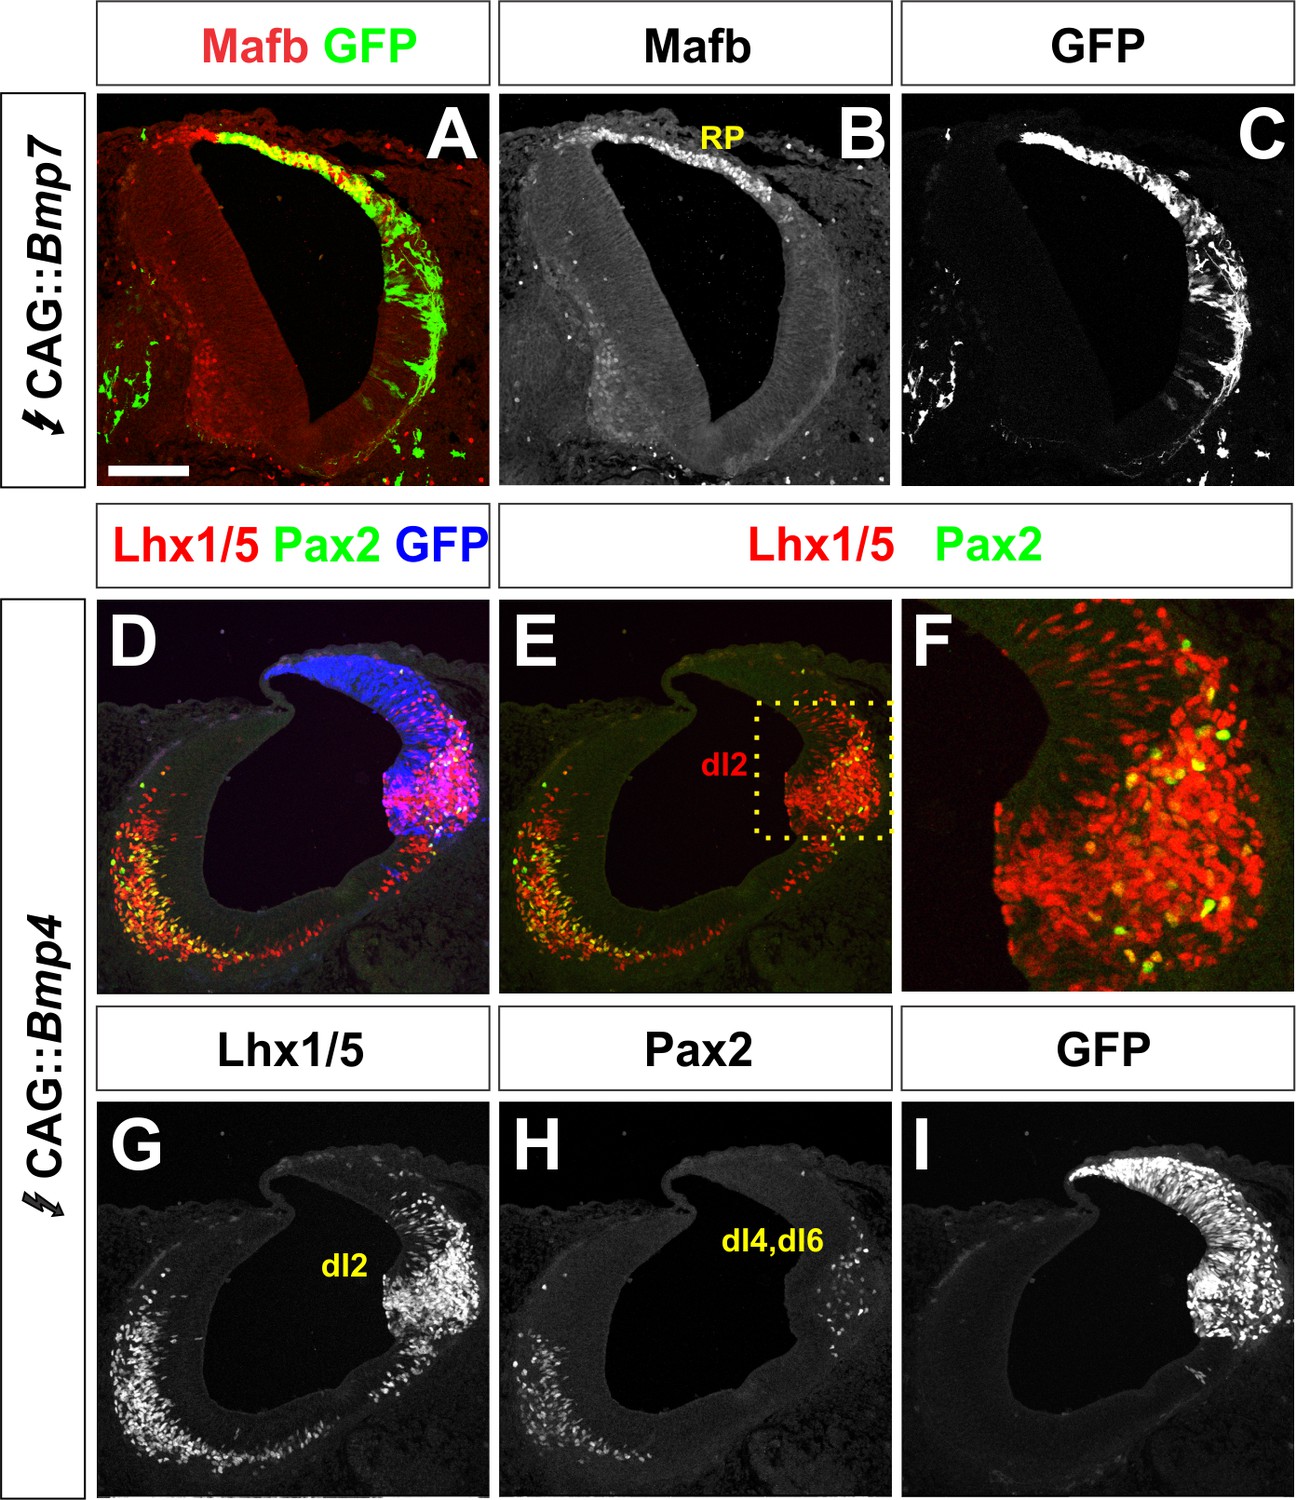
BMP misexpression can result in major morphological changes to the spinal cord.
(A–I) Chicken spinal cords were efficiently electroporated at HH stage 15 with high concentrations (>500 ng/μl) of CAG::Bmp4 (D–I) or CAG::Bmp7 (A–C) and incubated until HH stage 25. Thoracic transverse sections were labeled with antibodies against Mafb (red, A–B), Lhx1/5 (red, D–G) or Pax2 (green, D–F, H). Gfp expression demonstrates electroporation efficiency. (A–C) The ectopic expression of Bmp7 results in the expansion of the Mafb+ RP. In this example, the expansion is profound, resulting in a widening of the ventricle as well as an elongation and thinning of the electroporated side of the spinal cord. (D–I) The ectopic expression of Bmp4 results in different morphological changes. In some embryos, a tumor-like ball of Lhx1/5+ cells has formed in the ventral spinal cord. These dI2-like cells are positioned where the motor column would normally be located. Scale bar: 100 µm.
Figure 3 with 2 supplements

BMPs direct distinct dorsal IN identities in vitro.
(A) Summary of the mESC differentiation protocol. (B–F) RA treatment ±10 ng BMPs directs EBs towards a caudal (Hoxc8+), neural (Tuj1+) and dorsal (Tag1+) spinal identity. (G) Quantification of RT-qPCR expression data from 9 day EBs, normalized to RA control (n = 5 experiments). BMP6 (n = 5 independent experiments, p<0.0005) and GDF7 (n = 5 experiments, p<0.001) are sufficient to increase Msx1 (i.e. RP) expression, whereas BMP4 (n = 5 experiments, p<1.08×10⁻⁷) is most effective at directing Lhx2 (dI1) expression. All BMPs tested, including BMP5 (n = 3 experiments, p<0.0002) and BMP7 (n = 2 experiments, p<0.02) elevate Isl1 (dI3) expression. No BMP tested is sufficient to elevate Foxd3 (dI2) expression. In each independent experiment, all samples were run in triplicate. (H–K) Summary of cell fates changes in mESC experiments. Probability of similarity between control and experimental groups, *=p < 0.05, **p<0.005, ***p<0.0005, Student’s t-test. Scale bar: 65 µm.
-
Figure 3—source data 1
BMPs direct distinct dorsal IN identities in vitro (experimental data).
- https://doi.org/10.7554/eLife.30647.013
Figure 3—figure supplement 1
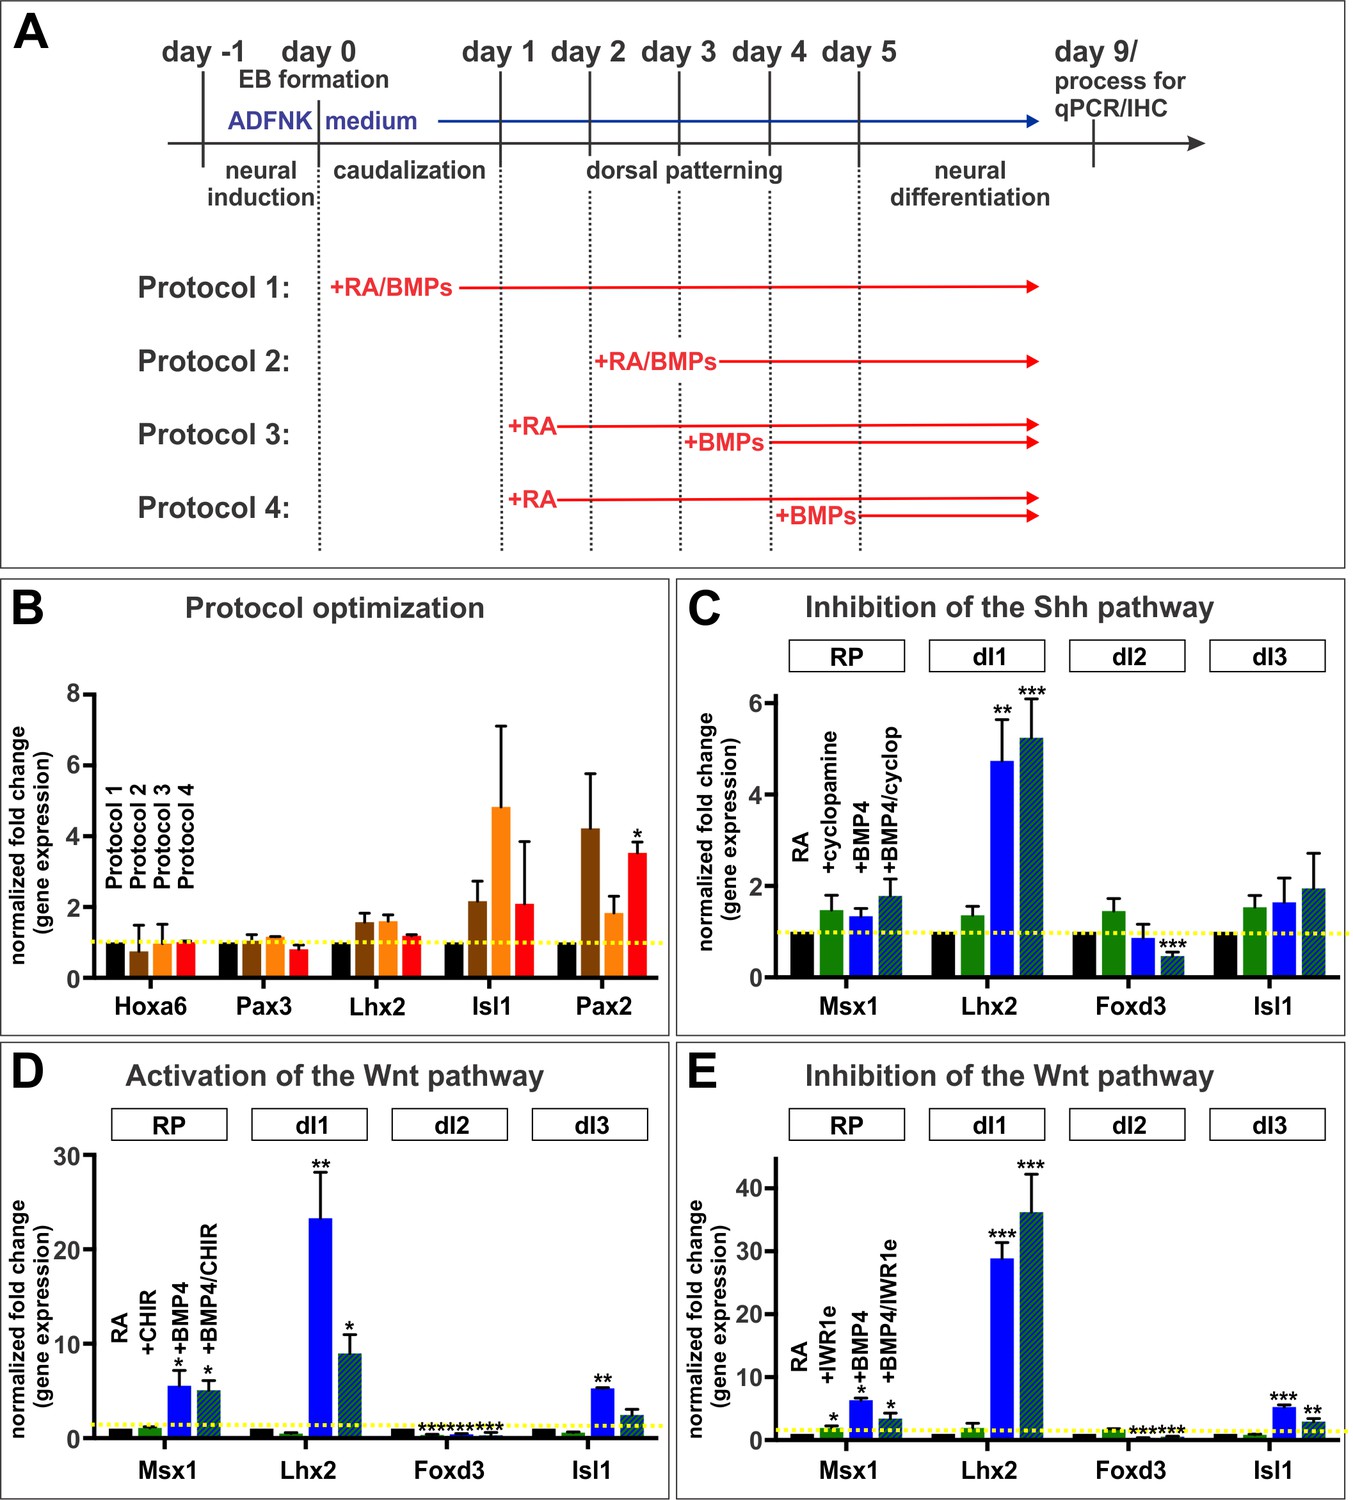
Strategies used to establish the mESC protocol.
(A, B) The timing of RA and BMP addition was evaluated to determine the efficiency by which each protocol directed mESCs towards caudal fates (Hoxa6), dorsal spinal progenitors (Pax3) and dorsal INs (Lhx2, Isl1 and Pax2). There were no major changes to spinal identity, dorsal patterning or dorsal IN differentiation regardless of protocol (n = 1 experiment, 2 samples/group/gene). (C) Cyclopamine, a Shh inhibitor, was added to cultures to block any putative ventralization. The addition of cyclopamine had no effect on dorsal identity (n = 4 independent experiments). (D, E) CHIR, a Wnt pathway agonist (n = 2 experiments), and IWR1e, a Wnt pathway antagonist (n = 2 experiments) were added to cultures. Neither manipulation of the Wnt signaling pathway had an effect on the identity of dorsal INs. Probability of similarity between control and experimental groups, *p<0.05, **p<0.005,***p<0.0005, Student’s t-test.
Figure 3—figure supplement 2
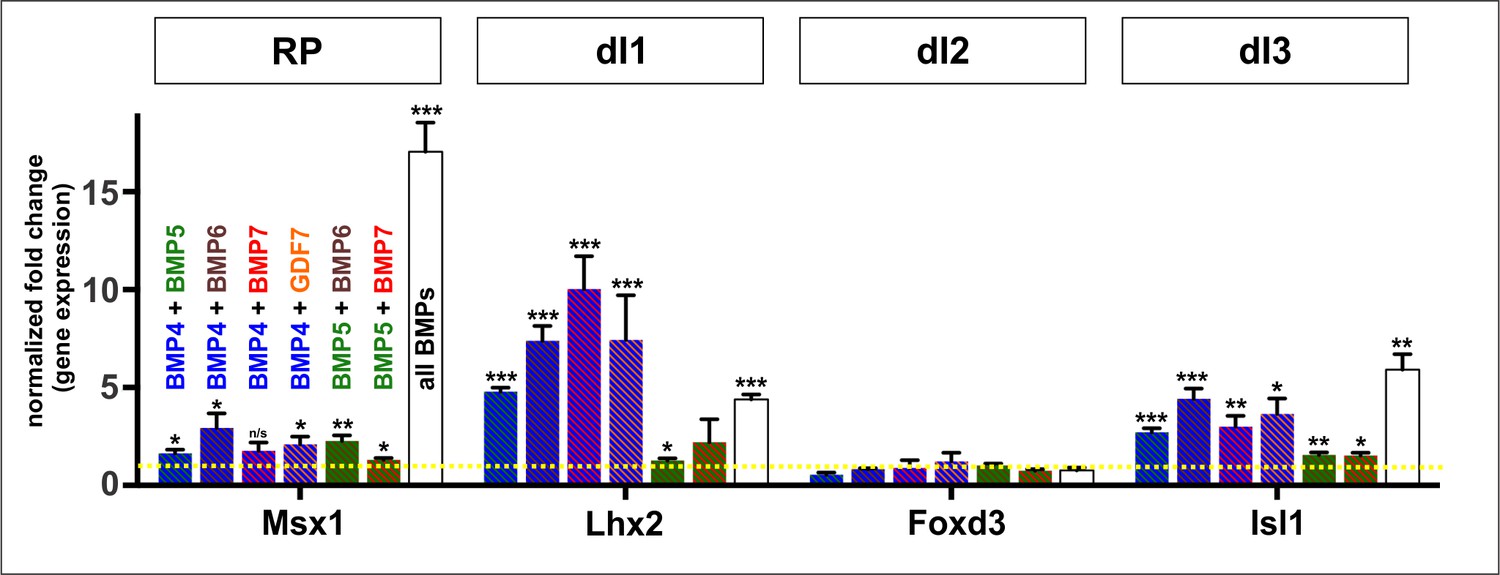
Effect of combinatorial addition of BMPs on dorsal IN differentiation in vitro.
Quantification of the fold change in gene expression normalized to the RA control. Different combinations of BMPs, at a final concentration of 10 ng, have varying abilities to direct mESCs towards the RP and dI1-3 cell types. A combination of BMP4, BMP5, BMP6, BMP7 and GDF7 (‘all BMPs’) were the most efficient at directing the RP and the dI3s (n = 2 independent experiments). Probability of similarity between control and experimental groups, *p<0.05, **p<0.005,***p<0.0005, Student’s t-test.
Figure 4 with 1 supplement
The BMPs do not act as morphogens either in vivo or in vitro.
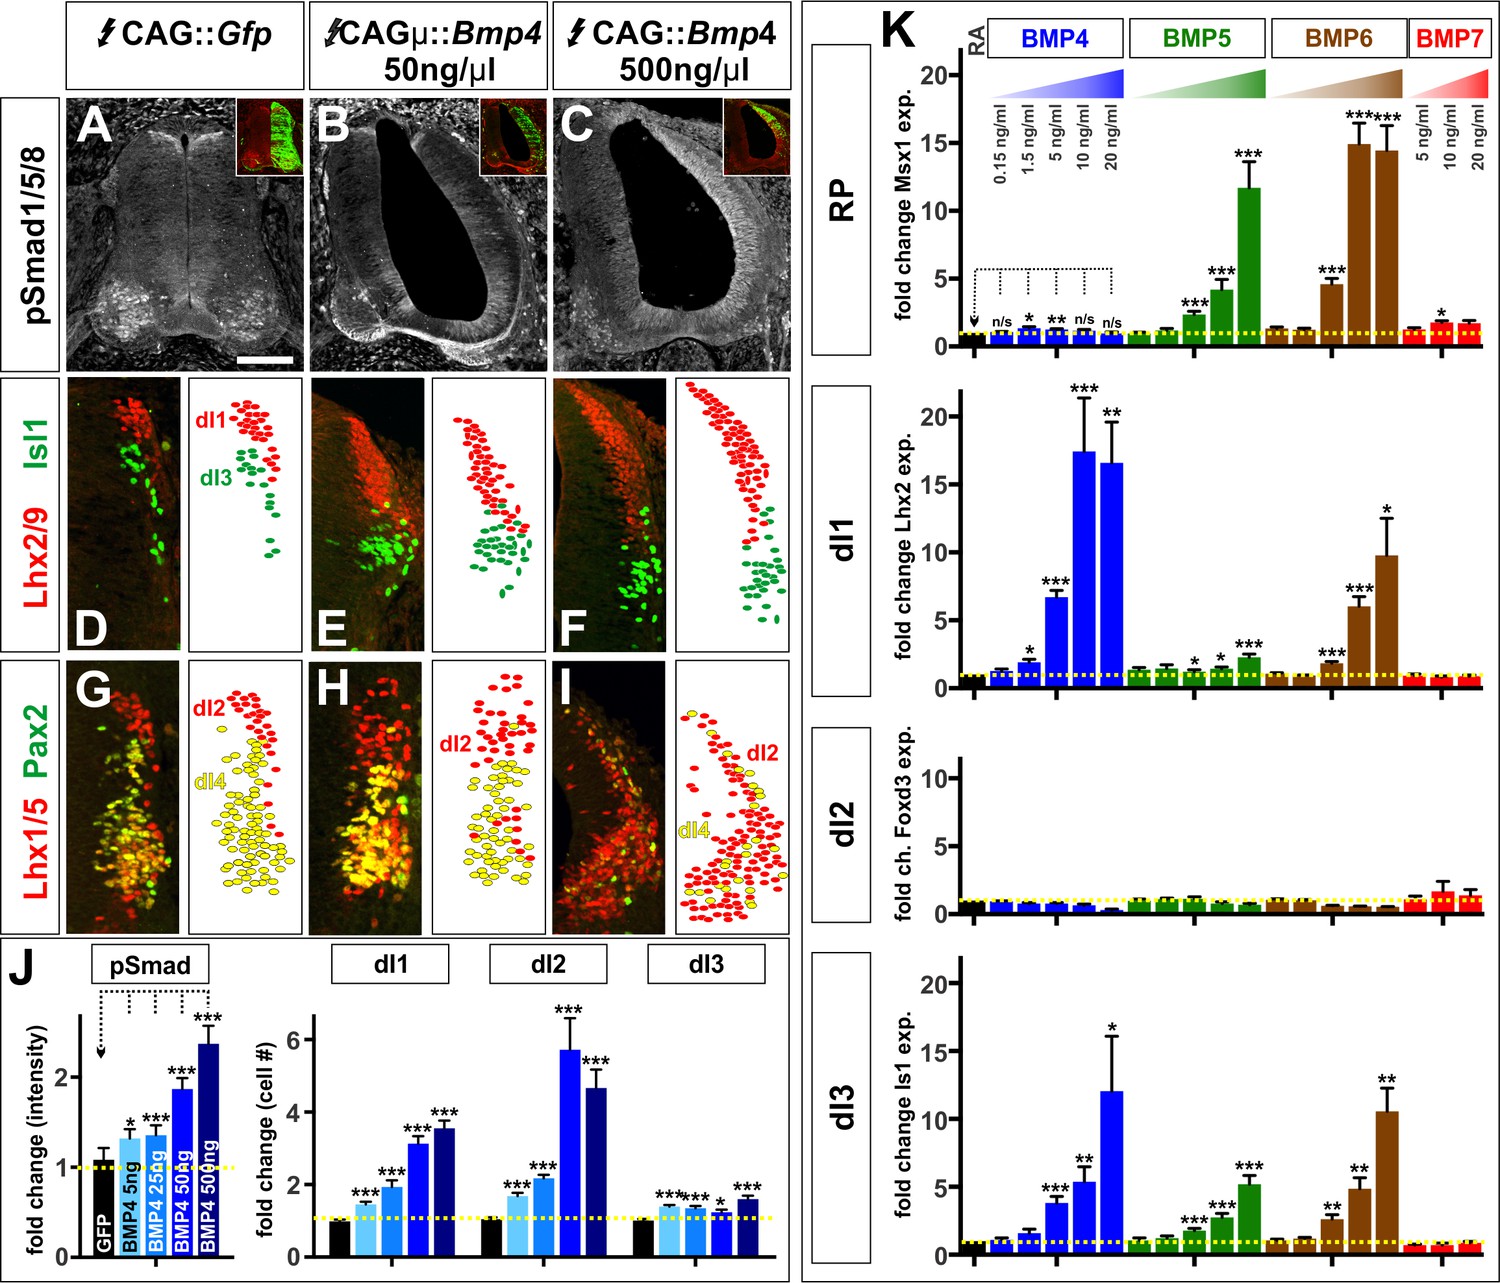
(A–I) Chicken spinal cords were electroporated at HH stage 15 with Gfp (A, D, G), [low] Bmp4 (B, E, H) or [high] Bmp4 (C, F, I) under the control of the CAG enhancer, and incubated until HH stage 25. Thoracic transverse sections were labeled with antibodies against pSmad1/5/8 (red, A–C), Lhx2/9 (red, D–F), Isl (green, D–F), Lhx1/5 (red, G–I) and Pax2 (green, G–I). (A–C, J) R-Smad activation increases over a range of ~20% to~130% as the level of Bmp4 misexpression increases. 5 ng/μl CAG::Bmp4, n = 27 sections from 3 embryos, p<0.008 similar to control; 25 ng/ul CAG::Bmp4, n = 14 sections from 2 embryos, p<4.4×10⁻⁵; 50 ng/ul CAG::Bmp4, n = 23 sections from 3 embryos, p<2.4×10⁻⁸; 500 ng/ul CAG::Bmp4, n = 19 sections from 3 embryos, p<3.6×10⁻⁷; Gfp control: n = 27 sections from 3 embryos, p>0.47. (D–I, J) The concentration of BMP4 determines the efficiency of dI1-3 specification in chicken embryos. Thus, high levels of Bmp4 expression direct more Lhx2/9+ dI1s (F, n = 28 sections from 3 embryos, p<1.8×10⁻¹⁶), Lhx1/5+ dI2s (I, n = 22 sections from 3 embryos, p<7.6×10⁻¹¹) and Isl1+ dI3s (F, n = 28 sections from 3 embryos, p<6.3×10⁻⁷) compared to lower concentrations of Bmp4 expression (E, Lhx2/9: n = 29 sections from 3 embryos, p<7.6×10⁻¹⁴; Isl1: n = 29 sections from 3 embryos, p<0.006; H, Lhx1/5: n = 26 sections from 3 embryos, p<5.1×10⁻⁷). Expression of Gfp had no effect (Lhx2/9: D, n = 28 sections from 3 embryos, p>0.88; Isl1: D, n = 29 sections from 3 embryos, p>0.89; Lhx1/5: G, n = 29 sections from 3 embryos, p>0.28). (K) Similarly, increasing the concentration of a given BMP improves its ability to direct mESCs towards a specific dorsal fate, as measured by increased gene expression. BMP4: n = 4 independent experiments; BMP5: n = 3 experiments; BMP6: n = 2 experiments; BMP7: n = 2 experiments. Samples were run in triplicate within each experiment. Probability of similarity between control and experimental groups, *p<0.05, **p<0.005, ***p<0.0005, Student’s t-test or Mann Whitney test. Scale bar: 80 µm.
-
Figure 4—source data 1
The BMPs do not act as morphogens either in vivo or in vitro (experimental data).
- https://doi.org/10.7554/eLife.30647.016
Figure 4—figure supplement 1
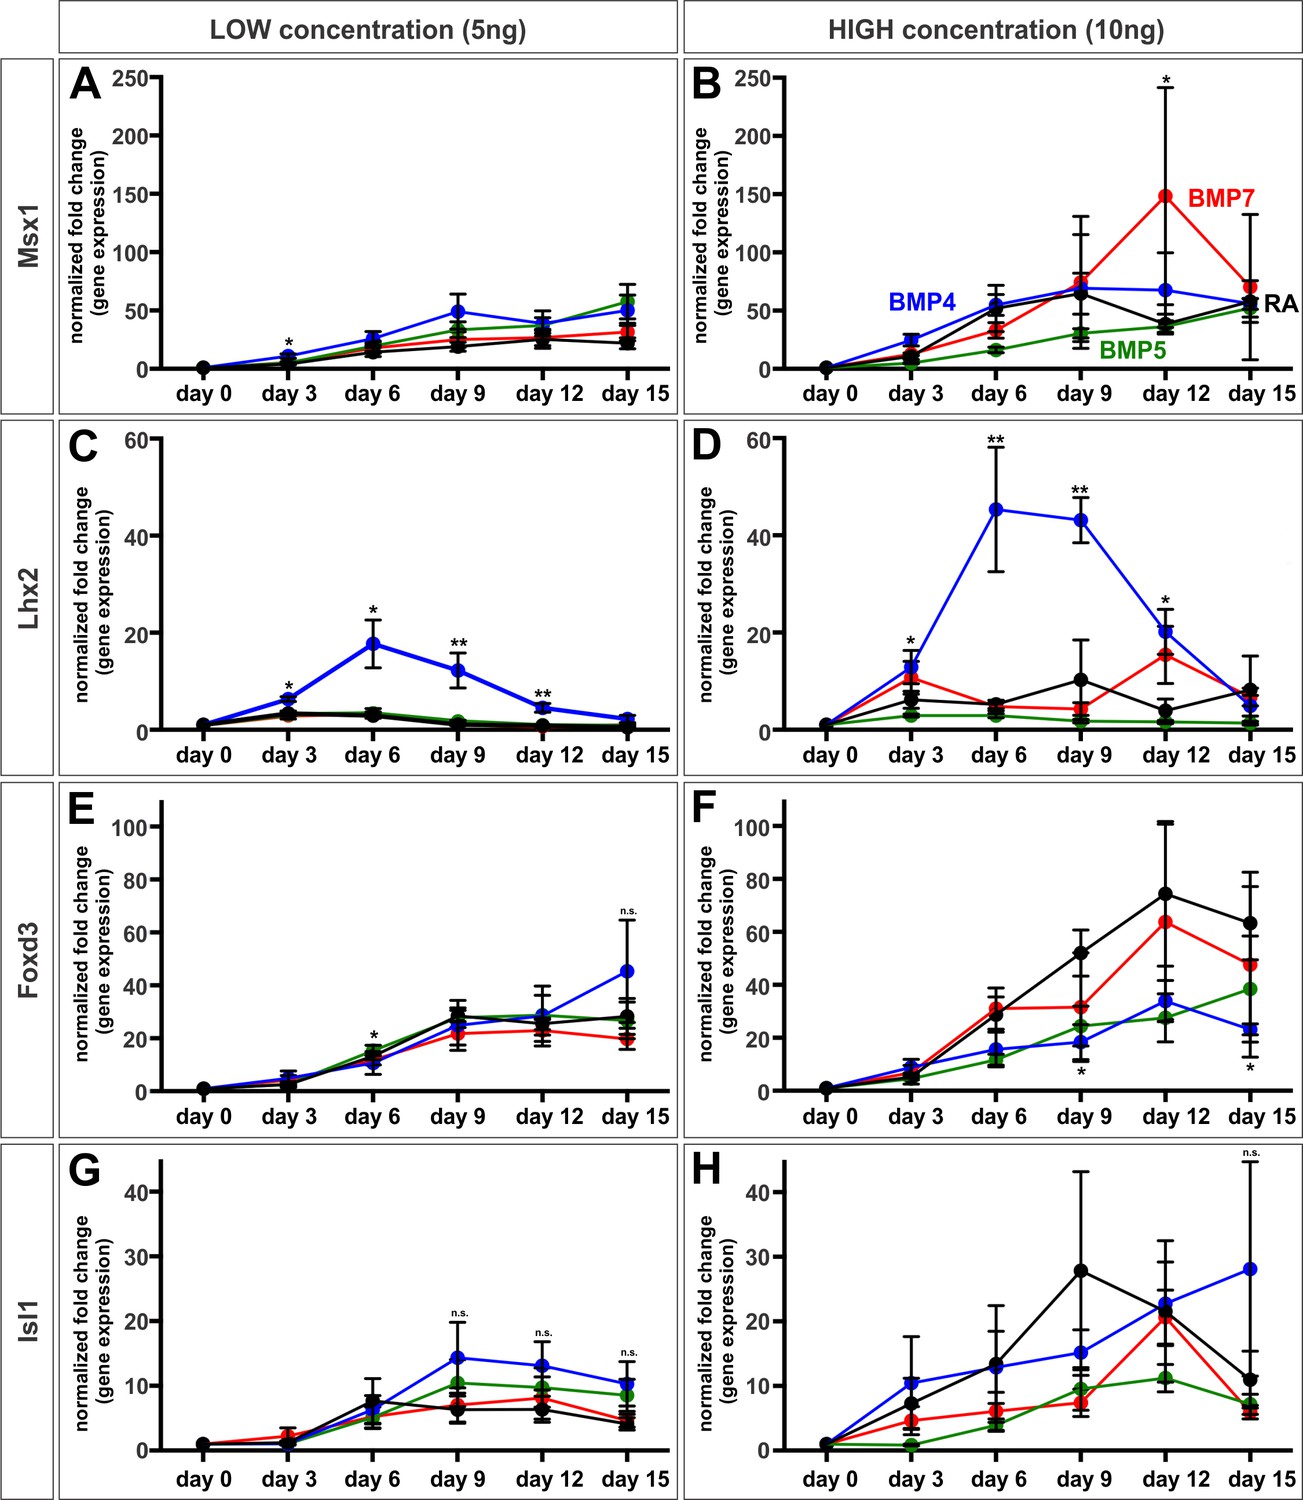
Temporal effect of the BMPs on dorsal IN identity in vitro.
(A–H) Mouse ESCs were treated with BMPs and collected every 3 days to determine how the profile of transcription factor expression changes in response to different concentrations of BMPs over time. In all cases, neither changing the duration of exposure to BMP recombinant proteins, or altering the BMP concentration changes dorsal cell identity as predicted by morphogen models (n = 2 independent experiments/BMP). Probability of similarity between control and experimental groups, *p<0.05, **p<0.005, Student’s t-test.
Figure 5
BMP4 and BMP7 can drive distinct dorsal progenitor identities in vivo.
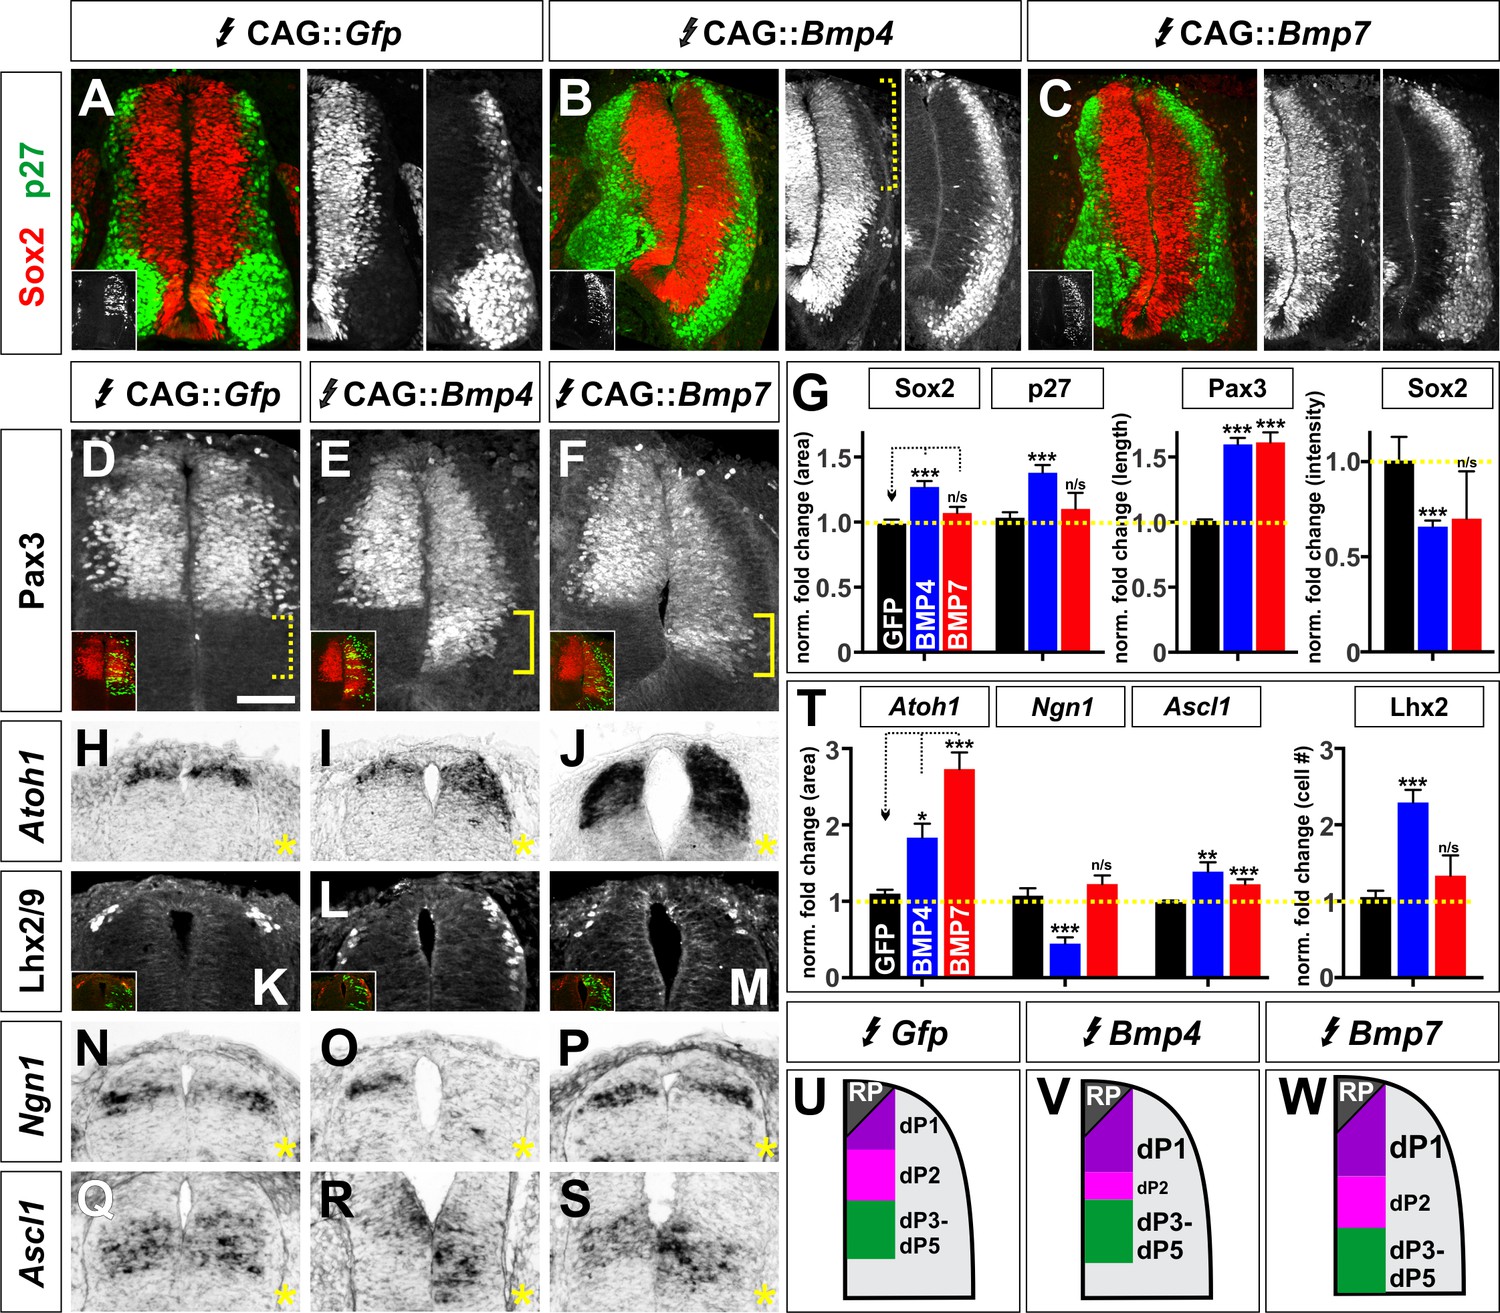
(A–S) Chicken spinal cords were electroporated at HH stage 15 with Gfp (A, D, H, K, N, Q), Bmp4 (B, E, I, L, O, R) or Bmp7 (C, F, J, M, P, S) under the control of the CAG enhancer, and incubated until HH stage 25 (A–F) or 20 (J–S). Thoracic transverse sections were labeled with antibodies against Sox2 (red, A–C), p27 (green, A–C) or Lhx2/9 (K–M) or processed for in situ hybridization (H–J, N–S). Note that Bmp misexpression affects progenitor identity on both sides of the spinal cord, thus it is critical to compare the experimental manipulations to the GFP electroporation control. (A–C, G) The ratio of progenitors to neurons was not affected by the misexpression of Gfp (n = 40 sections from 3 embryos), Bmp4 (n = 47 sections from 4 embryo) or Bmp7 (n = 27 sections from 3 embryos), although the spinal cord was generally elongated in Bmp4 electroporated embryos (A–C, G). Bmp4 misexpression also significantly diminished Sox2 intensity by >30% in the dorsal spinal cord (bracket, B, p<9.22×10⁻¹³). (D–G) Misexpression of Bmp4 (n = 50 sections from 5 embryos, p<5.2×10⁻¹⁹) and Bmp7 (n = 29 sections from 3 embryos, p<9.6×10⁻¹⁷) significantly increases the size of the Pax3+ domain compared to Gfp control (n = 44 sections from 3 embryos, p>0.95). (H–J) The misexpression of Bmp4 (n = 54 sections from 4 embryos, p<0.006) and Bmp7 (n = 25 sections from 3 embryos, p<3.0×10⁻¹⁴) results in a 2–3 fold increase in the area of the Atoh1+ +1 domain compared to Gfp control (n = 42 sections from 6 embryos, p>0.16). (K–M) 24 hr post-electroporation, Bmp4 expression (n = 25 sections from 3 embryos, p<2.35×10⁻¹⁰) increases the number of Lhx2/9+ dI1s while the expression of Gfp (n = 34 sections from 3 embryos, p>0.6) or Bmp7 (n = 25 sections from 3 embryos, p>0.74) has no significant effect. (N–P) Bmp4 (n = 44 sections from 3 embryos, p<0.0001) decreases the size of the Ngn1+ dp2 domain while neither Gfp (n = 176 sections from 8 embryos, p>0.23) or Bmp7 (n = 41 sections from 3 embryos, p>0.62) expression has a significant effect. (Q–S) The misexpression of both Bmp4 (n = 48 sections from 3 embryos, p<0.003) and Bmp7 (n = 45 sections from 3 embryos, p<4.2×10⁻⁵) significantly increase the Ascl1+ dP3-5 populations compared to Gfp control (n = 124 sections from 8 embryos, p>0.73). (T) Quantification of the fold change in progenitor domain area or cell number normalized to the GFP control. (U–W) Summary of changes to progenitor identity directed by BMP4 or BMP7. Probability of similarity between control and experimental groups, *p<0.05, **p<0.005, ***p<0.0005, Student’s t-test or Mann-Whitney test. Scale bar: 50 µm.
-
Figure 5—source data 1
BMP4 and BMP7 can drive distinct dorsal progenitor identities in vivo (experimental data).
- https://doi.org/10.7554/eLife.30647.018
Figure 6 with 1 supplement

The BMPs can differentially regulate the cell cycle in vivo.
(A–L) Chicken spinal cords were electroporated at HH stage 15 with Gfp (A, D, G, J), Bmp4 (B, E, H, K) or Bmp7 (C, F, I, L) under the control of the CAG enhancer and incubated until HH stage 20. Thoracic transverse sections were labeled with antibodies against pHistoneH3 (red, J–L) and Sox2 (blue, J–L). In situ hybridization was performed in combination with BrdU labeling (white/red, A–I). (A–I) Bmp7 (Atoh1: n = 25 sections from 5 embryos, p<0.005; Ngn1: n = 41 sections from 5 embryos, p<0.001; Ascl1: n = 45 from 5 embryos, p>0.13) misexpression decreases the number of S-phase BrdU+ cells per 100 um2 in the dP1-dP2 domains while neither Gfp (Atoh1: n = 42 sections from 6 embryos, p>0.96; Ngn1: n = 176 sections from 8 embryos, p>0.54; Ascl1: n = 124 sections from 8 embryos, p>0.73) or Bmp4 expression (Atoh1: n = 54 sections from 4 embryos, p>0.16; Ngn1: n = 44 sections from 3 embryos, p>0.28; Ascl1: n = 48 sections from 3 embryos, p>0.25) has no effect. (J–L) Both Bmp4 (n = 47 sections from 3 embryos, p<2.2×10⁻⁹) and Bmp7 misexpression (n = 77 sections from 3 embryos, p<0.0001) can increase the number of pHistoneH3+ M-phase cells compared to Gfp control (n = 60 sections from 3 embryos, p>0.81). (O) The combined effect of the BMPs on the cell cycle may permit BMP7 to most effectively promote progenitor patterning while BMP4 most effectively directs neural differentiation. Probability of similarity between control and experimental groups, *p<0.05, **p<0.005, ***p<0.0005 Student’s t-test or Mann-Whitney test. Scale bar: 70 µm.
-
Figure 6—source data 1
The BMPs can differentially regulate the cell cycle in vivo (experimental data).
- https://doi.org/10.7554/eLife.30647.021
Figure 6—figure supplement 1
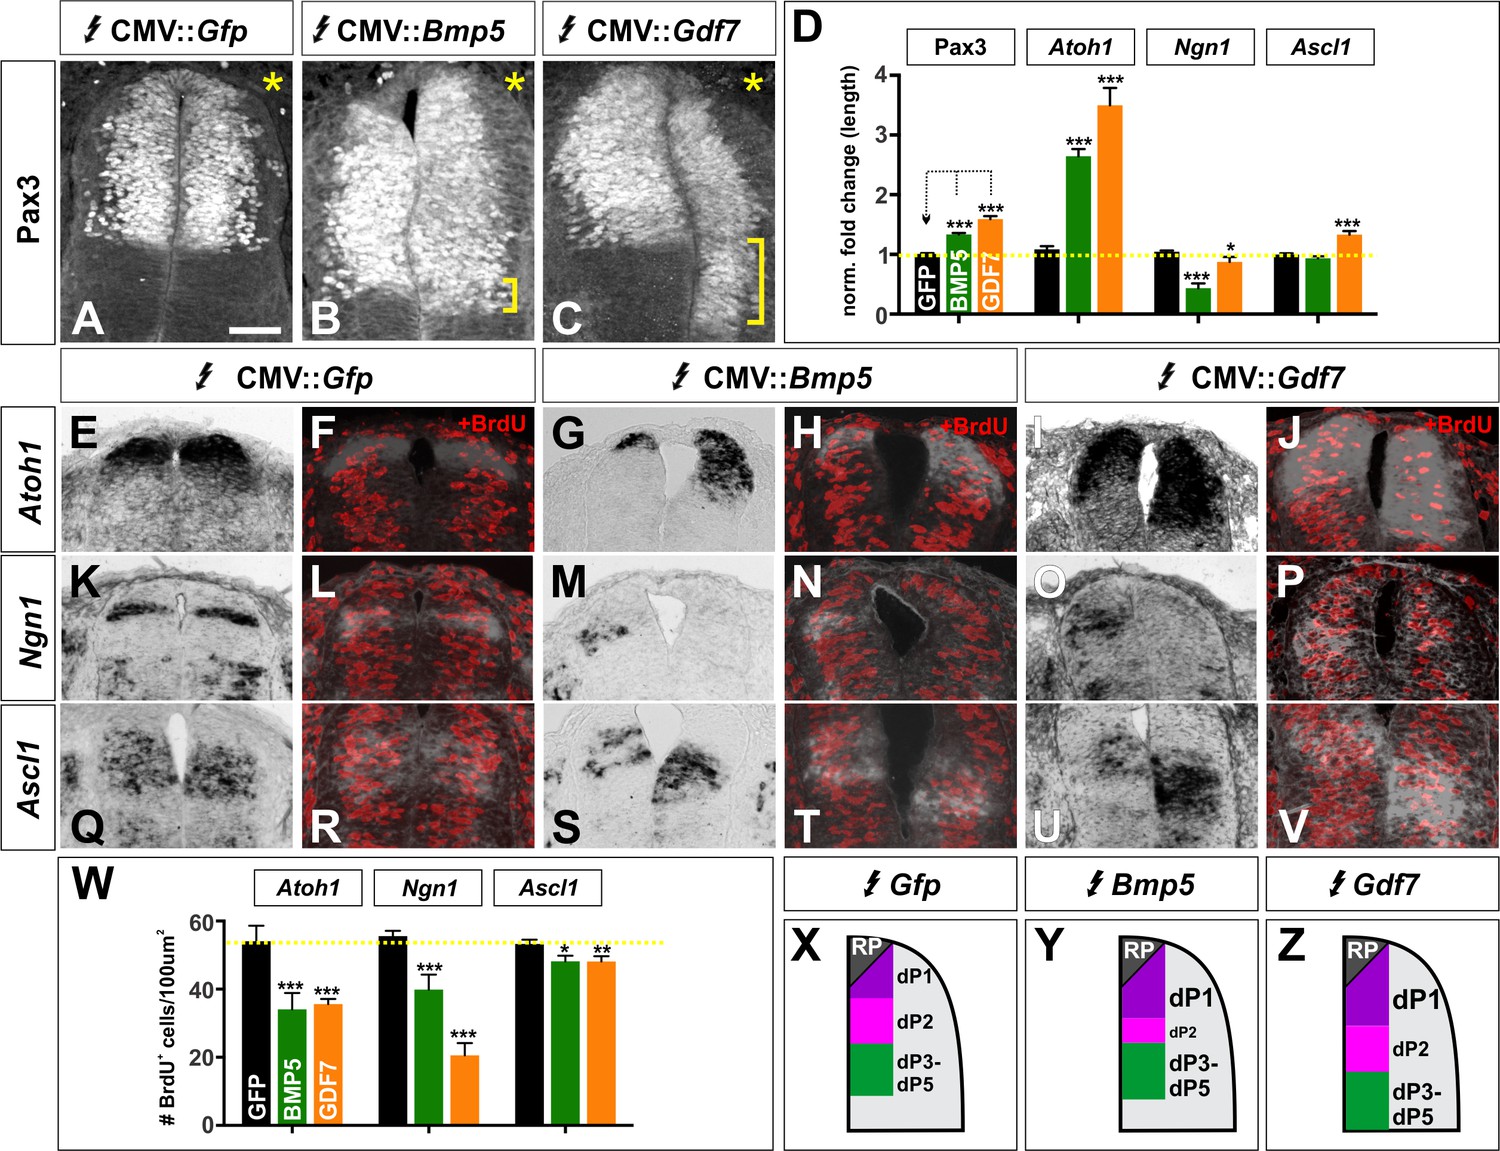
BMP5 and GDF7 have unique effects on cell cycle in vivo.
. (A–V) Chicken spinal cords were electroporated with Gfp (A, E, F, K, L, Q, R), Bmp5 (B, G, H, M, N, S, T) or Gdf7 (C, I, J, O, P, U, V) at HH stage 15 and incubated until HH stage 25. Thoracic transverse sections were labeled with antibodies against Pax3 (A–C) and BrdU (F, H, J, L, N, P, R, T, V) and processed for in situ hybridization using riboprobes against Atoh1 (E–J), Ngn1 (K–P), Ascl1 (Q–V). (A–C) Expression of both Bmp5 (n = 36 sections from 3 embryos) and Gdf7 (n = 32 sections from 4 embryos), but not Gfp can increase the Pax3+ dorsal progenitor domain. In all experiments the Gfp control had no effect (n as for Figure 5 for progenitor domain size and Figure 6 for BrdU quantification). (D) Quantification of the fold change in length normalized to the Gfp control. (E–J) Bmp5 (n = 100 sections from 6 embryos) and Gdf7 (n = 41 sections from 4 embryos) expression both significantly increase the length of the Atoh1 domain and decrease the number of BrdU+ S-phase cells in this domain, while expression of Gfp has no effect. (K–P) Both Bmp5 (n = 51 sections from 6 embryos) and Gdf7 (n = 46 sections from 4 embryos) decrease the length of the Ngn1 domain and the number of BrdU+ cells in this domain. The expression of Gfp has no effect. (Q–V) Gdf7 (n = 59 sections from 4 embryos) modestly increases the size of the Ascl1 domain, while neither Bmp5 (n = 65 sections from 6 embryos) or Gfp has an effect. Both BMP5 and GDF7 decrease the number of BrdU+ cells in the Ascl1 domain. (W) Quantification of the number of BrdU+ cells in each proneural gene domain. (X–Z) Summary models for the patterning activity of BMP5 and GDF7. Probability of similarity between control and experimental groups, *p<0.05, **p<0.005,. ***p<0.0005, Student’s t-test. Scale bar: 40 µm.
Figure 7
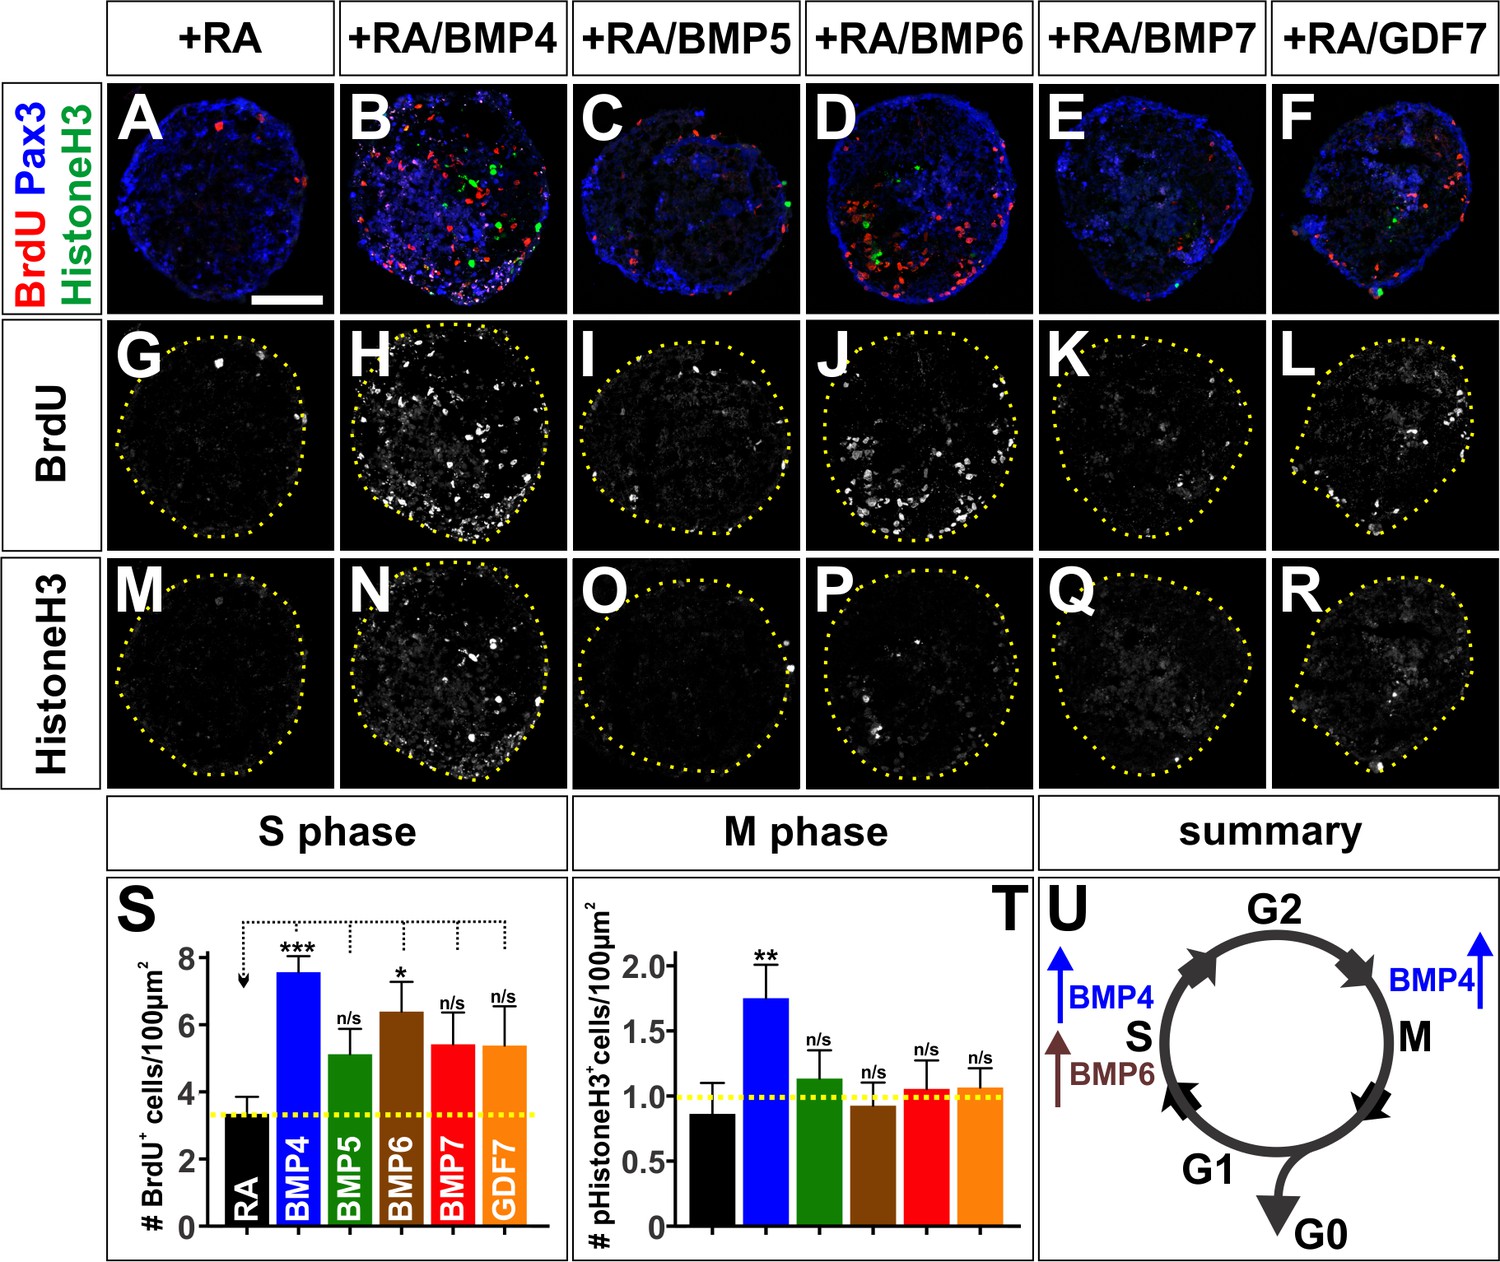
The BMPs differentially regulate the cell cycle in vitro.
(A–R) Treatment of mEBs with RA ±10 ng BMPs directs them all towards Pax3+ dorsal spinal fates. However, different BMPs have distinct effects promoting different phases of the cell cycle. BMP5 (C, n = 32 sections 3 independent experiments; I: BrdU, p>0.26; O: pHistoneH3, p>0.24), BMP7 (E, n = 27 sections 3 independent experiments; K: BrdU, p>0.09, Q: pHistoneH3, p>0.85), and GDF7 (F, n = 40 sections 3 independent experiments; L: Brdu, p>0.22, R: pHistoneH3, p>0.24) had no effect either S phase or M phase, compared to RA control (A, G, M, n = 21 sections 3 independent experiments). In contrast, BMP4 both increased the number of S-phase cells (B, n = 50 sections 3 independent experiments; H: BrdU, p<1.15×10⁻⁶) and the number of M-phase cells (B, N: pHistoneH3, p<0.04), while BMP6 only increased the number of S-phase cells (D, n = 32 sections 3 independent experiments; J: BrdU, p<0.01) with no effect on the number of cells in mitosis (D, R: pHistoneH3, p<0.83). (S–T) Quantification of the number of BrdU +(S) and pHistoneH3+ (T) cells per 100 um2. BMP treatment had no effect on EB size (data not shown). (U) Summary of the effects of BMP6 and BMP7 on cell cycle in vitro. BMP4 simultaneously increases the number of cells in S-phase and M-phase, consistent with prolonging cell cycle length. In contrast, BMP6 specifically increases the number of cells in S-phase with no effect on M-phase, possibly promoting proliferation. Probability of similarity between control and experimental groups, *=p < 0.05, **p<0.005, ***p<0.0005, Student’s t-test or Mann-Whitney test. Scale bar: 80 µm.
-
Figure 7—source data 1
The BMPs differentially regulate the cell cycle in vitro (experimental data).
- https://doi.org/10.7554/eLife.30647.023
Figure 8

BMP4 and BMP7 mediate their diverse activities through different type I Bmp receptors both in vivo and in vitro.
(A–C) BmprIa is expressed in spinal progenitors during neurogenesis. (D–F) At later stages, BmprIb is also expressed by both progenitors and post-mitotic neurons. (G–L) Chicken spinal cords were ubiquitously electroporated with Gfp (G, J), dnBmprIa (H, K) or dnBmprIb (I, L) at HH stage 15 and incubated until HH stage 25. Thoracic transverse sections were labeled with antibodies against Lhx2/9 (red, G–I), Isl1 (green, G–I), Lhx1/5 (red, J–L) and Pax2 (green, J–L). (G–M) The misexpression of dominant negative (dn) BmprIb decreases the Lhx2/9+ dI1 (I, n = 81 sections from 4 embryos, p<1.73×10⁻²⁴), Lhx1/5+ dI2 (L, n = 58 sections from 4 embryos, p<2.3×10⁻¹⁰) and Isl1+ dI3 (I, n = 59 sections from 4 embryos, p<0.0003) populations compared to Gfp control (G, Lhx2/9: n = 45 sections from 5 embryos, p>0.23; J, Lhx1/5: n = 44 sections from 5 embryos, p>0.73; G, Isl1: n = 46 sections from 5 embryos, p>0.55). In contrast, the presence of dnBmprIa decreases the number of dI1s (H, n = 55 sections from 3 embryos, p<1.75×10⁻¹³) and dI3s (H, n = 35 sections from 3 embryos, p<2.37×10⁻⁵), but not the dI2s (K, n = 53 sections from 3 embryos, p>0.07). (N) Increasing the levels of Bmp4 expression is sufficient to rescue the dnBmprIa, but not dnBmprIb, phenotype (BMP4: n = 40 sections from 3 embryos; BMP4 low + dnIa: n = 51 sections from 3 embryos, p<3.93×10⁻²⁸; BMP4 high + dnIa: n = 32 sections from 5 embryos, p>0.88; BMP4 low + dnIb: n = 43 sections from 3 embryos, p<7.17×10⁻²⁹; BMP4 high + dnIb: n = 42 sections from 6 embryos, p<8.44×10⁻⁹), while high levels of Bmp7 are most effective at rescuing the dnBmprIb, rather than dnBmprIa, phenotype (BMP7: n = 42 sections from 3 embryos; BMP7 low + dnIa: n = 57 sections from 3 embryos, p<0.008; BMP7 high + dnIa: n = 31 sections from 4 embryos, p<0.0004; BMP7 low + dnIb: n = 58 sections from 3 embryos, p<0.0001; BMP7 high + dnIb: n = 23 sections from 4 embryos, p>0.98). (O–P) Low concentrations of either dorsomorphin (DM) or LDN-193189 (LDN) are sufficient to block the activity of BMP6 in vitro, consistent with the model that BMP6 acts through BmprIa. In contrast, much higher concentrations of either DM or LDN are required to block BMP4-directed differentiation, suggesting BMP4 acts through BmprIb (n = 4 independent experiments). (Q–T) Models for the specification of the RP, dI1s, dI2s and dI3s. Probability of similarity between control and experimental groups, *=p<0.05, **p<0.005, ***p<0.0005 Student’s t-test or Mann-Whitney test. Scale bar: 65 µm.
-
Figure 8—source data 1
BMP4 and BMP7 mediate their diverse activities through different type I Bmp receptors both in vivo and in vitro (experimental data).
- https://doi.org/10.7554/eLife.30647.025
Additional files
-
Supplementary file 1
Antibody information
- https://doi.org/10.7554/eLife.30647.026
-
Supplementary file 2
Chicken primer sequences for in situ hybridization experiments
- https://doi.org/10.7554/eLife.30647.027
-
Supplementary file 3
Mouse primer sequences for in situ hybridization experiments
- https://doi.org/10.7554/eLife.30647.028
-
Supplementary file 4
Mouse primer sequences for qRT-PCR
- https://doi.org/10.7554/eLife.30647.029
-
Supplementary file 5
BMP concentrations used in these studies
- https://doi.org/10.7554/eLife.30647.030
-
Transparent reporting form
- https://doi.org/10.7554/eLife.30647.031
Download links
A two-part list of links to download the article, or parts of the article, in various formats.
Downloads (link to download the article as PDF)
Open citations (links to open the citations from this article in various online reference manager services)
Cite this article (links to download the citations from this article in formats compatible with various reference manager tools)
BMPs direct sensory interneuron identity in the developing spinal cord using signal-specific not morphogenic activities
eLife 6:e30647.
https://doi.org/10.7554/eLife.30647


