Wilms Tumor 1b defines a wound-specific sheath cell subpopulation associated with notochord repair
- MRC Institute of Genetics and Molecular Medicine, University of Edinburgh, United Kingdom
- Hubrecht Institute - KNAW & UMC Utrecht, Netherlands
- Institute for Cardiovascular Organogenesis and Regeneration, WWU Münster, Germany
- CiM Cluster of Excellence, Germany
- Loyola University Chicago, United States
- National Institute of Genetics, Japan
- Leibniz Institute for Age Research-Fritz Lipmann Institute, Germany
- Friedrich-Schiller-University, Germany
Figures
Figure 1 with 2 supplements
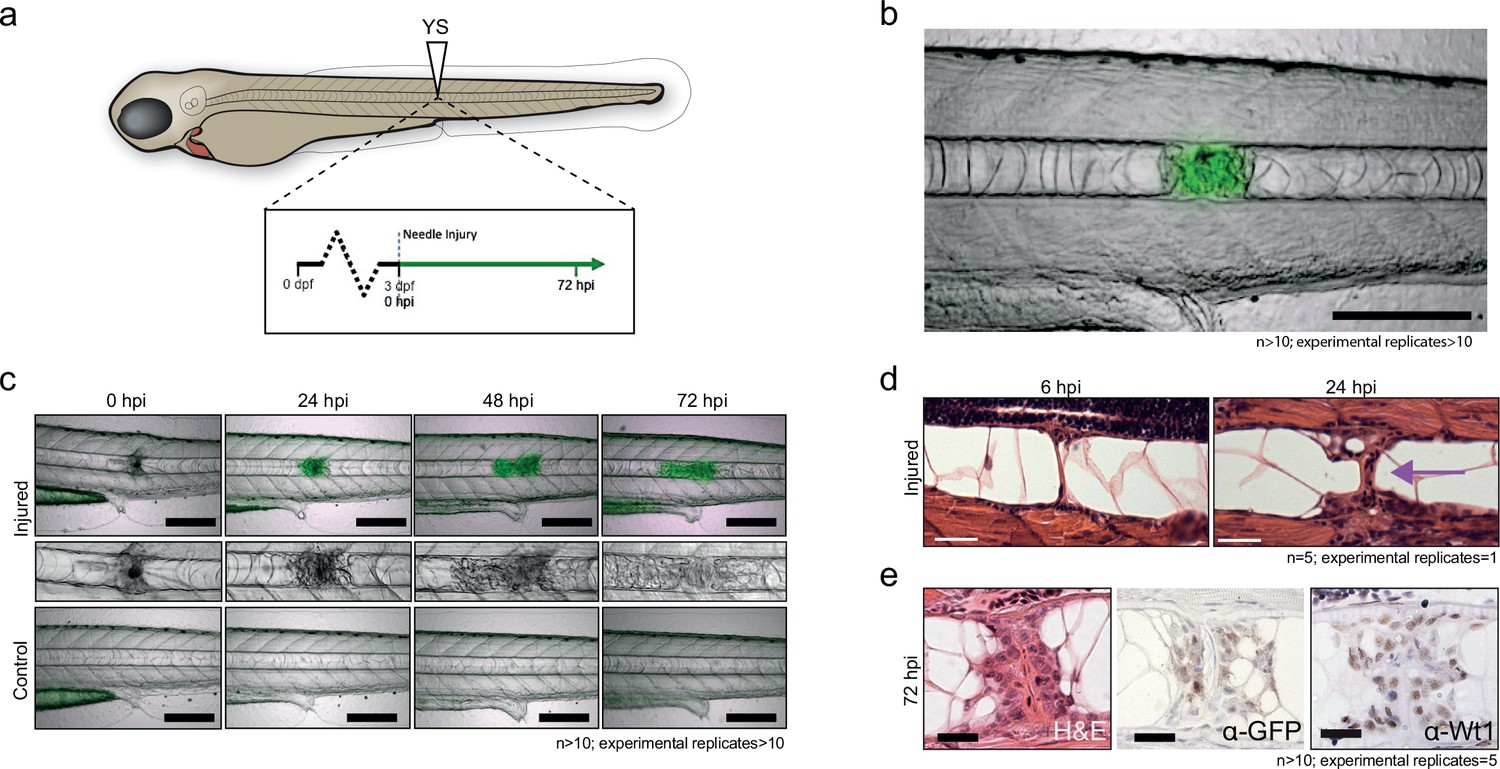
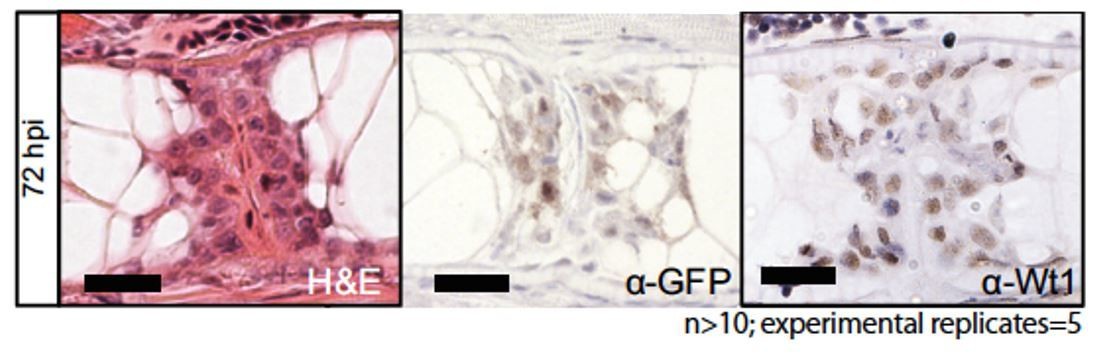
Notochord injury triggers local and sustained wt1b expression.
(a) Schematic of notochord needle-injury protocol. 3 dpf Tg(wt1b:gfp); casper larvae are injured above the yolk sac (YS; at somite 14 or 15) and followed for 72 hr. (b, c) Images of Tg(wt1b:gfp); casper zebrafish trunk over time following notochord needle injury, and uninjured matched controls. GFP signal is associated with a change of cellularity in the injured notochord (inset). n > 10; experimental replicates >10. Scale bar: 100 µm. (d) H and E staining of the injured area at 6 hpi and 24 hpi highlighted the progressive change in cellularity at the site of the injury (arrow). n = 5; experimental replicates = 1. Scale bar: 20 µm. (e) Immunohistochemistry of the injured area with α-GFP and α-Wt1 antibodies. n > 10; experimental replicates = 5. Scale bar: 20 µm. dpf = days post fertilization; hpi = hours post injury; H and E = haematoxylin and eosin.
Figure 1—figure supplement 1
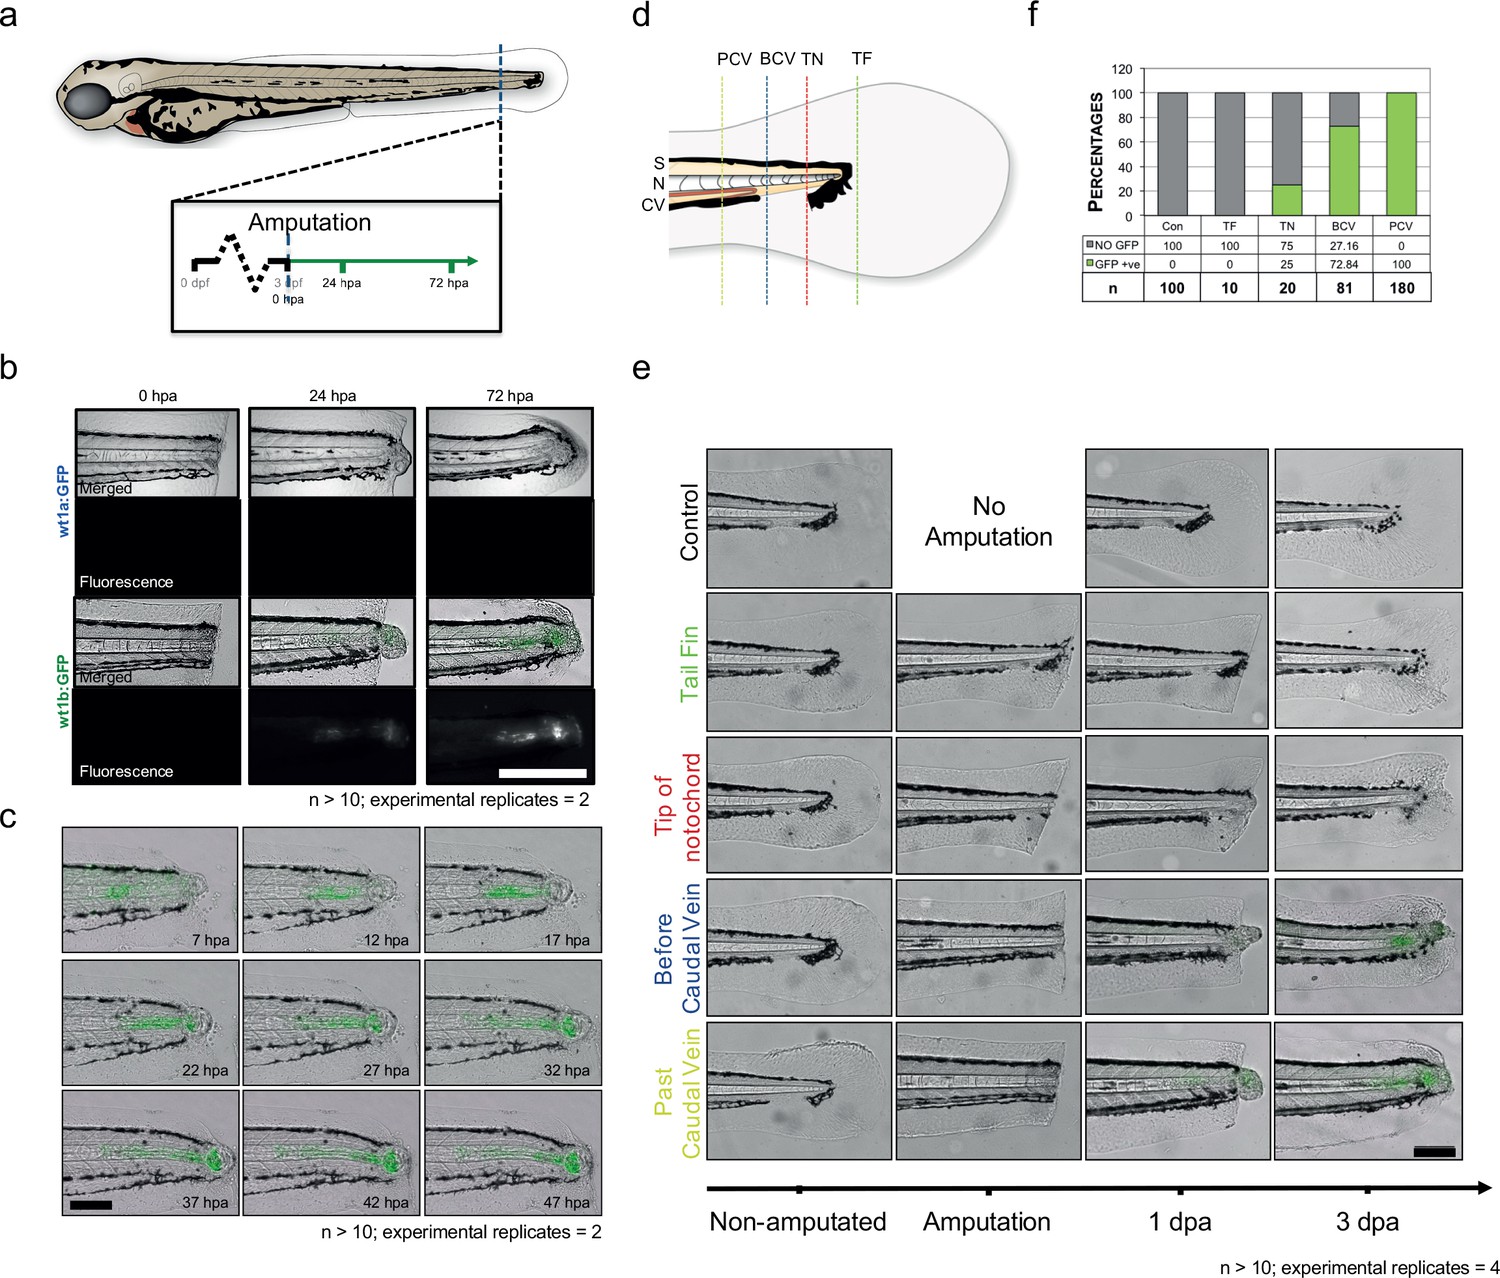
wt1b expression in tail amputated larvae.
(a) 3 dpf Tg(wt1a:gfp) and Tg(wt1b:gfp) larvae were tail amputated and imaged at 0, 24 and 72 hpa. (b) Brightfield and fluorescence imaging were performed at the designated time-points. A distinctive change of cellularity occurred in the notochords of amputated larvae, leading to the upregulation of GFP in the notochord of Tg(wt1b:gfp) but not Tg(wt1a:gfp) injured larvae. n > 10; experimental replicates = 2. Scale bar: 100 µm. (c) Time-lapse analysis of amputated 3 dpf Tg(wt1b:gfp) showed that the GFP response starts at 7 hpa and develops over time, arising at a site distant to the cut but then moving towards the amputated area. n > 10; experimental replicates = 4. Scale bar: 100 µm. (d) Selected tail amputations were performed on 3 dpf Tg(wt1b:gfp) larvae: tail fin only (TF), tip of notochord (TN), before caudal vein (BCV) and post caudal vein (PCV). (e) Tail amputations triggered a GFP response in TN, BCV and PCV amputated Tg(wt1b:gfp) larvae, with PCV amputated larvae expressing wt1b:gfp at earlier stages. TF amputation did not trigger a GFP response. n > 10; experimental replicates = 2. Scale bar: 100 µm. (f) Deeper tail amputation led to a higher percentage of GFP responses. The y-axis represents the percentage of GFP positive responses and the ‘GFP +ve’ and ‘NO GFP’ numbers are given as percentages of the number of larvae used per amputation experiment. dpf = days post fertilization; hpa = hours post fertilization; S = somite; N = notochord; CV = caudal vein; n = number of larvae.
Figure 1—figure supplement 2
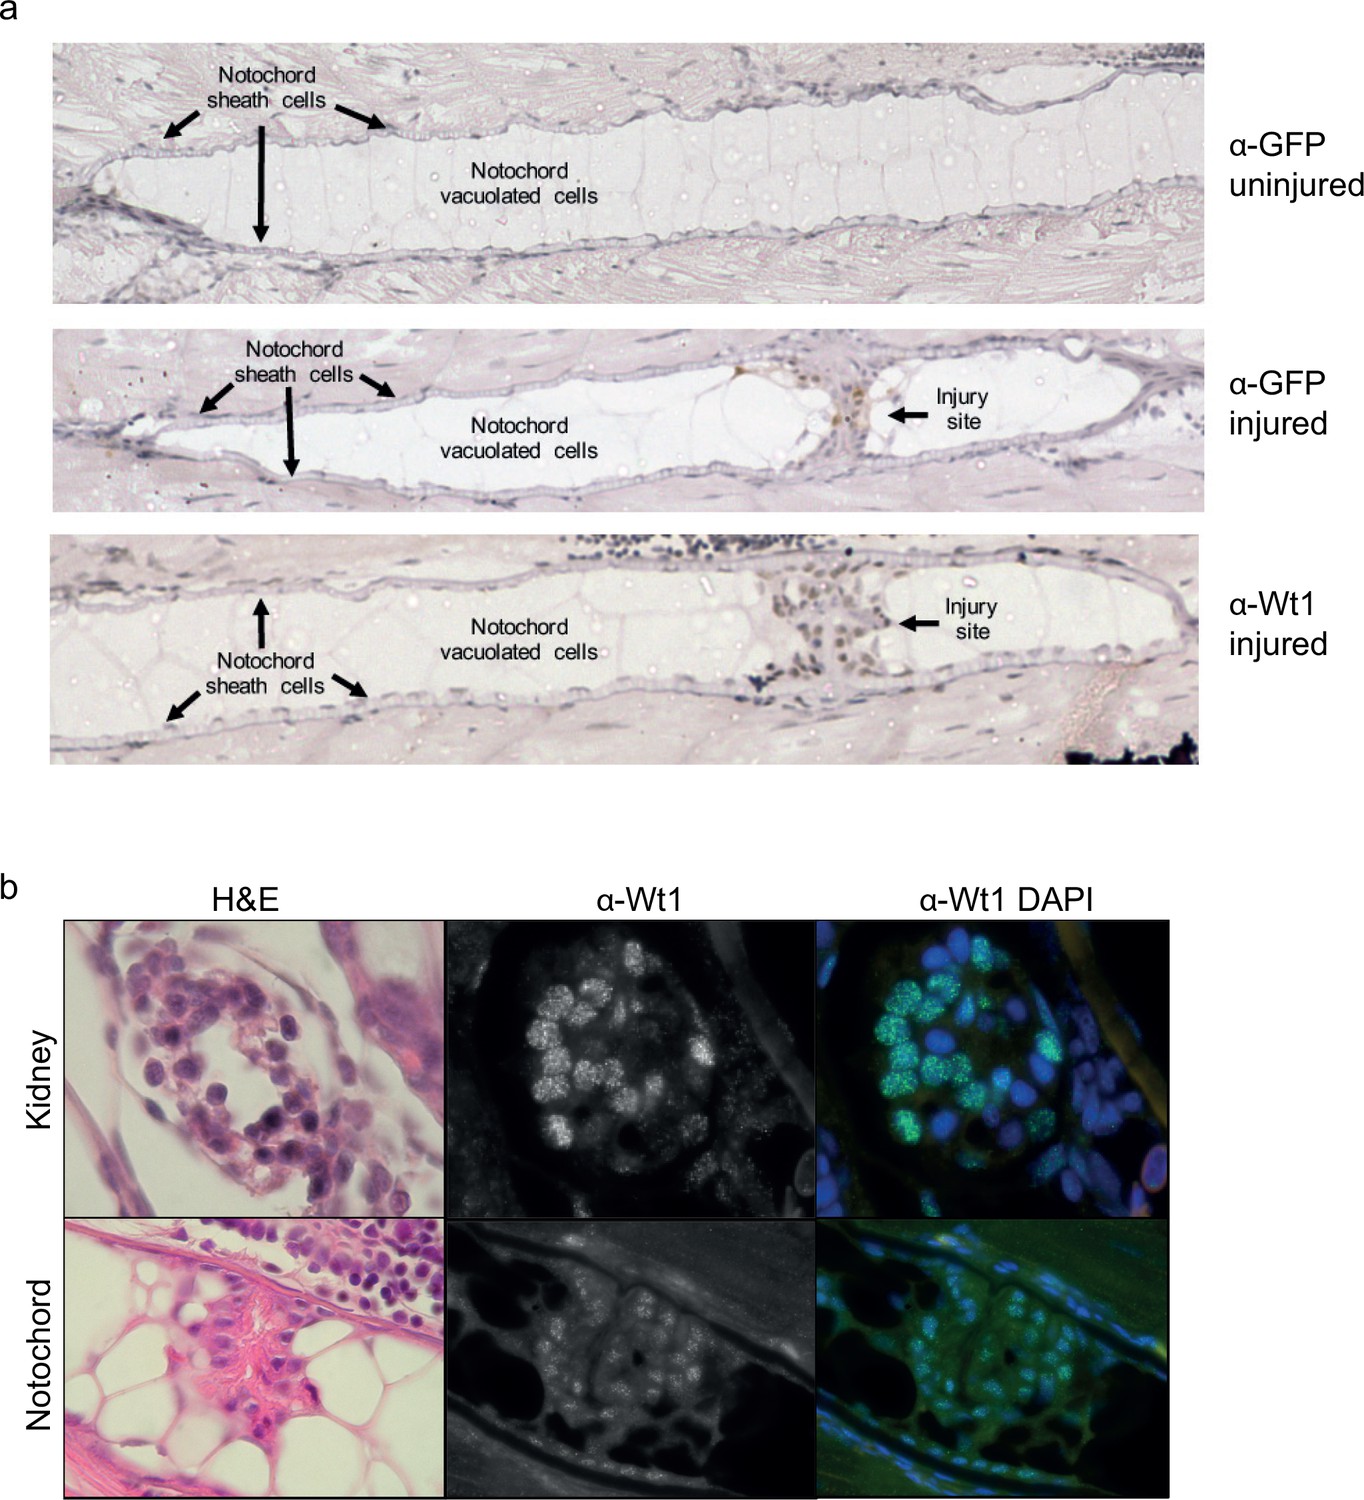
Wt1 and GFP protein expression in the notochord.
(a) Immunohistochemistry of injured and uninjured notochord regions, stained with α-GFP and α-Wt1 antibodies. Sheath cells and vacuolated cell populations, and injury site are indicated. n > 10; five experimental replicates. (b) Immunofluorescence of 3 dpi injured notochord tissue stained with α-Wt1 antibody. Kidney tissue is shown as a positive control. dpi: days post injury. Experimental replicates = 5; n = 5.
Figure 2 with 2 supplements
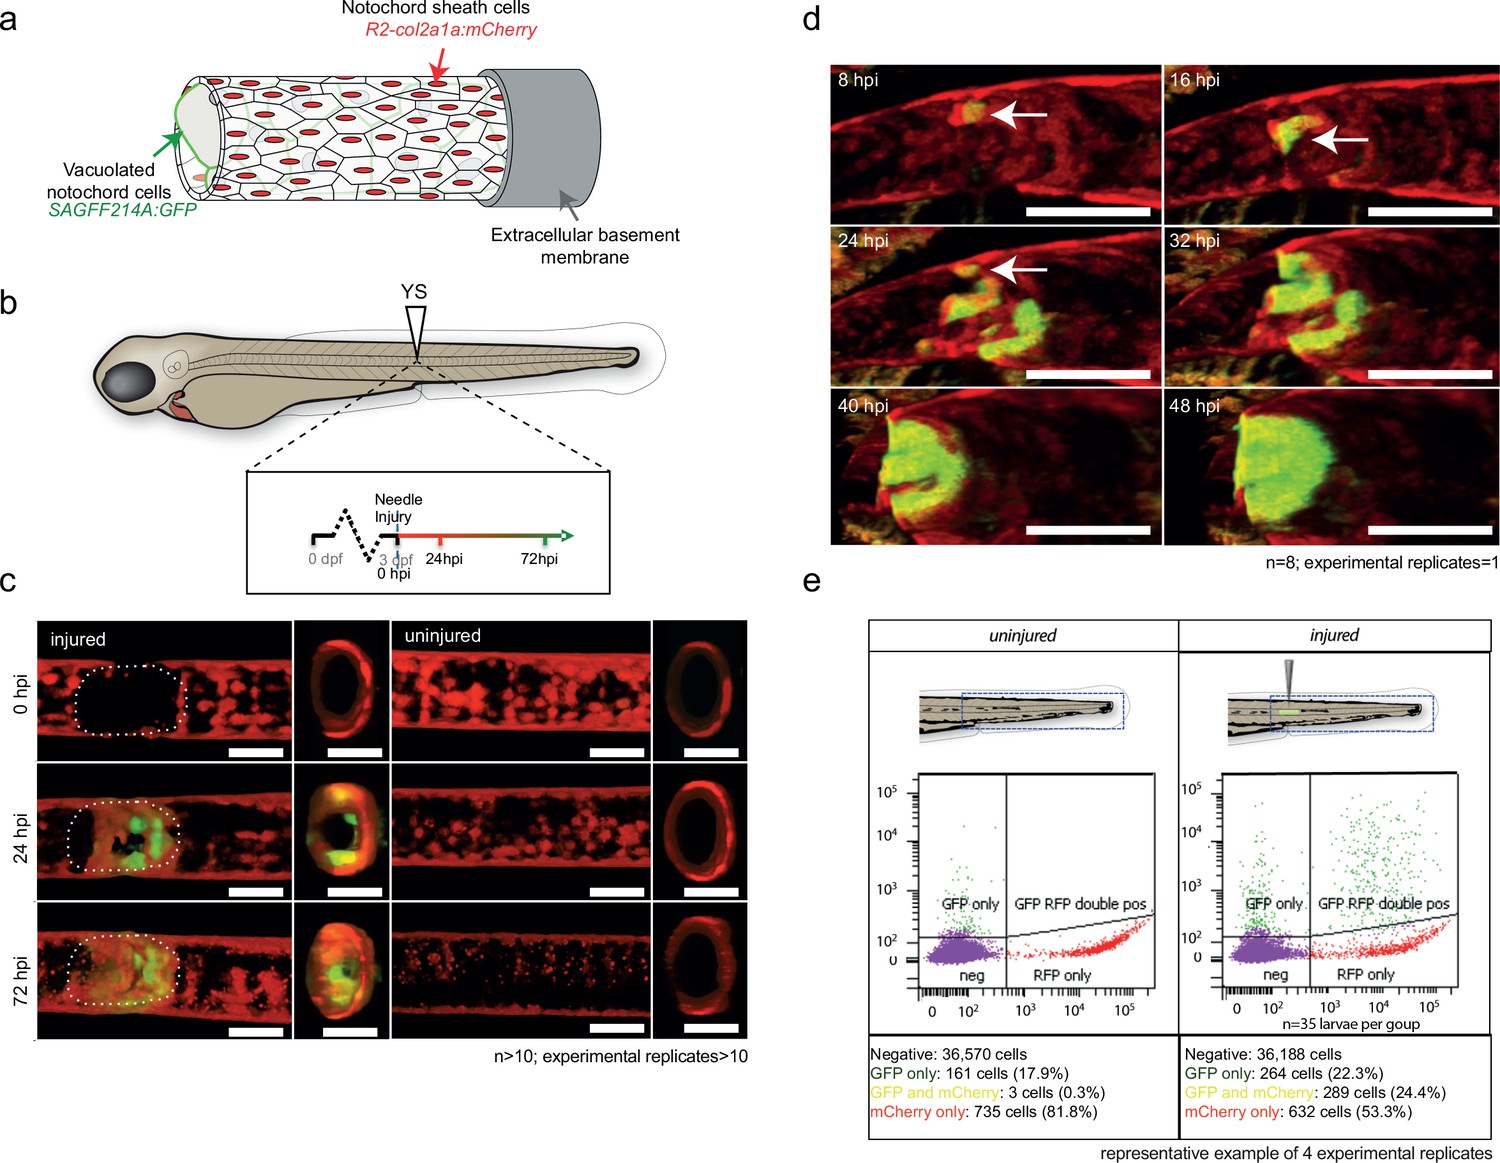
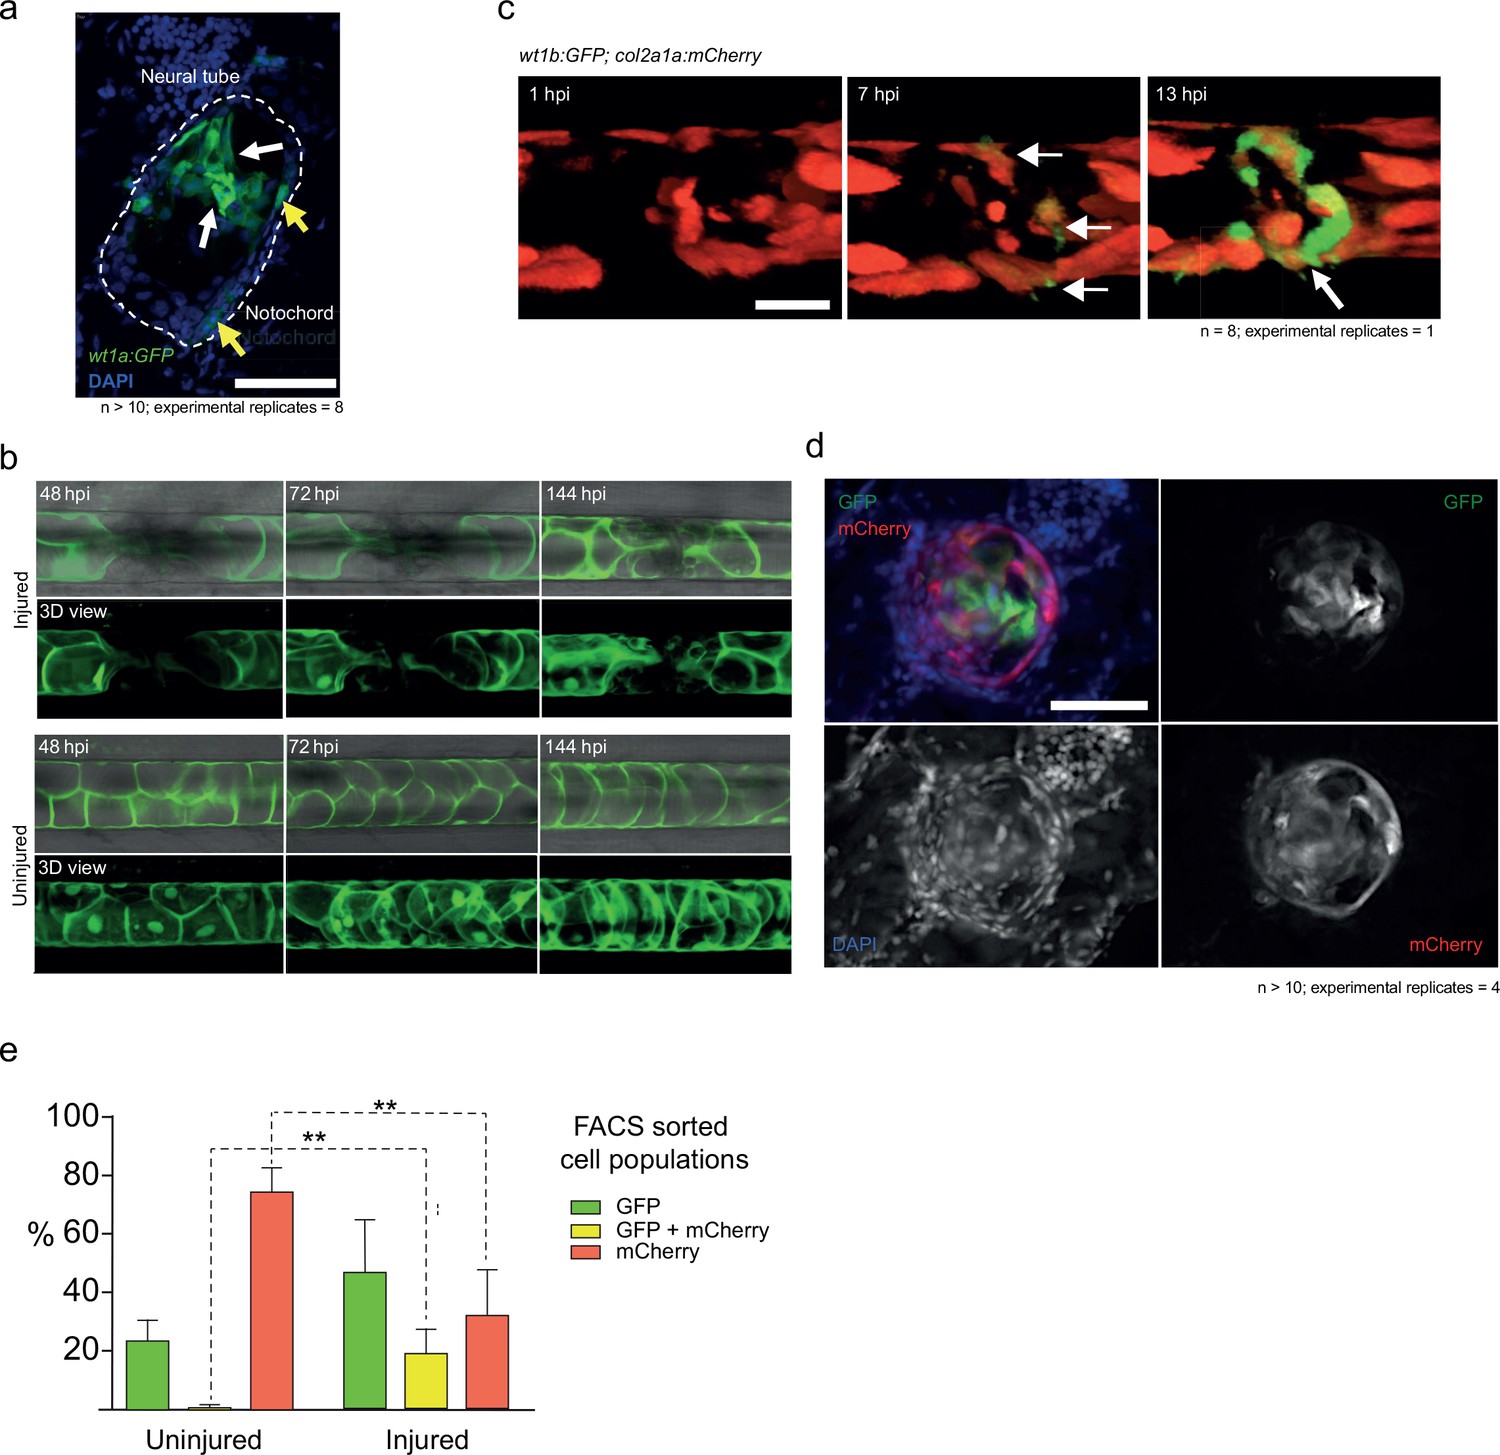
wt1b:gfp expressing notochord sheath cells populate the site of injury in the damaged notochords.
(a) Schematic diagram of the notochord and transgenic lines used in this study. The notochord is composed of an inner population of highly vacuolated cells (green arrow; SAGFF214A:gfp), surrounded by a layer of epithelial-like sheath cells (red arrow; R2col2a1a:mCherry), encapsulated by a thick layer of extracellular basement membrane (grey arrow). (b) Schematic of experimental design: 3dpf Tg(wt1b:gfp; R2-col2a1a:mCherry); casper larvae were needle-injured and imaged at 0, 24 and 72 hpi. (c) Needle damage led to the formation of a cell-free gap in the layer of notochord sheath cells (0 hpi – injured; dashed line). GFP expression can be observed in the notochord sheath cells surrounding the area of damage by 24 hpi (inset: cross-sectional view) and these appear to engulf the injured area by 72 hpi (inset). n > 10; experimental replicates >10. Scale bar: 100 µm. (d) Multiphoton time-lapse imaging of wound site. Initial upregulation of GFP occurs at eight hpi in the R2-col2a1a:mCherry positive cells (arrow) and propagates across the injured area over the next 40 hr to form a seal in the notochord. n = 8; experimental replicates = 1. Scale bar: 100 µm. (e) Representative example of FACS analysis of cell populations in injured and non-injured zebrafish trunk tissue. GFP+mCherry+ double positive cells are present in injured Tg(wt1b:gfp; col2a1a:mCherry) at 72 hpi. Percentage of fluorescent cells are reported. Note that the dissected tissue can also encompass wt1b:gfp expressing cells in the posterior end of the pronephric duct (see also Figure 1c). n = 35 larvae per group; experimental replicates = 4. dpf = days post fertilization; hpi = hours post injury.
Figure 2—figure supplement 1
Imaging cell populations at the wound.
(a) Cross-sections of the injured notochord shows two populations of wt1b:gfp-positive cells. Epithelial-like cells at the edge of the notochord (yellow arrows) and mesenchymal-like cells invading the central aspects of the notochord (white arrows). n > 10; experimental replicates = 4. Scale bar: 50 µm. (b) 3 dpf Tg(SAGFF214A:GFP) larvae were imaged at 48, 72 and 144 hpi. The needle injury created a cell-free gap in the row of vacuolated cells, which appeared to be populated over time with new SAGFF214A:GFP expressing cells. n = 8; experimental replicates = 1. Scale bar: 50 µm. (c) Confocal imaging of mosaic Tg(wt1b:gfp; R2-col2a1a:mCherry) larvae showed that mCherry+ sheath cells began to express GFP upon needle injury, forming a ring around the damaged area (arrows). Scale bar: 100 µm. (d) Cross-sectional cryo-sections of the injured notochord of 72 hpi Tg(wt1b:gfp; R2-col2a1a:mCherry) larvae highlight the presence of a mixed population of GFP and mCherry cells inside the notochord. n > 10; experimental replicates = 4. Scale bar: 20 µm. hpi = hours post injury. (e) Bar graph of FACS sorted cell populations from uninjured or injured Tg(wt1b:gfp; R2-col2a1a:mCherry) larvae. N = 4 experimental replicates. Multiple t-tests. ** p-value=0.005, ** p-value=0.002. See Source Data file (Figure 2—figure supplement 1—source data 1).
-
Figure 2—figure supplement 1—source data 1
Raw data and statistical analyses for Figure 2—figure supplement 1e.
Numbers of GFP+, mCherry+ and double fluorescent cells in sorted in 4 different occasionsfrom uninjured or injured Tg(wt1b:gfp;R2-col2a1a:mCherry). Subsequent calculations are also included. Multiple t-tests. ** p-value = 0.005, ** p-value = 0.002.
- https://doi.org/10.7554/eLife.30657.008
Figure 2—figure supplement 2
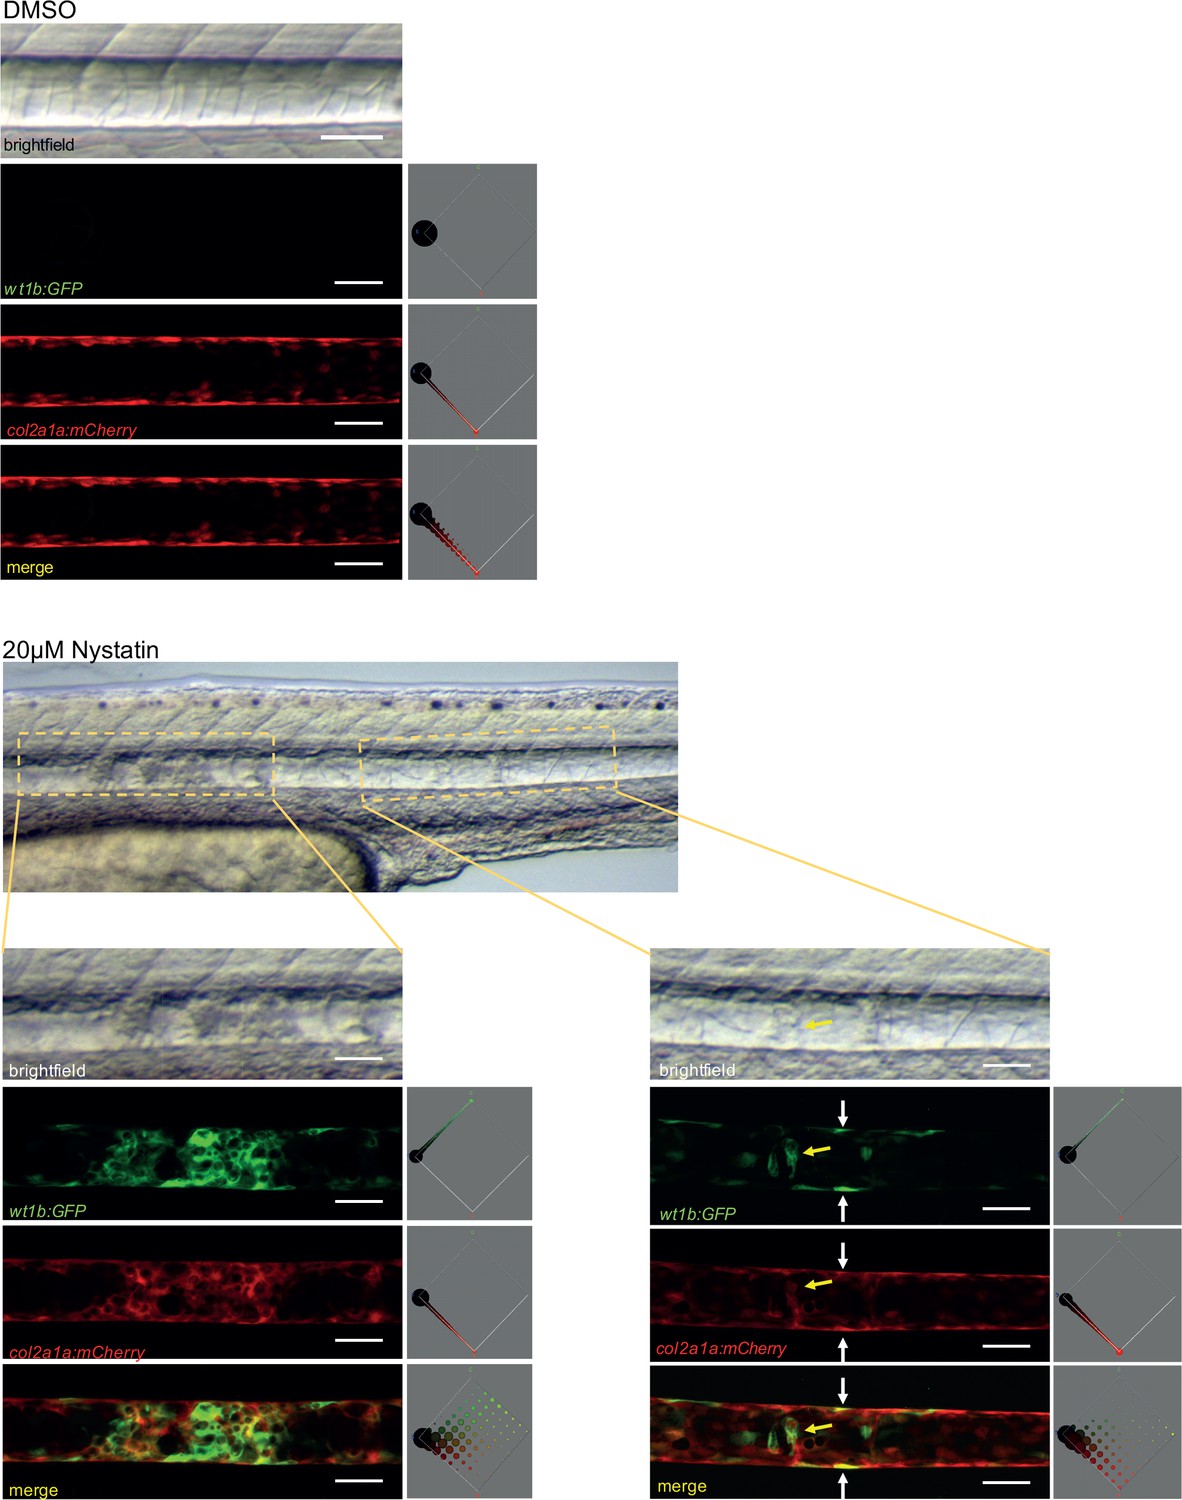
Nystatin treatment leads to upregulation of wt1b:gfp expression in notochord sheath cells.
48hpf Tg(wt1b:gfp; R2-col2a1a:mCherry);nacre-/- zebrafish embryos were treated with either 20 µM nystatin or 0.4% DMSO for 24 hr. The notochord structure of DMSO-treated embryos appeared normal (n = 15), while nystatin-treated embryos exhibited notochord lesions of varying severity along the notochord (n = 12/13). Confocal Z-stacks through the centre of the notochords show wt1b:gfp expression (green), R2-col2a1a:mCherry expression (red) and their overlap (merged). wt1b:gfp expression was observed at lesion sites, while no wt1b:gfp expression was observed in control animals. Colour histograms (Color-Inspector 3D ImageJ plugin) quantify pixel colour distribution, and show overlap between green and red expression in merged channel images. Experimental replicates = 3; n = 7–13 embryos/per treatment.
Figure 3
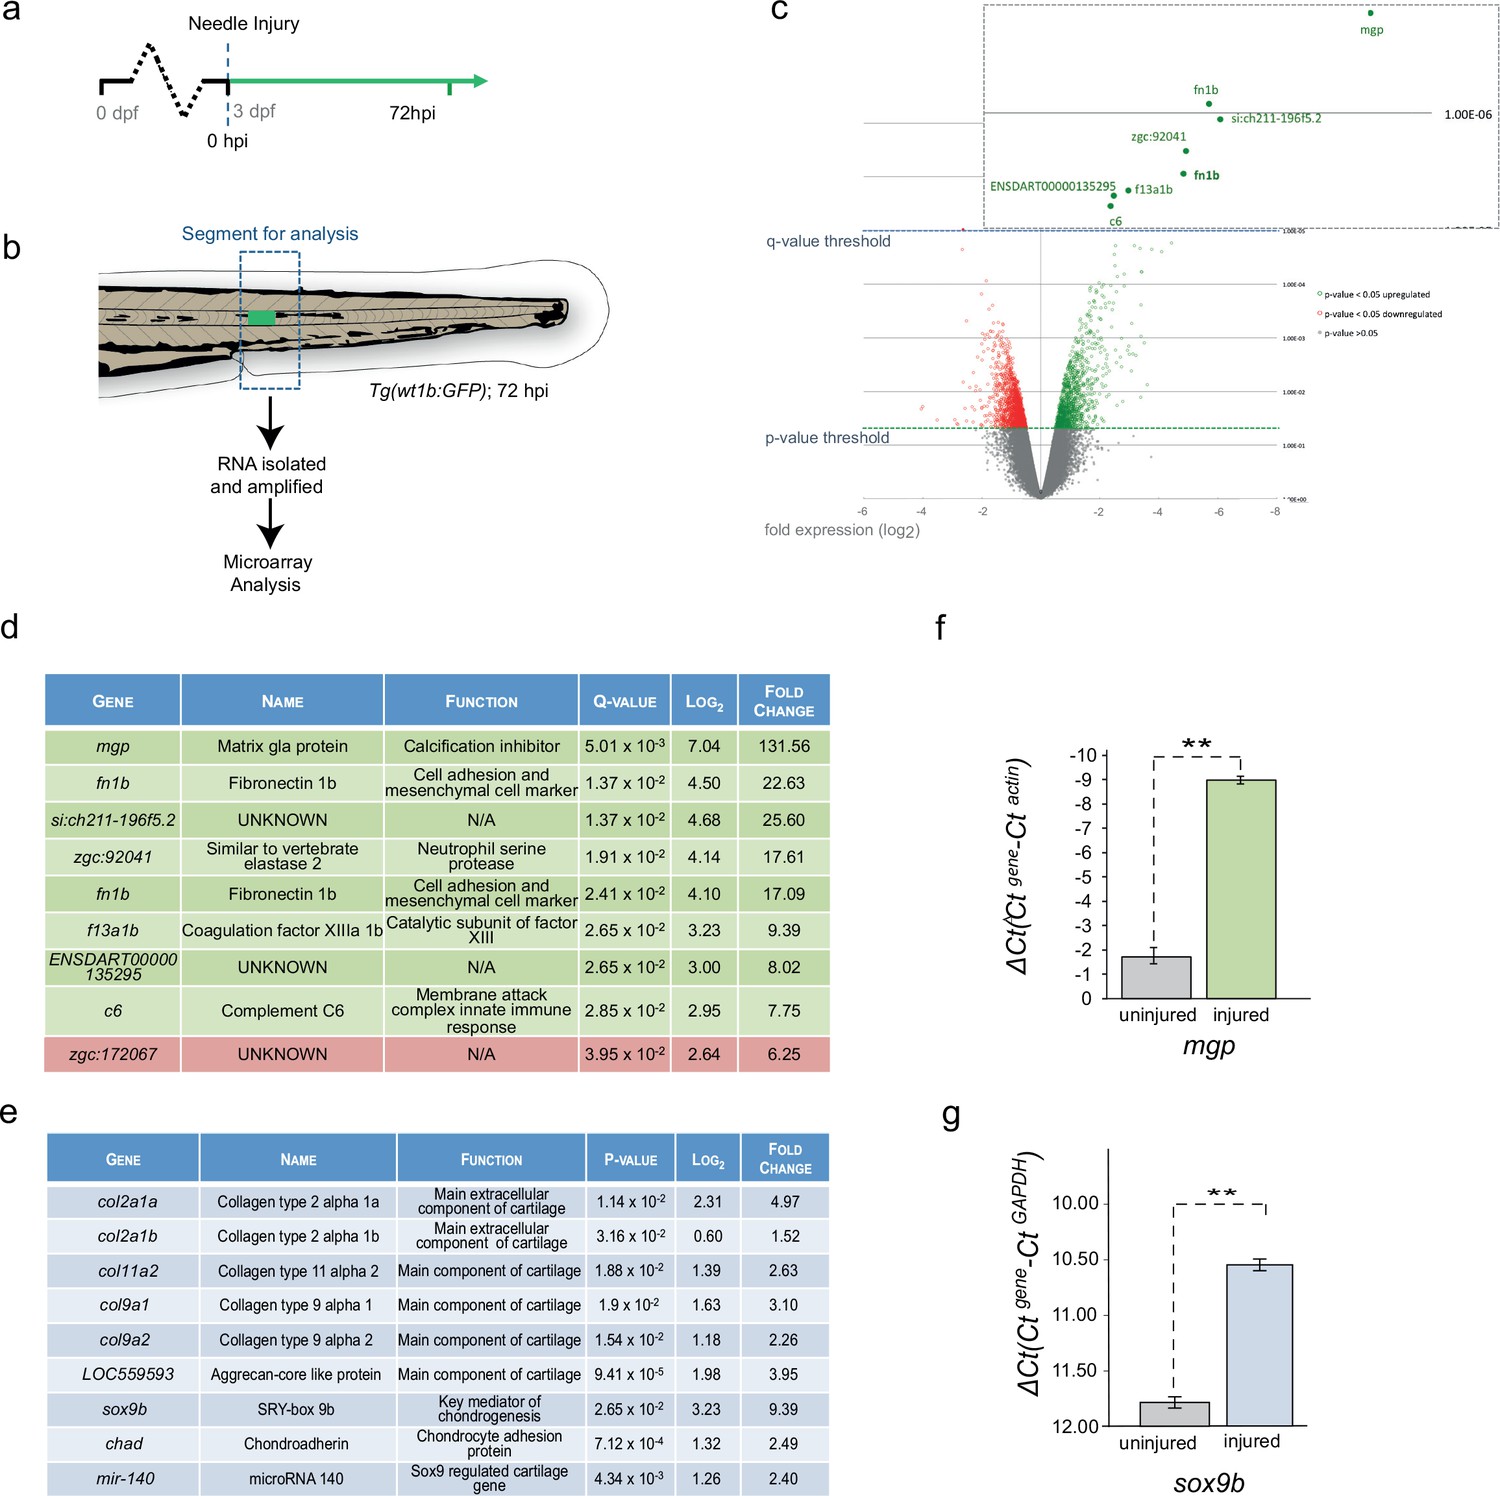
Cartilage genes are expressed in the notochord-injured zebrafish.
(a) Experimental plan: 3 dpf Tg(wt1b:gfp) larvae were needle injured and grown for 72 hr with uninjured age-matched controls (n = 50 larvae per group). (b) The area around the wt1b:gfp expression was excised at 72 hpi (dotted area) and RNA was extracted and amplified. A similar area was taken from age-matched uninjured controls. (c) Volcano plot displaying the differentially expressed genes between injured and non-injured larvae. The y-axis measures the mean expression value of log 10 (p-value) and separates upregulated from downregulated genes. The x-axis represents the log2 fold change of expression. Significantly upregulated genes are shown as green circles or dots and downregulated genes are shown as red circles or dots. Green dotted line represents the p-value threshold (p<0.05) and blue dotted line represents the false discovery rate (FDR) or q-value threshold (q < 0.05). Genes with highest expression change are shown in magnified view. (d) Table showing the most significantly differentially expressed genes in injured larvae (q < 0.05). Upregulated genes are shown in green and downregulated genes are shown in red. (e) Table showing cartilage-associated genes that were significantly upregulated in the injured larvae (p<0.05). (f, g) Results of quantitative real-time PCR (qRT-PCR) of mgp and sox9b. The y-axis indicates the difference between the cycle threshold (Ct) value of the gene of interest and the Ct value of β-actin for mgp and gapdh for sox9b. Note that the y-axis is inverted to ease interpretation. Bars represent standard deviation from the mean. mgp **p=0.025; sox9b ***p=0.007; paired t-test; Experimental replicates: mgp = 2; sox9b = 1 at 48 hpi, and 1 at 72 hpi (40 embryos pooled per replicate). See Source Data files (Figure 3—source data 1; Figure 3—source data 2).
-
Figure 3—source data 1
Raw data and statistical analyses for Figure 3f.
Results of quantitative real-time PCR (qRT-PCR). The cycle threshold (Ct) value of the gene of interest(mpg) and the Ct value ofβ-actinare indicated for each sample. Subsequent calculations are also included. Paired t-test;** p= 0.025. Experimental replicates=2; (40 embryos pooled per replicate).
- https://doi.org/10.7554/eLife.30657.011
-
Figure 3—source data 2
Raw data and statistical analyses for Figure 3g.
Results of quantitative real-time PCR (qRT-PCR). The cycle threshold (Ct) value of the gene of interest(sox9b) and the Ct value ofgapdhare indicated for each sample. Subsequent calculations are also included. Paired t-test;*** p= 0.007 Experimental replicates =1 at 48 hpi, and 1 at 72 hpi (40 embryos pooled per replicate).
- https://doi.org/10.7554/eLife.30657.012
Figure 4 with 1 supplement

Single-cell and 10 cell sequencing of wt1b-shealth cell populations.
(a) Single-cell and 10 cell SC3 unbiased clustering analysis reveals three distinct cell populations marked by GFP (cluster 1), mCherry (cluster 3), or GFP and mCherry (cluster 2). (b) GFP, mCherry, wt1b and col2a1a expression in 10 cell clusters. (c) Top 10 differential gene expression marker genes for 10 cell clusters. (d) Expression of mgp in different cell populations of injured zebrafish notochords. RNA was isolated from FACS sorted GFP, RFP and GFP/RFP expressing cells of the notochord of Tg(wt1b:gfp; R2-cola2a1a:mCherry) embryos, and gene expression was determined by qPCR. The y-axis indicates the difference between the cycle threshold (Ct) value of the gene of interest and the Ct value of beta-actin in injured and uninjured notochord. The y-axis is inverted for ease of interpretation. p-values are determined by paired t-test. Bars represent standard deviation. mgp: **p=0.035. Experimental replicates = 2. See Source Data file (Figure 4—source data 1). (e) Bar chart depicting functional analysis of differentially expressed genes between 10 cell SC3 cluster 2 and cluster three against five databases. Normalised enrichment score (NES, x-axis) calculated using online functional enrichment tool WebGestalt resource. Coloured bars match specific databases. (f) Images of the wound site seven days post injury in Tg(wt1b:gfp;col2a1a:mCherry); nacre-/- embryos. Arrows indicate vacuole-like structures. n = 7; experimental replicates: 1. Scale bar: 50 μm. (g) Gene set enrichment analysis (GSEA) of cartilage genes in wt1-expressing sheath cell (cluster 2) 10 cell group clusters (21 out of 82 genes were positively enriched; NES = 0.90). (h) GSEA of WT1 gene targets in wt1b-expressing sheath cell (cluster 2) 10 cell group clusters (19 out of 56 target genes were negatively enriched; NES = −1.44). (i) Heatmap of expression of WT1-interacting partners in 10 cell cluster 2 and cluster 3. (j) p53 RNA expression in 10 cell clusters. (k) GSEA of p53 targets genes in wt1b-expressing sheath cell (cluster 2) 10 cell group clusters (358 out of 1442 genes were positively enriched; NES = 1.17). (l) GSEA of common p53 and WT1 gene targets in wt1b-expressing sheath cell (cluster 2) 10 cell group clusters (10 out of 19 genes were negatively enriched, NES = −1.11).
-
Figure 4—source data 1
Raw data and statistical analyses for Figure 4d.
Results of quantitative real-time PCR (qRT-PCR). RNA was isolated from FACS sorted GFP, RFP and GFP/RFP expressing cells of the notochord ofTg(wt1b:gfp; R2-cola2a1a:mCherry)embryos, and gene expression was determined by qPCR. The cycle threshold (Ct) value for the gene of interest(mpg) and the Ct value ofβ-actinare indicated. Subsequent calculations are also indicated . Paired t-test; *** p=0.001; ** p=0.035. Experimental replicates=2. Only one replicate has been used to generate the graph.
- https://doi.org/10.7554/eLife.30657.015
Figure 4—figure supplement 1
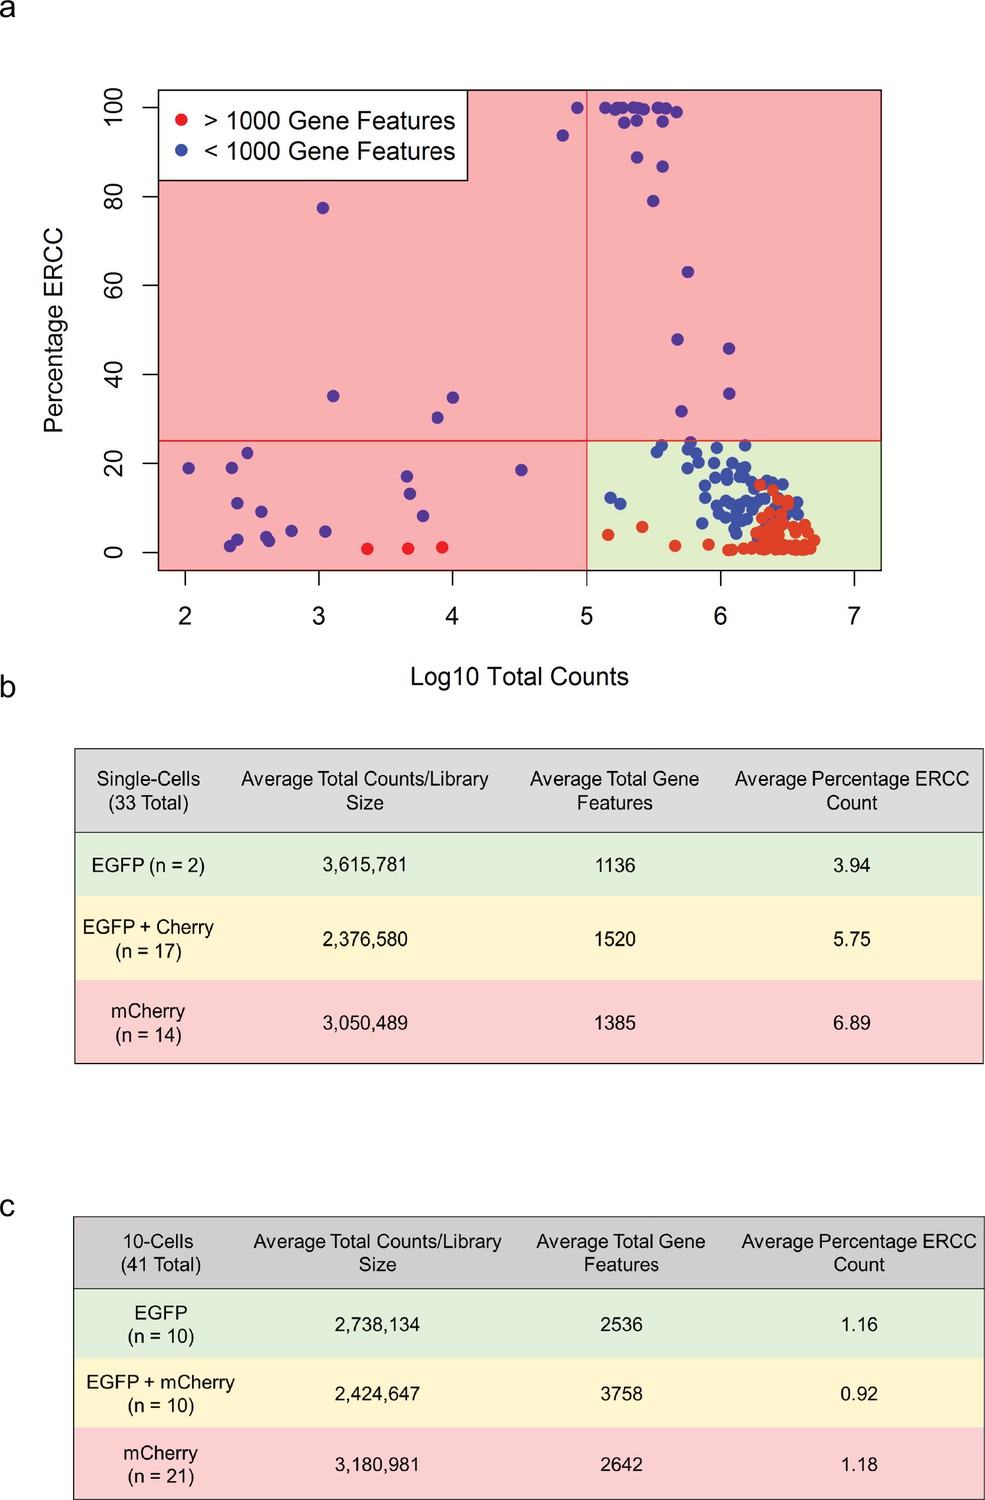
Quality control for the single-cell and 10 cell RNA sequencing.
(a) Log 10 total read counts (x-axis) vs ERCC (RNA spike-in) percentage of total counts per cell (y-axis). Cells with gene features (reads mapping to a protein-coding gene, minimum one read per gene) greater than 1000 are coloured red and cells with less than 1000 coloured blue. Quality control exclusion criteria were cells with ERCC percentage counts >25% and/or with less than 100,000 reads per cell were rejected, as indicated by shaded red regions. Cells with gene feature counts <1000 were also rejected. Cells with gene features > 1000 (red cells) and are in the green shaded region passed quality control. (b) Summary statistics table of 33 single-cells that passed quality control. (c) Summary statistics table of 41 10 cells that passed quality control.
Figure 5
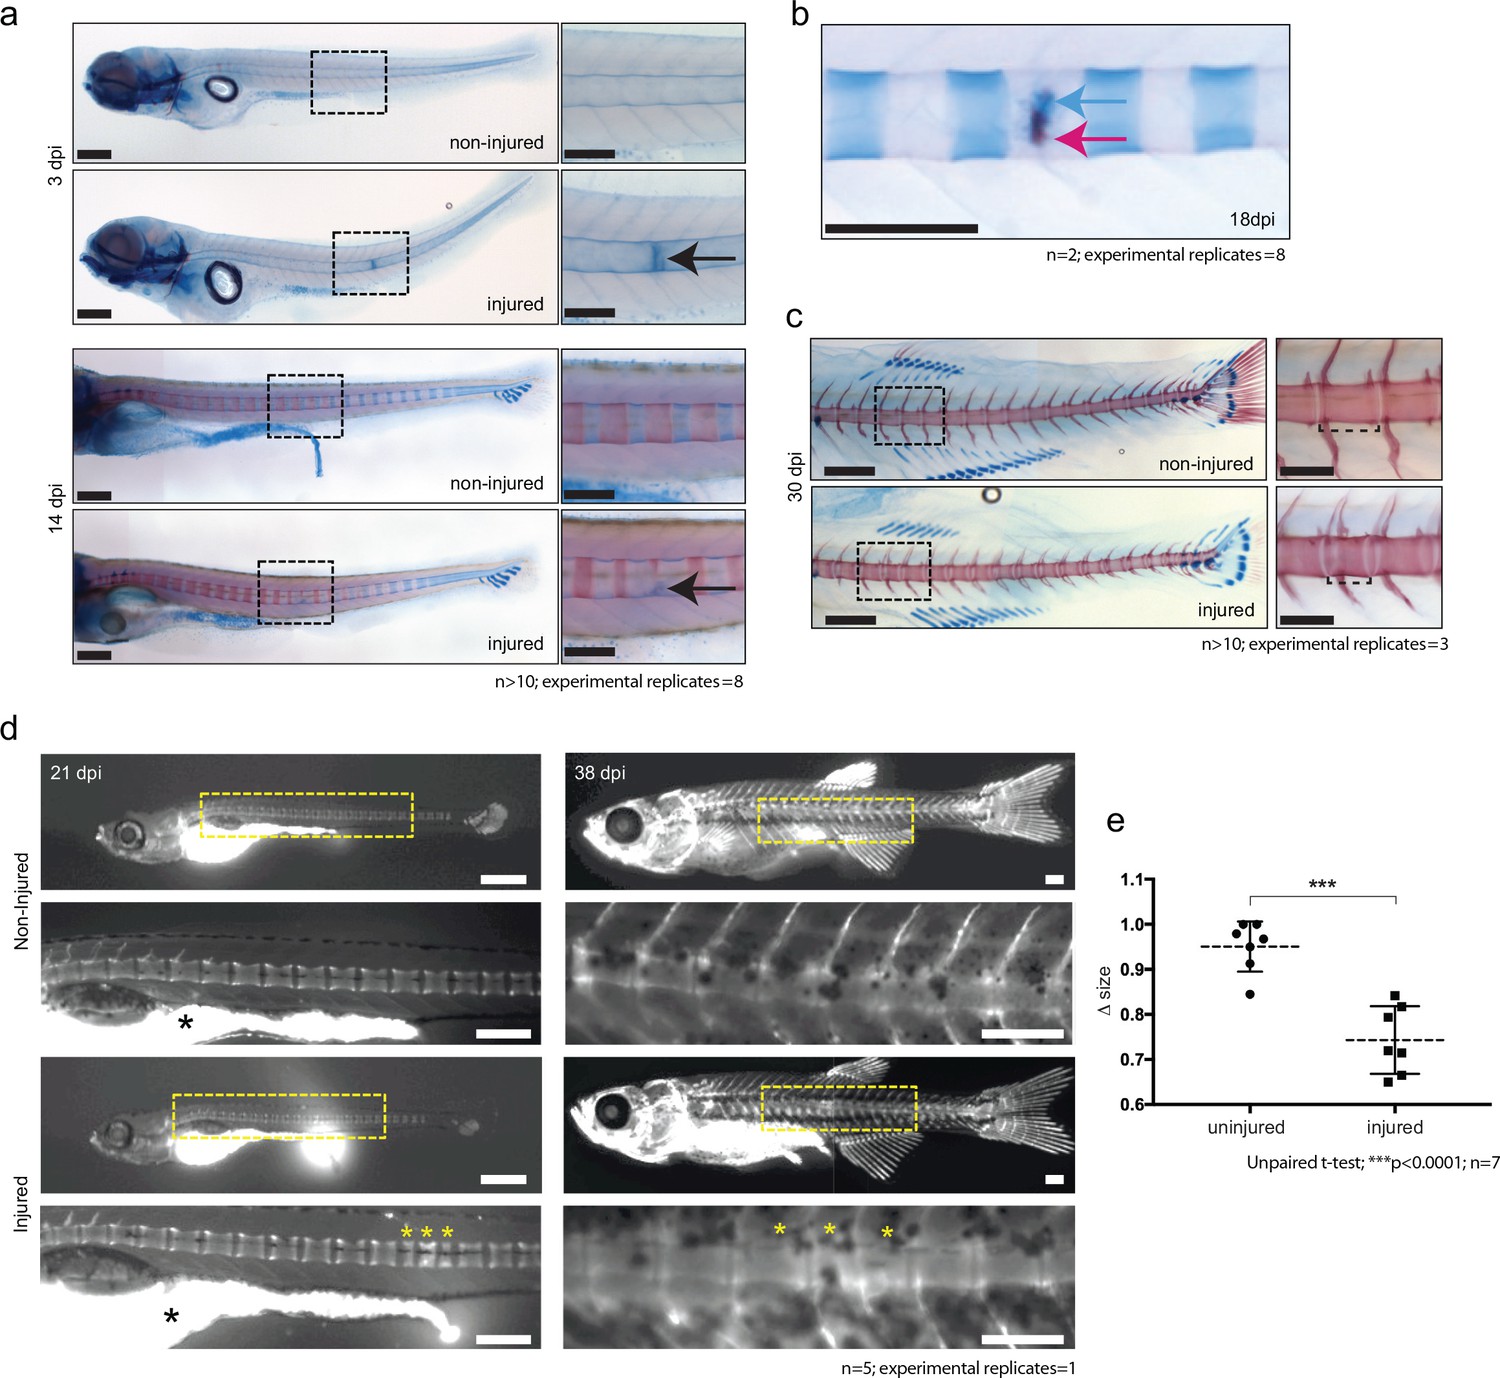
De novo bone formation occurs via a cartilage intermediate at the site of injury.
(a) Alcian blue and Alizarin red staining at the site of injury in 3 and 14 dpi larvae. Ectopic cartilage deposit is indicated by arrow. n > 10; experimental replicates = 8. Scale bar left panels: 400 µm; scale bar right panels (zoomed images): 200 µm. (b) Alcian blue and Alizarin red staining at the site of injury at 18 dpi indicates the presence of bone and cartilage at the repair site (blue arrow = cartilage; red arrow = bone). n = 2; experimental replicates = 8. Scale bar: 200 µm. (c) Alcian blue and alizarin red staining of 30 dpi larvae reveals the formation of a smaller vertebra in the damaged area. n > 10; experimental replicates = 3. Scale bar left panels: 400 μm; scale bar right panels (zoomed images): 200 μm. (d) Live imaging of calcein stained zebrafish at 21 and 38 dpi in injured and uninjured fish. Vertebrae at damage site are indicated by yellow asterisks. Black asterisk denotes intestinal fluorescence. n = 5; experimental replicates = 1. Scale bar 21 hpf: 200 µm; scale bar 21 hpf zoomed: 100 µm; scale bar 38 hpf: 200 µm; scale bar 38 hpf zoomed: 100 µm. (e) The relative vertebra size difference (Δ size) between vertebrae at the site of injury (injured) and vertebrae in non-injured areas (uninjured). Vertebrae at the site of injury were significantly smaller than uninjured vertebrae (Unpaired t-test; ***p<0.0001 two-tailed; mean ±SEM uninjured larvae = 0.9506 + /- 0.02102 n = 7; mean ±SEM injured larvae = 0.7432 + /- 0.0284 n = 7; measurements taken at 30 and 38 dpi).
Figure 6 with 1 supplement
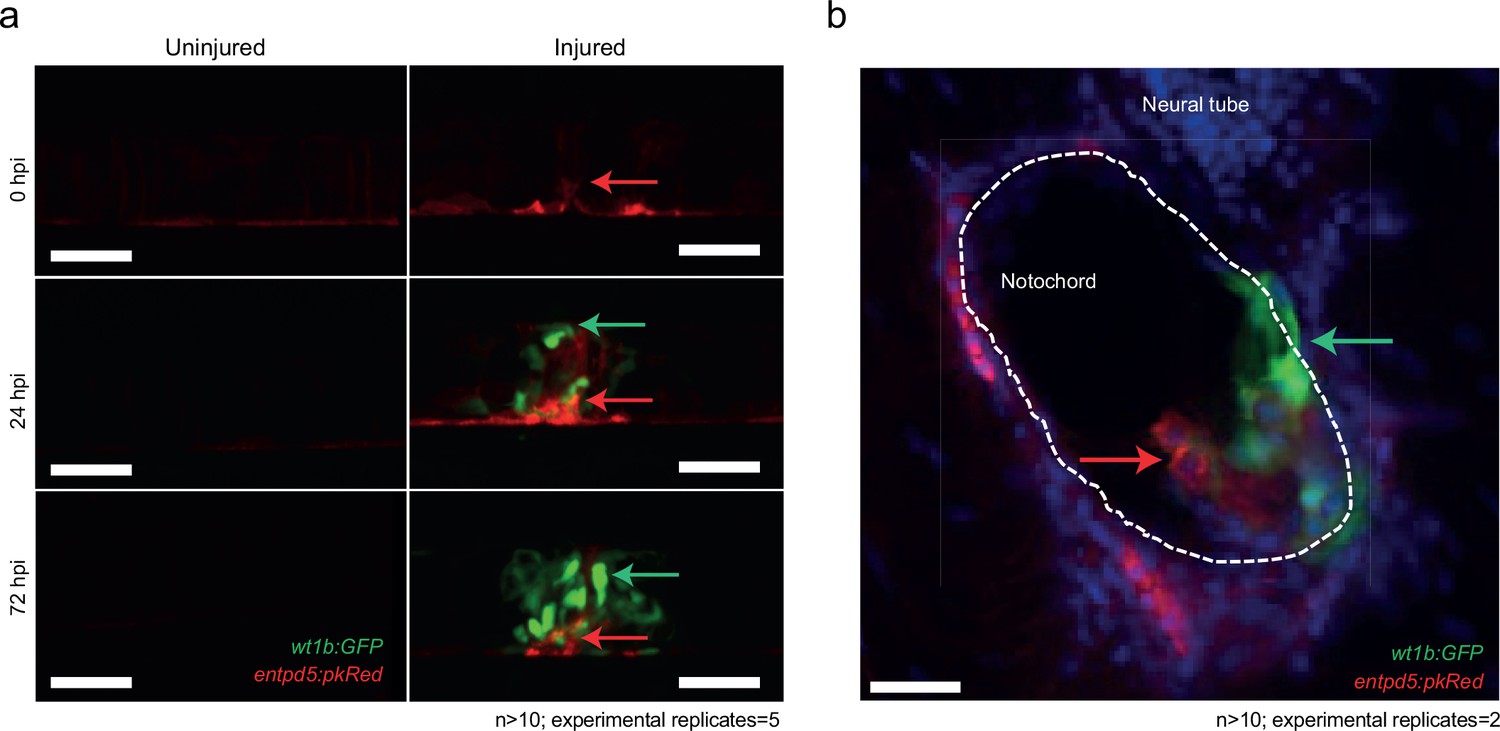
Distinct and closely associated wt1b and entpd5a subpopulations emerge at the damage site.
(a) Live-imaging at the site of notochord injury in Tg(wt1b:gfp; entpd5a:dkRed) larvae. Expression of wt1b:gfp and entpd5a:pkRed at site of damage (green arrows and red arrows respectively) in injured and uninjured fish. n > 10; experimental replicates = 5. Scale bar: 50 µm. (b) Cryo-section of the injured area confirms distinct wt1b:gfp and entpd5a:dkRed subpopulations at site of damage. n > 10; experimental replicates = 2. Scale bar: 20 µm.
Figure 6—figure supplement 1
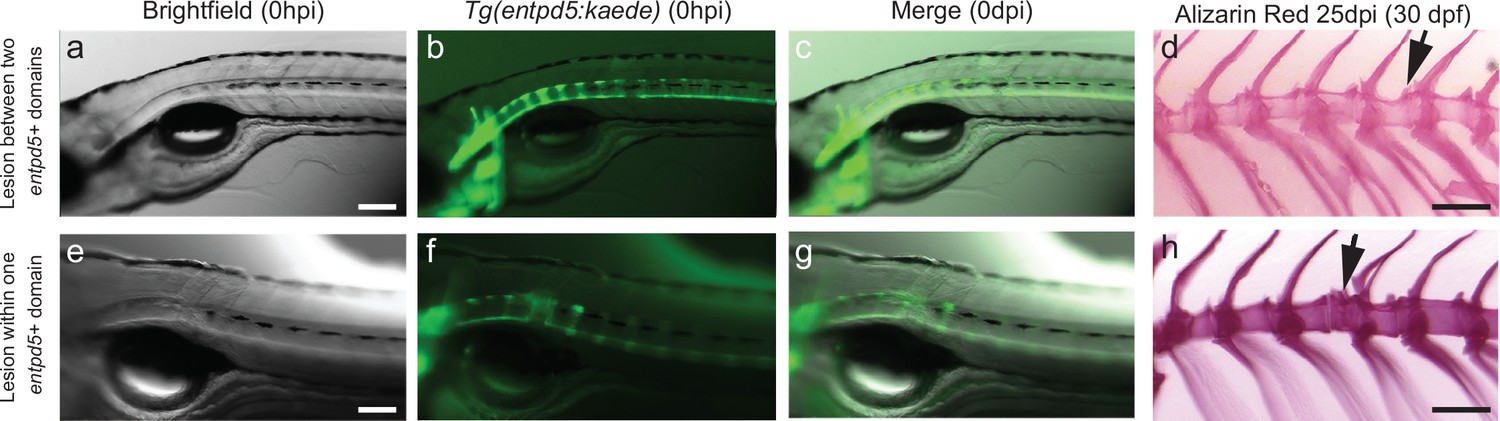
Needle damage of the entpd5a cell domain leads to supernumerary vertebrae.
(a–c) Images of 5dpf Tg(entpd5a:kaede) embryos that were injured between entpd5-expressing segments. (d) Alizarin red staining of adult vertebrae from 5 dpf larvae injured between entpd5-expressing segments from a). Arrow points at site of injury. n = 5/5 when injury was done at 5dpf and 6/6 when injury was done at 7dpf e–g). Images of 5dpf Tg(entpd5a:kaede) embryos that were injured in the middle of the entpd5-expressing segments. (h) Alizarin red staining of adult vertebrae from 5 dpf larvae injured in the middle of entpd5-expressing segments from e) Arrow points at site of injury, and indicates extra vertebra. n = 1/1 for fish injured at day 5, and n = 3/3 for fish injured at day 7 pf. The scale bar in panel a,e is 100 µm and applies to b, c, f and g. The scale bars in d and h are 1000 µm.
Figure 7
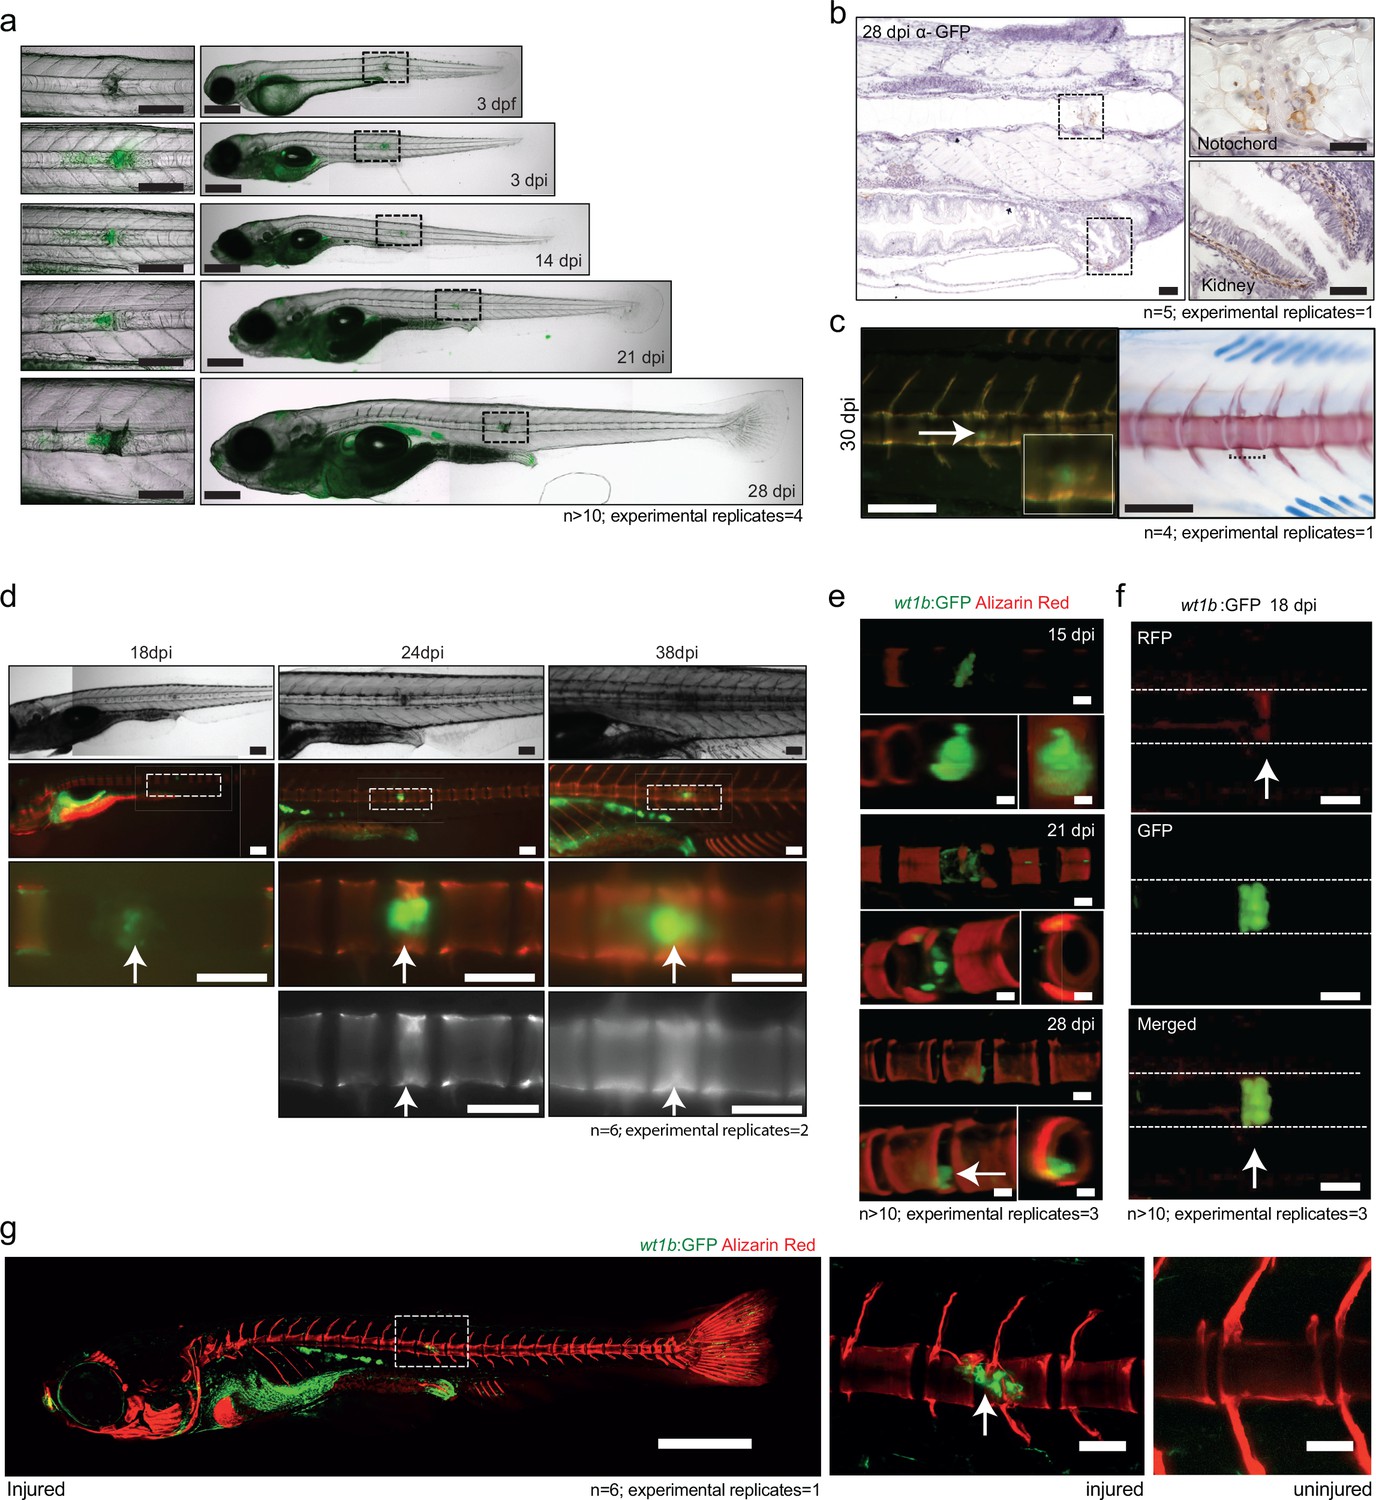
wt1b expressing cells are closely associated with vertebral development after injury.
(a) Images of Tg(wt1b:gfp) zebrafish following needle injury at 3 dpf and raised to 28 dpi. n > 10; experimental replicates = 4. Scale bar left panels: 100 µm; scale bar right panels: 200 µm. (b) α-GFP staining of 28 dpi larvae at the site of the healing notochord wound and in the kidney. n = 5; experimental replicates = 1. Scale bar left panels: 50 µm. (c) Image of fish from Figure 5a,c, stained with alizarin red and imaged for wt1b:gfp expressing cells. GFP positive cells are found within the ectopic vertebra (white arrow and inset). n = 4; experimental replicates = 1. Scale bar left panels: 100 μm. (d) Long-term follow up of alizarin red stained Tg(wt1b:gfp); casper larvae shows that chordacentra formation is delayed around the site of injury. GFP cells mark the site of the future vertebra. n = 6; experimental replicates = 2. Scale bar: 100 µm; scale bar zoomed images: 50 µm. (e) Confocal imaging of 15, 21 and 28 dpi larvae reveals an overlapping expression between the wt1b:gfp expressing cells and the forming chordacentra (alizarin red stained) in the injured Tg(wt1b:gfp); casper larvae. n > 10; experimental replicates = 3. Scale bar: 100 µm. Imaging views are lateral, angled and cross-section view. (f) Confocal imaging highlights the overlapping presence of bone (alizarin red stained) and wt1b:gfp cells at the wound in 18 dpi larvae (arrow). n > 10; experimental replicates = 3. Scale bar: 100 µm. (g) Confocal scans of 24 dpi Tg(wt1b:gfp) larvae stained with alizarin red and expressing GFP at the injury site following notochord injury compared with uninjured control fish. GFP positive cells are present within the vertebrae at the injury site (arrow). Scale bar left fish: 1000 µm; scale bar on vertebrae images: 100 µm.
Figure 8 with 1 supplement

Schematic of the notochord wound response.
https://doi.org/10.7554/eLife.30657.020
Figure 8—figure supplement 1
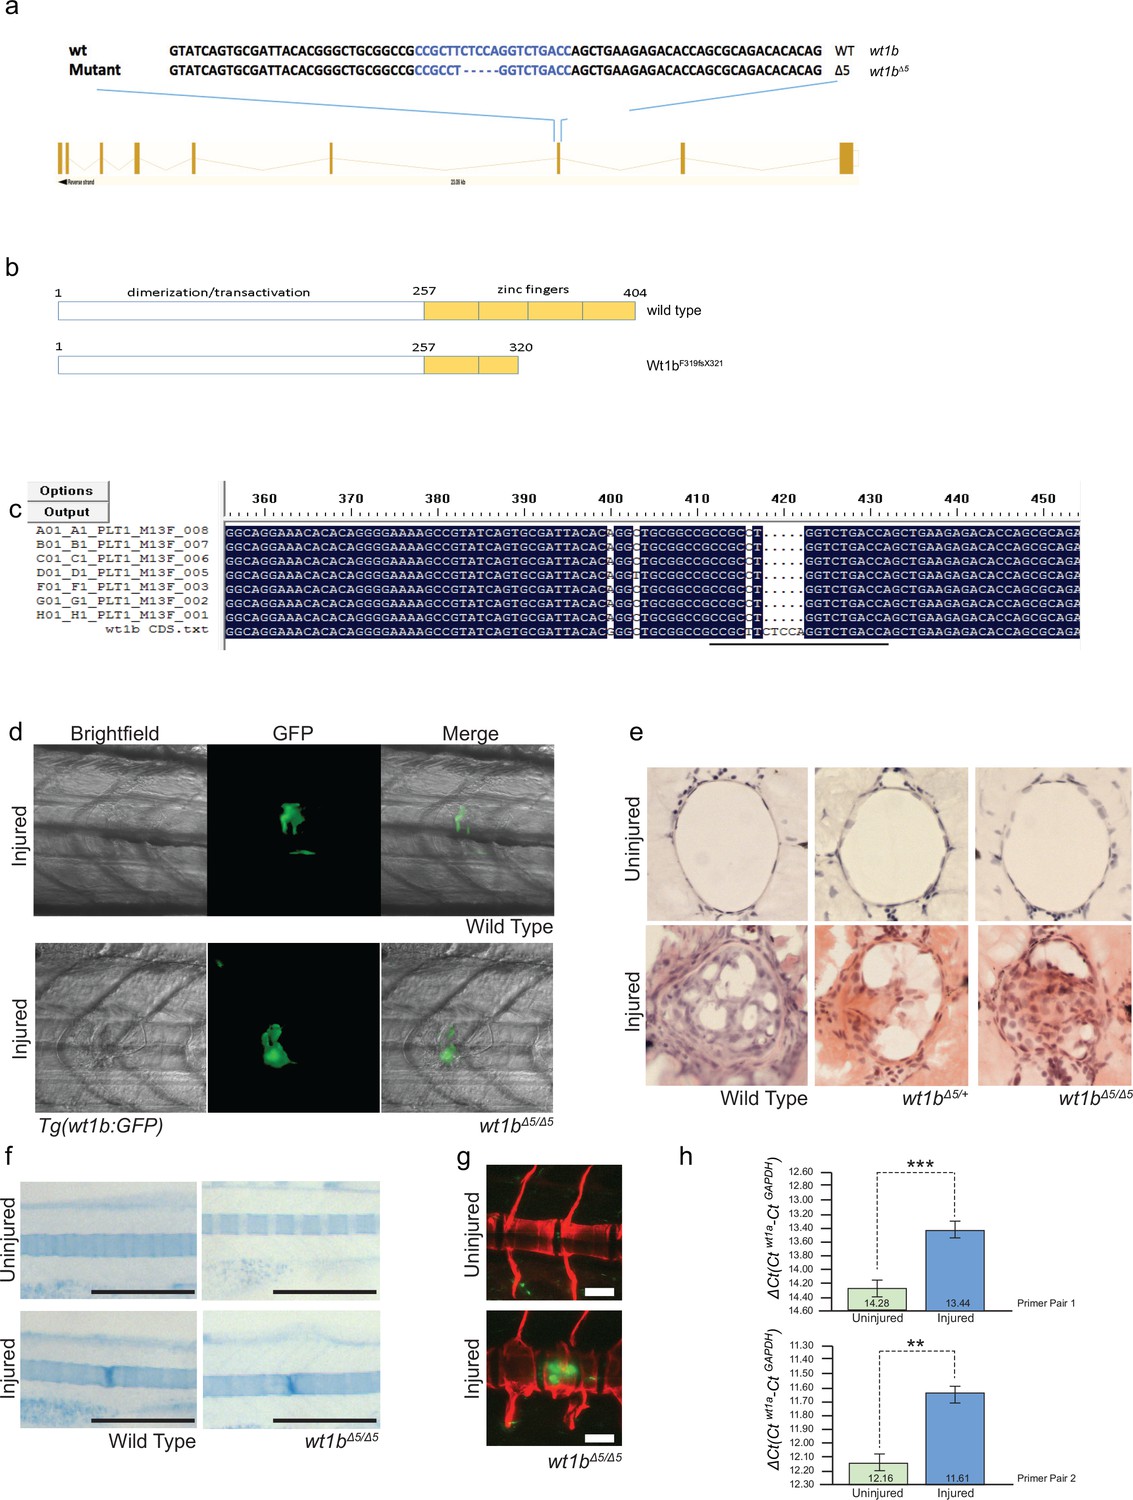
Generation of wt1b mutant zebrafish.
(a) Schematic showing the mutation induced by CRISPR/Cas9 in exon 7 of the wt1b gene and detailed sequence change in the mutant allele. The gRNA target sequence is depicted in blue and the mutation is 5 bp deletion within the 20 bp gRNA target. (b) Schematic showing predicated change in mutant Wt1b protein. Wt1b protein consists of a dimerization/transactivation domain in the N-terminus and four zinc finger domains in the C-terminal end of the protein. The 5 bp deletion in the wt1b gene results in a premature stop codon at amino acid 319, leading to a stop codon at 321 (F319fsX321). Numbering refers to amino acid number. (c) Confirmation of the mutation in wt1b mRNA from wt1b CRISPR mutant fish. Total RNA was prepared from homozygous wt1b CRISPR mutant embryos (3dpf), RT-PCR was performed to amplify the region covering the mutation. The PCR product was cloned into the pCR2.1TOPO vector and TA clones were sequenced with the M13 +primer. Sequences of TA clones were compared to wild type wt1b cDNA sequence by DNA alignment. All seven PCR fragments contain the 5 bp deletion (represented as dots). The 20 bp target sequence of guide RNA is underlined. (d) Images of Tg(wt1b:gfp); casper zebrafish trunk 3dpi following notochord needle injury in wild type and homozygous wt1b∆5/∆5 sibling controls. n > 5; experimental replicates >2. (e) H and E staining of histological sections of zebrafish notochord (cross section) 3dpi following notochord needle injury in wild type and homozygous wt1b∆5/∆5 sibling controls. n > 3; experimental replicates = 1. H and E: haematoxylin and eosin. (f) Alcian blue staining of wild type and wt1b∆5/∆5 larvae shows increased staining of vertebrae at the site of injury. Scale bar 500 µm. (g) Confocal scans of 24 dpi Tg(wt1b:GFP);wt1b∆5/∆5 larvae stained with alizarin red and expressing GFP at the injury site following notochord injury. GFP positive cells are present within the vertebrae at the injury site (lower panel) but not in other vertebrae in uninjured fish (top panel). Scale bar: 100 µm. (h) Results of quantitative real-time PCR (qRT-PCR) of wt1a with two different sets of primers (1 and 2). The y-axis indicates the difference between the cycle threshold (Ct) value of the gene of interest (wt1a) and the Ct value of gapdh in each sample. Note that the y-axis is inverted to ease interpretation. Bars represent standard deviation from the mean. Paired t-test. Primer set 1, ***p=0.001; Primer set 2, **p=0.009. paired t-test; Experimental replicates = 1 biological sample from 40 embryos pooled, tested with two independent primer sets. See Source Data file (Figure 8—figure supplement 1—source data 1).
-
Figure 8—figure supplement 1—source data 1
Raw data and statistical analyses for Figure 8—figure supplement 1h.
Results of quantitative real-time PCR (qRT-PCR) ofwt1awith two different sets of primers (1 and 2). The cycle threshold (Ct) value of the gene of interest (wt1a) and the Ct value ofgapdhare indicated for each sample. Subsequent calculations are also included Paired t-test. Primer set 1, *** p=0.001; Primer set 2, **p=0.009. Experimental replicates = 1 biological sample from 40 embryos pooled, tested with two independent primer sets.
- https://doi.org/10.7554/eLife.30657.022
Author response image 1
Videos
Video 1
Time-lapse imaging of two-photon microscopy of Tg (wt1b:gfp; R2col2a1a:mCherry) zebrafish larvae following needle injury over 48 hr. wt1b:gfp expression is upregulated in R2col2a1a:mCherry expressing notochord sheath cells upon needle injury, leading to the formation of a stopper like structure across the wound
Tables
Key resources table
| Reagent type or resource | Designation | Source or reference | Identifiers | Additional information |
|---|---|---|---|---|
| Gene (Danio Rerio) | sagff214a | NA | ZFIN ID: ZDB-ALT-110315–2 | |
| Gene (Danio Rerio) | wt1a | NA | ZFIN ID: ZDB-GENE-980526–558 | |
| Gene (Danio Rerio) | col2a1a | NA | ZFIN ID: ZDB-GENE-980526–192 | |
| Gene (Danio Rerio) | entpd5a | NA | ZFIN ID: ZDB-GENE-100419–1 | |
| Gene (Danio Rerio) | sox9b | NA | ZFIN ID: ZDB-GENE-001103–2 | |
| Gene (Danio Rerio) | wt1b | NA | ZFIN ID: ZDB-GENE-050420–319 | |
| Genetic reagent (Danio Rerio) | Tg(entpd5:kaede) | Geurtzen et al., 2014doi: 10.1242/dev.105817 | ZFIN ID: ZDB-ALT-150223–1: hu6867 | Same BAC used as Huitema et al. (2012) (DOI: 10.1073/pnas.1214231110) with kaede insertion at first translated ATG |
| Genetic reagent (Danio Rerio) | Tg(entpd5:pkRed) | This paper | ZFIN ID: hu7478 | Same BAC used as Huitema et al. (2012) (DOI: 10.1073/pnas.1214231110) with pkRed insertion at first translated ATG |
| Genetic reagent (Danio Rerio) | Tg(SAGFF214a;UAS:gfp) | Yamamoto et al. (2010) DOI: 10.1242/dev.051011 | ZFIN ID: ZDB-FISH-150901–18089 | |
| Genetic reagent (Danio Rerio) | Tg(wt1b:GFP,R2col2a1a:mCherry) | This paper | ZFIN ID: ZDB-ALT-180105–1; zfin.org:ue401Tg | |
| Genetic reagent (Danio Rerio) | Tg(wt1a:GFP) | Bollig et al. (2009) DOI: 10.1242/dev.031773 | ZFIN ID: ZDB-FISH-150901–2540 | |
| Genetic reagent (Danio Rerio) | Tg(wt1b:GFP) | Perner et al. (2007) DOI: 10.1016/j.ydbio.2007.06.022 | ZFIN ID: ZDB-FISH-150901–1774 | |
| Genetic reagent (Danio Rerio) | casper | White et al. (2008) DOI: 10.1016/j.stem.2007.11.002 | ZFIN ID: ZDB-ALT-990423–22 | |
| Genetic reagent (Danio Rerio) | zebrafish codon optimised cas9 mRNA | Jao et al. (2013) DOI: 10.1073/pnas.1308335110 | ||
| Genetic reagent (Danio Rerio) | Wt1b p.F319fsX321 | this paper | ZFIN ID: ZDB-ALT-180105–2; zfin.org:ue402 | zebrafish wt1b mutant line, mutation is in the exon coding the zinc finger 2 |
| Genetic reagent | Tol2 transposase | Kawakami, 2007 DOI: 10.1186/gb-2007–8 s1-s7 | ||
| Antibody | anti-WT1 (rabbit polyclonal) | This paper, Cambridge Research Biochemicals antibody production services | (1:25000); anti-WT1 was designed using the TARGET antibody production protocol from Cambridge Research Biochemicals using a conserved protein sequence from the C-terminal of the zebrafish Wt1a and Wt1b proteins. | |
| Antibody | AlexaFluor 488 antibody (rabbit polyclonal) | Invitrogen | Donkey anti-Rabbit IgG (H + L) Secondary Antibody, Alexa Fluor 488: R37602; RRID:AB_221544 | (1:800) |
| Antibody | anti-GFP (rabbit polyclonal) | Cell Signaling Technology | Cell Signaling Technology:GFP Antibody (Rabbit): 2555S; RRID:AB_10692764 | (1:1500) |
| Recombinant DNA reagent (plasmid) | R2-col2a1a:mCherry | Dale and Topczewski (2011) DOI: 10.1016/j.ydbio.2011.06.020 | ||
| Sequence-based reagent | wt1b mutant sgRNA | this paper | GGTCAGACCTGGAGAAGCGG | |
| Commercial assay or kit | Dako REAL EnVision Detection System kit | Dako | Dako REAL EnVision Detection System, Peroxidase/DAB+, Rabbit/Mouse: Code K5007 | |
| Commercial assay or kit | Low Input Quick Amp Labelling Kit | Agilent Technologies | Low Input Quick Amp Labeling Kit, one-color:5190–2305 | |
| Commercial assay or kit | Nextera XT DNA Library Preparation Kit (96 samples), | Illumina | Nextera XT DNA Library Preparation Kit (96 samples),: Cat: FC-131–1096 | |
| Commercial assay or kit | 4 × 44K Whole Zebrafish (V3) Genome Oligo Microarray | Agilent Technologies | ||
| Chemical compound, drug | DPX Mountant for histology | Sigma-Aldrich | DPX Mountant for histology:06522–100 ML | |
| Chemical compound, drug | ProLong Gold Antifade Mountant with DAPI | Invitrogen | ProLong Gold Antifade Mountant with DAPI: P36931 | |
| Chemical compound, drug | Trizol | Invitrogen | TRIzol Reagent:15596026 | |
| Chemical compound, drug | FACSmax cell disassociation solution | Genlantis | FACSmax Cell Dissociation Solution: AMS.T200110 | |
| Chemical compound, drug | OCT compound Tissue-Tek | Sifam Instruments LTD | OCT COMPOUND TISSUE-TEK: SIFAAGR1180 | |
| Chemical compound, drug | Nystatin | Sigma-Aldrich | Nystatin powder, BioReagent, suitable for cell culture: N6261-500KU | |
| Software, algorithm | Color Inspector 3D | ImageJ 1.51 n plugin | RRID:SCR_002285 | |
| Software, algorithm | Fiji | ImageJ 1.51 n | RRID:SCR_002285 | |
| Software, algorithm | Feature Extraction Software | Agilent Technologies | RRID:SCR_014963 | |
| Software, algorithm | Rsubread package | R-3.3.3; Liao et al. (2013). DOI: 10.1093/nar/gkt214 | RRID:SCR_009803 | |
| Software, algorithm | SCDE | Kharchenko et al. (2014) DOI:10.1038/nmeth.2967 | RRID:SCR_015952 | |
| Software, algorithm | SC3 package | Kiselev et al. (2017) DOI: 0.1038/nmeth.4236 | RRID:SCR_015953 | |
| Software, algorithm | Scater package | McCarthy et al., 2017 DOI:10.1093/bioinformatics/btw777 | RRID:SCR_015954 | |
| Software, algorithm | STAR RNA-seq aligner | Dobin et al. (2013) DOI: 10.1093/bioinformatics/bts635 | RRID:SCR_015899 | |
| Software, algorithm | FACSDiva software | Version 6.1.3; BD Biosciences | RRID:SCR_001456 | |
| Software, algorithm | Webgestalt | Wang et al. (2013) DOI: 10.1093/nar/gkt439 | RRID:SCR_006786 | |
| Software, algorithm | Rosetta Resolver gene expression data analysis system | Rosetta Biosoftware | RRID:SCR_008587 | |
| Other | Alizarin Red | Fisher Scientific | Alizarin Red S Sodium Salt25G:11329707 | |
| Other | Alcian Blue | Sigma | Alcian Blue 8Gx: A5268-10G |
Additional files
-
Supplementary file 1
(a) Single-cell differential expression list.
(b) Gene List Sources. (c) Zebrafish cartilage genes. (d) WT1 gene targets. (e) p53 gene targets. (f) WT1 and p53 shared gene targets
- https://doi.org/10.7554/eLife.30657.023
-
Supplementary file 2
List of primers used for qRT-PCR and genotyping.
- https://doi.org/10.7554/eLife.30657.024
-
Transparent reporting form
- https://doi.org/10.7554/eLife.30657.025
Download links
A two-part list of links to download the article, or parts of the article, in various formats.
Downloads (link to download the article as PDF)
Open citations (links to open the citations from this article in various online reference manager services)
Cite this article (links to download the citations from this article in formats compatible with various reference manager tools)
Wilms Tumor 1b defines a wound-specific sheath cell subpopulation associated with notochord repair
eLife 7:e30657.
https://doi.org/10.7554/eLife.30657


