Genetically tunable frustration controls allostery in an intrinsically disordered transcription factor
- Johns Hopkins University, United States
- University of Houston, United States
Figures
Figure 1 with 1 supplement
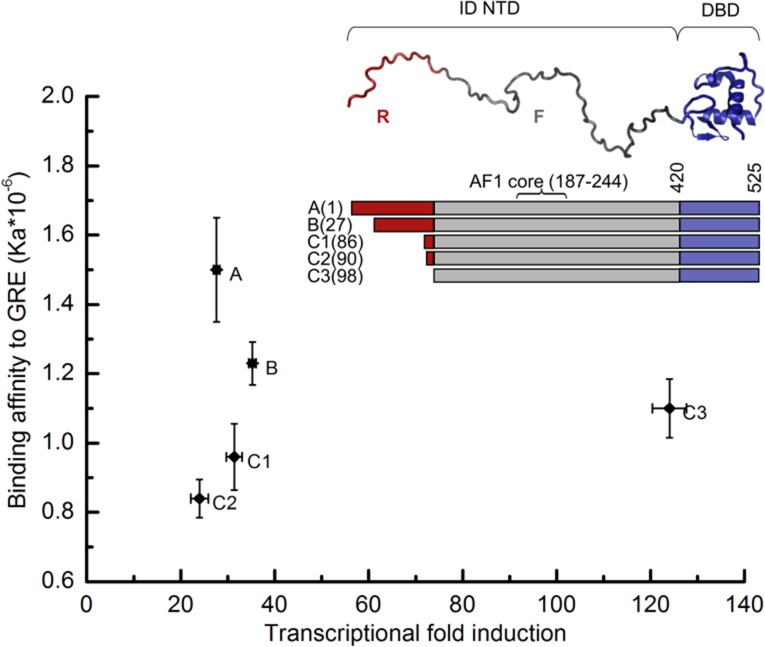
Transcriptional activity and DNA-binding affinity are not correlated among GR translational isoforms.
Transcriptional activity, monitored by dual luciferase reporter assay (Figure 1—figure supplement 1a and b''), and binding affinity to DNA, monitored by fluorescence anisotropy change (Figure 1—figure supplement 1c and d), show uncorrelated behavior. Inset: Domain organization of the constitutively active GR constructs for translational isoforms, wherein the intrinsically disordered N terminal domain (NTD) varies in length. Residues 1–97 (red) are labeled R (for Regulatory) and residues 98–420 (grey) are labeled F (for Functional). Also labeled are residues corresponding to the activation function 1 core (AF1 core) region, which is required for transcriptional activity (Ford et al., 1997). Error bars represent uncertainty of the individual fits.
Figure 1—figure supplement 1

Transcriptional activity and DNA-binding affinity of GR translational isoforms.
(a) Luciferase assay dosage curves for the constitutively active constructs of the eight GR translational isoforms. Per 30,000 cells, a constant 40 ng of GRE-driven luciferase vector was transfected, and the amount of GR vector co-transfected was increased from 0 ng to 5 ng. Errors are calculated from three samples. Curves are fitted to the data using the dose-response function, . Amax represents the maximum transcriptional activity for each construct, and EC50 represents the amount of GR construct transfected at the half-maximum transcriptional activity. C is the amount of GR construct transfected at each data point. p is an empirical value introduced in the fitting equation, to transform DNA vector amount to protein expression amount, to account for the possibility that different isoforms have different degradation rates, expression levels, nuclear localizations and/or cooperativities. Inset: Western blot showing that U-2 OS cells transiently transfected with the expression plasmid for each isoform express each of them. (b) Luciferase assay dosage curve keeping each GR isoform vector constant at 4 ng per 30,000 cells, while gradually increasing the GRE-driven luciferase vector from 0 ng to 40 ng. Data were fitted by a linear function. (This indicates that 5 ng GR isoform construct can saturate the 40 ng GRE driven luciferase vector.) Errors are the standard deviations of three independent samples. (c) Fluorescence anisotropy of the 6-FAM-labeled half site GRE (5’-gcgcAGAACAggagcgc-3’) as a function of GR translational isoform concentration. Binding was conducted with 25 nM 6-FAM labeled GRE in buffer containing 10 mM HEPES (pH7.6), 80 mM NaCl, 1 mM EDTA, 5 mM MgCl2, 1 mM DTT, 10% glycerol, 200 ug/mL BSA and 5 µM control non-specific 17-mer oligo. Curves represent fits to the data with a single-site-binding model. (d) Correlation between the EC50 fitted from the in vivo dosage curve as shown in panel a and the in vitro binding affinity as shown in panel c, demonstrating that the in vitro binding affinity represents the in vivo binding. Error bars represent uncertainty of the fits, as returned by the default settings of Mathematica’s NonLinearModelFit function. (e) Competitive transfection assay comparing D1, D2, D3 and DBD, against titration of a constant amount of C3 isoform (which has the highest activity). The transcription activity of C3 isoform in absence of competitors was normalized to 1. Data were fitted with dose-response function, . In this equation, Acompetitor represents the transcriptional activity when 16 ng of competitor is transfected alone, EC50 represents the co-transfected amount of competitor construct that results in half the activity of the C3 maximum. C is the amount of competitor construct transfected at each data point. p is an empirical value described in panel a. Inset: correlation between the EC50 fitted from the competitive binding assay and the in vitro measured binding affinity for D1, D2 and D3 isoforms (as obtained from panel c). Errors reflect uncertainties of the individual fits, as returned by the default settings of Mathematica’s NonLinearModelFit function. The correlation demonstrates that the competitive transfection assay provides qualitative information about the binding affinity of each inactive construct. (f). Multicolor immunostaining of U-2 OS cells transfected with A, B, C1, C2, C3, D1, D2 and D3 constructs. Green: Alexa 488 linked goat anti-mouse IgG staining GR. Blue: DAPI staining nuclei. Red: Rhodamine Phalloidin staining F-actin. (g) Nuclear localization efficiency for the eight GR translational isoforms. Nuclear percentage is calculated by dividing the intensity of the green dye overlapped with blue dye with the total green dye intensity as shown in panel f. Three pictures were used for each isoform for the quantification. Average values and standard errors of the mean are reported in the graph.
Figure 2 with 1 supplement

Coupling of the R-domain and DBD to the functional F-domain in GR.
(a) TMAO-induced folding for the F-domain alone and with either the R-domain or the DBD. (b) Protease sensitivity assay: comparing F-domain and F-domain with R-domain (left) performed at a protein (1 mg/ml): trypsin mass ratio of 1000:1 (Li et al., 2012); comparing F-domain and F-domain with DBD (right) performed at a protein (1 mg/ml): trypsin mass ratio of 100:1. Note: each protein pair (i.e. F vs. R-F and F vs. F-DBD) was run on the same gel, with the intervening lanes removed in the figure for clarity. (c) Luciferase assay for C3 isoform (GR F-DBD) versus chimeric construct (GR F-Gal4 DBD). We note that data for the R-F and F domains in panels (a) and (b) are the same as presented in Li et al., 2012 to allow for direct comparison of the opposing effects of the DBD and the R-domain on the F-domain.
Figure 2—figure supplement 1
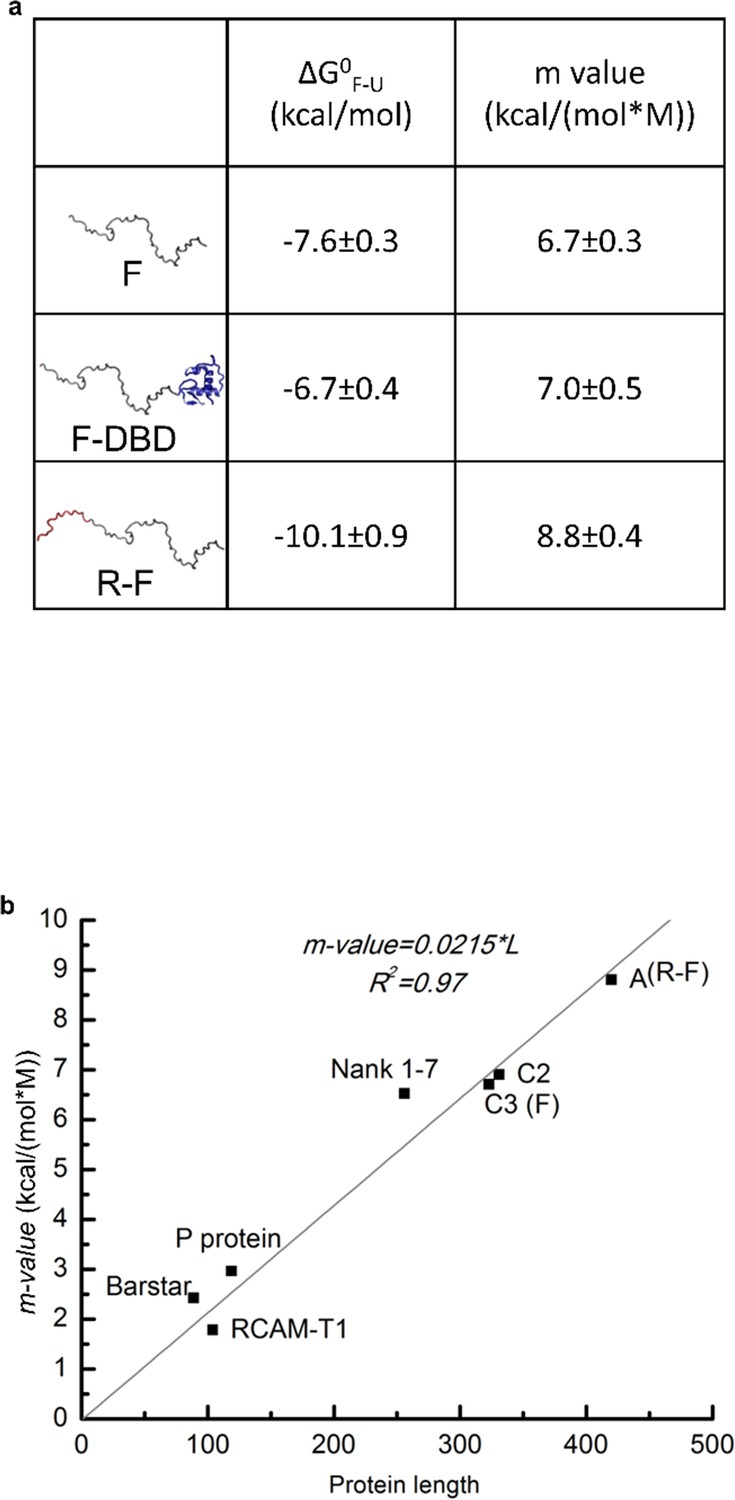
Domain stabilities determined by TMAO-induced protein folding transitions.
(a) Thermodynamic parameters obtained from TMAO-induced folding experiments demonstrate that DBD stabilizes a folded conformation of the F-domain while the R-domain destabilizes that conformation. Parameter values obtained from the fits of the TMAO-induced folding data for the constructs shown in Figure 2a. See previous publication (Li et al., 2012) for details. Because the thermodynamic analyses report on the free energy differences and not the mechanistic bases of the energy differences, the reported free energies of folding () may not necessarily reflect the stability of unique conformations. Instead, they may be reporting on the stability of a conformationally heterogeneous ensemble. Toward this end, it has been reported that ID proteins may adopt poly-beta sheet formations (Han et al., 2012) as part of their functional states. As the effect of TMAO on structure is almost entirely defined by the influence on backbone atoms (i.e. excluding backbone hydrogen bond donors and acceptors from solvent) (Auton and Bolen, 2005), any state or ensemble of states that facilitates removal of backbone atoms from solvent will be stabilized by TMAO. As such, the current analysis provides evidence that a functional state exists whose probability is proportional to transcriptional activation. However, the structural properties of that state are not known. (b) Comparison of the m-values fitted from TMAO induced folding of F-domain and R-F with the published m-values for known representative globular proteins (see previous publication (Li et al., 2012) for details). The m-value comparison suggests that the F-domain and R-domain can adopt folded conformations similar to globular proteins in terms of surface area buried upon folding. We note that the data in (b) are the same as presented in Li et al., 2012 (Figure 4a), according to the current nomenclature, wherein the R-F construct is equivalent to the A isoform of NTD and the F construct is equivalent to the C3 isoform of NTD.
Figure 3
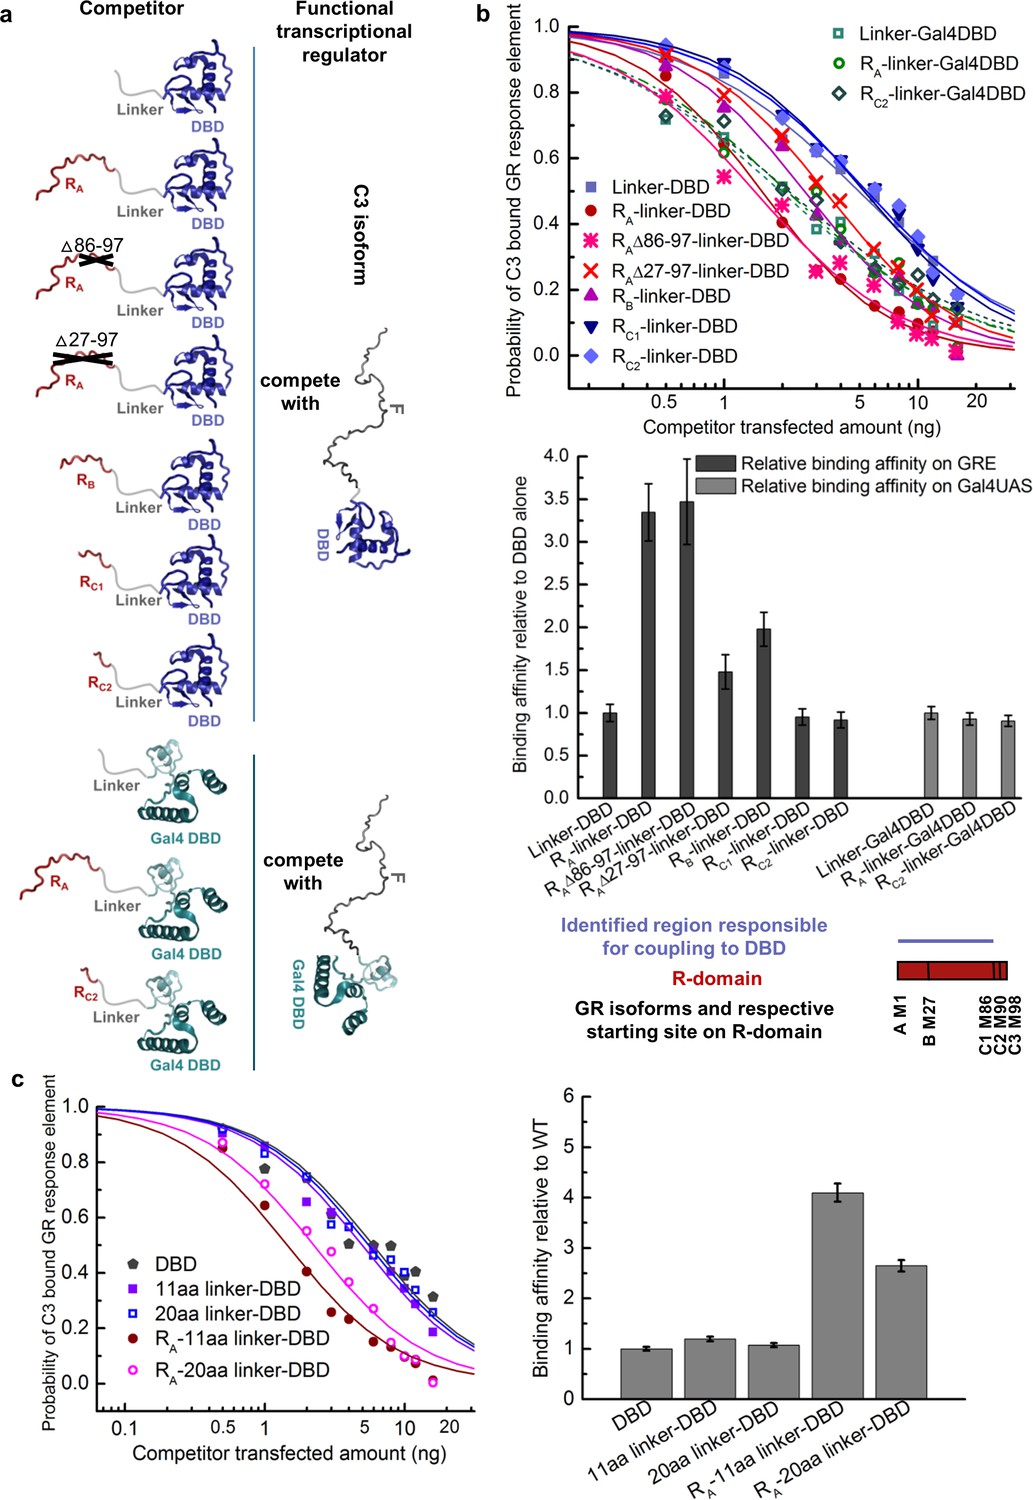
Coupling between the R-domain and DBD in GR.
(a) Schematic representation of competitive transfection assay design for constructs of the R-domains of isoforms A, B, C1, and C2 as well as the internally truncated R-domain linked to GR DBD or Gal4 DBD. (b) Experimental competitive transfection assay for constructs shown in a. The first 86 residues of R-domain present in GR A and B isoforms significantly increase the binding affinity of the DBD to GRE. Linking the R-domains to the Gal4 DBD ablate coupling. (c) Linkers of 11aa and 20aa were compared for the effect when connected alone to the GR DBD or used to link the R-domain (GR 1–97 segment) to the DBD. Linker length in panel a and all the other figures is 11aa. Error bars represent uncertainty of the individual fits.
Figure 4

Competing thermodynamic coupling in GR produces frustration.
(a) Schematic view of the thermodynamic configuration of GR. According to this convention, the positive (+) signs between the DBD and F-domain, and the DBD and R-domain signify they are positively coupled; stabilization of one domain stabilizes the other. The negative (-) sign between the R- and the F- domains indicate they are negatively coupled; stabilization of one domain destabilizes the other. Thus, the combination of the positive coupling between DBD and R-domain, and the negative coupling between R- and F-domains produces an overall repression (red semicircle) from the effect that is mediated through the R-domain. Triplet arrows are an abbreviation to describe all the couplings in the system: first arrow indicates the coupling between DBD and F-domain, second arrow indicates coupling between R-domain and F-domain, and third arrow indicates coupling between DBD and R-domain. Green (up) arrow indicates positive coupling and red (down) arrow indicates negative coupling. Importantly for this equilibrium scheme, any permutation containing an even number of up arrows will be energetically frustrated. (b) Schematic representation of all possible thermodynamic configurations for three interacting domains (represented in the structural and spin (up or down arrows) nomenclatures). Four of the possible configurations produce frustration between the DBD and the F-domain (top), whereas four configurations do not produce frustration (bottom), representing the cases of activation and repression, respectively. Note the curved arrows connecting the domains are colored according to the overall effect on F-domain from stabilizing the DBD; this coloring scheme highlights the result that frustrated configurations result from opposing energetic couplings affecting the F-domain stability. For example, in case i (Top, Left), stabilization of the DBD destabilizes the R-domain due to the negative coupling energy, signified by the red curved arrow between domains. However, the destabilization of the R- domain has the effect of also destabilizing the F-domain, because the F- and R- domains are positively coupled. Thus, the overall effect of stabilizing the DBD is to destabilize the F-domain through its interaction with the R-domain, signified by the red curved arrow between the R- and F- domains (even though the coupling between R-F alone is positive).
Figure 5 with 1 supplement
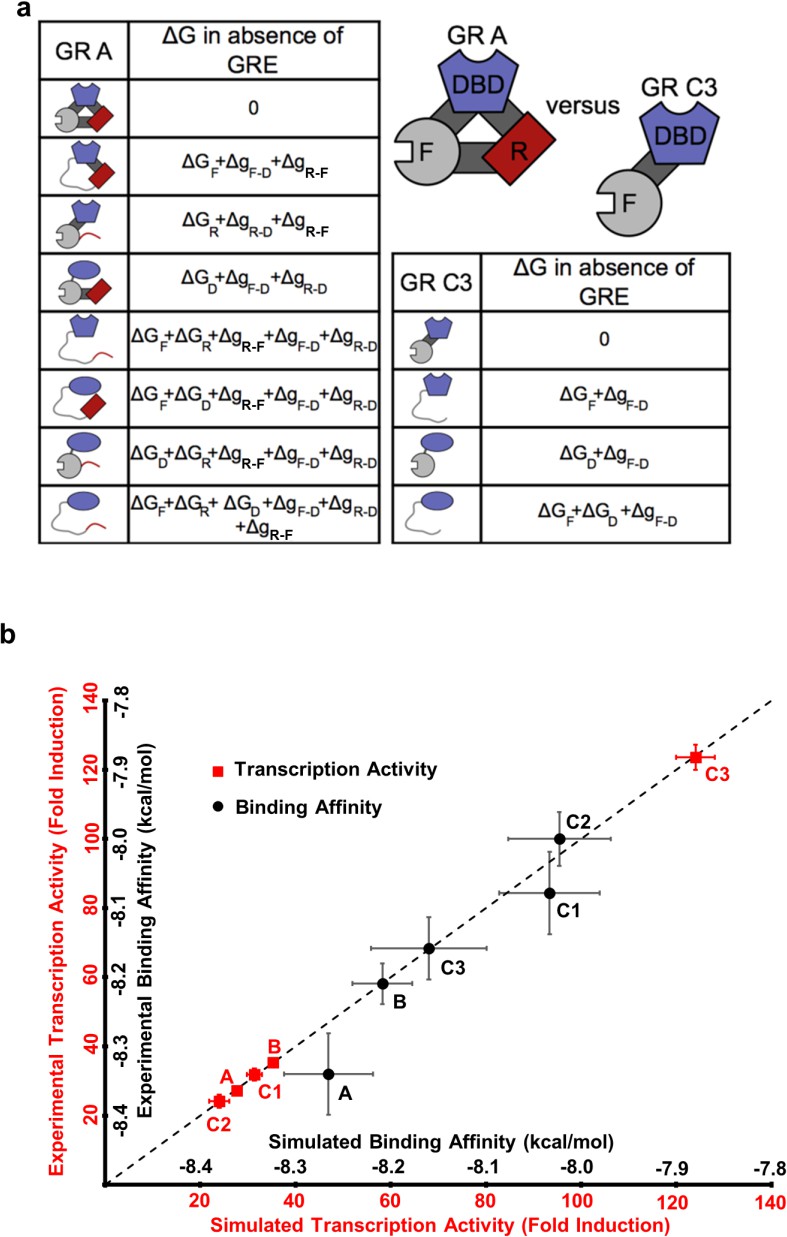
The ensemble allosteric model (EAM) quantitatively describes GR transcriptional activation.
(a) EAM for GR A and C3 isoforms. (b) The model recapitulates the DNA-binding affinity and relative transcriptional activity of A, B, C1, C2, and C3 isoforms. Error bars on experimental data represent uncertainty of the individual fits. Error bars on simulated data are average results from propagation of experimental error through the model.
Figure 5—figure supplement 1
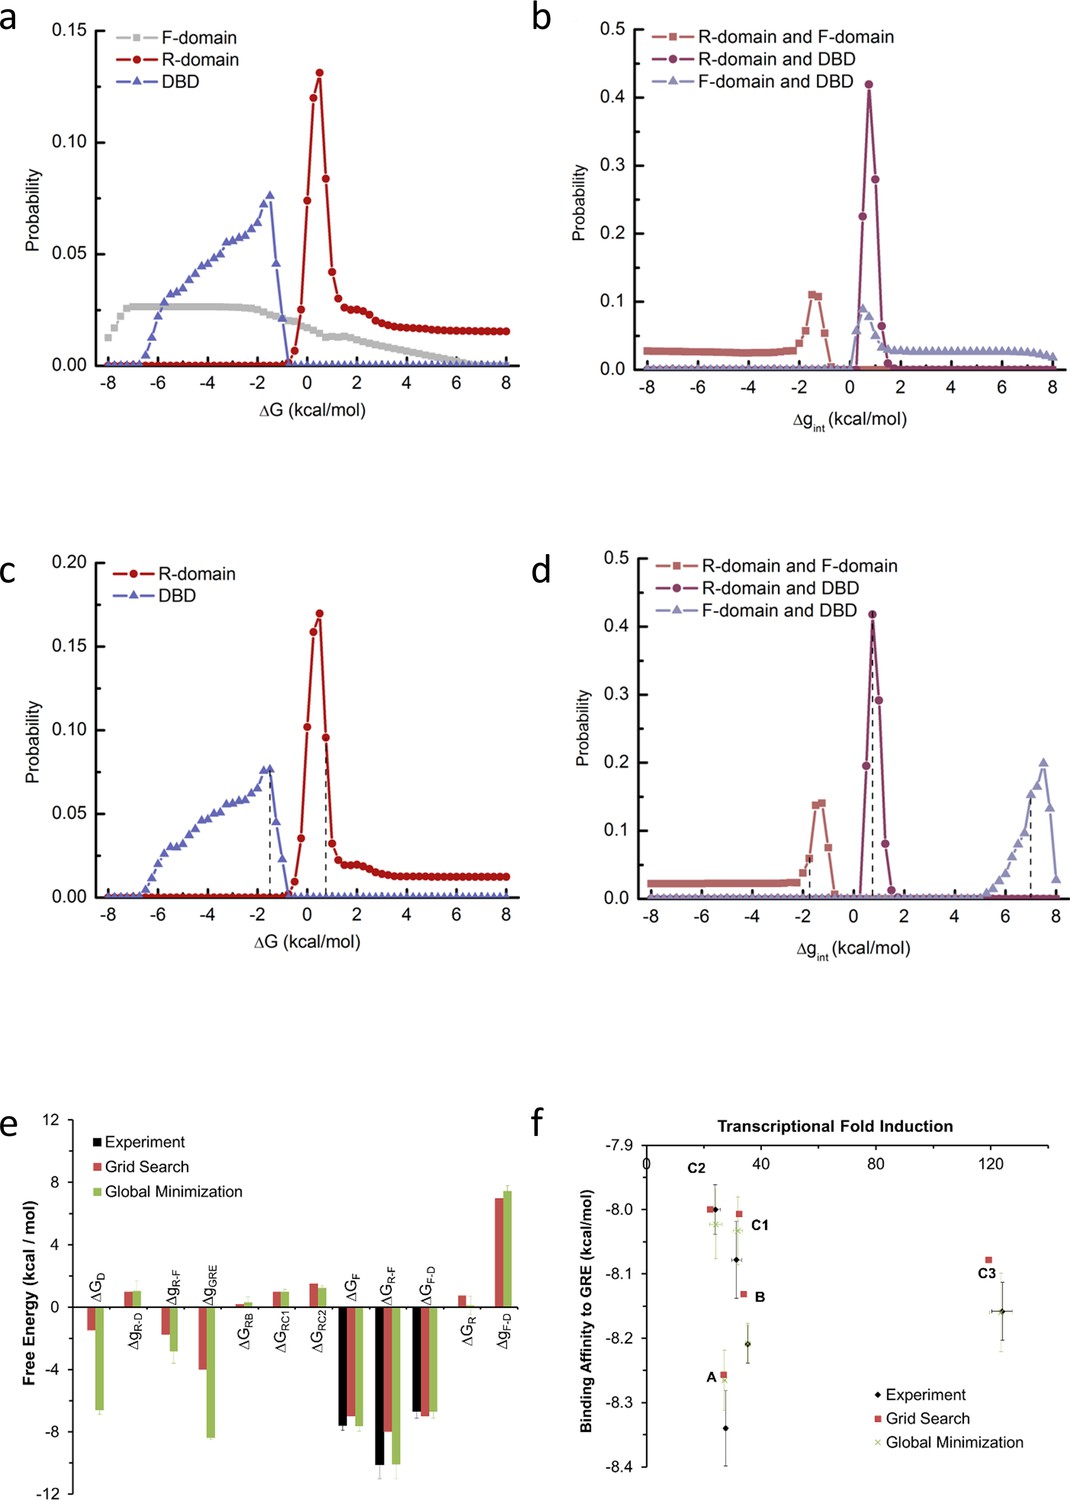
Probability distribution of each thermodynamic parameter from EAM.
Two independent methods were used to estimate parameters for the EAM from experimental data. The first method was a ‘brute force’ grid search for parameter combinations that satisfied the experimental transcriptional activity and binding affinity data, and the second method used unbiased global minimization of a chi-squared merit function against the experimental transcriptional activity and binding affinity data, as implemented in the attached Mathematica notebook. Panels a-d are relevant to the first method, and panels e-f demonstrate that the resulting estimates from both methods were robustly similar in sign and magnitude. The first method was exhaustive subject to the following reasonable parameter space constraints (the second method was subject to no constraints): (1) full length isoform A has higher binding affinity and lower transcriptional activity than C3 isoform (as experimentally demonstrated in Figure 1 and Figure 1—figure supplement 1a–d); (2) The probability of the high-affinity state of A isoform is less than 40%, as A isoform’s binding affinity is more than 2.5 fold lower than D2 isoform, which has highest binding affinity among all the translational isoforms (as experimentally demonstrated in Figure 1 and Figure 1—figure supplement 1c–d); (3) RA-linker-DBD construct has higher binding affinity than linker-DBD construct (as experimentally demonstrated in Figure 3b); (4) In presence of GR response element, the sum of probability of the functional states (with F-domain in the folded conformation and the DBD in the high-affinity state) is larger than 5%, which is consistent with the possibility of a large population increase upon a small energetic stabilization, such as a binding event to co-regulators. During the parameter space search, each stability term was explored from −8 kcal/mol to +8 kcal/mol, with a step size of 0.25 kcal/mol, thus the search was exhaustive within a resolution of that increment. (a) Probability distribution plot of the stability of the F-domain, the R-domain and the DBD (with the folded conformation or high-affinity state as reference). (b) Probability distribution plot of the interaction energy between the R-domain and the F-domain, the R-domain and the DBD and the F-domain and the DBD. As shown in panel a, the distribution of the F-domain stability has high uniform probability between −7.5 kcal/mol and −2 kcal/mol, consistent with its experimental stability of −7.6 ± 0.3 kcal/mol measured by in vitro TMAO folding (Figure 2a and Figure 2—figure supplement 1a). Thus, to save computational time, the parameter space search was carried out again by fixing F-domain stability at −7 kcal/mol and exhaustively scanning the other parameters. Under such conditions, the probability distribution of the stabilities of the R-domain and the DBD are shown in panel c and the distributions of the interaction energies between domains are shown in panel d. A range of parameter combinations can satisfy the experimental constraints, but it is important to emphasize that with no parameter does the sign of the energy change. With any such set of parameter combinations, the simulated transcriptional activity and the simulated binding affinity of C3 isoform can be calculated as relative to A isoform. Calculating the RMSD between these simulated values and experimental data was employed as a useful heuristic to assess which sets of the parameter combinations best simulated the experimental observations. Another useful heuristic, a ‘distribution score’, was employed to assess how well a chosen parameter compared to the mode of its distribution. One arbitrarily chosen set of parameters exhibiting reasonable compromise between a minimum RMSD and a maximum ‘distribution score’ was the following: (=−1.0 kcal/mol, = 0.75 kcal/mol, = −7 kcal/mol, = 0.75 kcal/mol, = −1.75 kcal/mol, and = 7.0 kcal/mol (positions of these values were labeled with dashed lines in panels c and d). This set was used to calculate the simulated transcriptional activity and binding affinity from EAM as shown in Figure 5b, Figure 6b and e, and Figure 6—figure supplement 1g–i. (e) Domain stabilities and interaction energies estimated by the two methods are similar in sign and magnitude. To demonstrate robustness of the global minimization, experimental errors from the stability measurements were propagated through the model. Error bars represent the standard deviations of 10 independent minimizations. (f) Parameter estimates from both methods were used with the EAM to compute expected transcriptional activity and binding affinity. Reasonable agreements with experiment data were obtained from both methods.
Figure 6 with 1 supplement
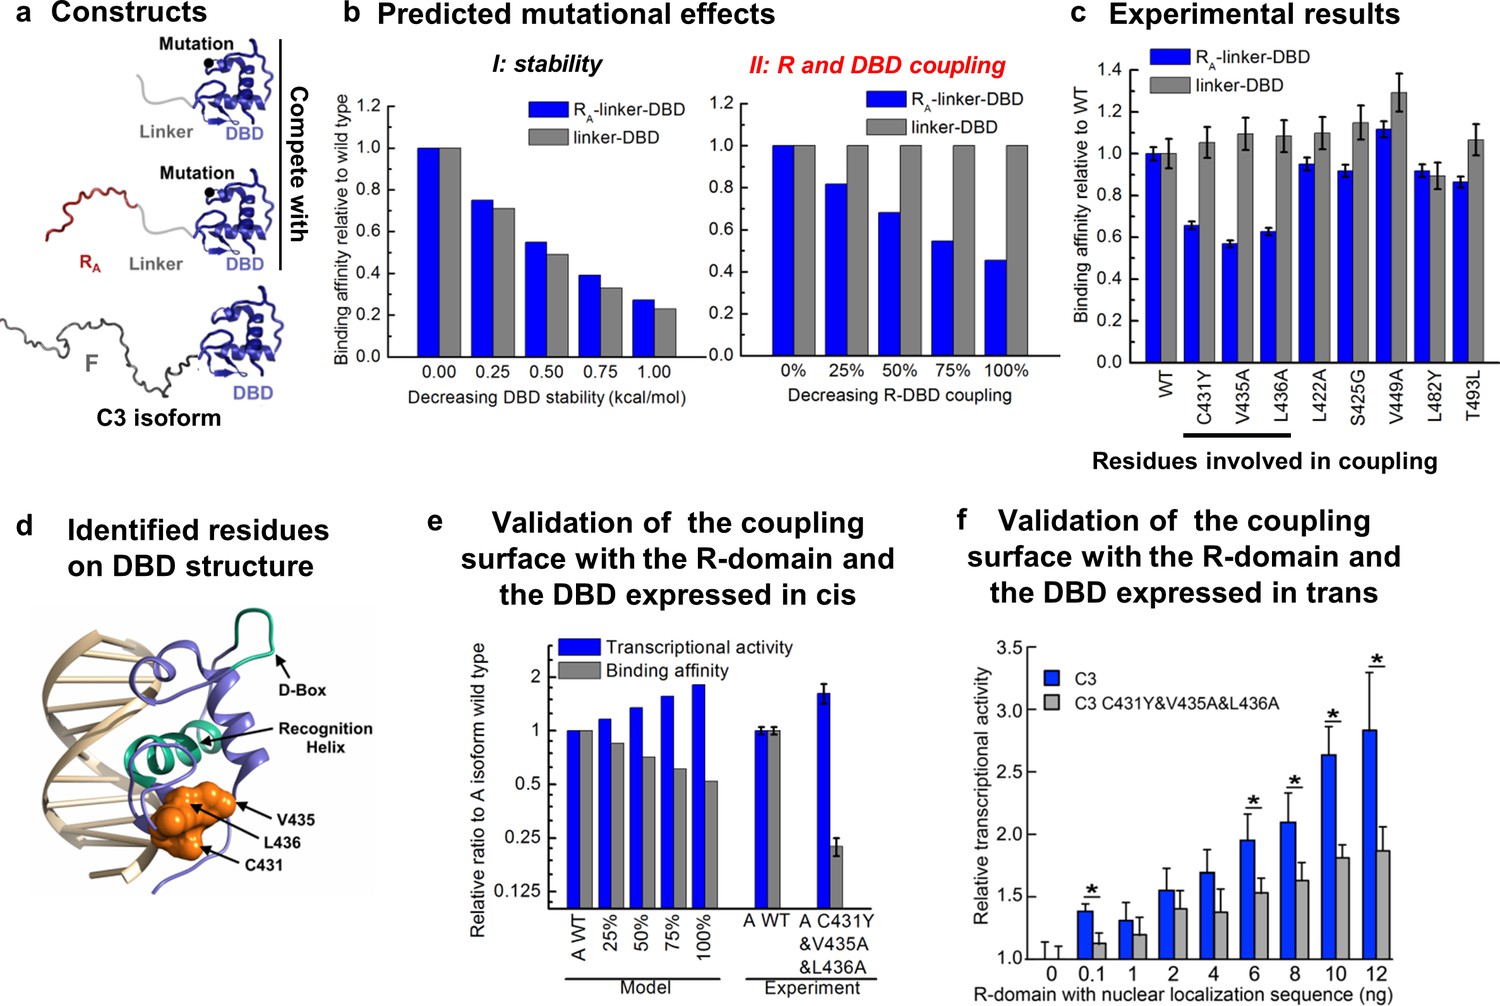
Contiguous surface mediates coupling between the DBD and the R-domain.
(a) Schematic representation of the constructs used to identify residues on DBD involved in coupling to the R-domain. (b) EAM predicted changes in binding affinity for mutations that affect the stability of the DBD (left) or the coupling of the R-domain and the DBD (right) in the different constructs shown in a. (c) Experimental competitive transfection assays for single point mutants of both constructs shown in a. Error bars reflect uncertainty of the individual fits. (d) Cartoon of the proposed DBD surface (orange) involved in the coupling interaction with the R-domain. Shown also are the known DNA recognition helix (green helix) and the known dimerization interface (green loop). (e) Independent validation of the proposed coupling surface using the wild type and triple mutant of the A isoform, where the R-domain and the DBD are expressed in cis. The EAM predicted changes in transcriptional activity and DNA-binding affinity for mutations influencing the R-domain and the DBD coupling (from 25% to 100%) on A isoform (Model, left set of bars). Influence of the triple mutations (C431Y&V435A&L436A) on the transcriptional activity and the binding affinity obtained from the luciferase dosage curve of the A isoform (Experiment, right bars, detailed in Figure 6—figure supplement 1e and f). Error bars reflect uncertainty of the individual fits. (f) Independent validation of the proposed coupling surface with the wild type and the triple mutant of the C3 isoform, with the R-domain expressed in trans. Dual luciferase assay showing the wild type and the triple mutant (i.e. C431Y/V435A/L436A) versions of the GR C3 isoform titrated with R-domain, expressed with a nuclear localization sequence and Flag tag. Error bars are 95% confidence intervals and the asterisks indicate differences that are significantly different (p<0.01) by a T-test with the Benjamini-Hochberg correction for multiple tests. The y-axis is normalized to the initial, 0 ng point for each dataset. The EAM predictions in Panels b and e utilize parameters described in Figure 5—figure supplement 1c and d.
Figure 6—figure supplement 1
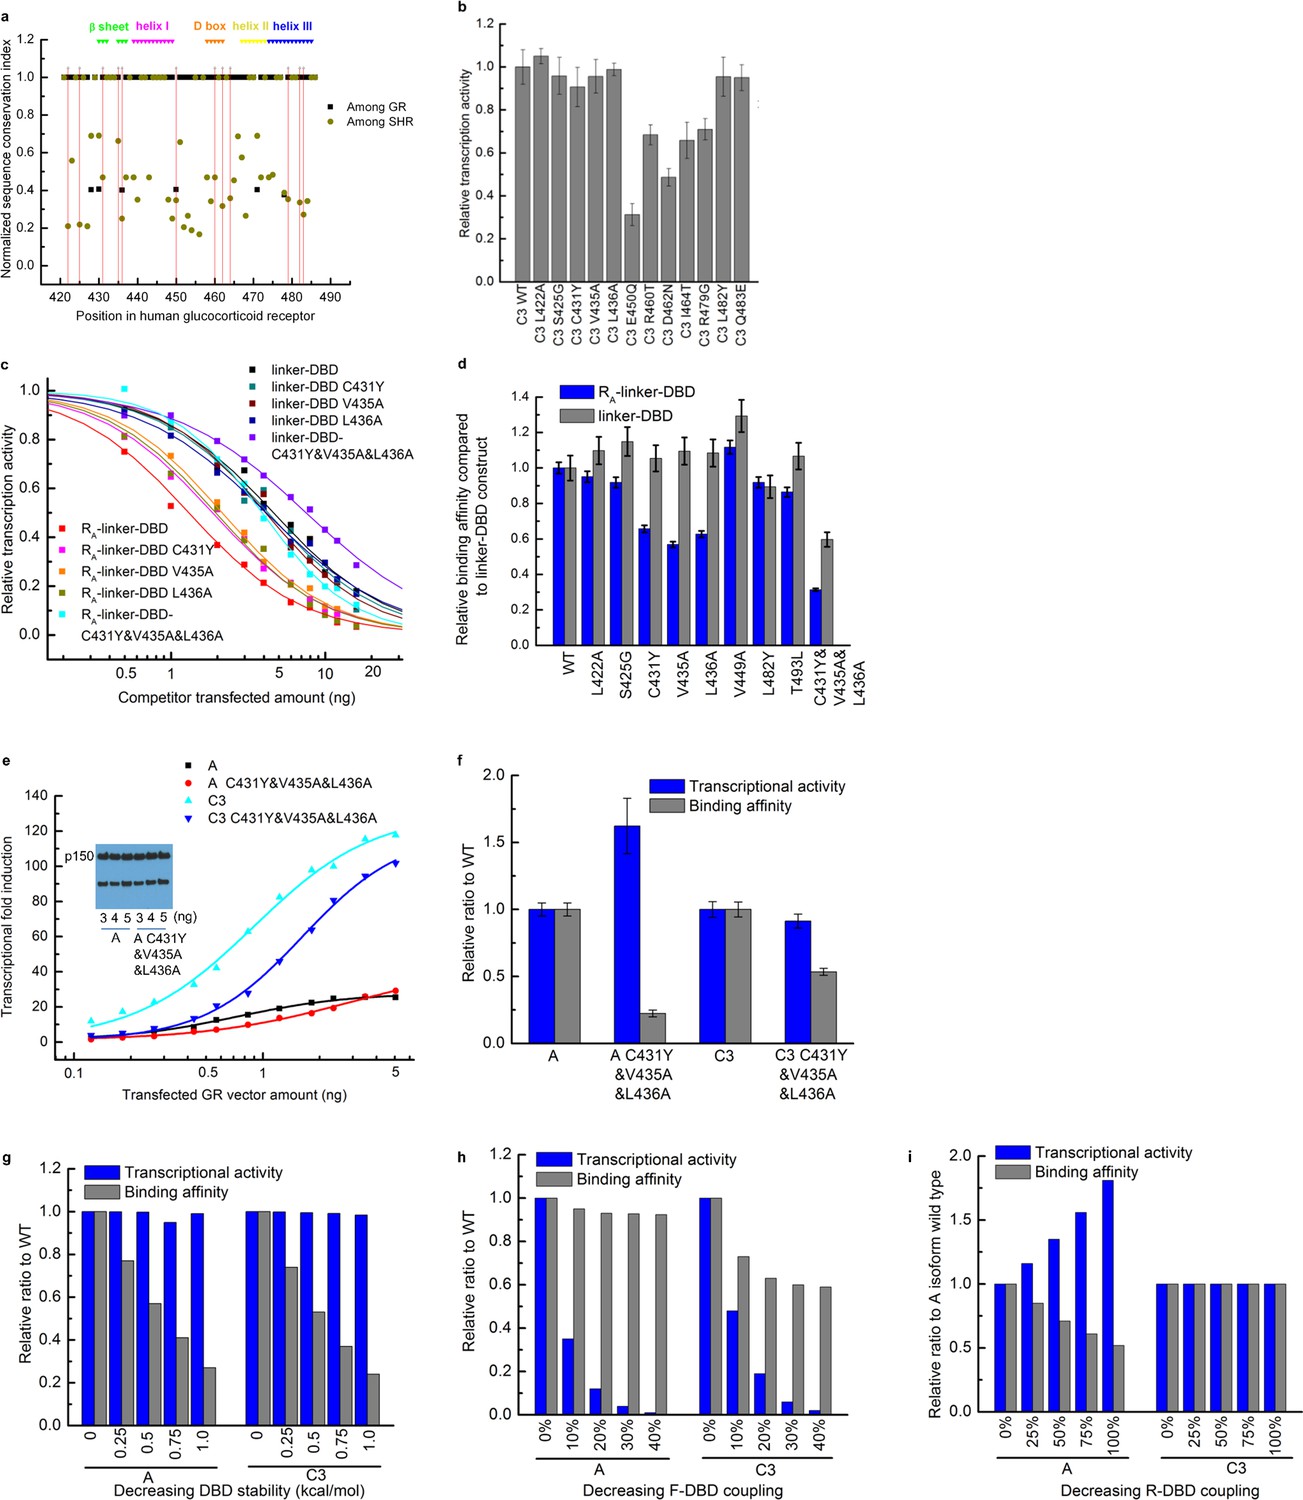
Mutagenesis used to identify the residues in the DBD that mediate the coupling to the R-domain.
(a) Sequence conservation analysis of the DBD among the GRs in different species and among all members in the steroid hormone receptor family. Above is the secondary structure annotation of the GR DBD. Red lines label mutations on DBD investigated in this study. (b) Influence on the transcriptional activity of single point mutations carried out within DBD, on the C3 isoform. Mutations (L422A, S425G, C431Y, V435A, L436A, L482Y and Q483E) did not influence DNA-binding affinity or the coupling between DBD and F-domain, as these mutations did not significantly decrease the transcriptional activity. (c) Competitive transfection assay testing mutations (L422A, S425G, C431Y, V435A, L436A, V449A, L482Y and T493L) identified in Panel b using the linker-DBD and RA-linker-DBD constructs. Curves are shown for the mutations with different effect on the two constructs. (d) EC50 was fitted from each competitive transfection curve (shown in c) and expressed as relative binding affinity to wild-type construct. (e) Luciferase assay dosage curves for the triple mutants A C431Y&V435A&L436A and C3 C431Y&V435A&L436A compared to their respective wild types A and C3. Curves are fitted to the data using the dose-response function, . Data fitting details are described in the Supplementary Figure 1a legend. (f) Maximum transcriptional activity and binding affinity of the triple mutants of A and C3 isoforms expressed as relative to their wild types. The effect on transcriptional activity and binding affinity of A and C3 isoforms by mutating residues on DBD can be predicted by the EAM for three scenarios: decreasing the DBD stability (g), decreasing the coupling between the F-domain and the DBD (h), and decreasing the coupling between the R-domain and the DBD (i). Comparing the experimental result (shown in panel f) with the EAM predictions confirms that the triple mutations C431Y/V435A/L436A significantly decrease the coupling between the R-domain and the DBD.
Additional files
-
Supplementary file 1
Mathematica notebook for data fitting.
- https://doi.org/10.7554/eLife.30688.013
-
Transparent reporting form
- https://doi.org/10.7554/eLife.30688.014
Download links
A two-part list of links to download the article, or parts of the article, in various formats.
Downloads (link to download the article as PDF)
Open citations (links to open the citations from this article in various online reference manager services)
Cite this article (links to download the citations from this article in formats compatible with various reference manager tools)
Genetically tunable frustration controls allostery in an intrinsically disordered transcription factor
eLife 6:e30688.
https://doi.org/10.7554/eLife.30688


