Aversive stimuli drive hypothalamus-to-habenula excitation to promote escape behavior
- Institut du Fer à Moulin, Inserm UMR-S 839, France
- The University of Lausanne, Switzerland
- University Medical Center Utrecht, Netherlands
- The Francis Crick Institute, United Kingdom
- University Clinic of Bonn, Germany
- Neurodegeneratives Diseases Institute, France
- Centre National de la Recherche Scientifique, Neurodegeneratives Diseases Institute, France
Figures
Figure 1 with 2 supplements
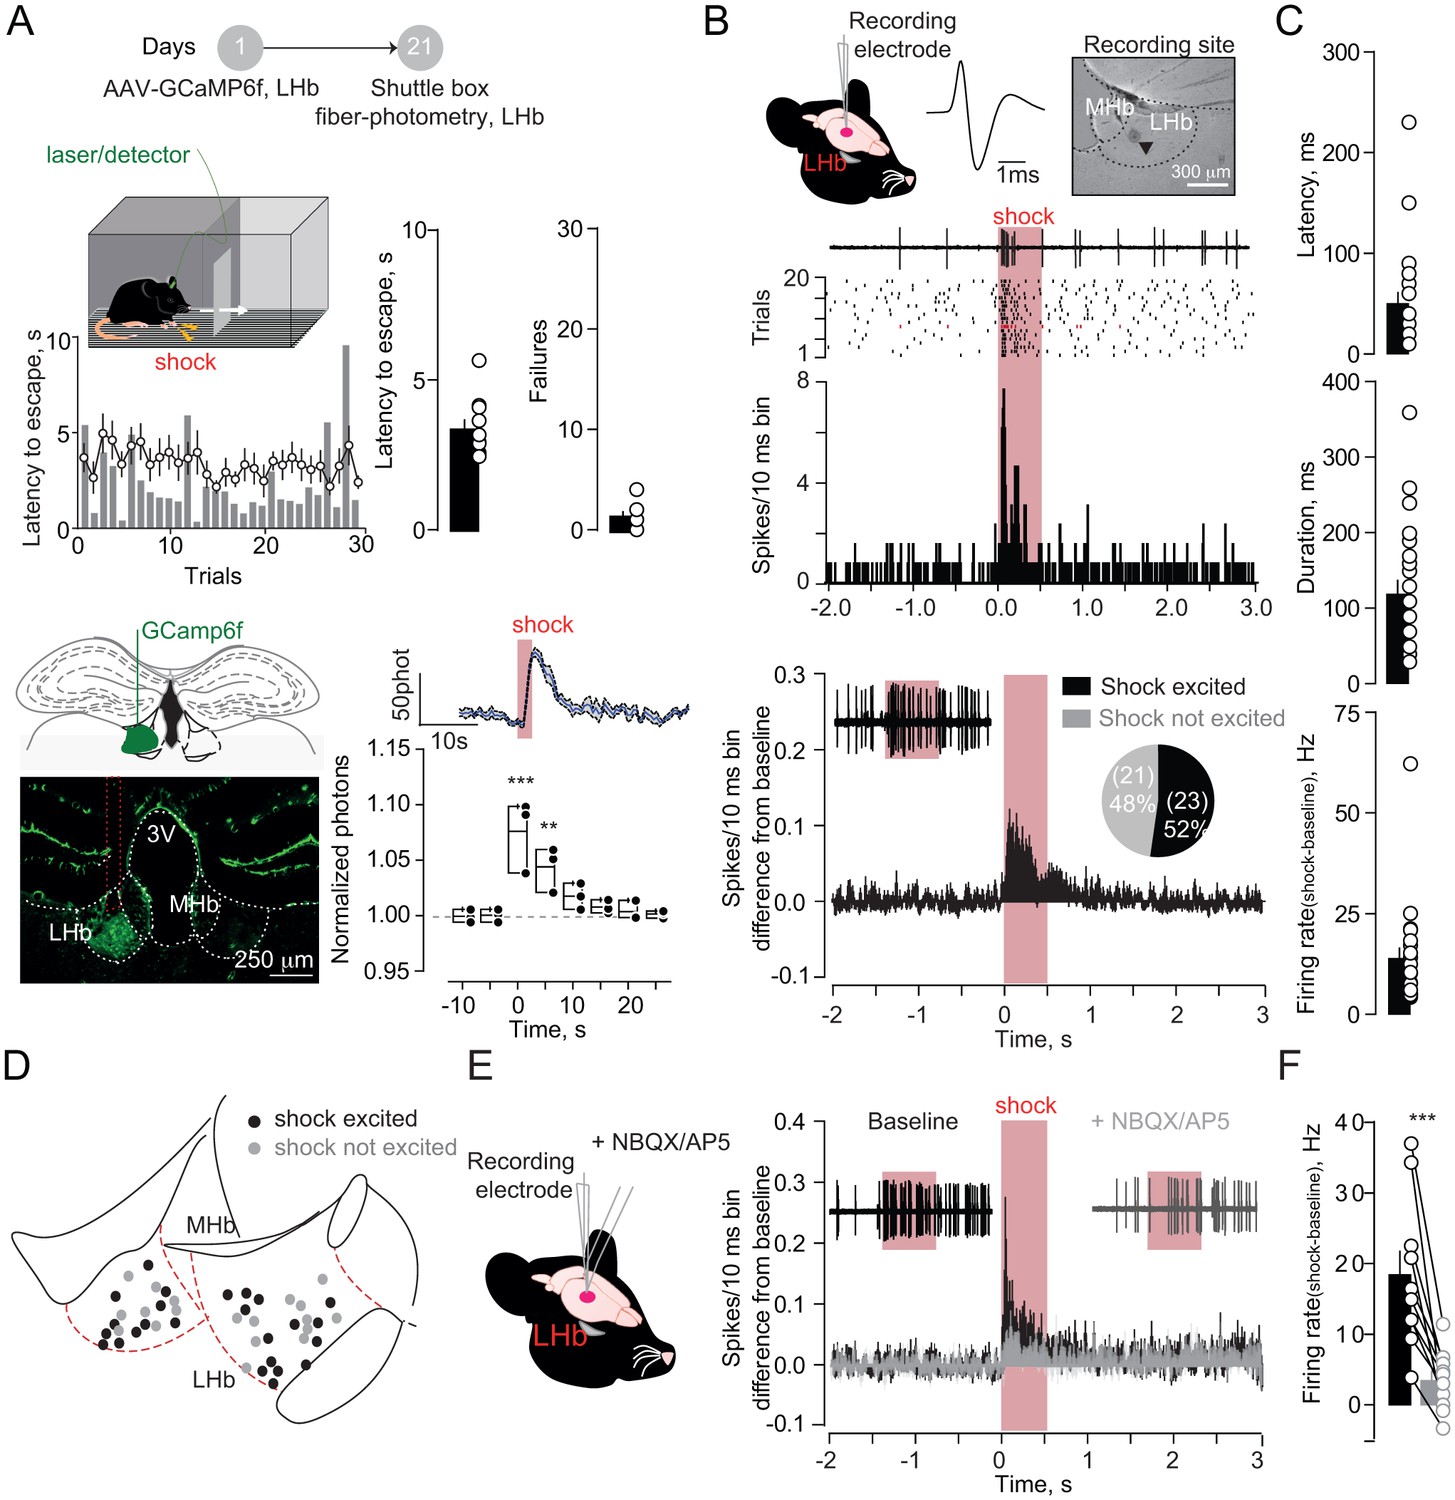
Foot-shocks promote escape behavior and glutamate-dependent phasic excitation of LHb.
(A) Experimental timeline, representative histogram and bar graphs reporting foot-shock (Fs)-driven mouse behavior (latency to escape and failures) (N = 10). Bottom, GCamp6f expression in LHb and Fs-mediated Ca2+ transients (N = 3, one way ANOVA RM, F = 14.24, ***p<0.0001). (B) Spike waveform and recording location of a LHb neuron (arrow, pontamine sky blue dye). Representative trace, raster plot and peristimulus time histogram (PSTH) for Fs-evoked excitation (Fs, 0.5 s, 3mA, ISI: 5 s). Bottom. PSTH reporting average spike counting and pie-chart for Fs-excited LHb neurons ((Firing rate/10 ms-average 2 s pre-shock)/Total trials) (N/n = 7/44). (C) Analysis of Fs excitation in LHb neurons. (D) Territorial distribution of Fs-excited and not-excited neurons. (E) PSTHs reporting Fs responses before/after local infusion of NBQX/AP5. (F) Bar graph and scatter plot for shock-driven activity before/after NBQX/AP5 (N/n = 6/10, paired t-test, t = 5.05; ***p=0.0007). Results are reported as mean ±S.E.M. N = mice; n = cells. 3V, 3rd ventricle, MHb, medial habenula. See Figure 1—source data 1.
-
Figure 1—source data 1
- https://doi.org/10.7554/eLife.30697.005
Figure 1—figure supplement 1
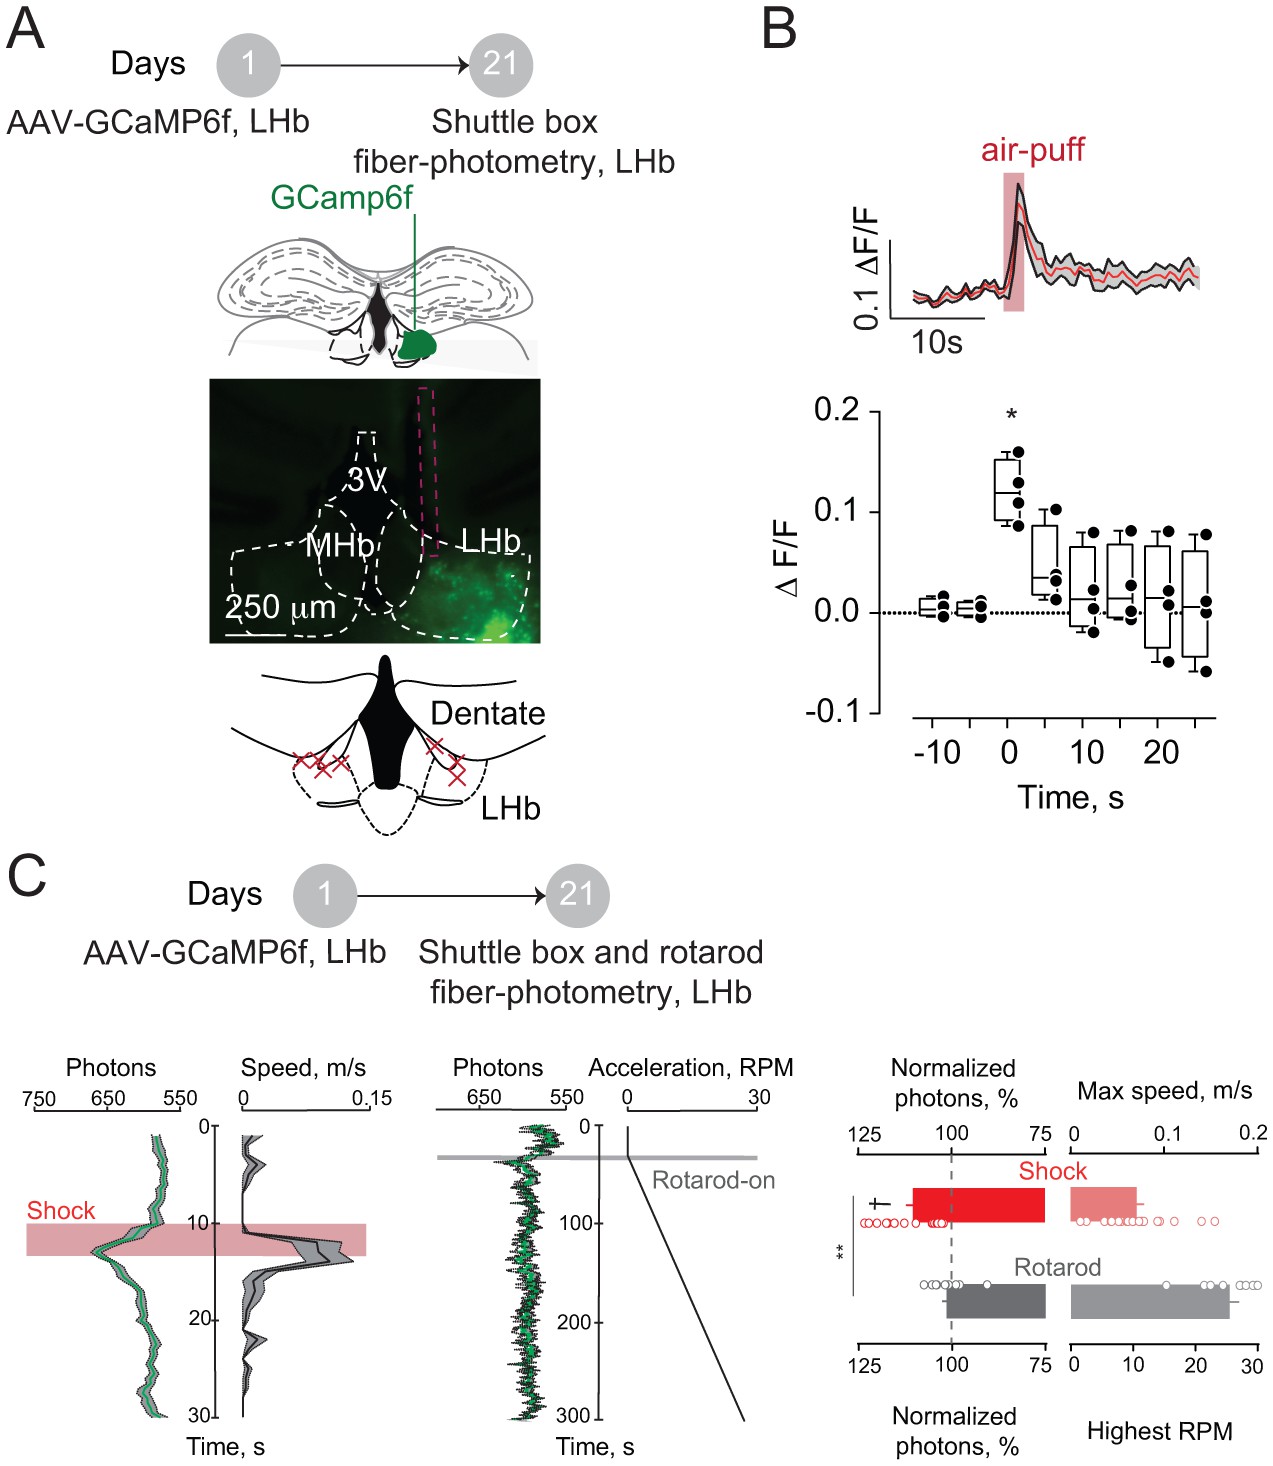
Aversive stimuli and locomotion differentially affect LHb neuronal activity.
(A) Timeline of the experiments, representative coronal sections showing the GCamp6f expression and the fiber placement (red dashed line) in the LHb. Bottom. Schematic of a LHb-containing coronal section with the fibers placement (red crosses, N = 7). (B) Representative trace and averaged time-course graph with plots showing the calcium dynamics upon an unpredicted air-puff (5 trials per mouse) eject on the mouse-tail (N = 4, One way Anova, F = 7.13, *p=0.03). (C) Representative calcium transients (green, average of 10 trials after shock and 5 during rotarod from a single mouse) and the relative change in locomotion (black). Right, bar graphs and scatter plot reporting the maximal normalized calcium transients at the peak of locomotion (N = 2, Shock versus rotarod, unpaired t-test, t = 3.44, **p=0.0018; Shock versus baseline, unpaired t-test, t = 6.27, †p<0.0001; Rotarod versus baseline, unpaired t-test, t = 1.002, p=0.34). Results are reported as mean ±S.E.M. N = mice. 3V, third ventricle, MHb, medial habenula. See also Figure 1. See Figure 1—figure supplement 1—source data 1.
-
Figure 1—supplement figure 1—source data 1
- https://doi.org/10.7554/eLife.30697.006
Figure 1—figure supplement 2
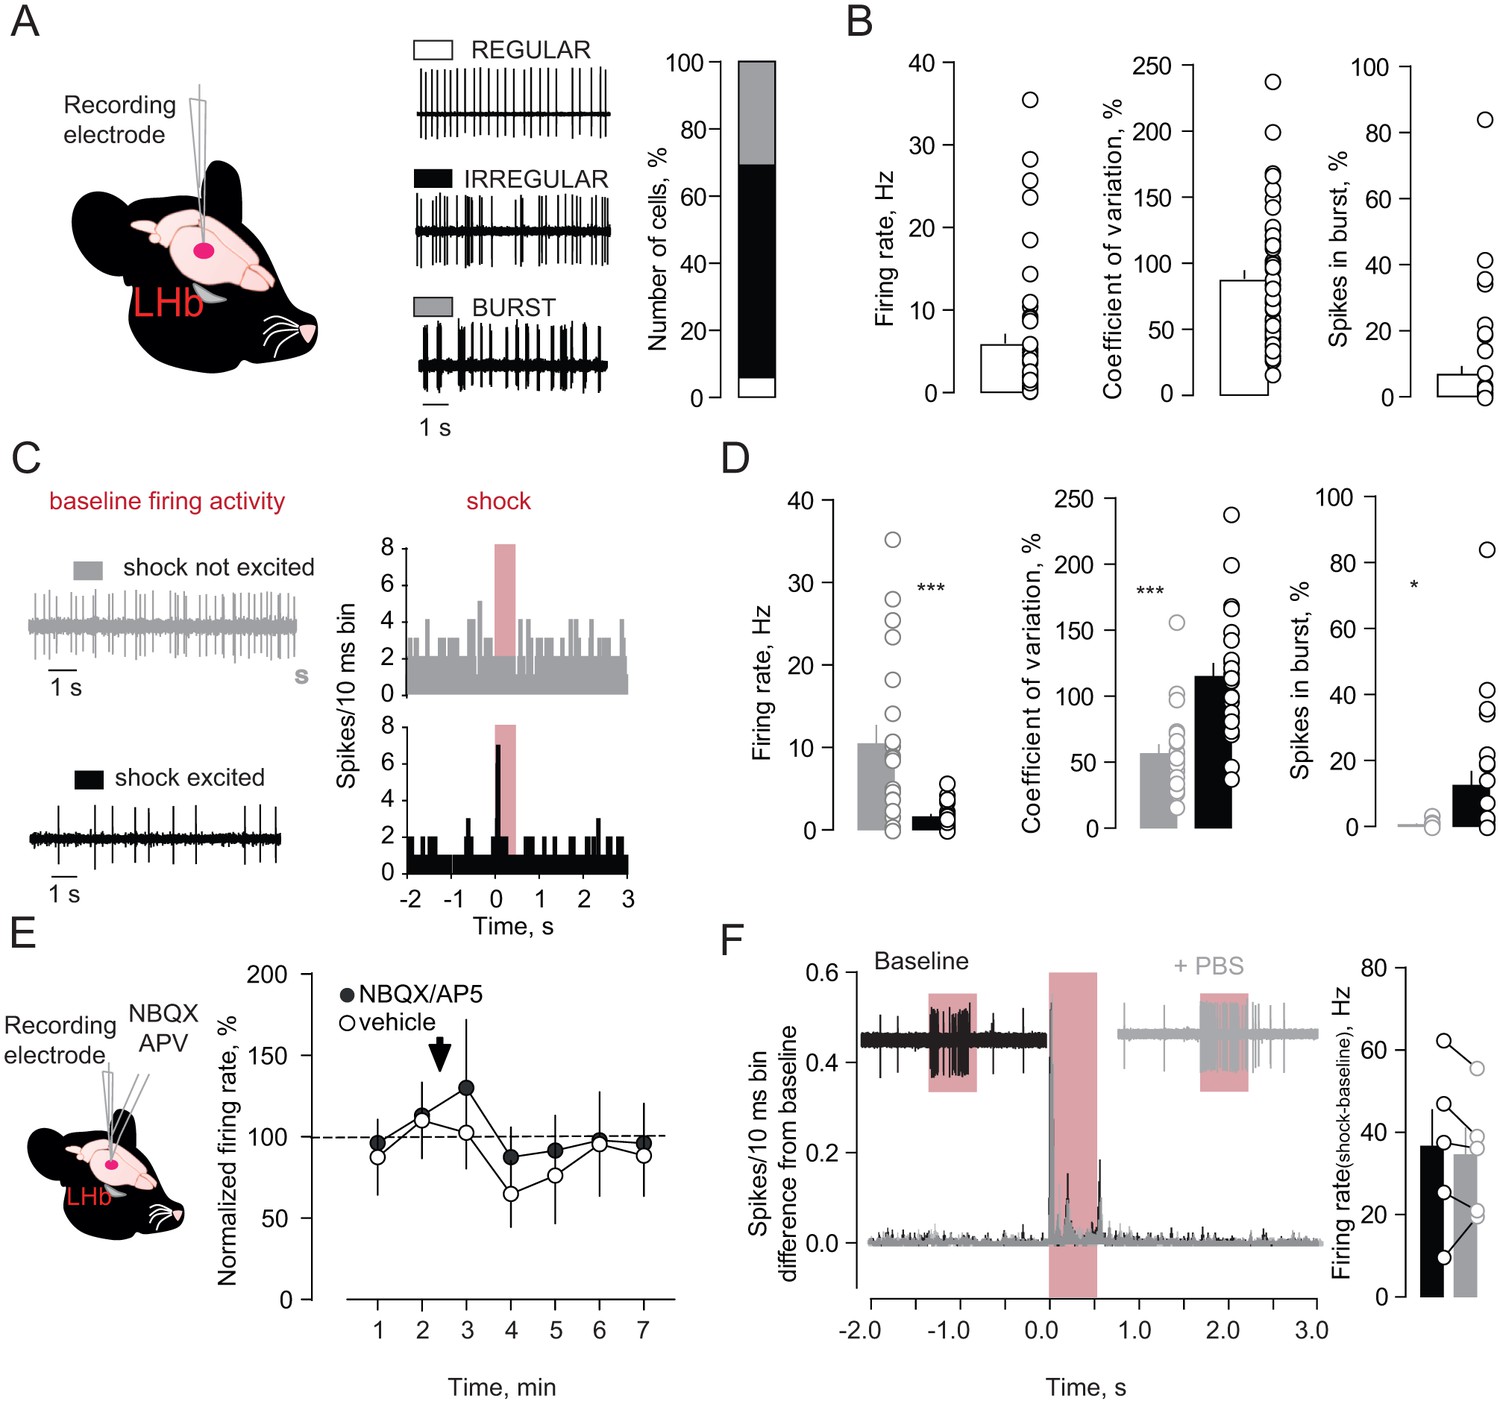
Firing properties and pharmacology of foot-shock responses in LHb neurons of anesthetized mice.
(A) Schematics of recordings, traces and bar graph showing the firing pattern of LHb neurons (N/n = 7/44). (B) Bar graphs and single plots reporting electrophysiological properties of LHb neuronal firing activity. (C) Examples of baseline activity and FsE responses (PSTHs) acquired respectively from a Fs not excited (gray) and a Fs excited (black) neuron. (D) Bar graphs and plots reporting the electrophysiological properties of the LHb Fs excited (n = 23) and not-excited (n = 21) neurons. Note the typical irregular and low bursty firing activity of the LHb Fs encoding neurons (Unpaired t-test, firing rate, t = 4.11, ***p=0.0002; spikes in burst%, t = 2.63, *p=0.011; coefficient of variation%, t = 4.83, ***p<0.0001). (E) Schematic of recordings and local pharmacology. Time-course graph reporting the overall effect on firing activity of NBQX/AP5 (N/n = 6/10; One way ANOVA RM, F = 0.46, p=0.61) and vehicle local infusion (N/n = 2/5; One way ANOVA RM, F = 0.51, p=0.61). (F) Traces, averaged PSTHs, bar graph and plots showing the Fs response on LHb neurons before and after local infusion of vehicle (N/n = 2/5, paired t-test, t = 0.66, p=0.54). N = mice, n-cells. See also Figure 1. See Figure 1—figure supplement 2—source data 1.
-
Figure 1—supplement figure 2—source data 1
- https://doi.org/10.7554/eLife.30697.007
Figure 2 with 3 supplements
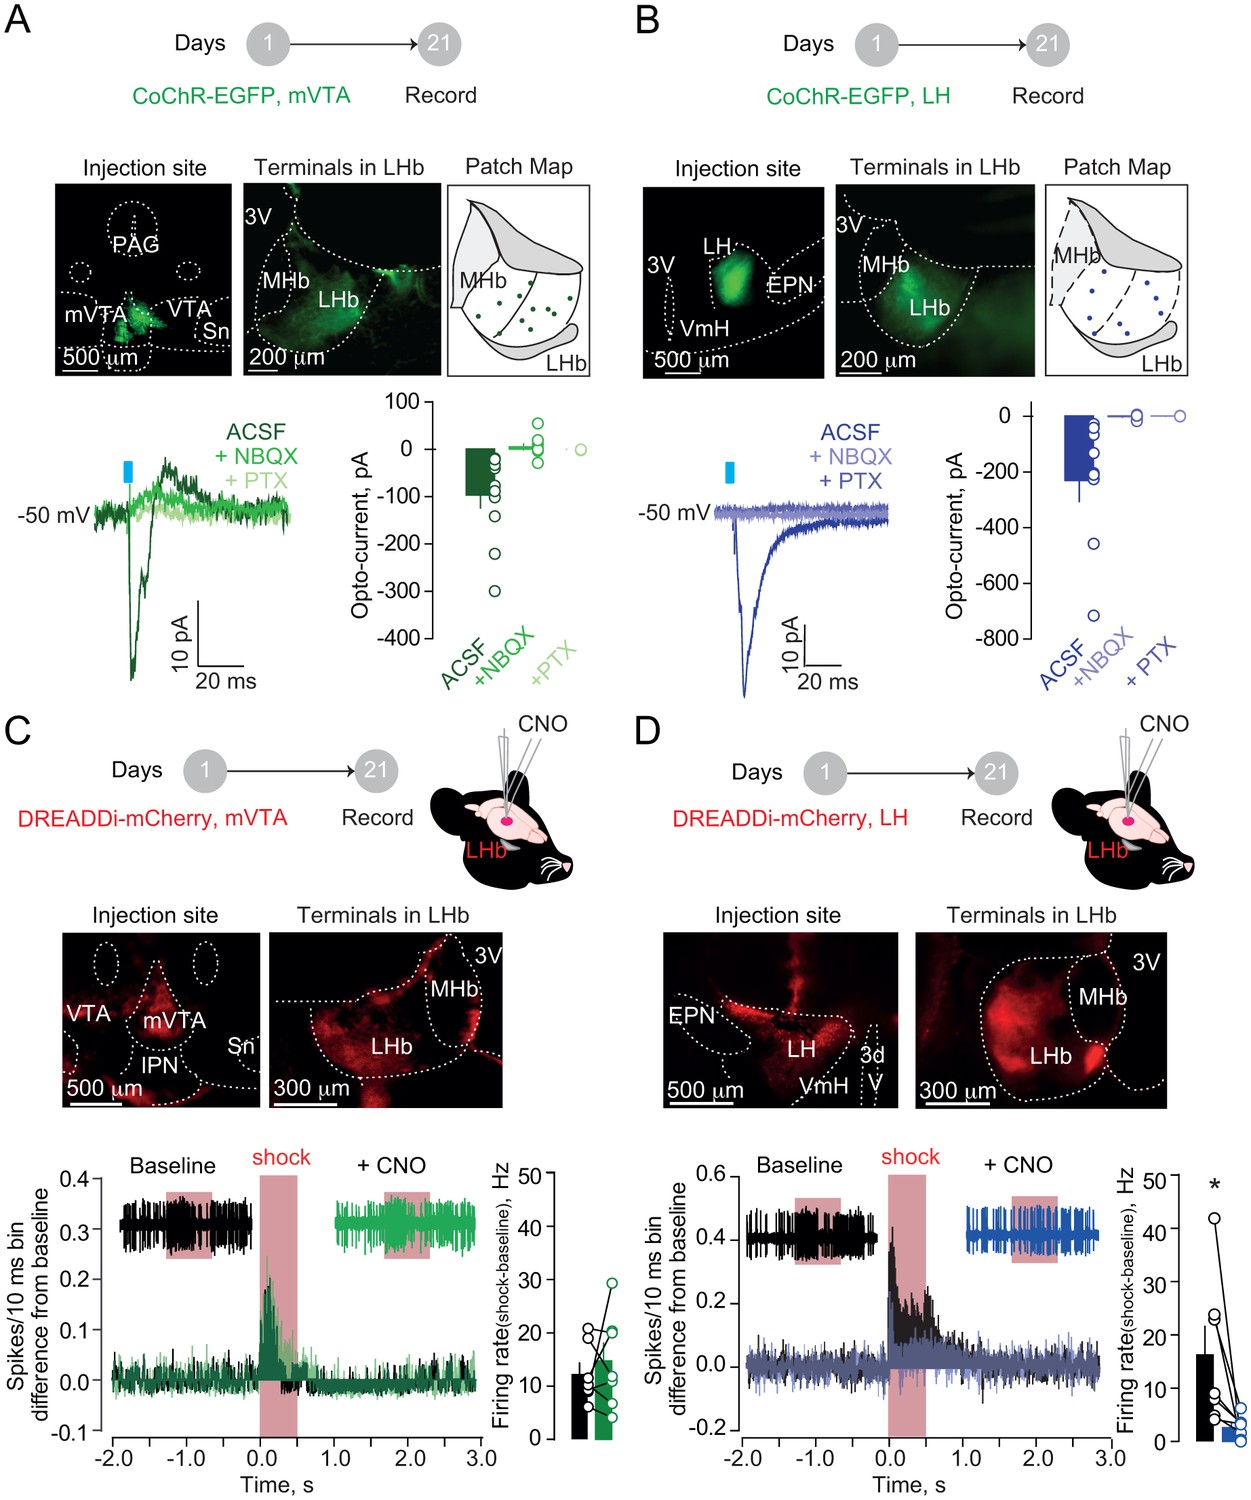
Hypothalamic, but not mesencephalic, excitatory projections mediate foot-shock excitation of LHb neurons.
(A) Experimental timeline, representative images for CoChR expression and recording map in LHb. Bottom. Sample currents and amplitude bar graphs for VTA→LHb terminals optical stimulation at rest (N/n = 4/11). (B) Same as (a) but for LH→LHb (N/n = 5/9). (C) Experimental timeline and DREADDi expression in mVTA somata and LHb terminals. Averaged PSTH, bar graph and scatter plot for Fs-driven excitation before/after local CNO (CNO, 100 µM; N/n = 4/7; paired t-test, t = 0.69 p=0.51). (D) Same as (c) but for LH→LHb projections (N/n = 5/7; paired t-test, t = 2.45 *p=0.04). Results are reported as mean ± S.E.M. N = mice; n = cells. 3V, third ventricle, MHb, medial habenula, EPN, entopeduncular nucleus, PAG, periaqueductal gray, IPN, interpeduncular nucleus, VTA, ventral tegmental area, Sn, substantia nigra, VmH, ventral medial hypothalamus. See Figure 2—source data 1.
-
Figure 2—source data 1
- https://doi.org/10.7554/eLife.30697.012
Figure 2—figure supplement 1
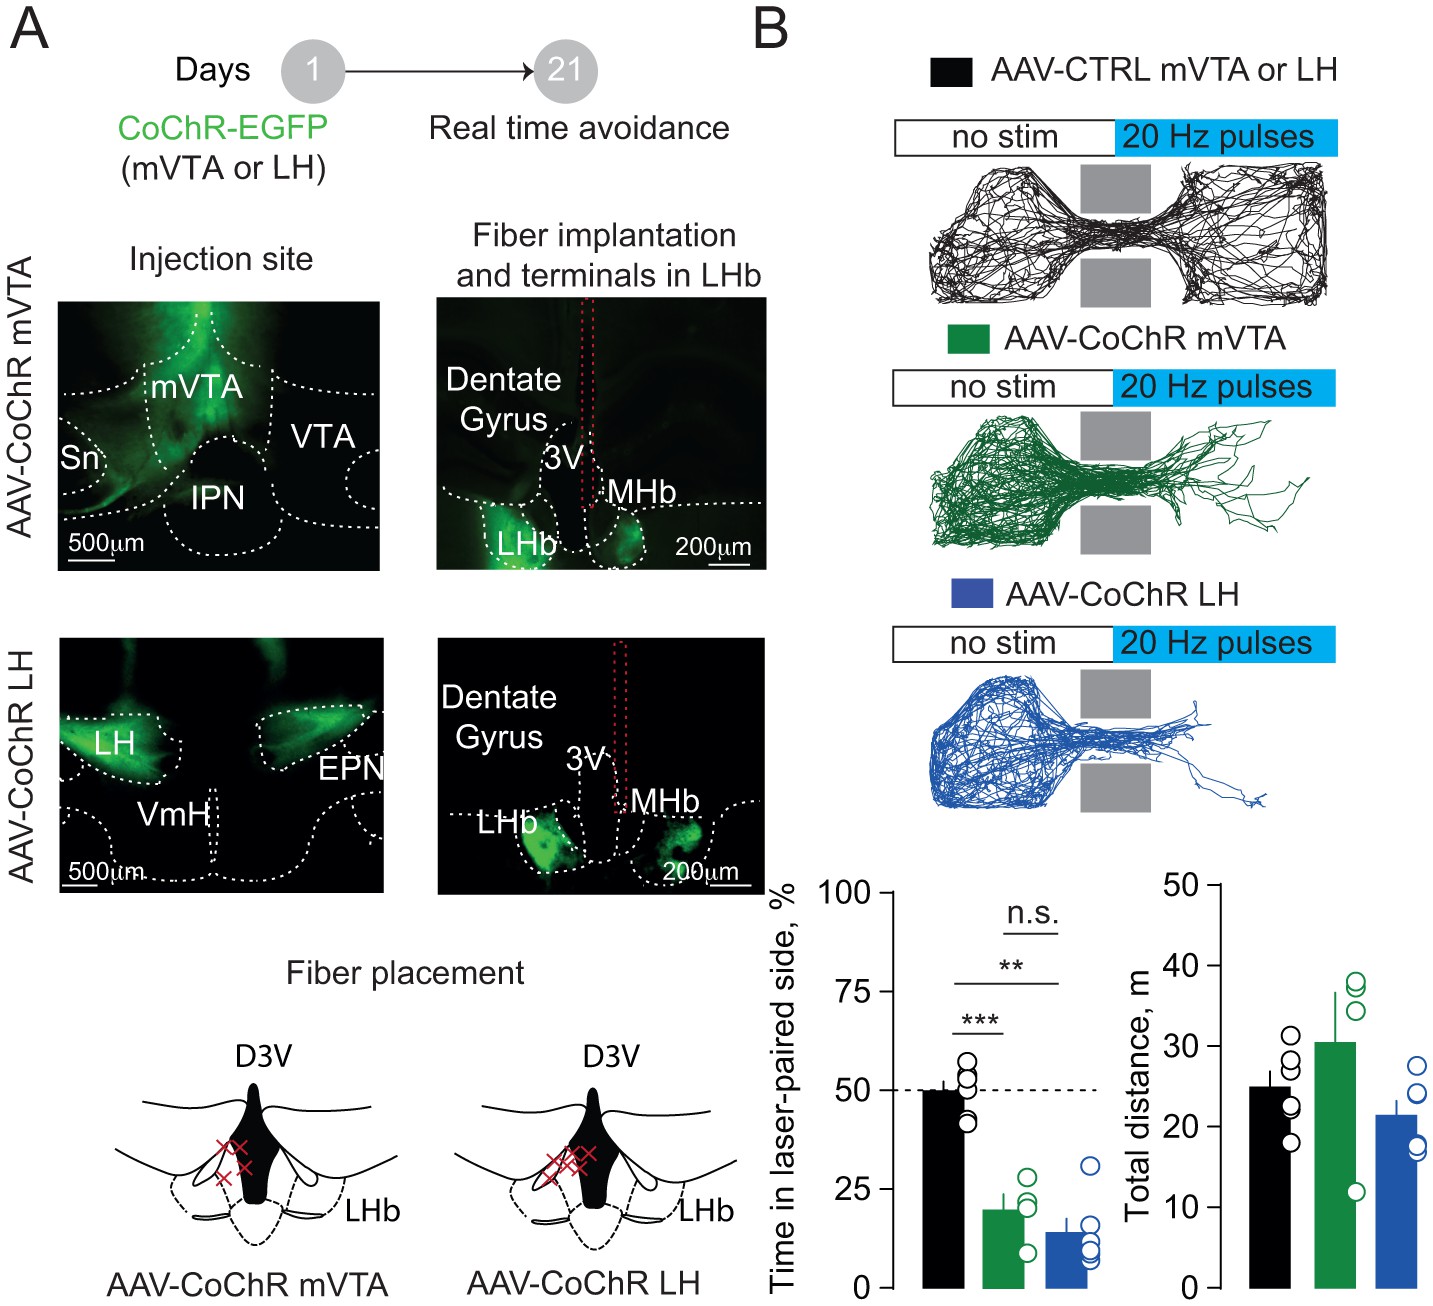
Activation of hypothalamic and mesencephalic terminals within the LHb triggers place aversion.
(A) Schematic of the real time place aversion test and sample pictures reporting CoChR expression in the injection site and in the LHb. Red dashed lines highlight the fiber track. Bottom, LHb-containing coronal section reporting the placement of the fibers in CoChR injected mice. (B) Tracks of single mice performances in the three groups tested. Each time the mouse crossed in the light-paired compartment blue light stimulation was triggered (20 Hz). Bottom, bar graphs and plots showing % of total time spent the laser-paired compartment (one way ANOVA, F = 35.51, ***p<0.0001) and the total distance travelled (one way ANOVA, F = 1.87, p=0.19) in the three groups (CTRL vs LHCoChR vs mVTACoChR, N = 6, 6, 4). N = mice. 3V, third ventricle, MHb, medial habenula, EPN, entopeduncular nucleus, IPN, interpeduncular nucleus, VTA, ventral tegmental area, Sn, substantia nigra, VmH, ventral medial hypothalamus. See also Figure 2. See Figure 2—figure supplement 1—source data 1.
-
Figure 2—supplement figure 1—source data 1
- https://doi.org/10.7554/eLife.30697.013
Figure 2—figure supplement 2
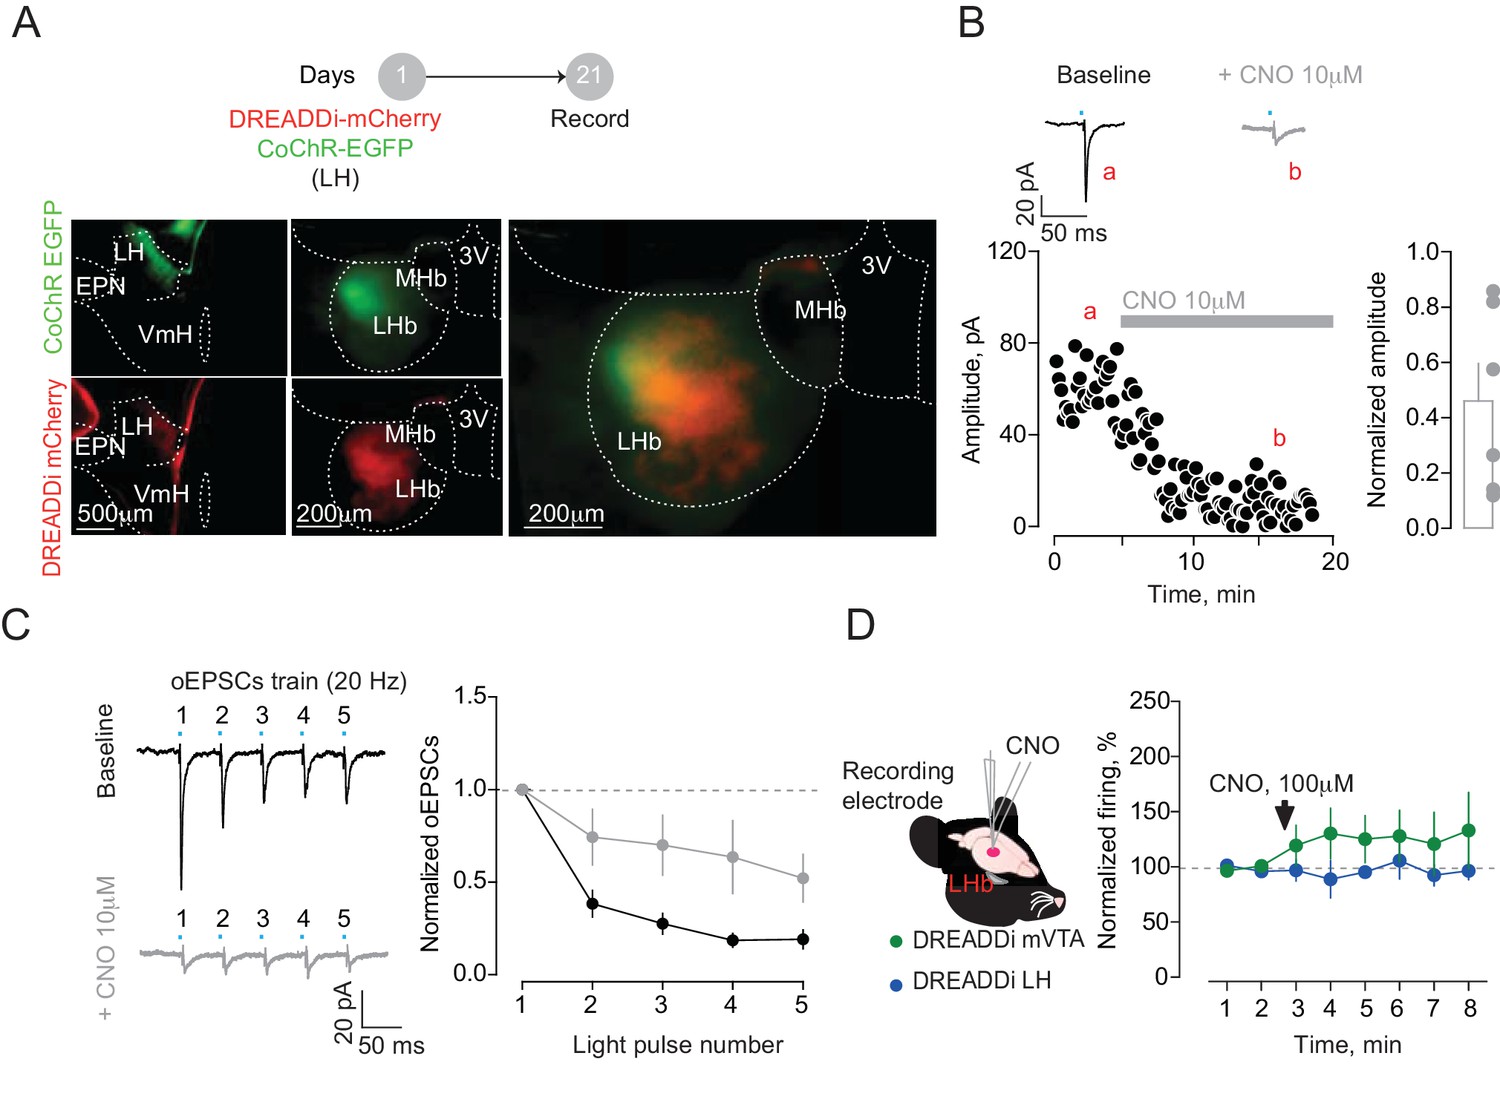
DREADDi activation reduces input-specific presynaptic glutamate release but does not affect LHb baseline firing rate in vivo.
(A) Experimental timeline and representative pictures showing the expression of CoChR and DREADDi in the injection (LH) and recording sites (LHb). (B) Traces and time-course plots of LH opto-evoked currents before (a) and after (b) CNO application in a LHb neuron recorded in acute slices. Bar graph and plots reporting the overall decrease of the opto-evoked excitatory post-synaptic currents (oEPSCs) upon CNO application (N/n = 3/6 paired t-test, t = 3.97, *p=0.01). (C) Sample traces and averaged graph showing the effect of LH terminals DREADDi activation on oEPSCs train in LHb neurons (two way ANOVA RM, interaction: F = 3.65, *p=0.01). (D) Schematics of the double-barrel system allowing a local infusion of CNO in close proximity of the recording site. The time-course graph reports the effect of DREADDi activation on the firing activity of LHb neurons in mice expressing DREADDi in mVTA (N/n = 4/7, one way ANOVA RM, F = 0.57, p=0.57) or LH (N/n = 5/7, one way ANOVA RM, F = 0.26, p=0.72). N = mice, n = cells. 3V, third ventricle, MHb, medial habenula, EPN, entopeduncular nucleus, VmH, ventral medial hypothalamus. See Figure 2—figure supplement 2—source data 1.
-
Figure 2—supplement figure 2—source data 1
- https://doi.org/10.7554/eLife.30697.014
Figure 2—figure supplement 3
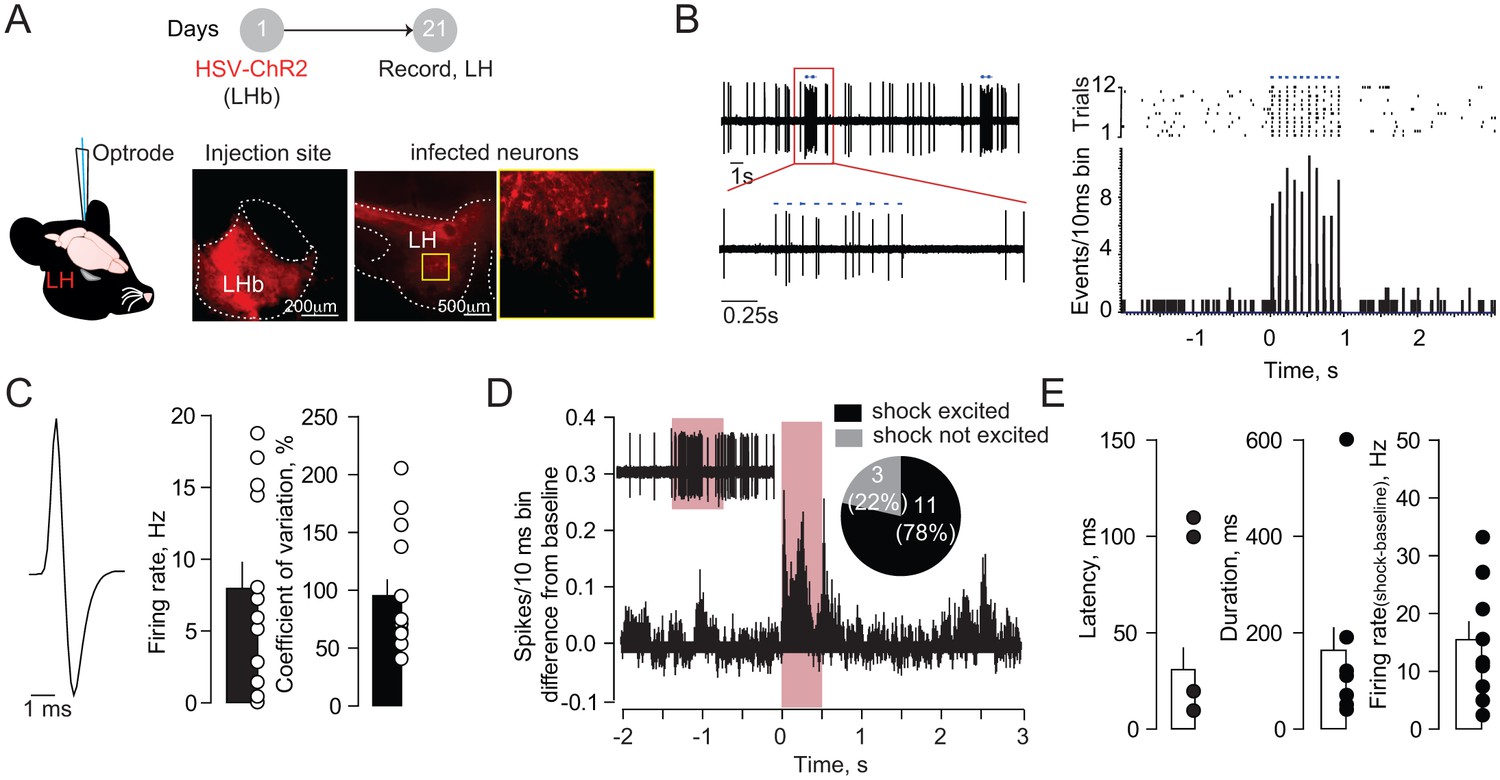
Neurons in the LH projecting to LHb show fast and phasic excitation upon foot-shock.
(A) Schematic of the experiments: an HSV-based (HSV-EF1α-ChR2-mCherry) virus was injected in LHb allowing retro-transport of ChR2 in all neurons projecting to the LHb. Recordings were performed in LH and neurons identified by blue light (1 ms, 470 nm) stimulation delivered through an optrode. Representative pictures showing injection site and ChR2 transfection in LH neurons. (B) Sample recording and PSTHs built from a LHb-projecting LH neuron. The opto-stimulation (10 pulses, 10 Hz) evoked time-locked spikes. (C) Averaged spike waveform, bar graphs of firing rate and coefficient of variation expressed in % (N/n = 4/14). (D) Averaged PSTHs and pie-chart highlighting the Fs response of LHb-projecting LH neurons (Fs-excited/not excited = 11/3 neurons). (E) Electrophysiological properties of the LH neuronal excitation upon foot-shock. N = mice, n = cells. See also Figure 2. See Figure 2—figure supplement 3—source data 1.
-
Figure 2—supplement figure 3—source data 1
- https://doi.org/10.7554/eLife.30697.015
Figure 3 with 1 supplement
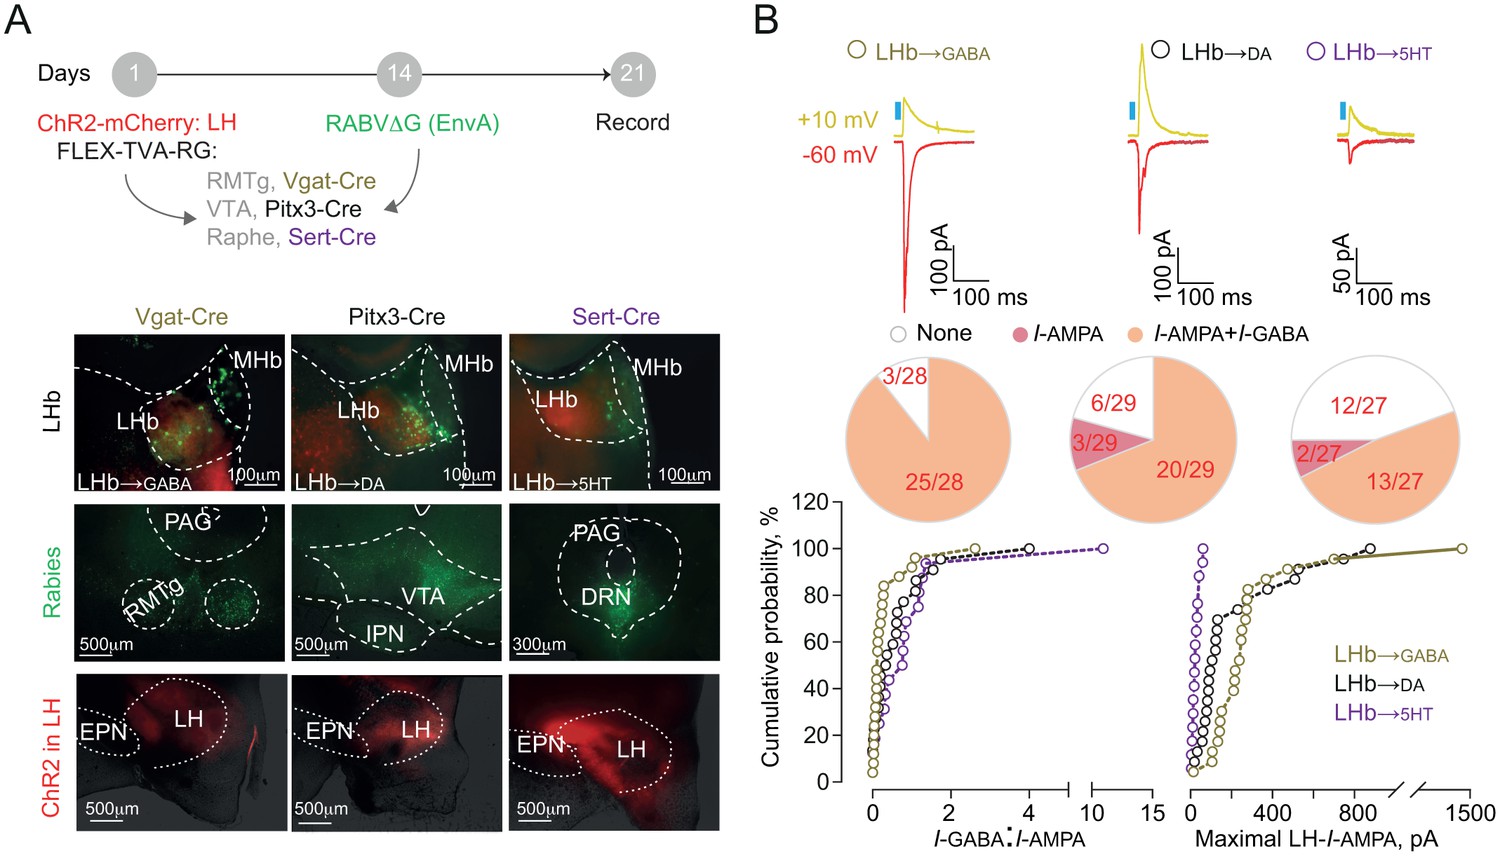
Functional output connectivity of hypothalamic-habenular projections.
(A) Timeline for rabies-based labeling. Bottom. Image illustrating LH-ChR2-mCherry fibers (red) and RABVΔG-(EnvA)-eGFP-retrolabeled LHb neurons (green) projecting to midbrain GABA, DA and 5HT cells. (B) Light-evoked glutamatergic/GABAergic currents and connectivity charts for LH→LHb-to-GABA (N/n = 6/28; Connectivity = 89.2%), LH→LHb-to-DA (N/n = 6/29; Connectivity = 79.3%;) and LH→LHb-to-5HT neurons (N/n = 4/27; Connectivity = 55.5%). Bottom. Cumulative probability (Kolmogorov-Smirnov test; VGat-Cre, Pitx3-Cre, Sert-Cre, n = 25, 23, 15) for I-GABA/I-AMPA (Pitx3 vs Sert p=0.33; VGat vs Sert. ***p=0.0009; VGat vs Pitx3 *p=0.039) and maximal I-AMPA (VGat vs Pitx3 ***p=0.0005; VGat vs Sert ***p<0.0001; Pitx3 vs Sert ***p<0.0001) recorded. Results are reported as mean ±S.E.M. N = mice; n = cells. MHb, medial habenula, EPN, entopeduncular nucleus, PAG, periaqueductal gray, IPN, interpeduncular nucleus, VTA, ventral tegmental area, RMTg, rostromedial tegmental nucleus, DRN, dorsal raphe nucleus. See Figure 3—source data 1.
-
Figure 3—source data 1
- https://doi.org/10.7554/eLife.30697.018
Figure 3—figure supplement 1
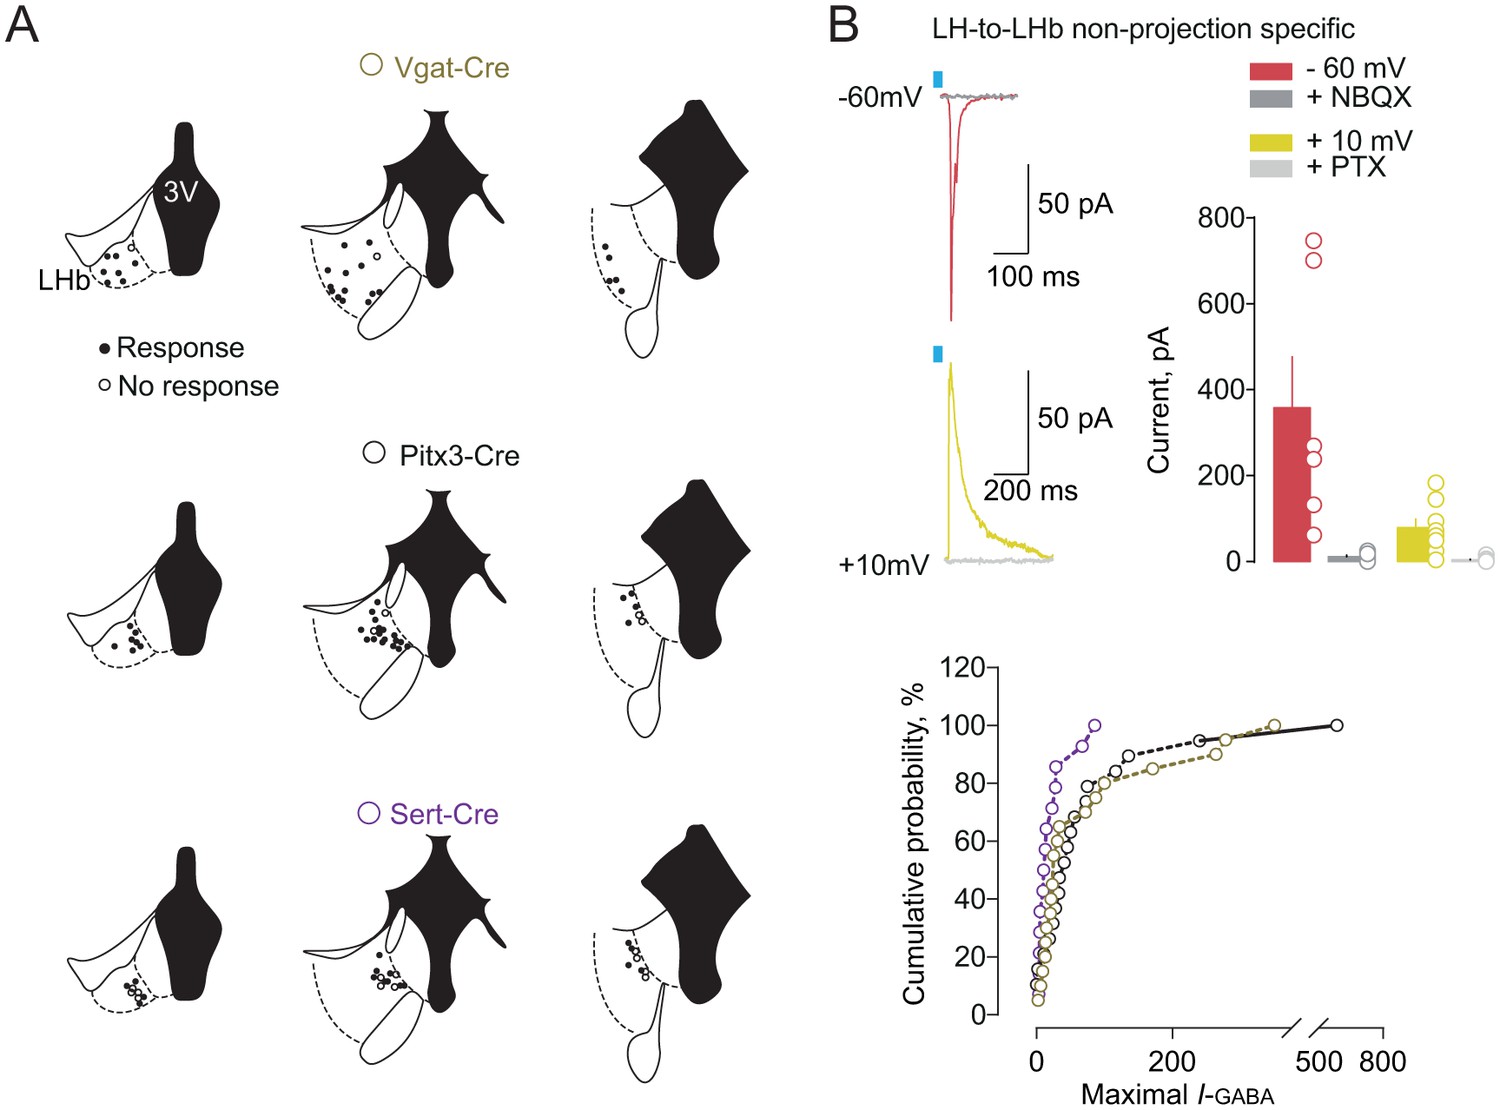
Anatomical and physiological properties of LH-LHb projecting neurons.
(A) Maps of patch-clamp recordings in the three different Cre mouse lines (VGat-Cre, Pitx3-Cre and Sert-Cre) revealing an LHb-output specific territorial organization. (B) Representative traces and bar graph showing the opto-evoked excitatory or inhibitory currents in the LHb (at −60 mV: n = 6; at +10 mV: n = 8). Maximal I-GABA currents (Kolgorov-Smirnov test: VGat vs Pitx3. p=0.49; VGat vs Sert p=0.11; Pitx3 vs Sert *p=0.03). n-cells. See also Figure 3. See Figure 3—figure supplement 1—source data 1.
-
Figure 3—supplement figure 1—source data 1
- https://doi.org/10.7554/eLife.30697.019
Figure 4 with 1 supplement
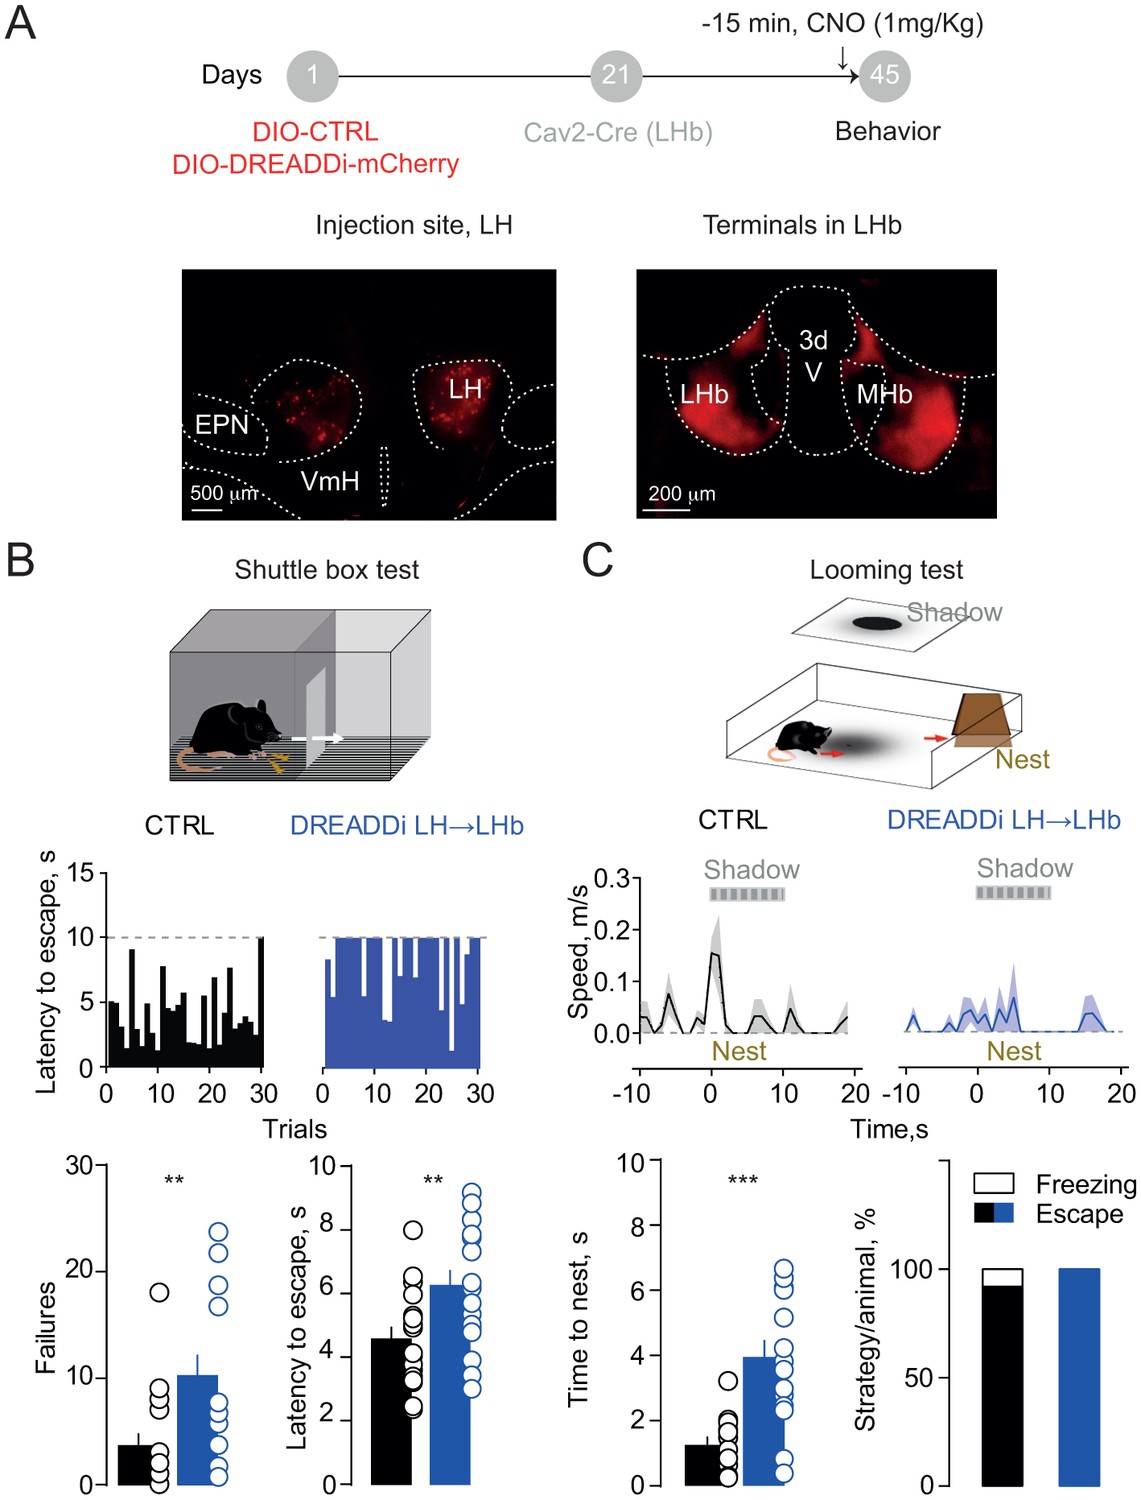
Silencing the hypothalamic-habenular projection impairs escape behaviors.
(A) Timeline for Cre-dependent DREADDi strategy. Image for DREADDi expression (red) in LH somata and LH terminals in LHb. (B) Sample histograms for Fs-evoked latency to escape (30 trials) in a CTRL and DREADDi-expressing mouse. Bottom. Bar graphs and scatter plots for failure rates and latencies to escape (CTRL vs DREADDi, N = 17, 17; unpaired t-test; failures: t = 2.97, **p=0.005; latency: t = 2.79, **p=0.008). (C) Looming light test. Sample speed across time during the looming test in CTRLs and DREADDi-expressing animals. Bottom. Latency to escape (CTRL vs DREADDi, N = 12, 15; unpaired t-test; t = 4.12, ***p=0.0004) and strategy adopted upon the looming stimulus (Chi-square test, X2 = 1.29, p=0.25) in the two experimental groups. Results are reported as mean ±S.E.M. N = mice. MHb, medial habenula, EPN, entopeduncular nucleus, VmH, ventral medial hypothalamus. See Figure 4—source data 1.
-
Figure 4—source data 1
- https://doi.org/10.7554/eLife.30697.022
Figure 4—figure supplement 1
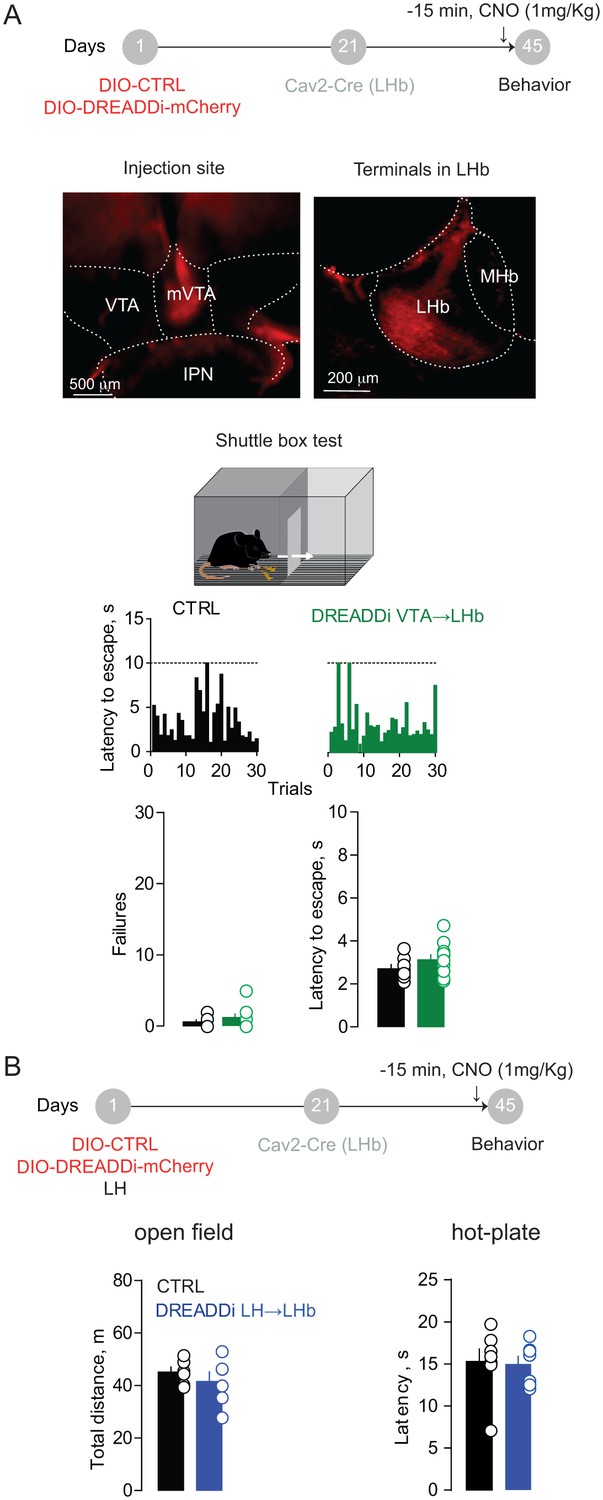
Behavioral assessment of DREADDi activation on VTA→LHb and LH→LHb projections.
(A) Timeline for Cre-dependent DREADDi strategy within the VTA. Representative image for DREADDi expression (red) in mVTA somata and terminals in LHb. Sample histograms for Fs-evoked latency to escape over 30 trials in a CTRL and DREADDi-expressing mouse. Bottom. Bar graphs and scatter plots for failure rates and latencies to escape (CTRL vs DREADDi, N = 7 vs 10; unpaired t-test; Failures: t = 1.17, p=0.25; Latency: t = 1.26, p=0.22). (B) Timeline for Cre-dependent DREADDi expression in LH→LHb. Bar graphs and scatter plots for data collected in the open field (CTRL vs DREADDi; N = 6 vs 6; unpaired t-test, t = 0.85; p=0.41) and in the hot-plate test (N = 7 vs 7; unpaired t-test, t = 0.16; p=0.87). N = mice. MHb, medial habenula, VTA, ventral tegmental area, IPN, interpeducular nucleus. See also Figure 4. See Figure 4—figure supplement 1—source data 1.
-
Figure 4—supplement figure 1—source data 1
- https://doi.org/10.7554/eLife.30697.023
Videos
Video 1
Escape behavior in mice.
Looming test performance of a representative mouse infused with a control virus within the LH and Cav2-Cre in the LHb.
Video 2
Silencing the LH-to-LHb pathway compromise escape behavior.
Looming test performance of a representative mouse infused with a AAV-hSyn-DIO-hM4Di-mCherry within the LH and Cav2-Cre in the LHb.
Additional files
-
Transparent reporting form
- https://doi.org/10.7554/eLife.30697.026
Download links
A two-part list of links to download the article, or parts of the article, in various formats.
Downloads (link to download the article as PDF)
Open citations (links to open the citations from this article in various online reference manager services)
Cite this article (links to download the citations from this article in formats compatible with various reference manager tools)
Aversive stimuli drive hypothalamus-to-habenula excitation to promote escape behavior
eLife 6:e30697.
https://doi.org/10.7554/eLife.30697


