Dnmt3a is an epigenetic mediator of adipose insulin resistance
- University of California, Berkeley, United States
- Lund University Diabetes Centre, Scania University Hospital, Sweden
- Beth Israel Deaconess Medical Center, United States
- Broad Institute of Harvard and MIT, United States
- Weill Cornell Medical College, United States
- Rigshospitalet, University of Copenhagen, Denmark
- AstraZeneca, Innovative Medicines, Sweden
Figures
Figure 1 with 1 supplement
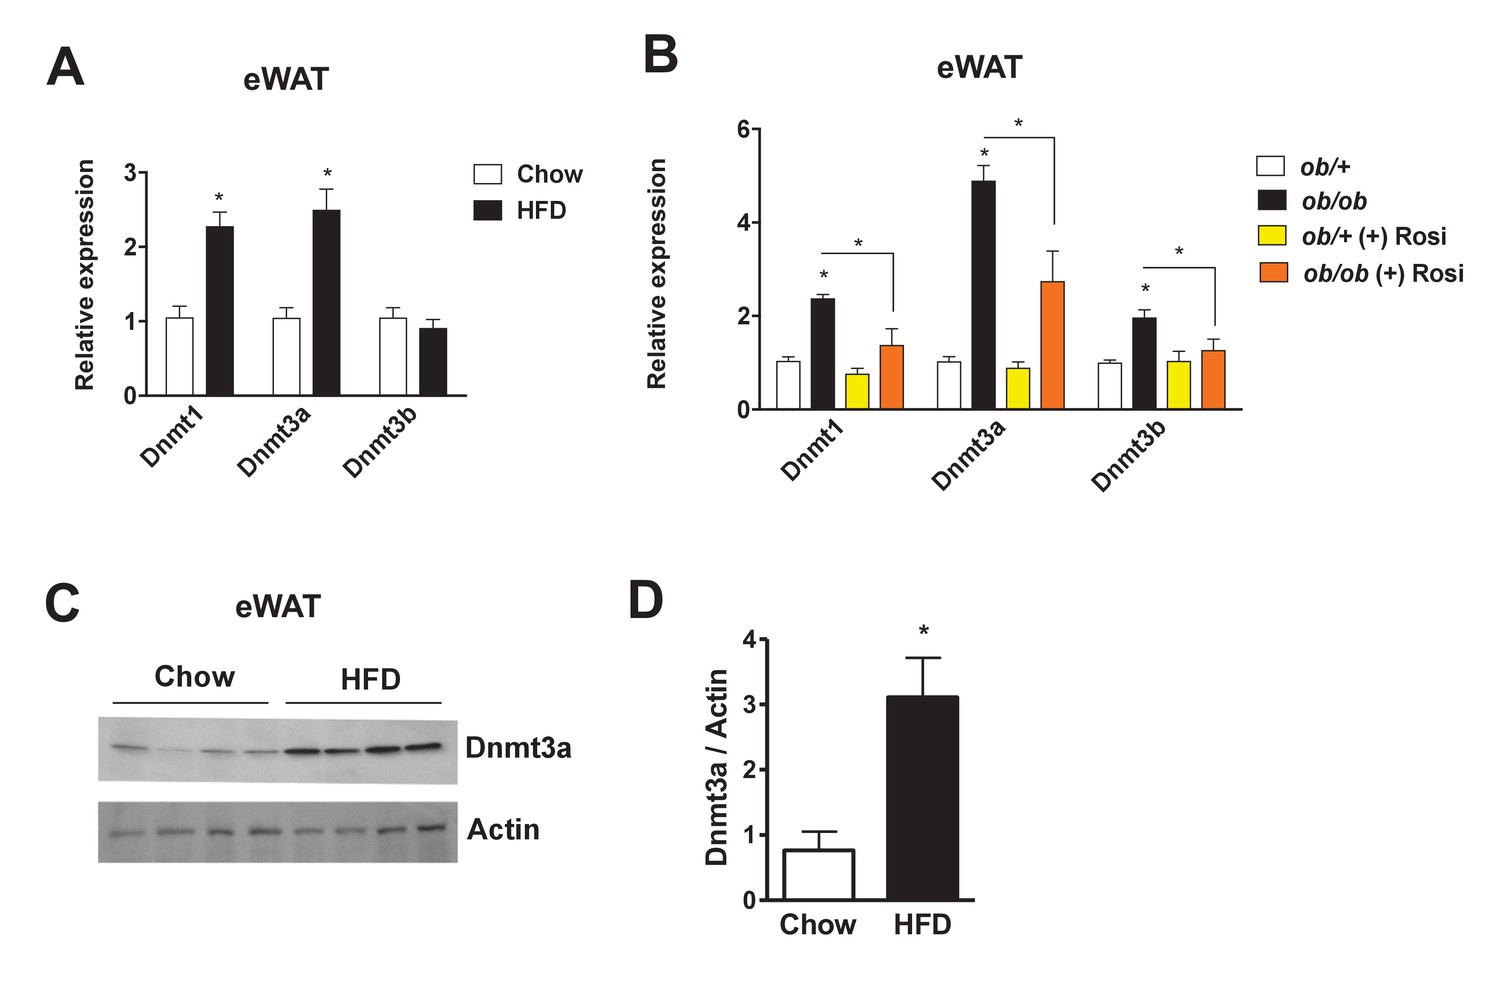
Increased adipose expression of Dnmts in obesity.
(A) Dnmt mRNA expression in adipose from chow- and high fat-fed (HFD) C57Bl/6 mice (A); n = 6 mice, p<0.05, Student’s t-test, mean ±s.e.m.) and (B) in adipose tissue from ob/+and ob/ob mice in the presence and absence of rosiglitazone treatment (right; n = 7 for ob/+, n = 8 for ob/+plus Rosi, n = 7 for ob/ob with and without Rosi, p<0.05, Student’s t-test, mean ±s.e.m.). (C) Western blot showing Dnmt3a protein levels in adipose tissue from chow vs. HFD mice. (D) Quantification of western blot in (C).
-
Figure 1—source data 1
Figure 1—source data.
- https://doi.org/10.7554/eLife.30766.005
Figure 1—figure supplement 1
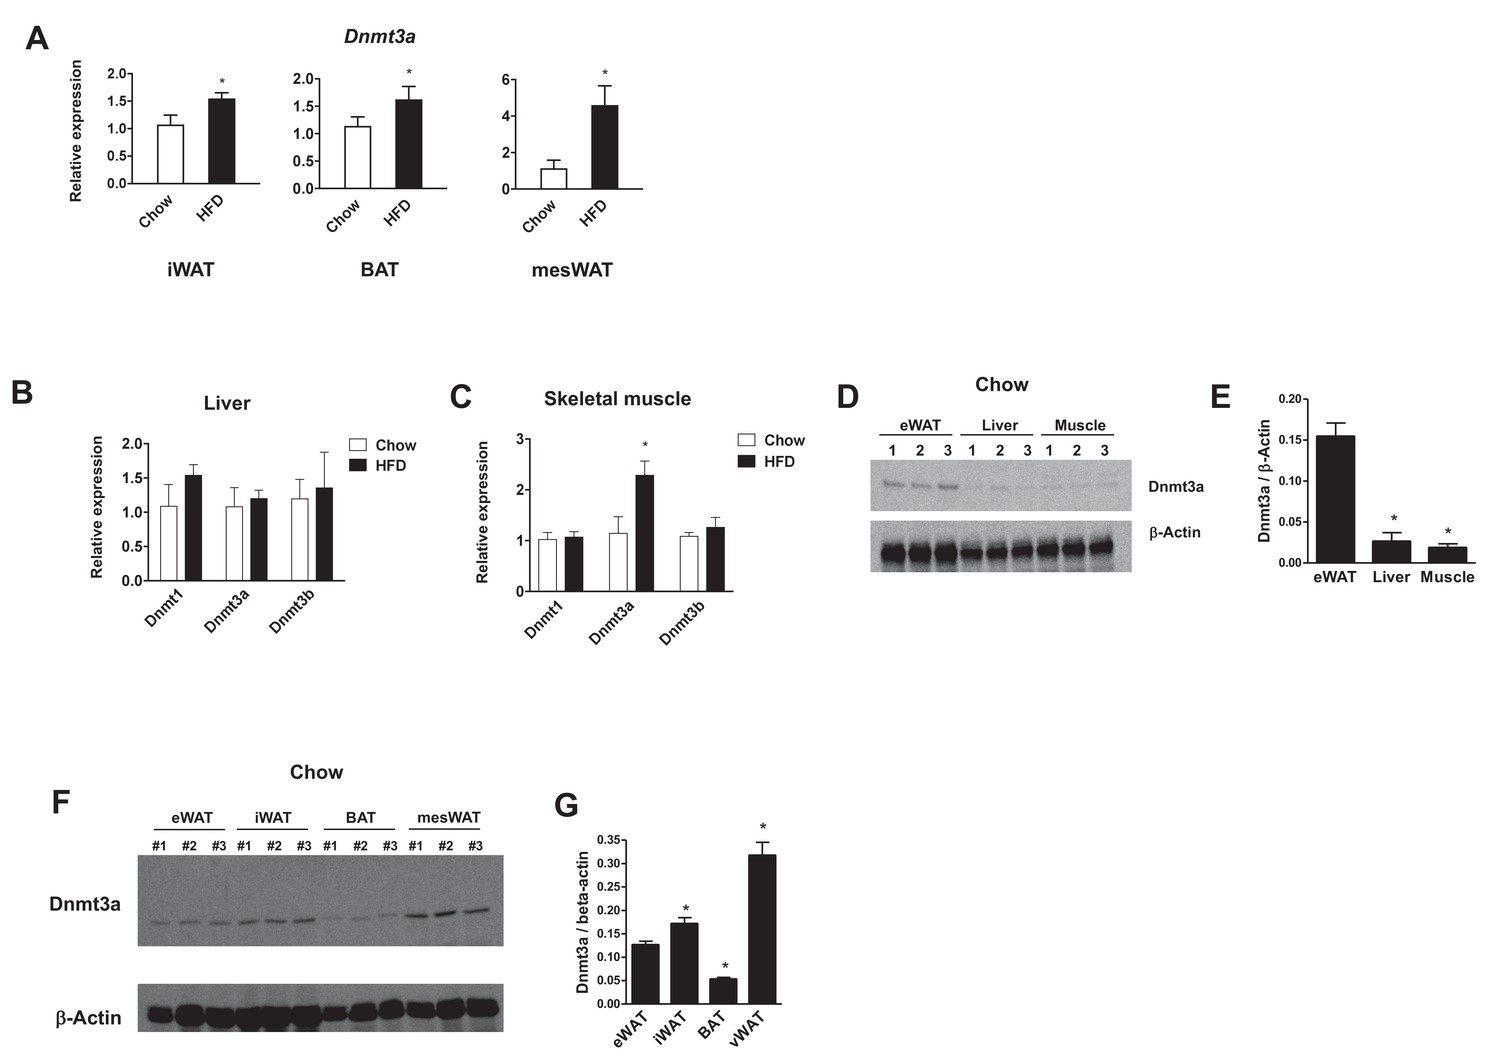
Expression of Dnmts in various metabolic tissues.
(A) Dnmt mRNA expression in inguinal WAT (iWAT, n = 6), BAT (n = 6), and mesenteric WAT (mesWAT, n = 5) from chow- and high fat-fed C57Bl/6 mice (p<0.05, Student’s t-test, mean ±s.e.m.). (B, C) Dnmt mRNA expression in liver and skeletal muscle from chow- and high fat-fed C57Bl/6 mice (liver: n = 6, 5, skeletal muscle: n = 6, six mice, p<0.05, Student’s t-test, mean ±s.e.m.). (D) Dnmt3a protein expression in eWAT, liver, and skeletal muscle in chow-fed C57Bl/6 mice (E) Quantification of western blot in D (n = 3, p<0.05, Student’s t-test, mean ±s.e.m.) (F) Dnmt3a protein expression of various adipose depots in chow-fed C57Bl/6 mice. (G) Quantification of western blot in (F) (n = 3, p<0.05, Student’s t-test, mean ±s.e.m.).
-
Figure 1—figure supplement 1—source data 1
Figure 1—figure supplement 1—source data.
- https://doi.org/10.7554/eLife.30766.004
Figure 2 with 2 supplements
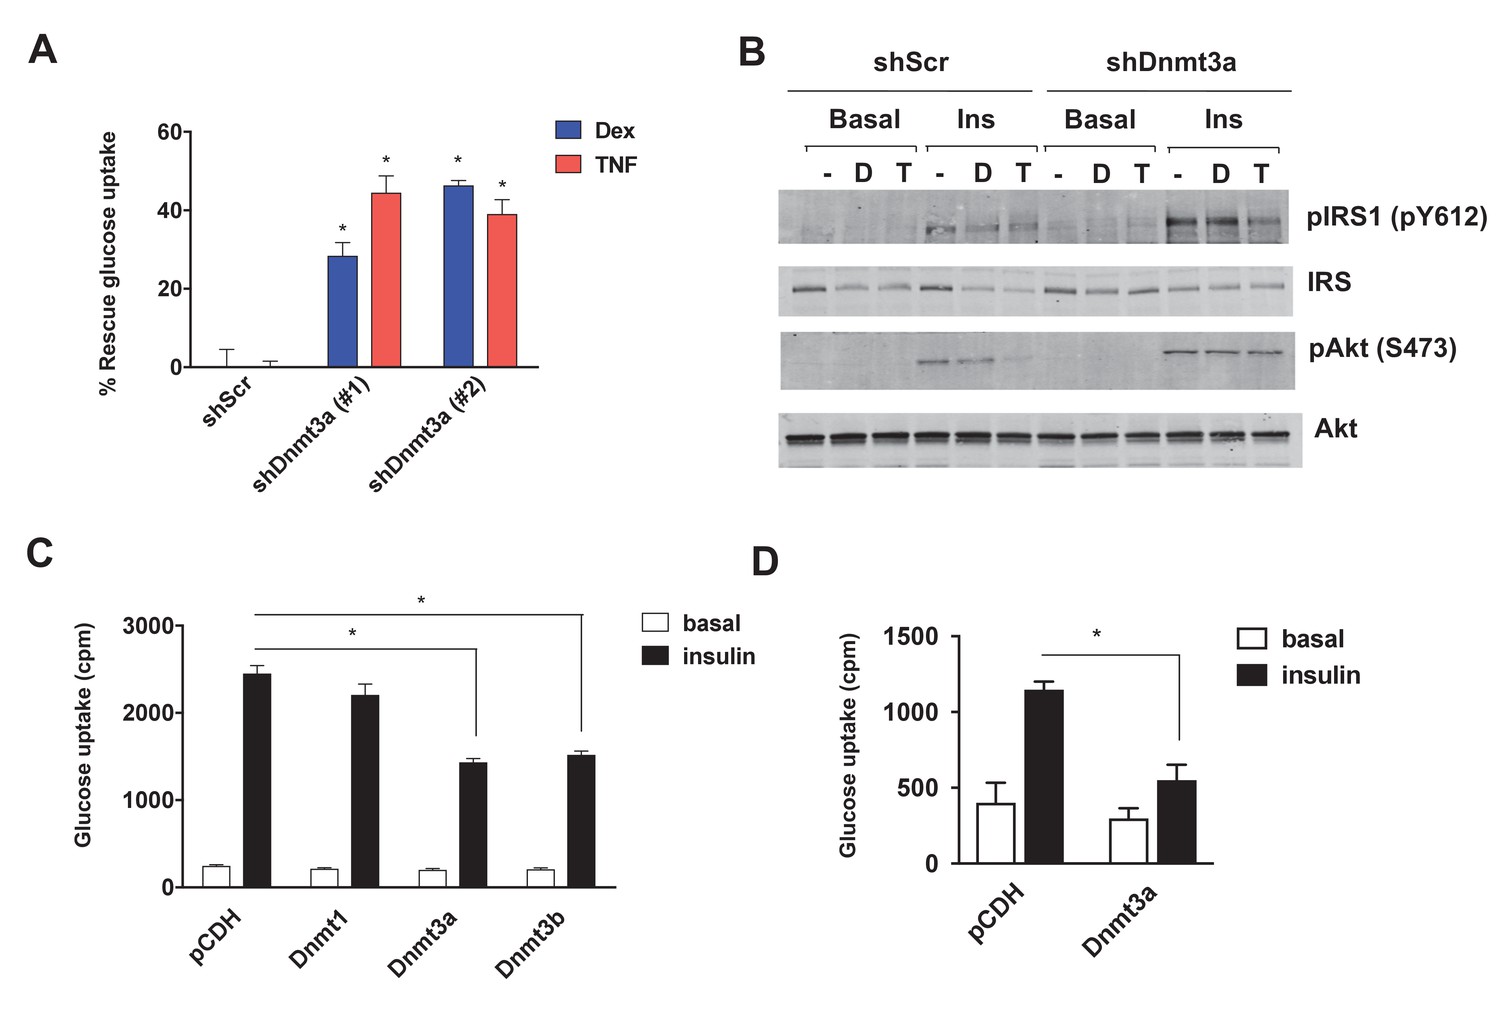
Dnmt3a is sufficient and necessary to mediate cell autonomous IR in vitro.
(A) Two independent hairpins against Dnmt3a (versus scrambled control shRNA; shScr) were delivered to mature 3T3-L1 adipocytes (Day 8) via lentiviral transduction. Cells were then treated with Dex and TNF for 4 days and assessed for insulin-stimulated glucose uptake (3H-2-DG assay, n = 6, p<0.05). Shown is the % of insulin-stimulated glucose uptake rescued by Dnmt3a knockdown (n = 6, p<0.05). (B) Cells in (A) with #2 shDnmt3a hairpin and control cells were withdrawn from serum for 6 hr, stimulated with 20 nM insulin for 5 min and subjected to immunoblotting with antibodies against total and phospho-AKT and –IRS-1 with and without insulin. (C) Basal and insulin-stimulated glucose uptake in mature 3T3-L1 and (D) in in vitro-differentiated primary human adipocytes transduced with lentivirus expressing Dnmts or the empty plasmid vector, pCDH (n = 6, p<0.05, Student’s t-test, mean ±s.e.m.).
-
Figure 2—source data 1
Figure 2—source data.
- https://doi.org/10.7554/eLife.30766.011
Figure 2—figure supplement 1
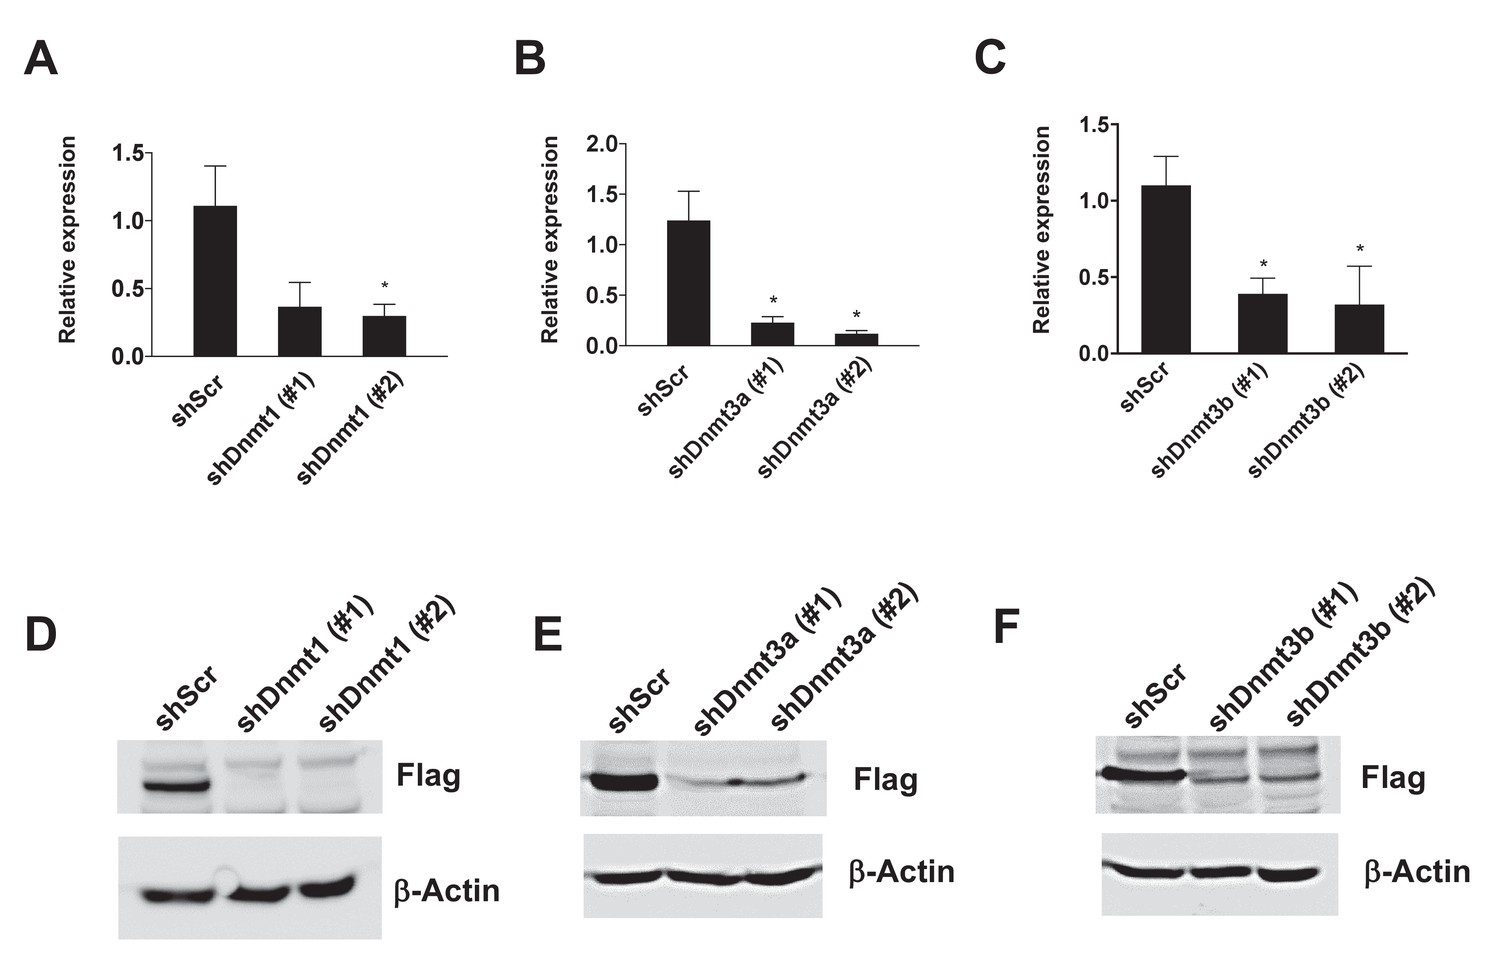
Knock-down efficiency of Dnmt hairpins.
(A-C) Two independent hairpins against Dnmt1, 3a, and 3b (versus scrambled shRNA; shScr) were delivered to mature 3T3-L1 adipocytes (Day 8) via lentiviral transduction. Shown is mRNA (n = 3, p<0.05, Student’s t-test, mean ±s.e.m.). (D–F) The Flag-tagged version of expression vectors for Dnmt1, 3a, and 3b were co-transfected with hairpins against them in 293 T cells. After 2 days of transfection, Flag western was performed.
-
Figure 2—figure supplement 1—source data 1
Figure 2—figure supplement 1—source data.
- https://doi.org/10.7554/eLife.30766.008
Figure 2—figure supplement 2

Dnmt3a is necessary for Dex- and TNF-mediated IR.
(A–E) Two independent hairpins against Dnmt1, Dnmt3a, and Dnmt3b (versus scrambled shRNA; shScr) were delivered to mature 3T3-L1 adipocytes (Day 8) via lentiviral transduction, and cells were then treated with Dex and TNF for 4 days and assessed for insulin-stimulated glucose uptake (3H-2-DG assay, n = 6, p<0.05). Basal and insulin-stimulated glucose uptake shown in (A, C and E). (B and D) show the % of insulin-stimulated glucose uptake rescued by Dnmt1, 3a, and 3b knockdown (n = 6, p<0.05, Student’s t-test, mean ±s.e.m.).
-
Figure 2—figure supplement 2—source data 1
Figure 2—figure supplement 2—source data.
- https://doi.org/10.7554/eLife.30766.010
Figure 3 with 1 supplement
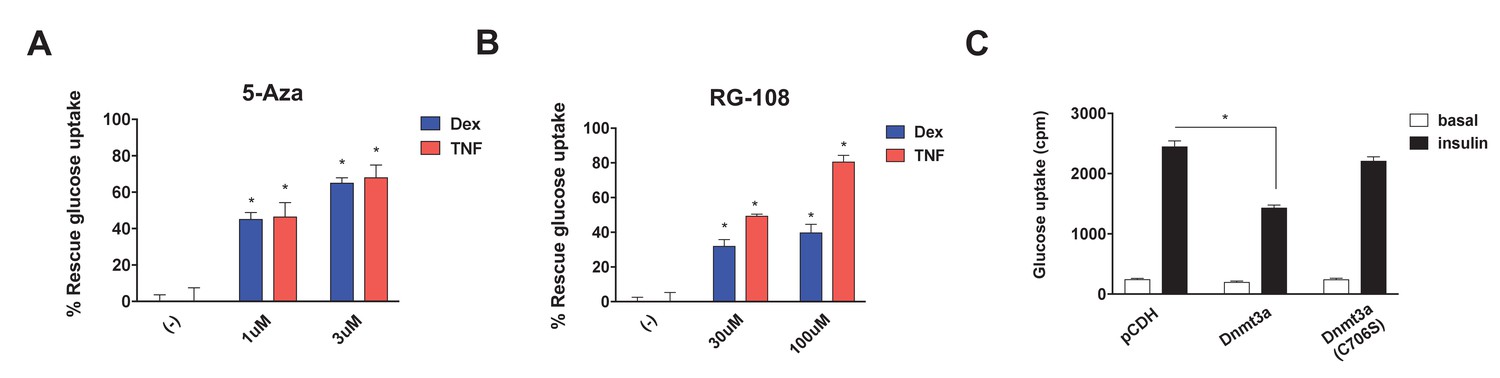
DNA methyltransferase activity is critical for Dnmt3a to mediate IR.
Insulin-stimulated glucose uptake assay was conducted using 3T3-L1 adipocytes treated with Dnmt inhibitors (A, 5-Aza; B, RG-108) and Dex or TNF for 4 days. Shown is the % of insulin-stimulated glucose uptake rescued by Dnmt inhibitors (n = 6, p<0.05). (C) Basal and insulin-stimulated glucose uptake in mature 3T3-L1 adipocytes transduced with wild-type Dnmt3a vs. a catalytically inactive allele (C706S) (n = 6, p<0.05, Student’s t-test, mean ±s.e.m.).
-
Figure 3—source data 1
Figure 3—source data.
- https://doi.org/10.7554/eLife.30766.015
Figure 3—figure supplement 1

Dnmt inhibitors confer protection from Dex- and TNF-mediated IR.
(A–F). Insulin-stimulated glucose uptake assay was conducted on 3T3-L1 adipocytes co-treated with Dex or TNF and the Dnmt inhibitors (A) RG-108, (B) 5-Azacytidine (5-Aza), (C, D) theaflavin-3,3’-digallate (TF3), and (E, F) epigallocatechin gallate (ECCG) for 4 days. Basal and insulin-stimulated glucose uptake shown in (A, B, D, and F). (C and E) show the % of insulin-stimulated glucose uptake rescued by Dnmt inhibitors (n = 6, p<0.05, Student’s t-test, mean ±s.e.m.).
-
Figure 3—figure supplement 1—source data 1
Figure 3—figure supplement 1—source data.
- https://doi.org/10.7554/eLife.30766.014
Figure 4 with 5 supplements

Adipose-specific Dnmt3a KO mice display improved whole body insulin sensitivity and glucose tolerance on HFD.
(A) Body weight of Dnmt3aAdiKO and control mice on HFD (n = 7, 9, p<0.05, Student’s t-test, mean ±s.e.m.). (B) Body composition after 10 weeks of HFD (n = 7, 9). (C) Effect of long-term fasting (16 hr) on body weight or body composition by EchoMRI. Shown is % loss after fasting (n = 14, 14, p<0.05, Student’s t-test, mean ±s.e.m.). (D) Glucose tolerance test after 9 weeks on HFD (n = 7, 9, p<0.05, Student’s t-test, mean ±s.e.m.). (E) The area under curve (AUC) in (D). (F) Insulin tolerance test after 11 weeks on HFD (n = 7, 9, p<0.05, Student’s t-test, mean ±s.e.m.). (G) AUC in (F). (H) Fed and fasted insulin levels measured by ELISA (n = 7, 9 p<0.05, Student’s t-test, mean ±s.e.m.) (I) Immunoblot of total and phospho-AKT and IRS-1 in eWAT after IP insulin. (J) Quantification of western blot in (I).
-
Figure 4—source data 1
Figure 4—source data.
- https://doi.org/10.7554/eLife.30766.027
Figure 4—figure supplement 1
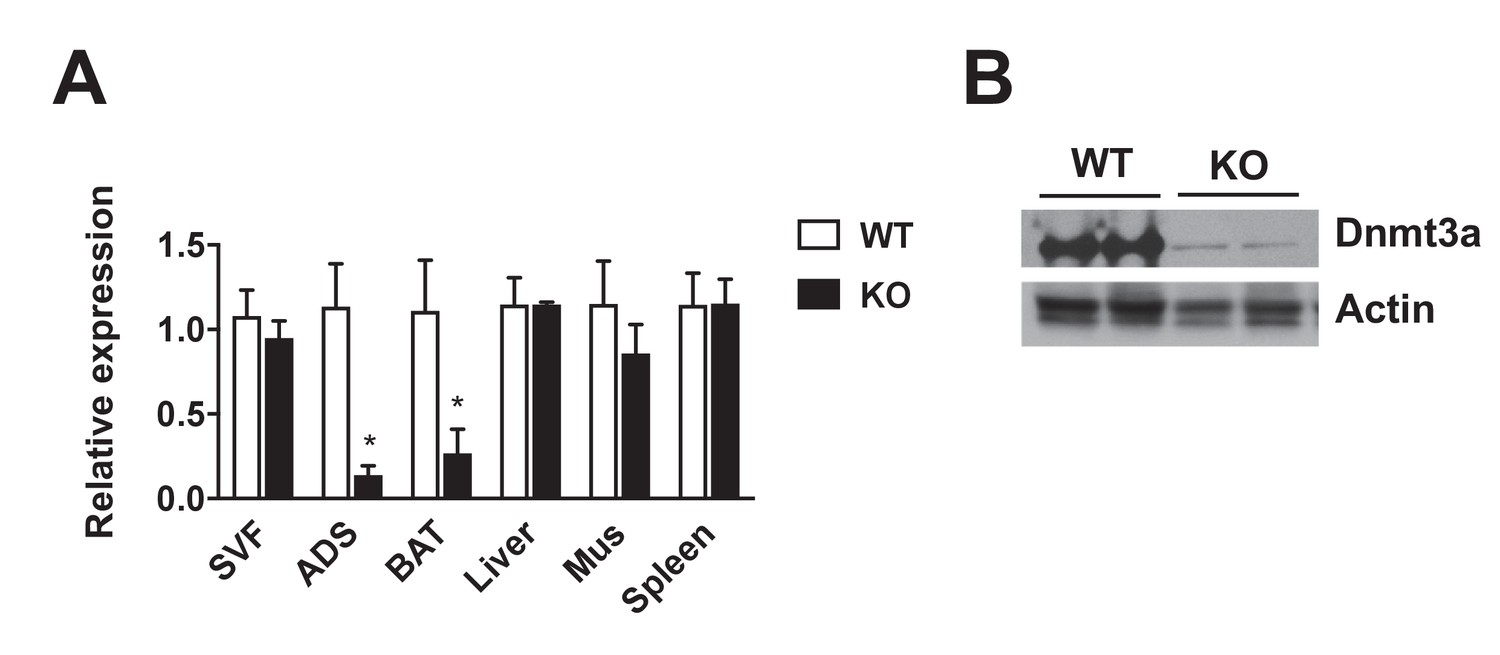
Adipose-specific deletion of Dnmt3a.
Adipose tissue deletion of Dnmt3a was confirmed in 8 wk-old Dnmt3aAdiKO (KO) mice by qPCR (n = 3, p<0.05, Student’s t-test, mean ±s.e.m.) (A) and western blot (B).
-
Figure 4—figure supplement 1—source data 1
Figure 4—figure supplement 1—source data.
- https://doi.org/10.7554/eLife.30766.018
Figure 4—figure supplement 2
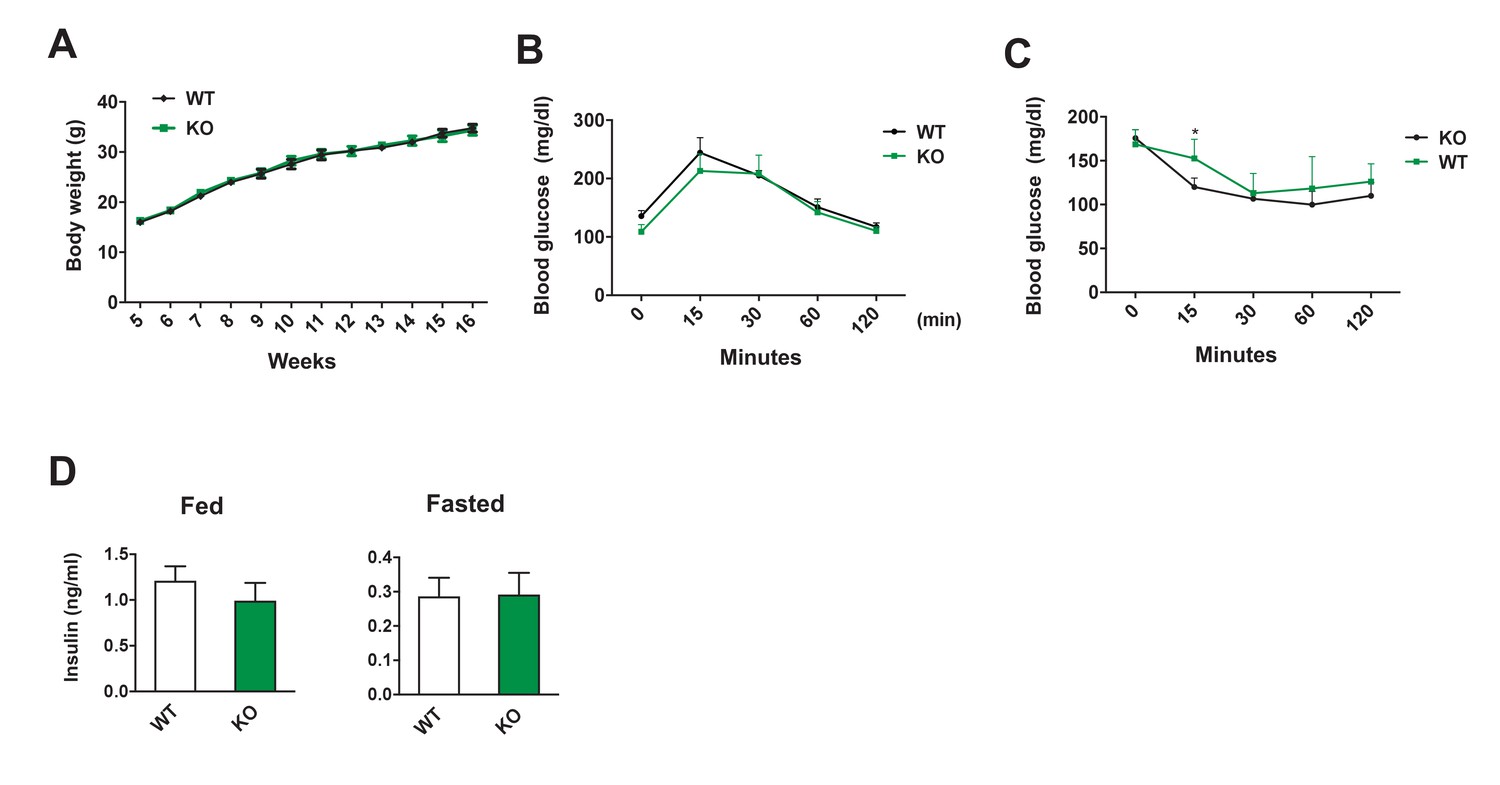
Metabolic features of Dnmt3aAdiKO mice on chow.
(A) Body weight of Dnmt3aAdiKO mice on chow. Glucose (B) and insulin tolerance test (C) on 11 and 12 wk old KO and WT mice on chow. (D) Insulin levels of fed and fasted chow-fed KO and WT mice as measured by ELISA. (n = 8, 8, Student’s t-test, mean ±s.e.m.).
-
Figure 4—figure supplement 2—source data 1
Figure 4—figure supplement 2—source data.
- https://doi.org/10.7554/eLife.30766.020
Figure 4—figure supplement 3
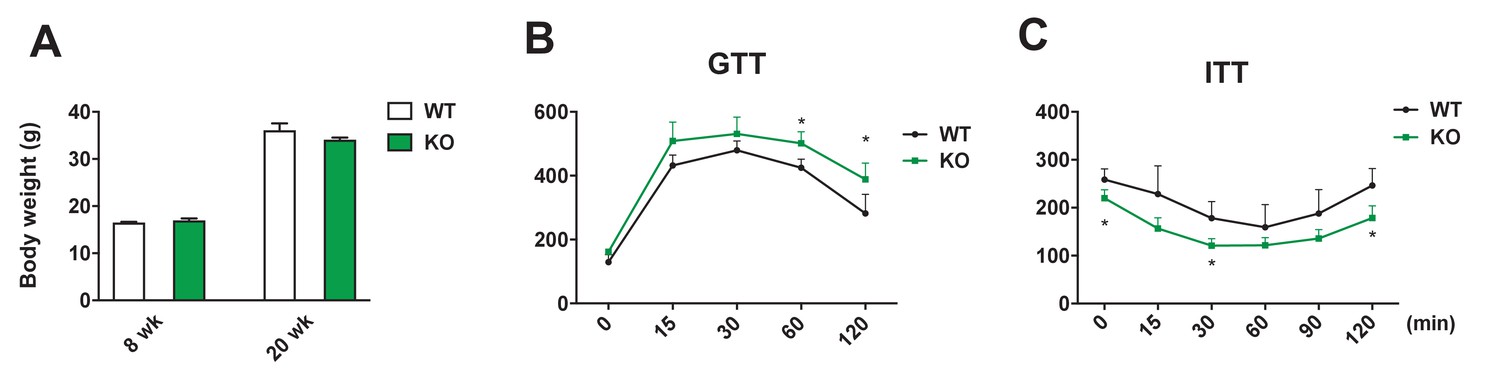
Metabolic features of female Dnmt3aAdiKO on HFD.
(A) Body weight was measured at 8-wk-old mice prior to HFD regimen and at 22-wk-old mice on HFD. Glucose (B) and insulin tolerance test (C) on 19 and 20 wk old KO and WT mice on HFD. (n = 6, 6, Student’s t-test, mean ±s.e.m.).
-
Figure 4—figure supplement 3—source data 1
Figure 4—figure supplement 3—source data.
- https://doi.org/10.7554/eLife.30766.022
Figure 4—figure supplement 4
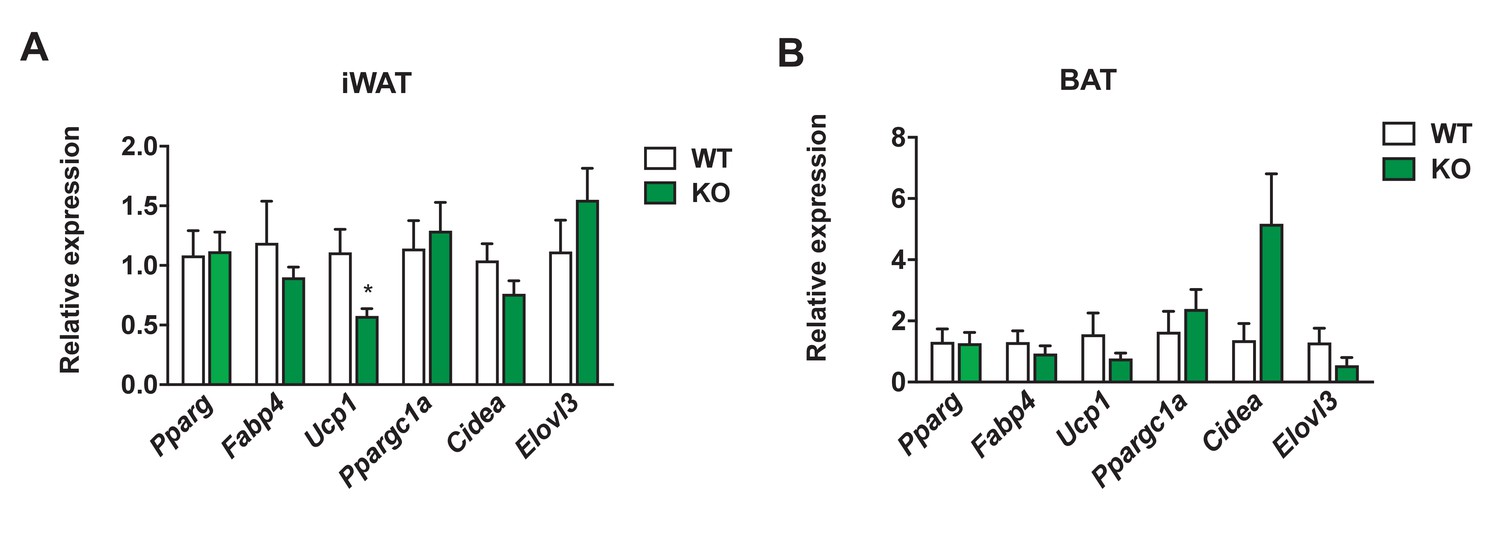
Gene expression profile of thermogenic genes in Dnmt3aAdiKO mice on HFD.
The expression of major thermogenic genes was measured by qPCR in iWAT (A) and BAT (B) from WT and KO mice on HFD (iWAT: n = 6,6; BAT n = 5,5 Student’s t-test, mean ±s.e.m.).
-
Figure 4—figure supplement 4—source data 1
Figure 4—figure supplement 4—source data.
- https://doi.org/10.7554/eLife.30766.024
Figure 4—figure supplement 5
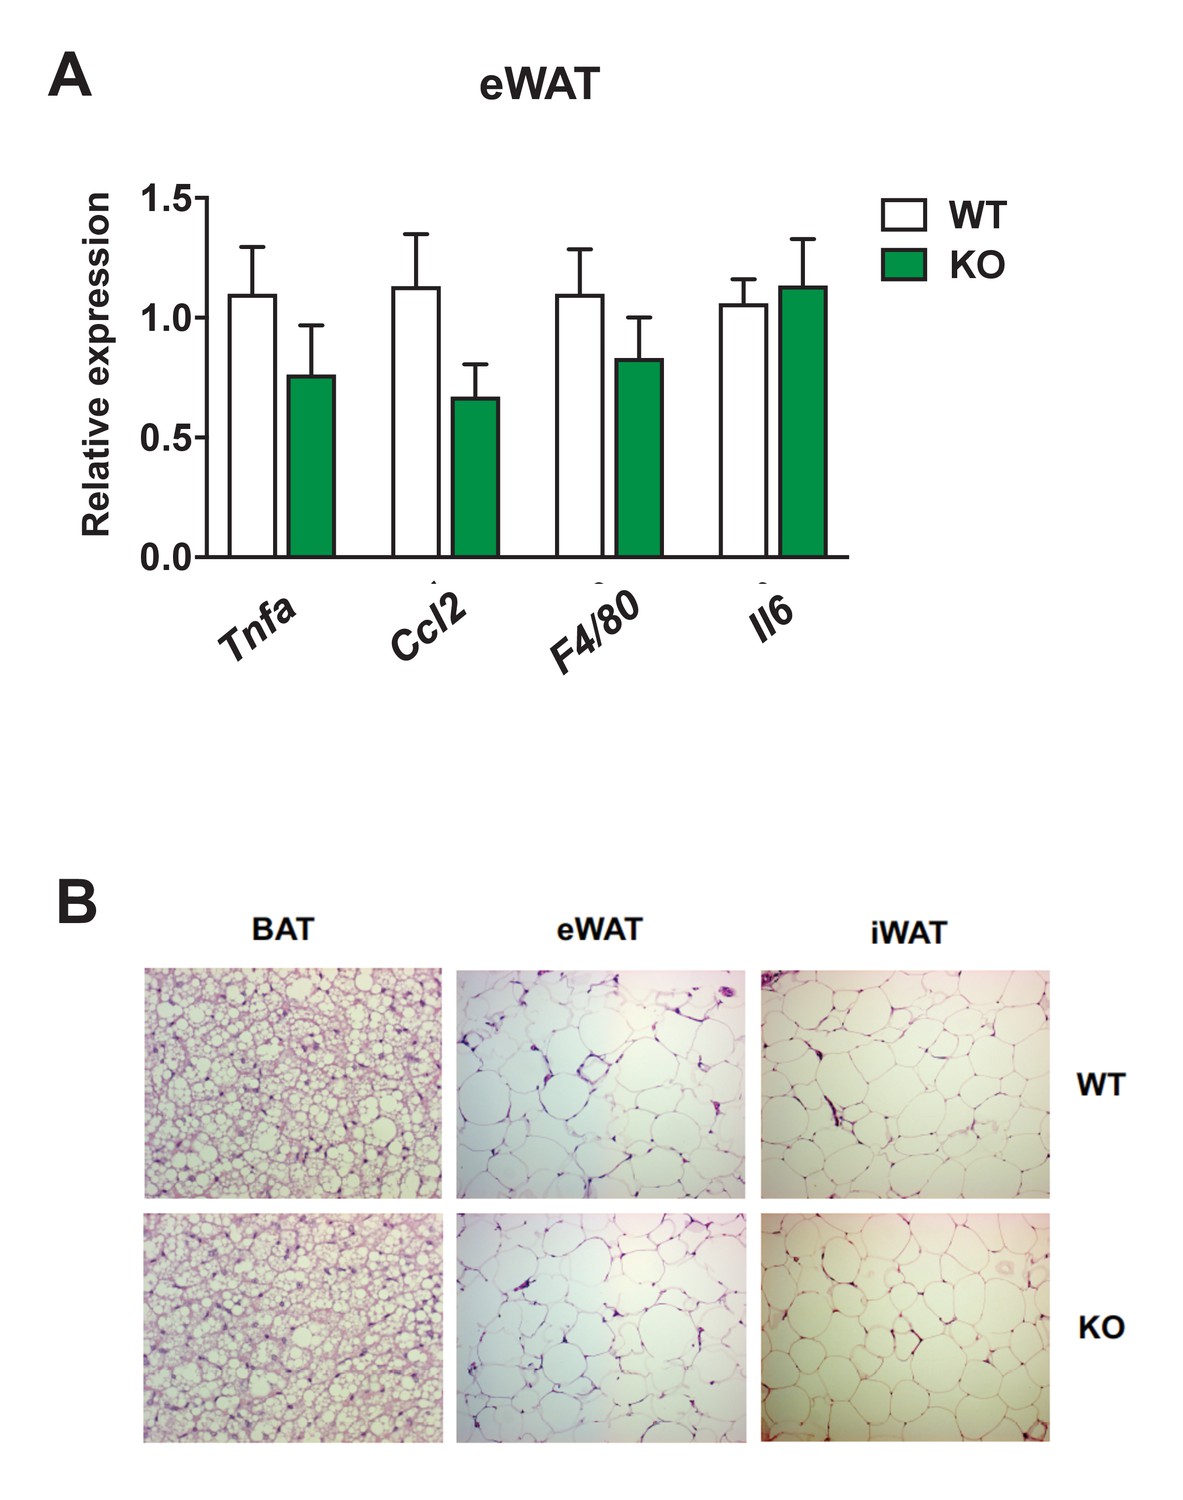
Gene expression analysis of proinflammatory genes and histology examination of eWAT from Dnmt3af/f and Dnmt3aAdiKO mice on HFD.
The expression of major proinflammatory genes was measured by qPCR in iWAT (A) and BAT (B) from WT and KO mice on HFD (iWAT: n = 6, 6; BAT n = 5,5 Student’s t-test, mean ±s.e.m.). (C) Representative microscopic image of adipose depots from WT and KO mice on HFD after staining with hematoxylin and eosin (H&E).
-
Figure 4—figure supplement 5—source data 1
Figure 4—figure supplement 5—source data.
- https://doi.org/10.7554/eLife.30766.026
Figure 5 with 1 supplement
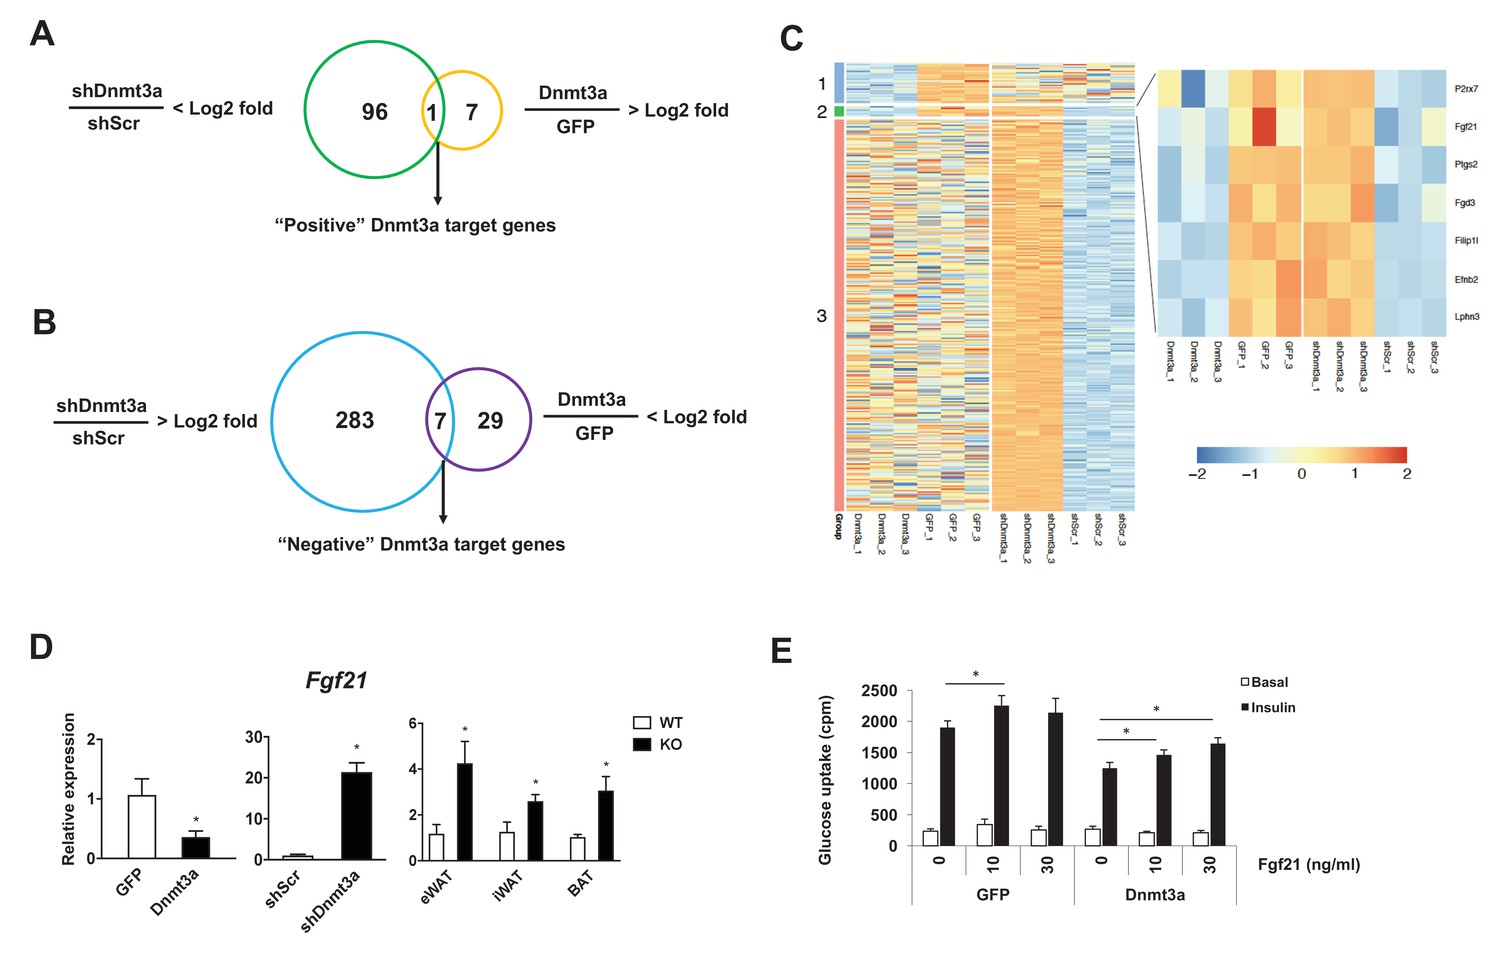
Fgf21 is a key target gene of Dnmt3a.
Venn diagram showing the number of positive (A) and negative (B) Dnmt3a target genes through comparative analysis of RNA-seq profiles from Dnmt3a knockdown and overexpressing adipocytes. (C) Heat map showing differentially regulated genes by Dnmt3a overexpression and knock-down. Group 1: Genes that are down-regulated by Dnmt3a overexpression; Group 2: Genes that are down-regulated by Dnmt3a overexpression and up-regulated by Dnmt3a knock-down; Group 3: Genes that are up-regulated by Dnmt3a knock-down. (D) Fgf21 mRNA expression in Dnmt3a overexpressor (left) and knock-down (middle) L1 adipocytes and in fractionated adipocytes (right) from Dnmt3aAdiKO and Dnmt3af/f mice on HFD (n = 5). (E) Mature 3T3-L1 adipocytes expressing GFP or Dnmt3a treated with indicated amount of recombinant Fgf21 for 48 hr (or vehicle), and tested for insulin sensitivity by 3H-2-DG assay. Shown is basal and insulin-stimulated glucose uptake. (n = 6 mice, p<0.05, Student’s t-test, mean ±s.e.m.).
-
Figure 5—source data 1
Figure 5—source data.
- https://doi.org/10.7554/eLife.30766.031
Figure 5—figure supplement 1
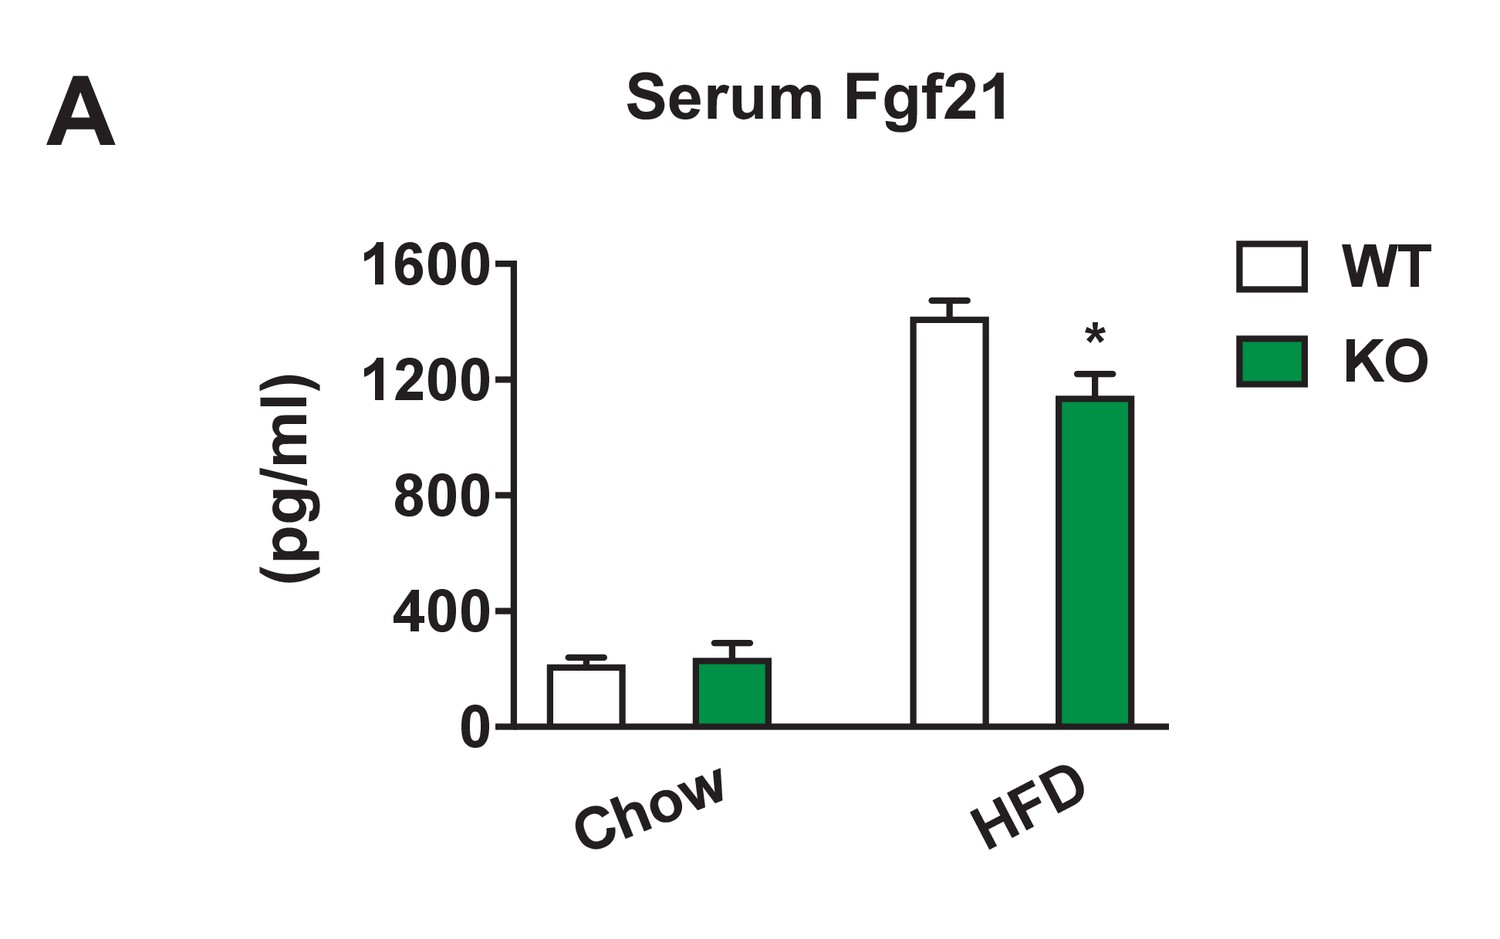
Serum Fgf21 levels in Dnmt3aAdiKO mice.
(A) Serum Fgf21 levels measured by ELISA in WT and KO mice on 12-wk-old chow (n = 6) or after 14 weeks of HFD (n = 7, p<0.05, Student’s t-test, mean ±s.e.m.).
-
Figure 5—figure supplement 1—source data 1
Figure 5—figure supplement 1—source data.
- https://doi.org/10.7554/eLife.30766.030
Figure 6
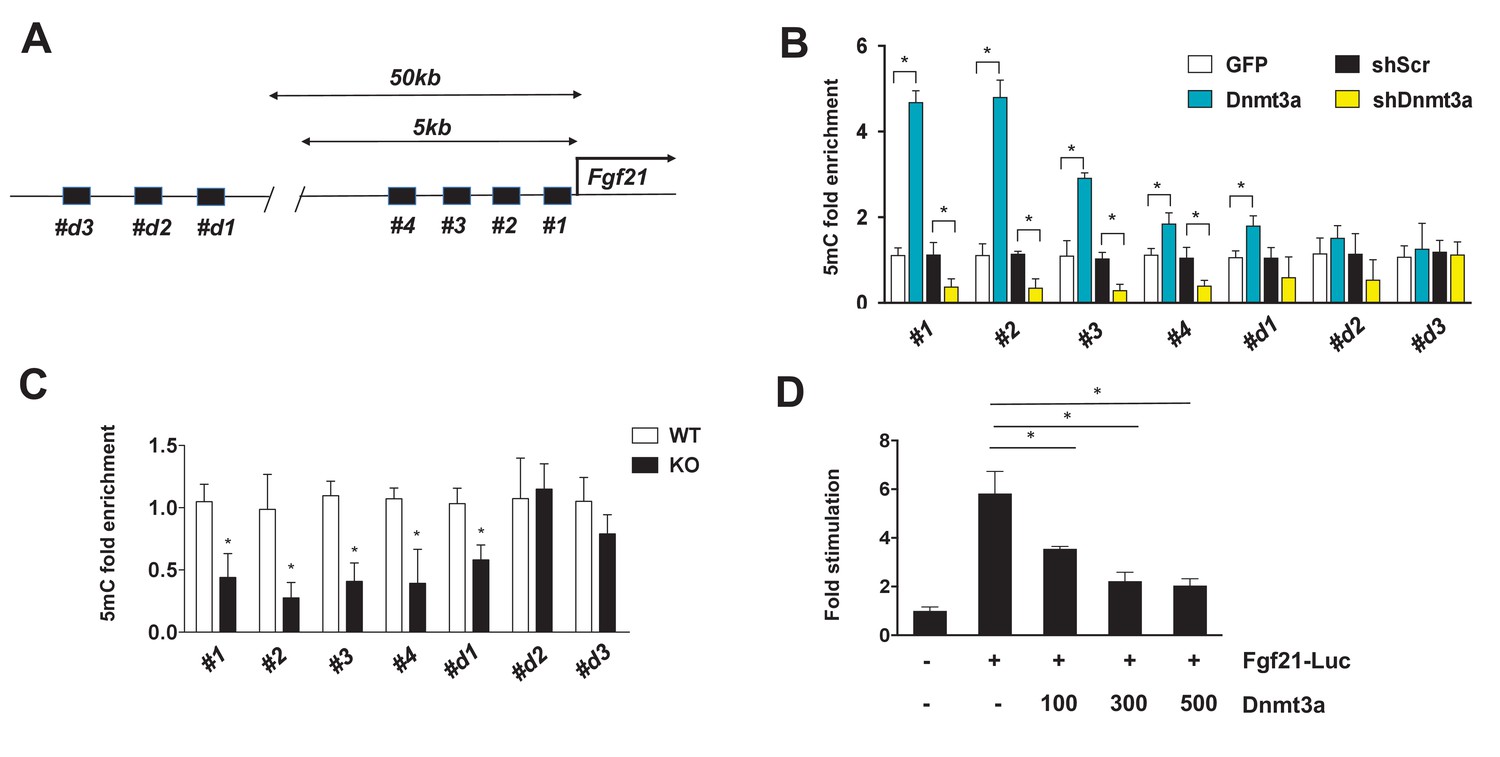
Dnmt3a-mediated methylation of the Fgf21 gene promoter.
(A) Schematic showing the tested regions for MeDIP-qPCR at the Fgf21 locus. Target regions were chosen using MethFinder (http://www.urogene.org/methprimer) on regions proximal (5 kb) and distal (50 kb) to the Fgf21 transcription start site. (B) MeDIP-qPCR was performed using genomic DNA extracted from 3T3-L1 adipocytes transduced with GFP vs. Dnmt3a or shScr vs. shDnmt3a. Shown is relative fold enrichment of 5mC of Dnmt3a overexpressor and KD cells over control cells. (C) MeDIP-qPCR was performed using genomic DNA from Dnmt3a KO and Flox mice on HFD. Shown is relative fold enrichment of 5mC of KO over WT samples. (D) Fgf21-promoter reporter (1497/+5) assay performed by co-transfection of the indicated amounts of Dnmt3a expression vector. (n = 3 mice, p<0.05, Student’s t-test, mean ±s.e.m.).
-
Figure 6—source data 1
Figure 6—source data.
- https://doi.org/10.7554/eLife.30766.033
Figure 7
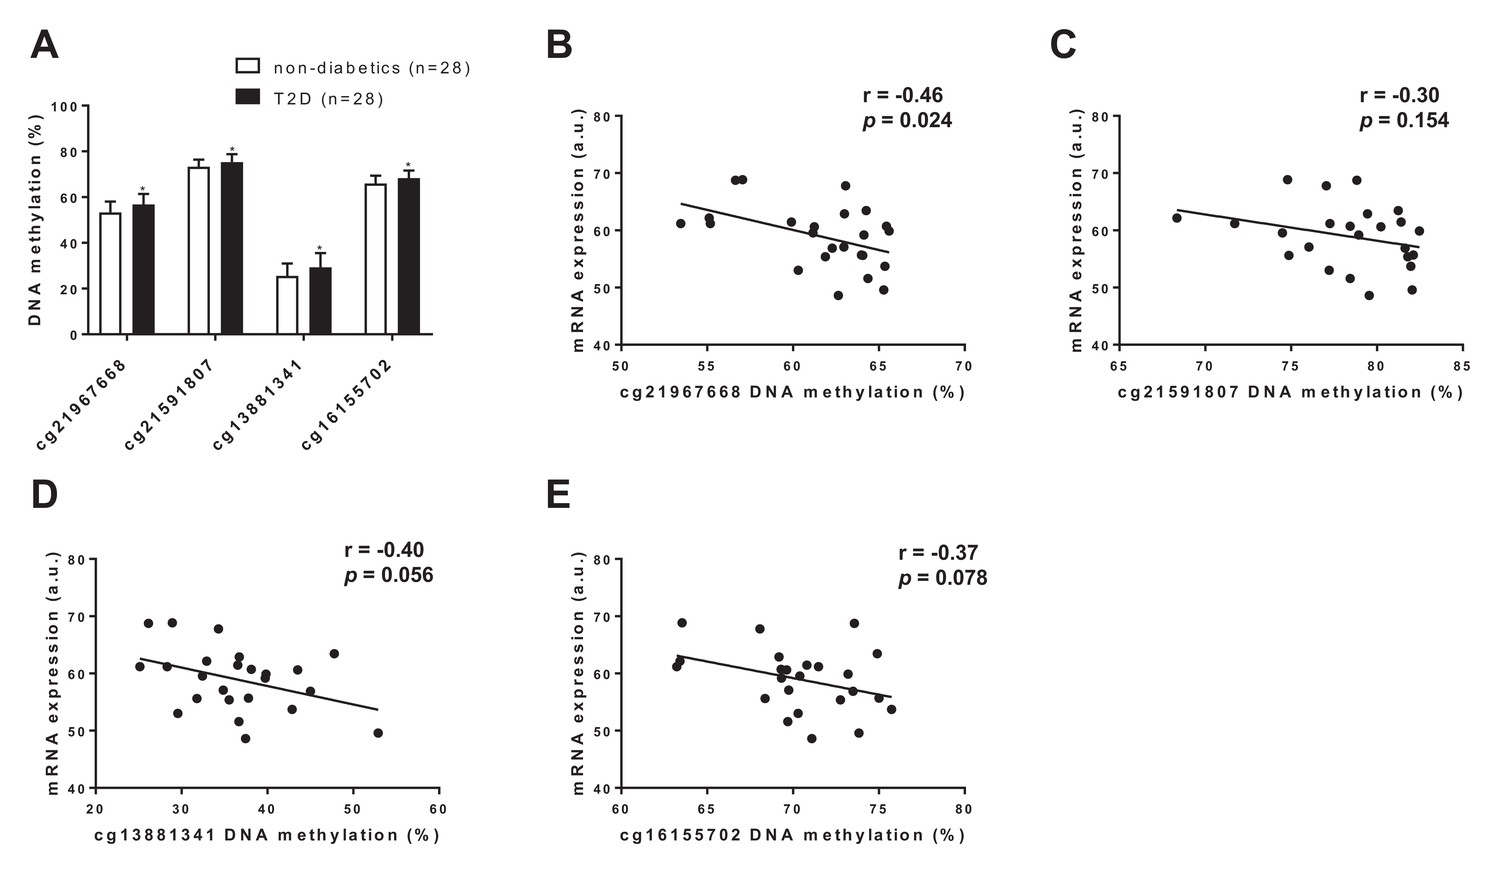
FGF21 DNA methylation in adipose tissue from subjects with T2D compared with controls.
(A) Four CpG sites annotated to FGF21 with significant difference in adipose tissue DNA methylation between subjects with type 2 diabetes and controls. (p<0.01, paired Wilcoxon statistics, mean ±s.d.). (B–D) Correlations between DNA methylation and mRNA expression for CpG sites significantly associated with T2D in human adipose tissue. (r = Pearson correlation coefficient.).
Author response image 1
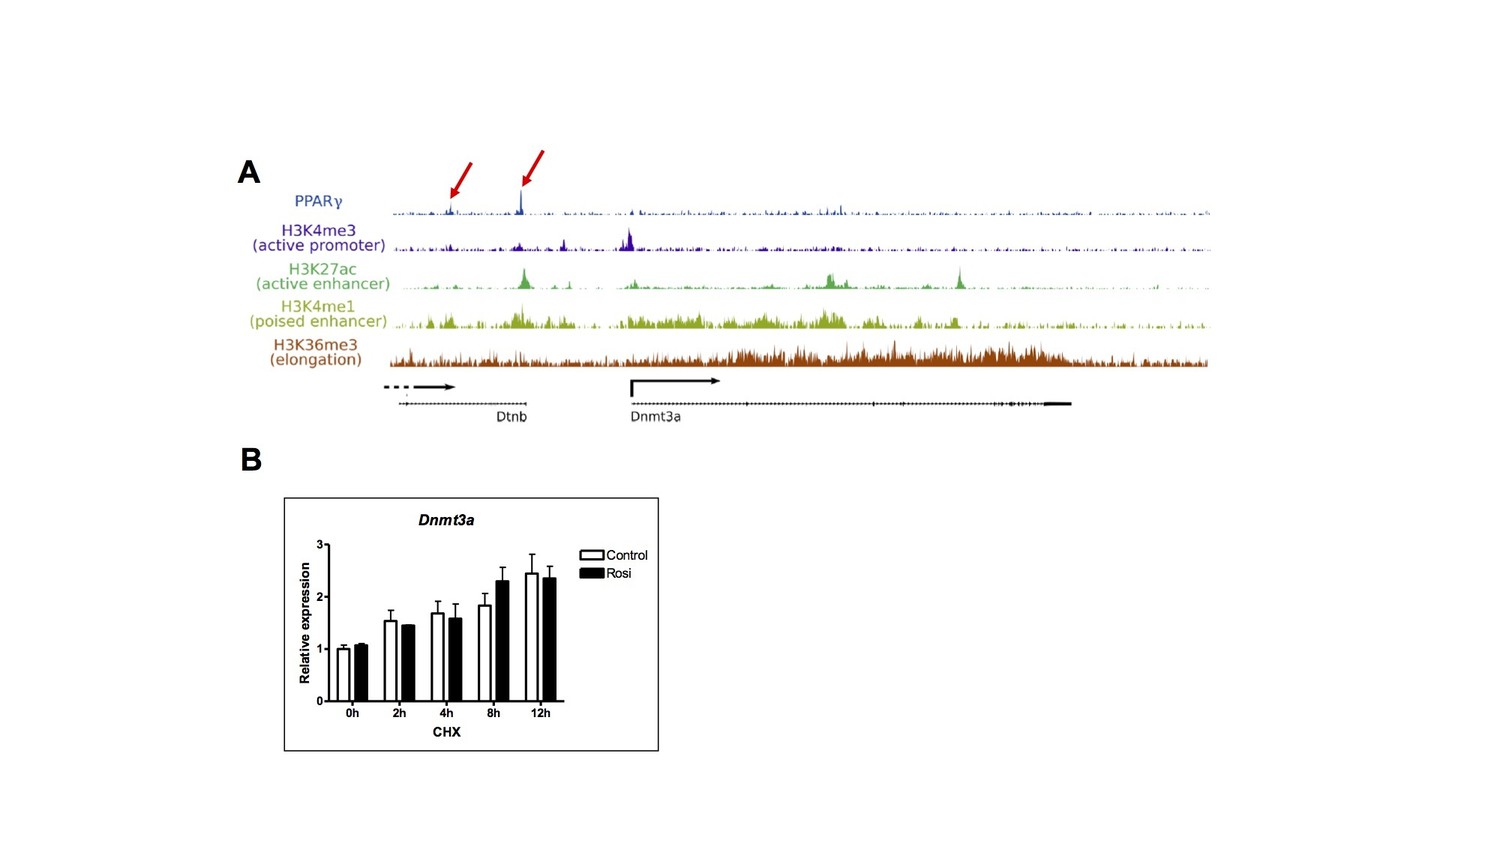
(A) Histograms of PPARγ-ChIP and histone modification fragments near the mouse Dnmt3a locus (Mikkelsen et al., 2010).
Depicted with arrow are PPARγ peaks that co-localize with H3K4me1 and/or H3K27ac enhancer peaks. (B) The effect of Rosi (1uM) on the expression of Dnmt3a in the presence/absence of cycloheximide (10ug/ml) in mature 3T3-L1 adipocytes.
Additional files
-
Supplementary file 1
Genes that are up-regulated (UP) and down-regulated (DOWN) Dnmt3a vs.
GFP and shDnmt3a/shScr.
- https://doi.org/10.7554/eLife.30766.035
-
Supplementary file 2
DNA methylation of four CpG sites annotated to Fgf21 showing differential DNA methylation in adipose tissue of a case control study for type 2 diabetes.
- https://doi.org/10.7554/eLife.30766.036
-
Supplementary file 3
Oligonucleotide sequences used in this manuscript.
- https://doi.org/10.7554/eLife.30766.037
-
Supplementary file 4
Clinical characteristics of study subjects included in the discordant twin cohort and the case control cohort.
- https://doi.org/10.7554/eLife.30766.038
-
Transparent reporting form
- https://doi.org/10.7554/eLife.30766.039
Download links
A two-part list of links to download the article, or parts of the article, in various formats.
Downloads (link to download the article as PDF)
Open citations (links to open the citations from this article in various online reference manager services)
Cite this article (links to download the citations from this article in formats compatible with various reference manager tools)
Dnmt3a is an epigenetic mediator of adipose insulin resistance
eLife 6:e30766.
https://doi.org/10.7554/eLife.30766


