ketu mutant mice uncover an essential meiotic function for the ancient RNA helicase YTHDC2
- Memorial Sloan Kettering Cancer Center, United States
- Weill Cornell Medicine, United States
Figures
Figure 1
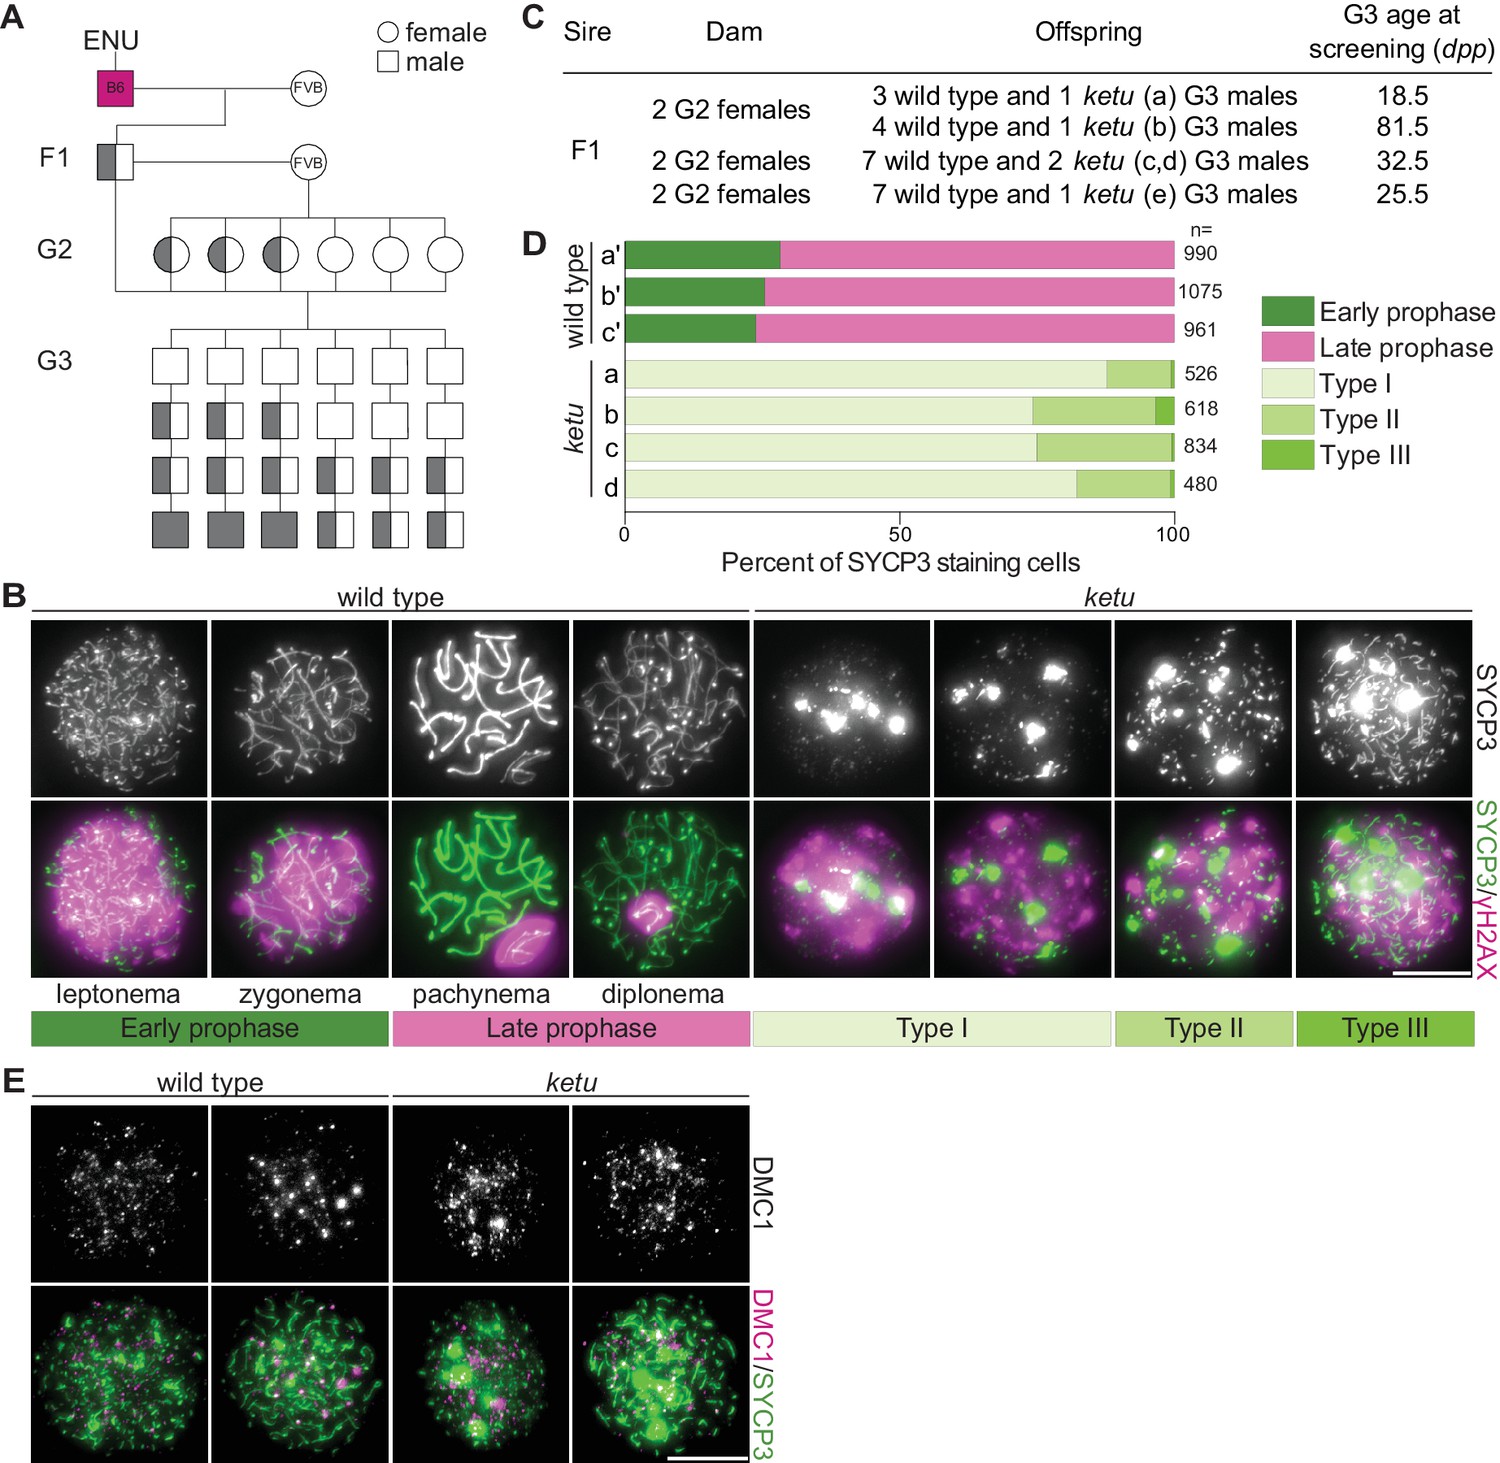
Mice from the ENU-induced mutant line ketu have meiotic defects.
(A) Breeding scheme. Mutagenized males (B6) were crossed to females of a different strain (FVB) to produce founder (F1) males that were potential mutation carriers. Each F1 male was then crossed to wild-type FVB females. If an F1 male was a mutation carrier, half of his daughters (second generation, G2) should also be carriers, so the G2 daughters were crossed back to their F1 sire to generate third-generation (G3) offspring that were potentially homozygous. For a line carrying a single autosomal recessive mutation of interest, one eighth of G3 males were expected to be homozygous. Un-filled shapes represent animals that are wild-type for a mutation of interest, half-filled shapes are heterozygous carriers, and filled shapes are homozygotes. (B) Representative images of squashed spermatocyte preparations immunostained for SYCP3 and γH2AX. Mutant spermatocytes were classified as Types I, II, or III on the basis of SYCP3 patterns. (C) Screen results for the ketu line. The F1 male was harem-bred to six G2 females, yielding 26 G3 males that displayed either a wild-type or ketu (mice a, b, c, d, e) phenotype. (D) Distribution of SYCP3-staining patterns in four G3 ketu mutants (a, b, c, d) and their phenotypically wild-type littermates (a′, b′, c′). Wild-type spermatocytes were classified as either early prophase-like (leptonema or zygonema) or late prophase-like (pachynema or diplonema). Spermatocytes from mutant mice were categorized as described in panel B. The number of SYCP3-positive spermatocytes counted from each animal (n) is indicated and raw data are provided in Figure 1—source data 1. (E) Representative images of squashed spermatocyte preparations immunostained for DMC1 and SYCP3. Scale bars in panels B and E represent 10 μm.
-
Figure 1—source data 1
Number of SYCP3-staining cells plotted in Figure 1D.
- https://doi.org/10.7554/eLife.30919.003
Figure 2

ketu mice harbor a point mutation in Ythdc2.
(A) SNP genotypes of five G3 ketu mutants (a, b, c, d, e; from Figure 1C) obtained using the Illumina Medium Density Linkage Panel. The single 30.59-Mbp region of B6 SNP homozygosity that is shared between mutants is highlighted in pink. (B) Top: Schematic of Ythdc2 (as predicted by Ensembl release 89) showing the locations of the ENU-induced lesion and the gRNA used for CRISPR/Cas9-targeting. Bottom: The density of ENCODE long RNA-sequencing reads (release 3) from adult testis within a window spanning from 3500 bp upstream to 200 bp downstream of Ythdc2. The vertical viewing range is 0–50; read densities exceeding this range are overlined in pink. (C) The ketu and CRISPR/Cas9-induced (em1) alleles of Ythdc2. (D) Ythdc2 and Meioc expression level estimate (mean reads per kilobase per million mapped reads (RPKM) values provided by ENCODE; included in Figure 2—source data 1) in adult and embryonic tissues.
-
Figure 2—source data 1
Ythdc2 and Meioc RPKM values plotted in Figure 2D.
- https://doi.org/10.7554/eLife.30919.005
Figure 3 with 1 supplement
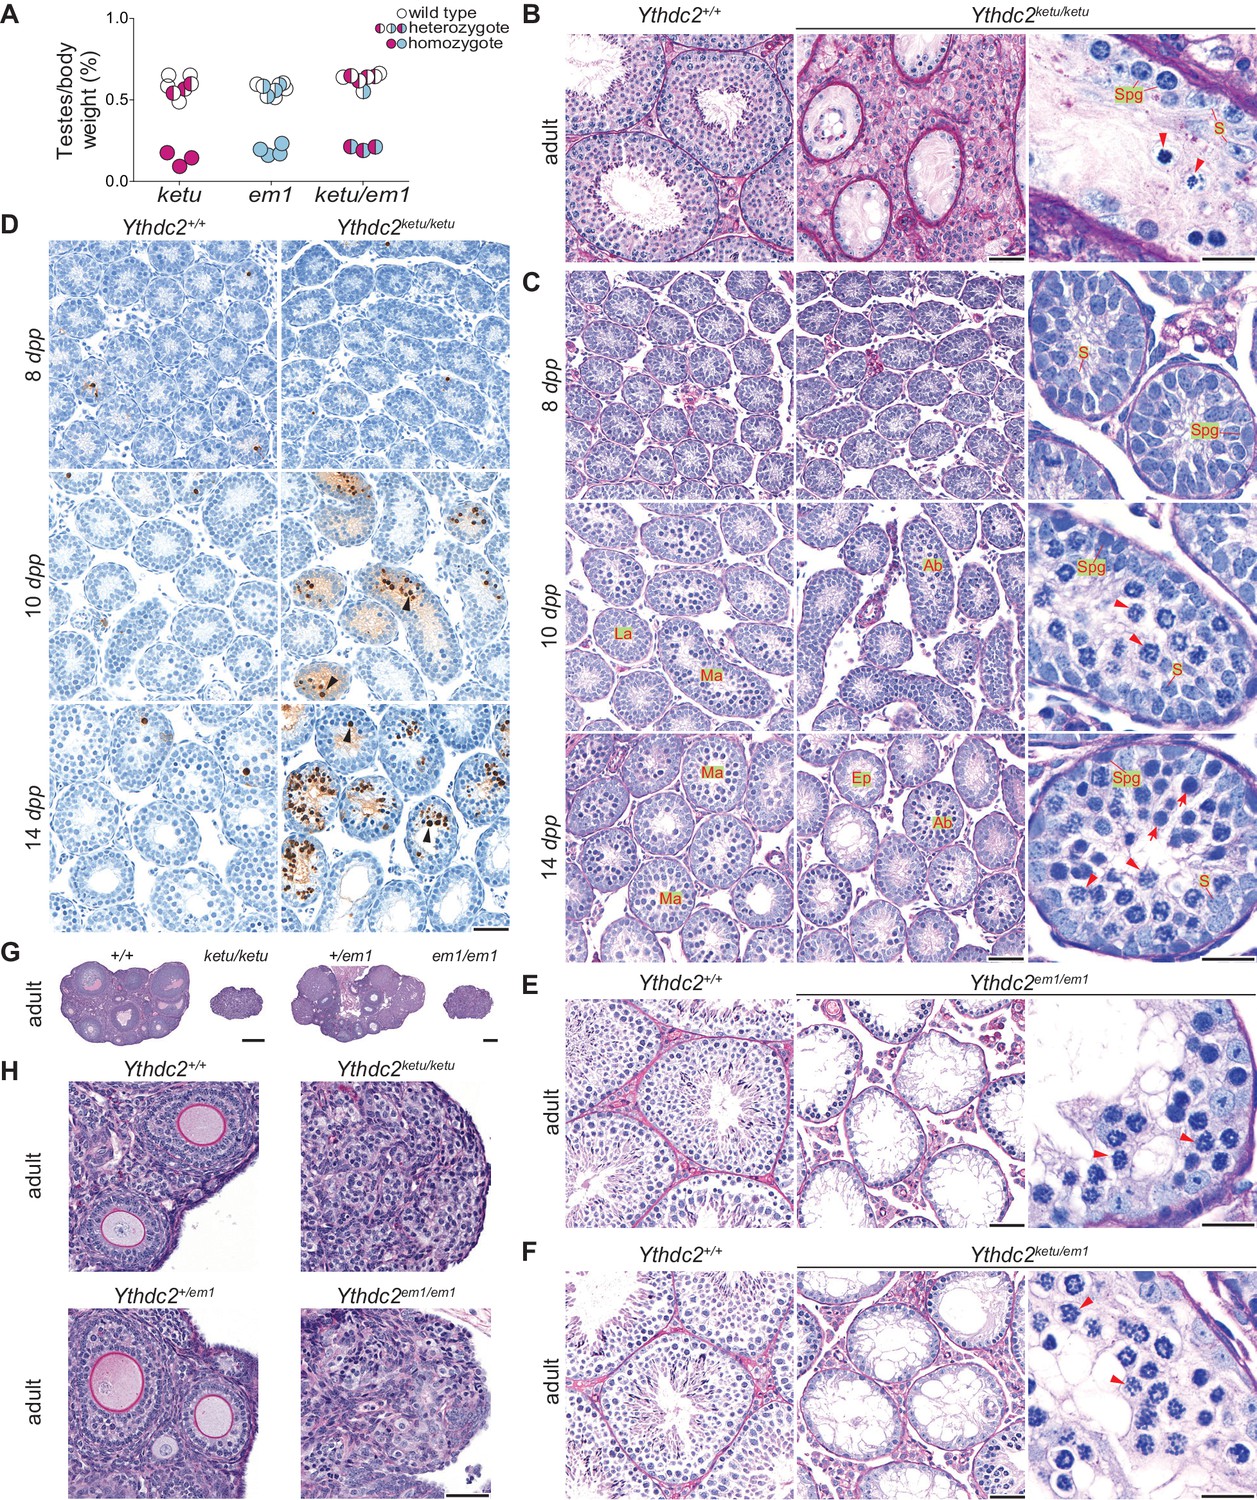
ketu and em1 alleles of Ythdc2 lead to gametogenic failure and fail to complement each other.
(A) The ratios of testes weight to body weight for 6- to 34-week-old mice (Figure 3—source data 1). (B) PAS-stained sections of Bouin’s-fixed testes from an 8-month-old Ythdc2ketu/ketu male and a wild-type littermate. (C) PFA-fixed, PAS-stained testis sections. In wild type, examples are indicated of a less advanced (‘La’) tubule harboring cells with spermatogonia-like morphology and Sertoli cells, and more advanced (‘Ma’) tubules harboring cells with morphological characteristics of pre-leptonema and meiotic prophase stages. In the mutant, examples are indicated of abnormal (‘Ab’) tubules containing cells with condensed and individualized chromosomes (arrowheads), and an emptier-looking (‘Ep’) tubule harboring cells with spermatogonia-like morphology and Sertoli cells. (D) TUNEL assay on testis sections. Black arrowheads point to TUNEL-positive cells (stained dark brown). (E and F) PFA-fixed, PAS-stained testis sections from an 8-week-old Ythdc2em1/em1 male, a 7-week-old Ythdc2ketu/em1 male, and their wild-type littermates. (G and H) PFA-fixed, PAS-stained ovary sections from a 6-week-old Ythdc2ketu/ketu female and a wild-type littermate, and a 9-week-old Ythdc2em1/em1 female and a heterozygous littermate. In the higher magnification images of panels B, C, E, and F, arrowheads indicate cells with condensed and individualized chromosomes, arrows indicate cells with morphological characteristics of pre-leptonema and leptonema, and S and Spg indicate Sertoli cells and cells with morphological characteristics of spermatogonia, respectively. In panels B, C, E, and F, the scale bars represent 50 μm and 20 μm in the lower and higher magnification images, respectively. In panels D and H, the scale bars represent 50 μm and in panel G, they represent 300 μm.
-
Figure 3—source data 1
Testes and body weights plotted in Figure 3A.
- https://doi.org/10.7554/eLife.30919.009
Figure 3—figure supplement 1

Quantification of TUNEL assay.
TUNEL assays were performed on testis sections of Ythdc2ketu mutants (a, b) of indicated ages and their wild-type or heterozygous littermates (a′, b′). The number of seminiferous tubules counted from each animal is indicated (n). Raw data for panel A are provided in Figure 3—figure supplement 1—source data 1.
-
Figure 3—figure supplement 1—source data 1
Quantification of TUNEL assay plotted in panel A.
- https://doi.org/10.7554/eLife.30919.008
Figure 4 with 1 supplement
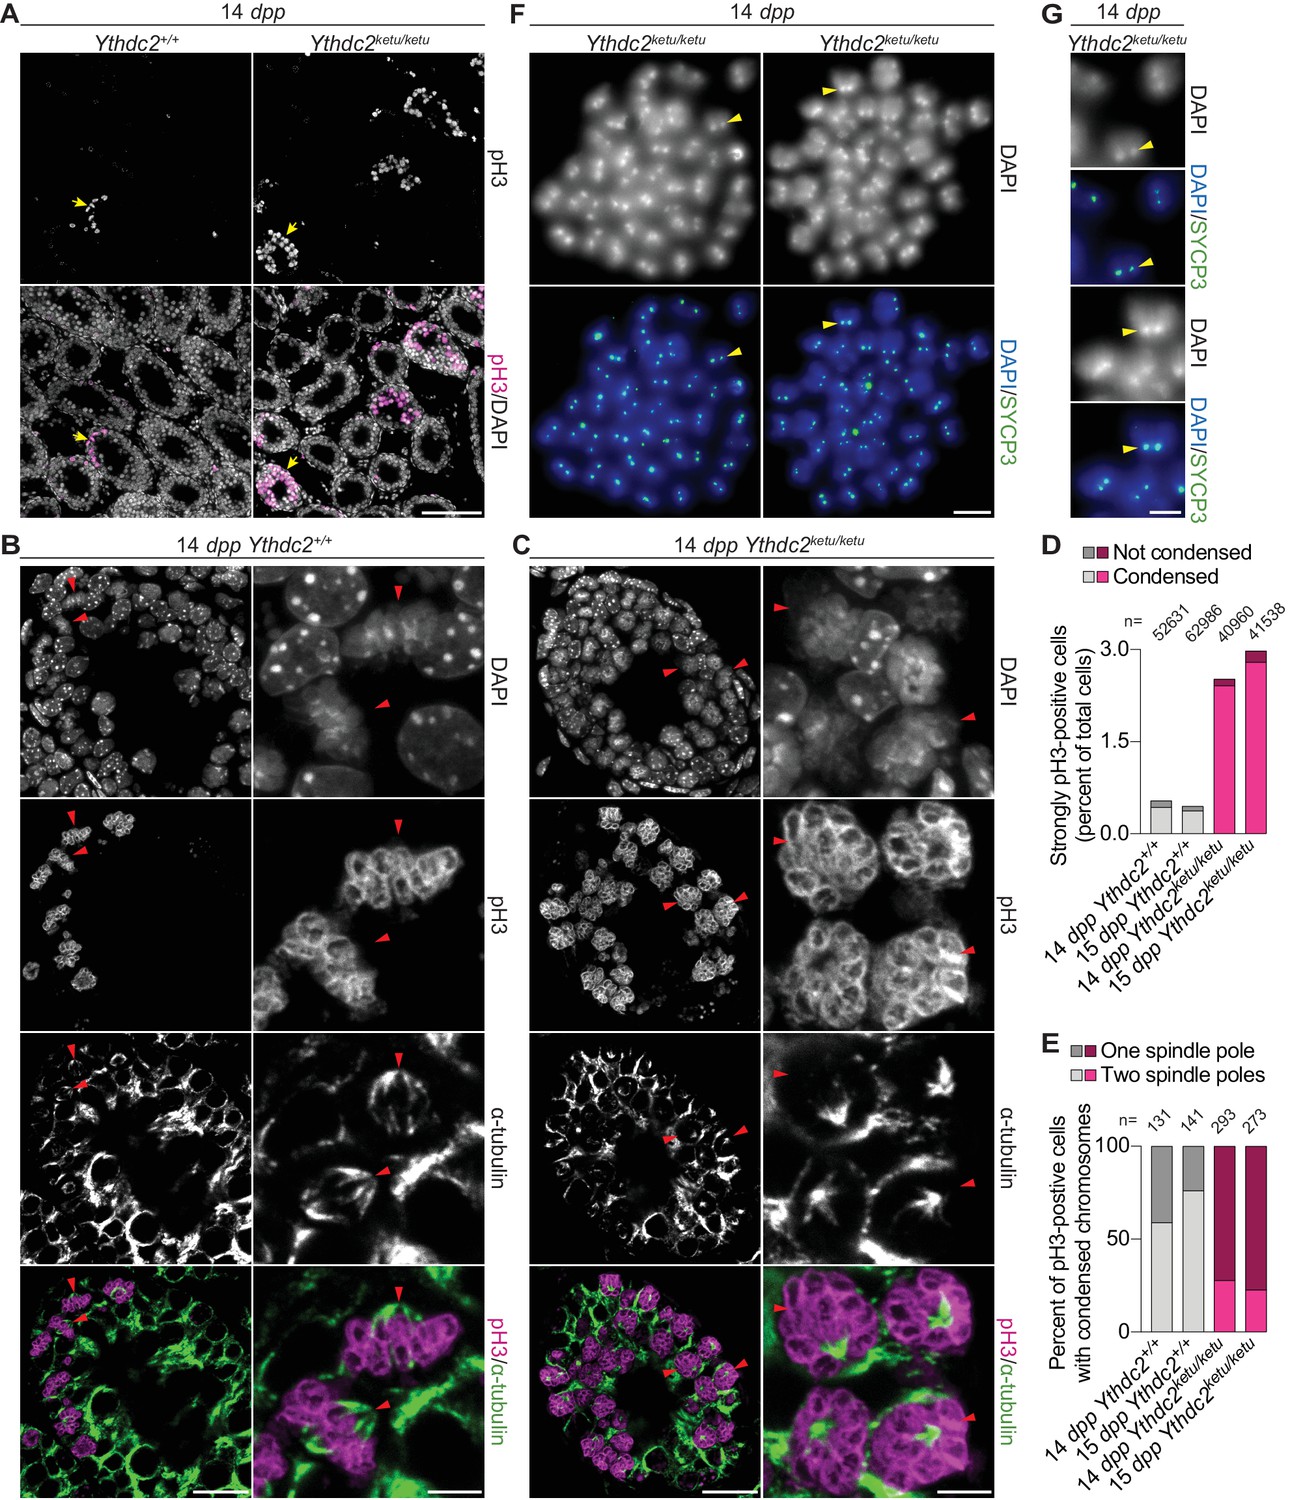
Ythdc2ketu/ketu spermatocytes show precocious meiotic progression.
(A) pH3 immunofluorescence on testis sections from 14-dpp Ythdc2ketu/ketu and wild-type littermates. Yellow arrows indicate seminiferous tubules with pH3-positive cells. (B and C) α-tubulin immunofluorescence on seminiferous tubules with pH3-positive cells (tubules indicated by yellow arrows in panel A). Red arrowheads point to pH3-positive cells with DAPI-staining indicative of condensed chromatin. In each of the panels, a lower (left) and higher (right) magnification view is shown. (D) Quantification of pH3 immunofluorescence on testis sections from 14-dpp-old and 15-dpp-old Ythdc2ketu/ketu and wild-type littermates. Cells with strong pH3 staining across chromatin were counted as pH3-positive and fractions of pH3-positive cells where chromatin appeared condensed (based on DAPI-staining) are indicated. The total number of testis cells counted from each animal is indicated (n). (E) Quantification of spindle pole number based on α-tubulin immunofluorescence on testis sections from 14-dpp-old and 15-dpp-old Ythdc2ketu/ketu and wild-type littermates. Cells with strong pH3 staining across chromatin as well as DAPI-staining indicative of condensed chromatin were scored for the presence of one or two spindle poles. Immunostained 4 μm testis sections were imaged using three optical sections (0.6 μm step size) along the z axis. Spindle poles that fell outside the focal planes or lay outside the tissue sectioning plane would be missed. Cells were not scored if they had no visible spindle poles or if the number of spindle poles could not be discerned because of strong intercellular α-tubulin immunofluorescence. Presumably, every spindle in wild type has two poles, so the frequency of spindles with only one detectable pole in the controls provides the empirical detection failure rate. The number of cells scored from each animal is indicated (n). (F) SYCP3 immunofluorescence on chromosome spreads of metaphase-like cells from a 14-dpp Ythdc2ketu/ketu animal. 37–40 SYCP3 foci doublets (yellow arrowheads) are visible in each spread. (G) Higher magnification view of SYCP3 foci doublets (corresponding to the yellow arrowheads in panel F), showing the colocalization of SYCP3 signal with the DAPI-bright pericentric regions. In panels A, F and G, the scale bars represent 100 μm, 10 μm, and 5 μm, respectively. In panels B and C, the scale bars represent 20 μm and 5 μm in the lower (left) and higher (right) magnification images, respectively. Raw data for panels D and E are provided in Figure 4—source data 1 and Figure 4—source data 2, respectively.
-
Figure 4—source data 1
Quantification of pH3 immunofluorescence plotted in Figure 4D.
- https://doi.org/10.7554/eLife.30919.012
-
Figure 4—source data 2
Quantification of spindle poles plotted in Figure 4E.
- https://doi.org/10.7554/eLife.30919.013
Figure 4—figure supplement 1
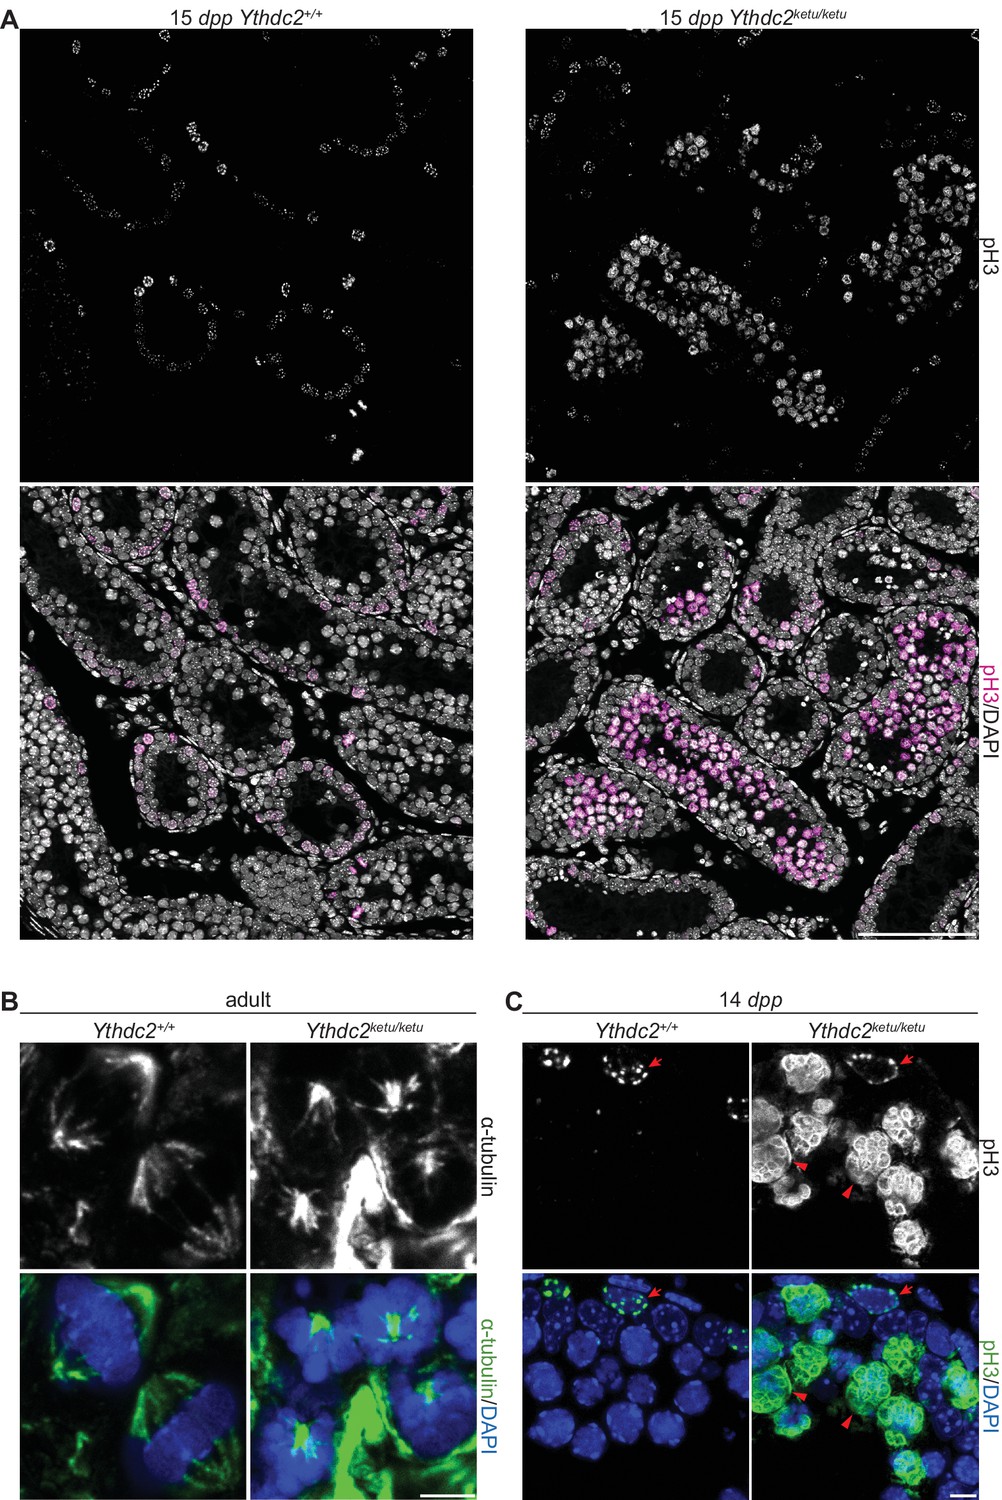
α-tubulin and pH3 immunofluorescence in Ythdc2ketu mutants.
(A) pH3 immunofluorescence on testis sections from 15-dpp Ythdc2ketu/ketu and wild-type littermates. (B) α-tubulin immunofluorescence on testis sections from 2-month-old Ythdc2ketu/ketu and wild-type littermates. (C) pH3 immunofluorescence on testis sections from 14-dpp Ythdc2ketu/ketu and wild-type littermates (same mice analyzed in Figure 4A). Arrows indicate cells with spermatogonia-like morphology and arrowheads point to cells with abnormally condensed chromosomes. In panel A, the scale bar represents 100 μm. In panels B,C the scale bars represent 5 μm.
Figure 5 with 1 supplement
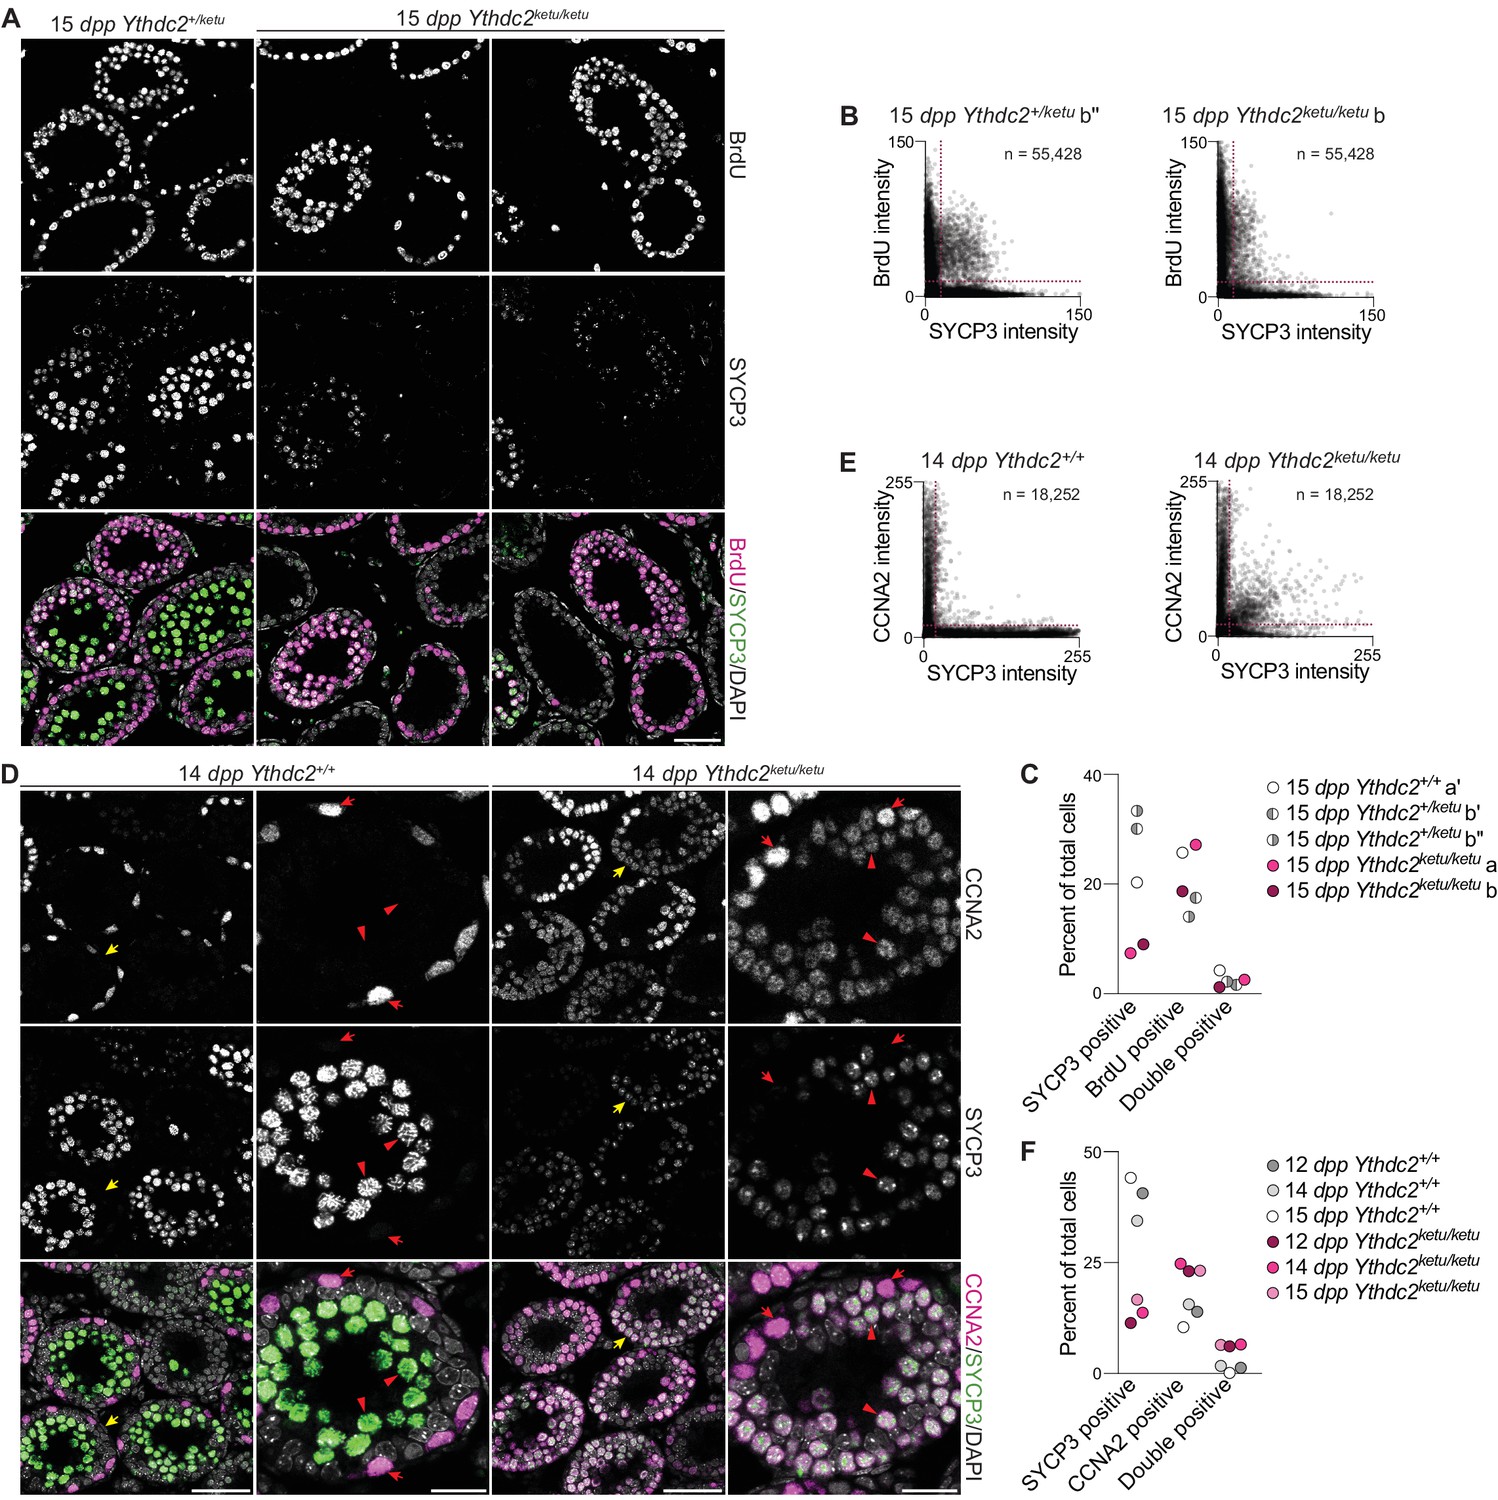
Mixed mitotic and meiotic characteristics of Ythdc2ketu/ketu spermatocytes.
(A) BrdU and SYCP3 immunofluorescence on testis sections from 15-dpp Ythdc2ketu/ketu and heterozygous littermates. Testes were fixed 2 hr after BrdU administration. (B) Scatter-plots showing BrdU and SYCP3 immunofluorescence intensity of testis cells from 15-dpp Ythdc2ketu/ketu (b) and heterozygous (b′′) littermates. Immunostained testis sections were imaged and average fluorescence intensities of individual cells were measured as 8-bit intensity values (0–255 AU). The number of cells scored from each animal is indicated (n) and dotted lines denote intensity thresholds applied for scoring cells as positively stained. (C) Quantification of BrdU and SYCP3 immunofluorescence on testis sections from 15-dpp-old Ythdc2ketu/ketu (a, b) and wild-type or heterozygous (a′, b′, b′′) littermates (same mice analyzed in panel B and Figure 5—figure supplement 1A). Fluorescence intensities were measured as described for panel B and a minimum intensity threshold of 15 AU was applied for scoring cells as positive for staining. (D) CCNA2 and SYCP3 immunofluorescence on testis sections from 14-dpp Ythdc2ketu/ketu and wild-type littermates. Yellow arrows in the lower magnification views (first and third columns) point to tubules of interest, which are shown at a higher magnification in the second and fourth columns. In the higher magnification views, red arrows point to cells with spermatogonia-like morphology and red arrowheads indicate SYCP3-positive spermatocytes. (E) Scatter-plots showing CCNA2 and SYCP3 immunofluorescence intensity of testis cells from 14-dpp Ythdc2ketu/ketu and wild-type littermates. Fluorescence intensities were measured as described for panel B and the number of cells scored from each animal is indicated (n). (F) Quantification of CCNA2 and SYCP3 immunofluorescence on testis sections from Ythdc2ketu/ketu and wild-type littermates of the indicated ages (same mice analyzed in panel E and Figure 5—figure supplement 1B). Fluorescence intensities were measured as described for panel B and a minimum intensity threshold of 20 AU was applied for scoring cells as positive for staining. In panel A, the scale bar represents 50 μm. In panel D, the scale bars represent 50 μm and 20 μm in the lower and higher magnification images, respectively. Raw data for panels B, C, E and F are provided in Figure 5—source data 1, Figure 5—source data 2, Figure 5—source data 3 and Figure 5—source data 4, respectively.
-
Figure 5—source data 1
Quantification of BrdU and SYCP3 immunofluorescence plotted in Figure 5B.
- https://doi.org/10.7554/eLife.30919.016
-
Figure 5—source data 2
Quantification of BrdU and SYCP3 immunofluorescence plotted in Figure 5C.
- https://doi.org/10.7554/eLife.30919.017
-
Figure 5—source data 3
Quantification of CCNA2 and SYCP3 immunofluorescence plotted in Figure 5E.
- https://doi.org/10.7554/eLife.30919.018
-
Figure 5—source data 4
Quantification of CCNA2 and SYCP3 immunofluorescence plotted in Figure 5F.
- https://doi.org/10.7554/eLife.30919.019
Figure 5—figure supplement 1
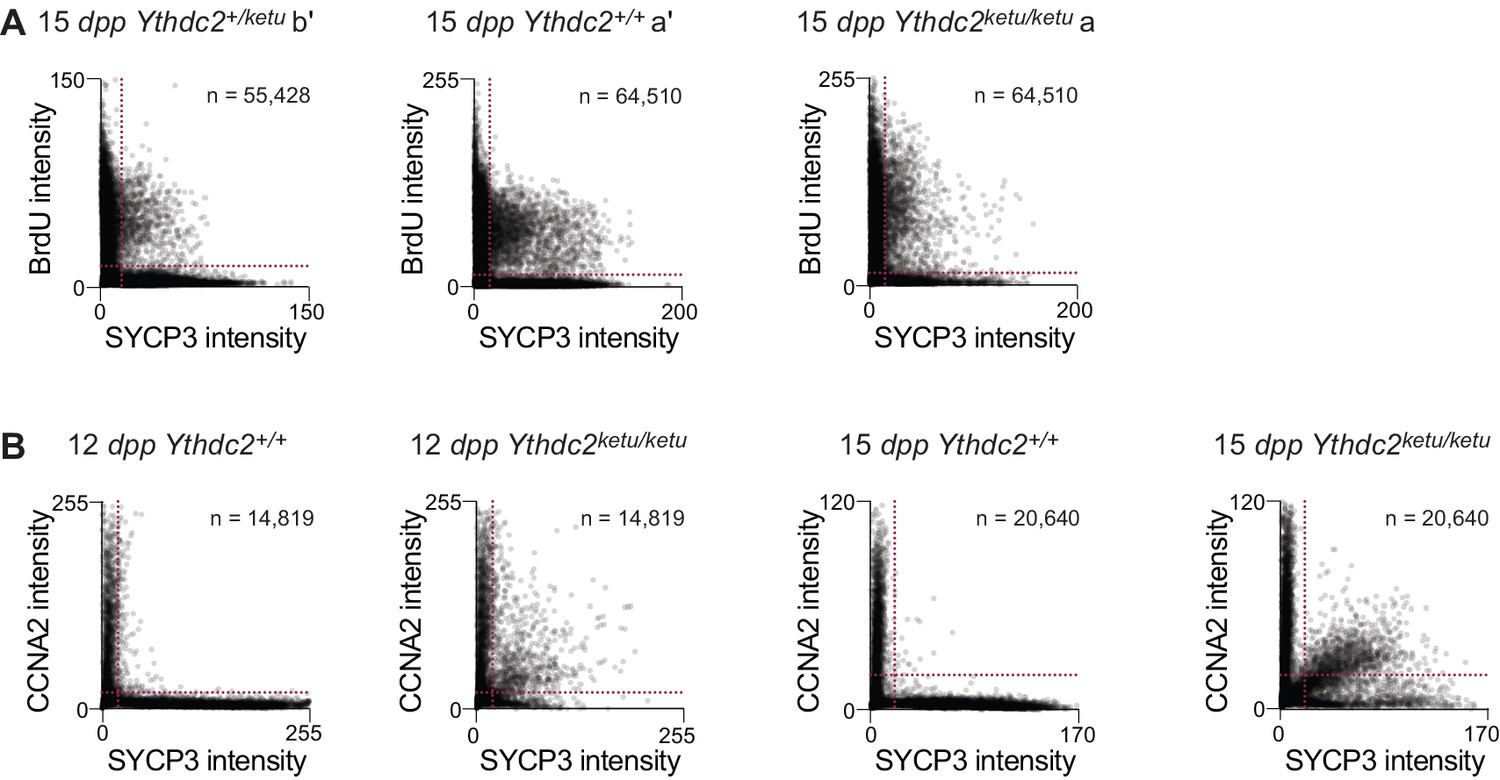
BrdU and CCNA2 immunofluorescence on Ythdc2ketu mutants.
(A) Scatter-plots showing BrdU and SYCP3 immunofluorescence intensity of testis cells from 15-dpp Ythdc2ketu/ketu (a), its wild type littermate (a′), and a heterozygous littermate (b′) of mice analyzed in Figure 5B. (B) Scatter-plots showing CCNA2 and SYCP3 immunofluorescence intensity of testis cells from 12-dpp and 15-dpp Ythdc2ketu/ketu and wild-type littermates. Fluorescence intensities were measured as described in Figure 5B and the number of cells scored from each animal is indicated (n). Raw data are included in Figure 5—source data 1 and Figure 5—source data 3.
Figure 6 with 1 supplement

RNA-seq analysis of Ythdc2em1 mutants during the germline transition into meiosis.
(A) Number of differentially regulated genes (Benjamini-Hochberg-adjusted p-value<0.05 from DESeq2) in pairwise comparisons of mutants with controls at 8, 9, and 10 dpp (see Materials and methods for a breakdown of mice used). (B) Heatmap showing the expression z-scores of differentially regulated genes in individual Ythdc2em1 mutants (a, b, c) and their wild-type or heterozygous littermates (a′, b′, c′). Genes that were differentially regulated (adjusted p-value<0.05) in mutant vs. control pairwise comparisons of mice of a specific age (8 dpp; 9 dpp; 10 dpp) or groups of ages (8 and 9 dpp combined; 9 and 10 dpp combined; 8, 9 and 10 dpp combined) are shown. Differentially regulated genes were divided into four clusters (see Materials and methods). (C) Expression levels of differentially regulated genes belonging to Cluster I or Clusters II and III in purified testicular cell types (Soumillon et al., 2013). Medians and interquartile ranges are shown. Quadruple-asterisk represents p<0.0001 and double-asterisk represents p<0.01 in paired t-tests. (D) Benjamini-Hochberg-adjusted p-values from DAVID (Huang et al., 2009a; b) of enriched GO terms (adjusted p-value<0.05) for differentially regulated genes belonging to Clusters II and III. (E) Expression fold changes of developmentally regulated genes at 8 dpp. Developmentally regulated genes were defined as those with increased (Dev. up) or decreased (Dev. down) expression (adjusted p-value<0.1) in a pairwise comparison between 8 dpp-old and 10 dpp-old wild-type or heterozygous animals. Developmentally regulated genes that contain m6A peaks are shown with genes grouped irrespective of their developmental fate (m6A-containing, All dev.) or as those with increased (m6A-containing, Dev. up) or decreased (m6A-containing, Dev. down) expression from 8 dpp to 10 dpp. All m6A-containing genes (All m6A) and the entire transcriptome (All) are also shown for comparison. Quadruple-asterisk represents p<0.0001 and ns (not significant) represents p>0.05 in Wilcoxon rank sum test. The number of genes in each category is indicated (n). (F) Mean transcript levels of indicated genes at 8, 9 and 10 dpp. Error bars indicate standard deviations. Expression fold changes of differentially regulated genes shown in panel B are in Supplementary file 1. Raw data for panels C, D and E are provided in Figure 6—source data 1, Figure 6—source data 2 and Figure 6—source data 3, respectively.
-
Figure 6—source data 1
FPKM values of differentially expressed genes in purified testicular cells plotted in Figure 6C.
- https://doi.org/10.7554/eLife.30919.022
-
Figure 6—source data 2
p-values of significantly enriched GO terms in Clusters II and III plotted in Figure 6D.
- https://doi.org/10.7554/eLife.30919.023
-
Figure 6—source data 3
Expression fold changes of developmentally regulated genes plotted in Figure 6E.
- https://doi.org/10.7554/eLife.30919.024
Figure 6—figure supplement 1

RNA-seq analysis of Ythdc2em1 mutants.
(A) TUNEL assay on testis sections of Ythdc2em1 mutants (a, b, c) and their wild-type or heterozygous littermates (a′, b′, c′) analyzed by RNA-seq. (B) MA-plot showing expression levels and fold changes of individual genes in mutant and wild-type or heterozygous pairwise comparisons of mice at 8, 9 and 10 dpp. Differentially expressed genes (adjusted p-value<0.05) are depicted as large, blue circles; these are the genes tallied in Figure 6A.
Figure 7 with 1 supplement
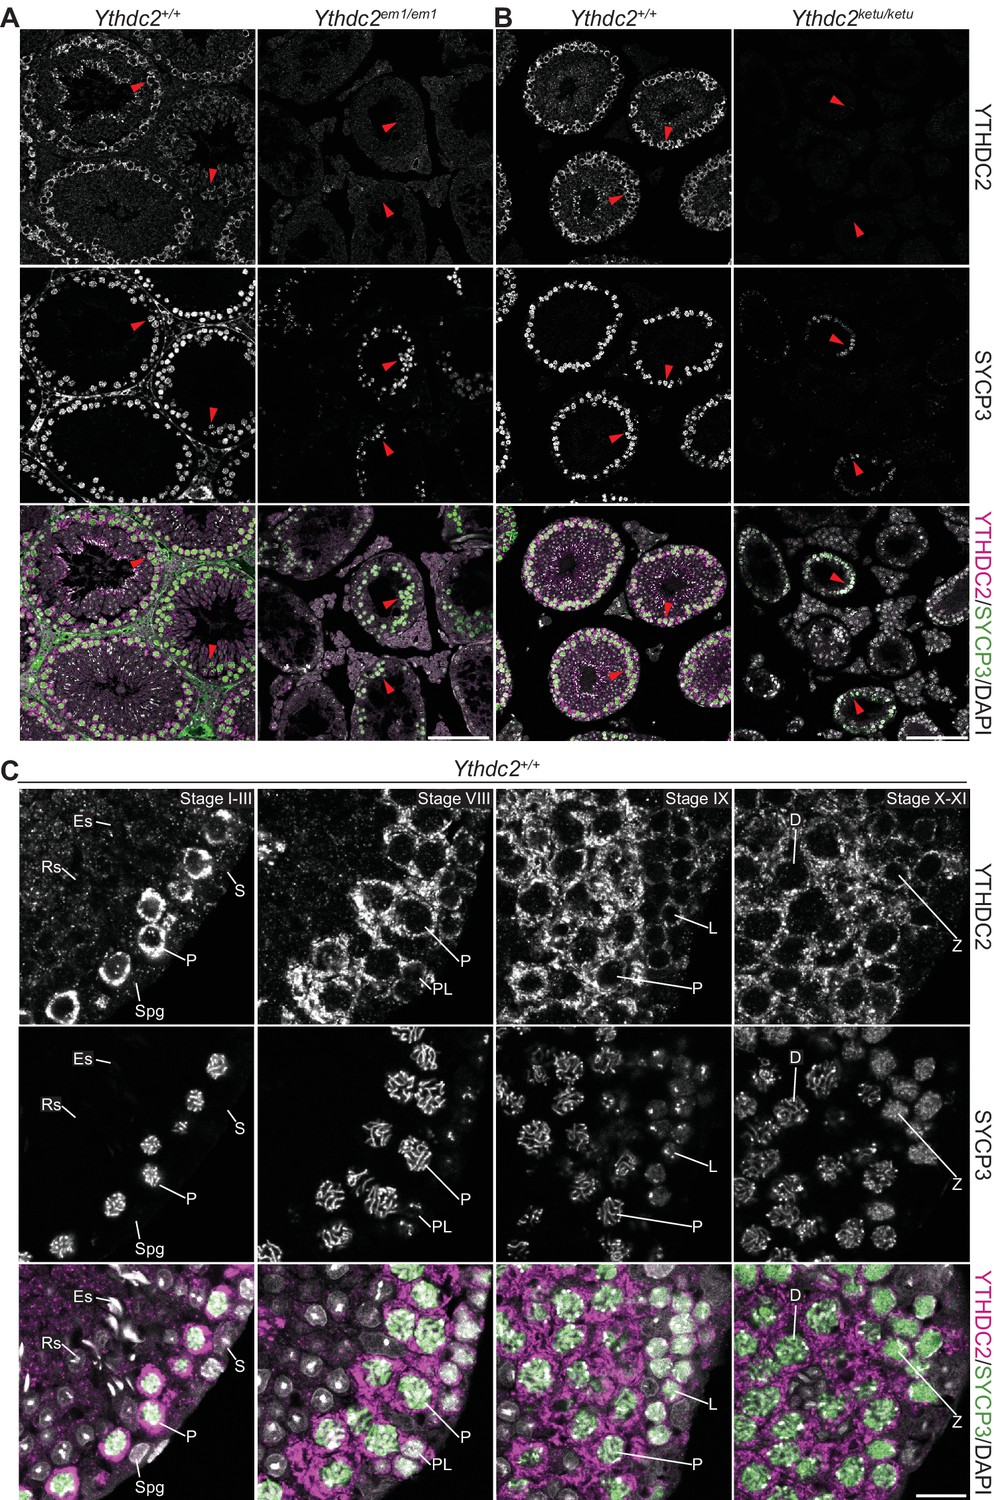
YTHDC2 localization in wild-type and mutant testes.
(A and B) YTHDC2 and SYCP3 immunofluorescence on testis sections from 2-month-old Ythdc2em1/em1, Ythdc2ketu/ketu, and their wild-type littermates. Arrowheads indicate SYCP3-positive spermatocytes. Scale bars represent 100 μm. (C) YTHDC2 and SYCP3 immunofluorescence on testis sections from an adult B6 male. Approximate seminiferous epithelial cycle stages (based on SYCP3 and DAPI staining patterns) are provided. S, Sertoli cell; Spg, spermatogonia; L, leptotene spermatocyte; Z, zygotene spermatocyte; P, pachytene spermatocyte; D, diplotene spermatocyte; RS, round spermatid; ES, elongating spermatid. Scale bar represents 15 μm.
Figure 7—figure supplement 1
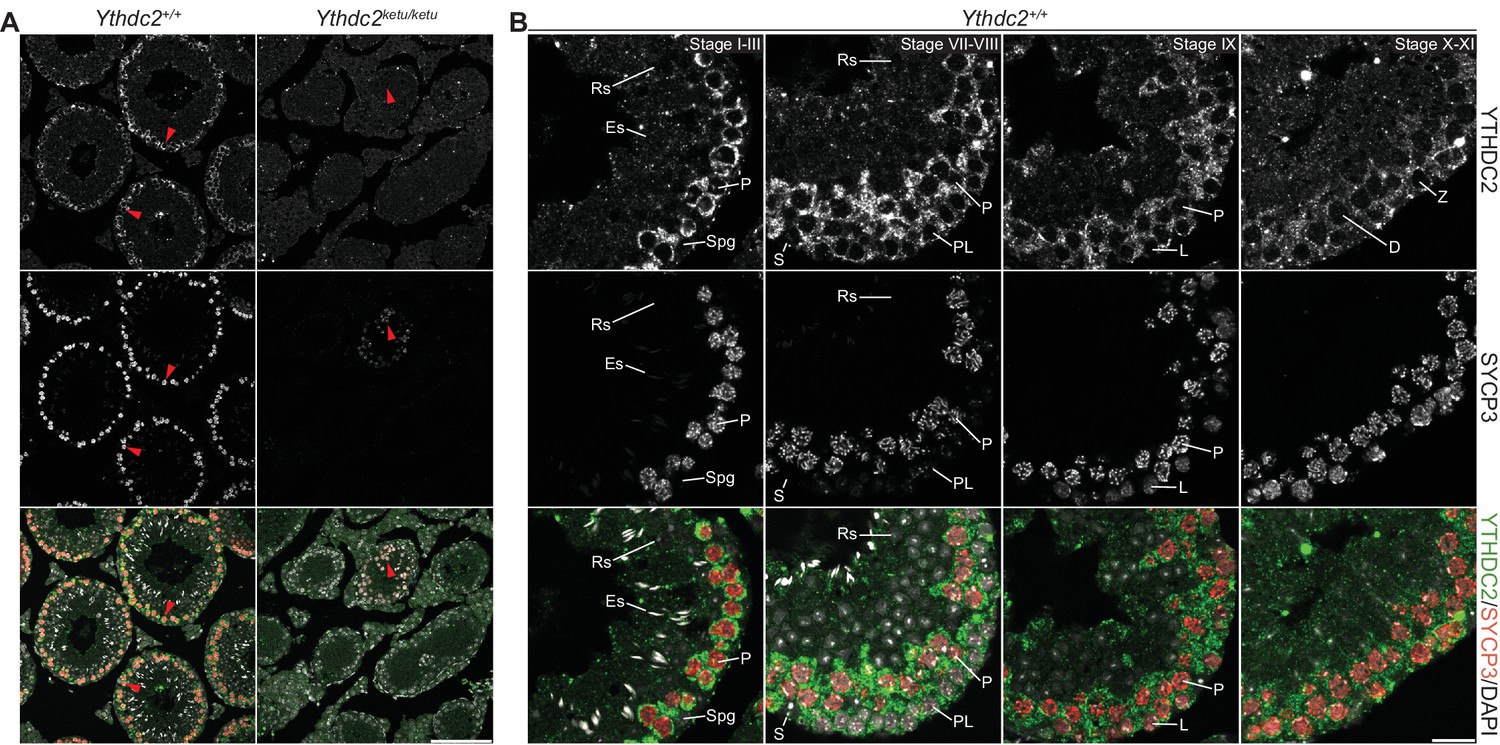
YTHDC2 staining with an independent anti-YTHDC2 antibody in wild-type and mutant testes.
YTHDC2 and SYCP3 immunofluorescence on testis sections from 2-month-old Ythdc2ketu/ketu and wild-type littermates. Figure labels are as in Figure 7. Scale bars represent 100 μm for panel A and 20 μm for panel B. In this figure, the anti-YTHDC2 antibody from Santa Cruz Biotechnology was used (Abby et al., 2016). In Figure 7, the anti-YTHDC2 antibody from Bethyl Laboratories was used (Soh et al., 2017).
Figure 8 with 1 supplement
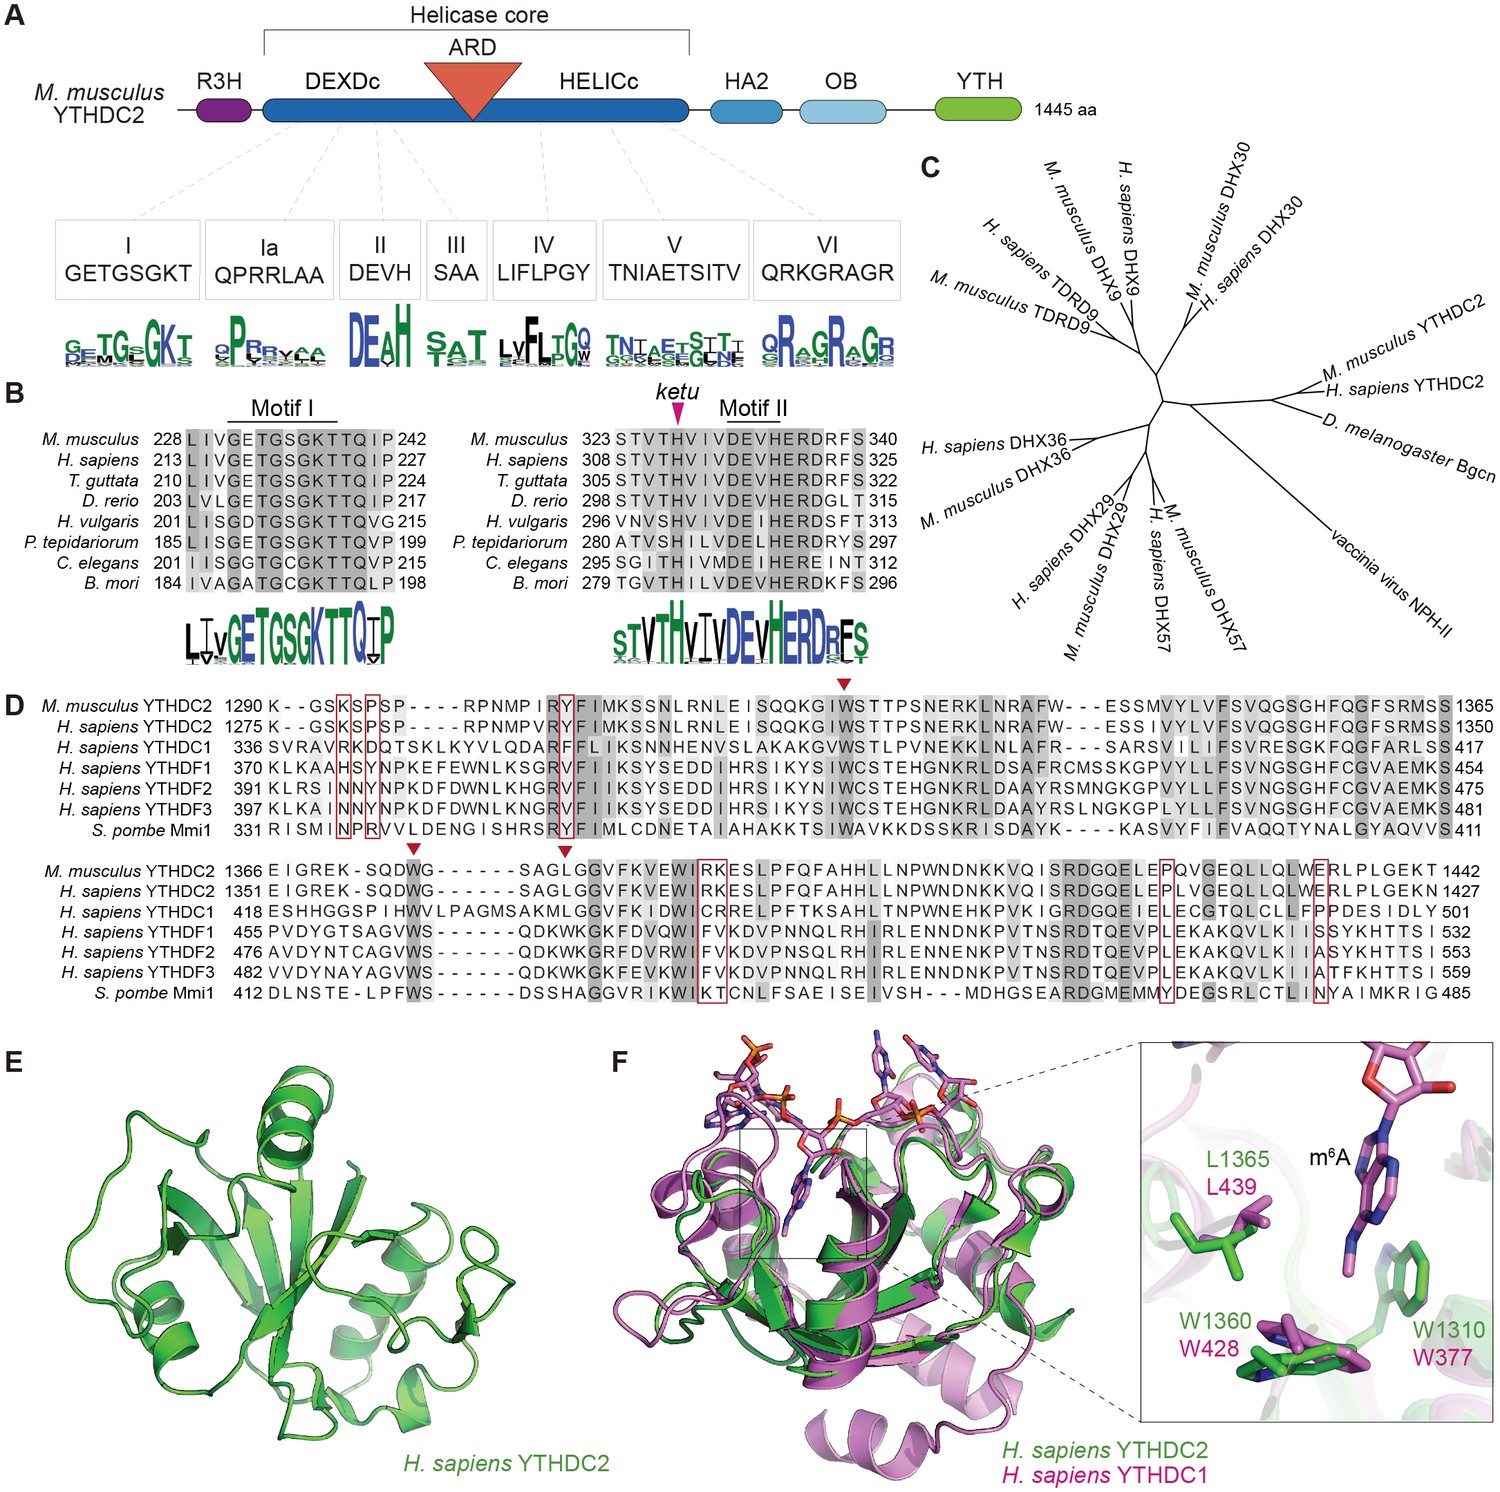
YTHDC2 domain architecture and structure of its YTH domain.
(A) Schematic of mouse YTHDC2 domain structure (not to scale). Sequence motifs characteristic of superfamily 2 DExH-box helicases (I, Ia, II, III, IV, V, VI) within the helicase core domain are indicated, along with sequence logos from Clustal Omega alignments of 157 superfamily 2 DExH-box helicases. The height of each stack of residues reflects the degree of conservation, and the height of each amino acid symbol within each stack is proportional to the frequency of a residue at that position. Amino acids are colored according to their physico-chemical properties (hydrophilic (blue), neutral (green), and hydrophobic (black)). (B) Clustal Omega alignments of sequences around helicase motifs I and II from YTHDC2 proteins of the indicated species. The position of the ketu mutation is indicated. The residues are shaded based on percent agreement with the consensus. Sequence logos were generated from Clustal Omega alignments of YTHDC2 homologs from 201 species and are colored as in panel A. (C) Cladogram of Clustal Omega protein sequence alignments of mouse and human YTHDC2 paralogs. The tree was rooted using vaccinia virus NPH-II sequence and D. melanogaster Bgcn is included for comparison. DHX29 is an RNA helicase that promotes translation initiation of mRNAs with structured 5’ untranslated regions (Pisareva et al., 2008). DHX57 is an uncharacterized protein of unknown function. DHX36 has G-quadruplex unwinding activity for DNA and RNA and is involved in antiviral responses to dsRNA (Vaughn et al., 2005; Yoo et al., 2014). DHX9 (also known as RNA helicase A and DNA helicase II) has both DNA and RNA helicase activities and multiple cellular functions, including in genome stability and in viral and cellular RNA metabolism (Friedemann et al., 2005; Lin et al., 2012). DHX30 is a poorly characterized protein required for cell viability during mouse embryonic development (Zheng et al., 2015). And TDRD9 forms a complex with MIWI2 involved in piRNA-directed transposon silencing in the male germline (Shoji et al., 2009; Wenda et al., 2017). (D) Clustal Omega alignment of YTH domain sequences. Inverted triangles in auburn indicate residues that make up the hydrophobic pocket that binds m6A. Residues boxed in auburn are required for Mmi1 interaction with RNA (Wang et al., 2016). (E) NMR structure of the YTH domain from human YTHDC2, generated by the RIKEN Structural Genomics/Proteomics Initiative (Endo et al., 2007) (PDB ID: 2YU6). (F) Structure of the m6A binding pocket is conserved in YTHDC2. The solution structure of YTH domain from human YTHDC2 (green) is shown superimposed on the crystal structure of the RNA-bound YTH domain from human YTHDC1 (pink; PDB ID: 4R3I) (Xu et al., 2014). The m6A nucleotide and the hydrophobic amino acid residues lining the binding pocket are shown at a higher magnification on the right. Protein accession numbers for sequence logos in panel A are in Supplementary file 2; all other protein accession numbers are in Supplementary file 3.
Figure 8—figure supplement 1
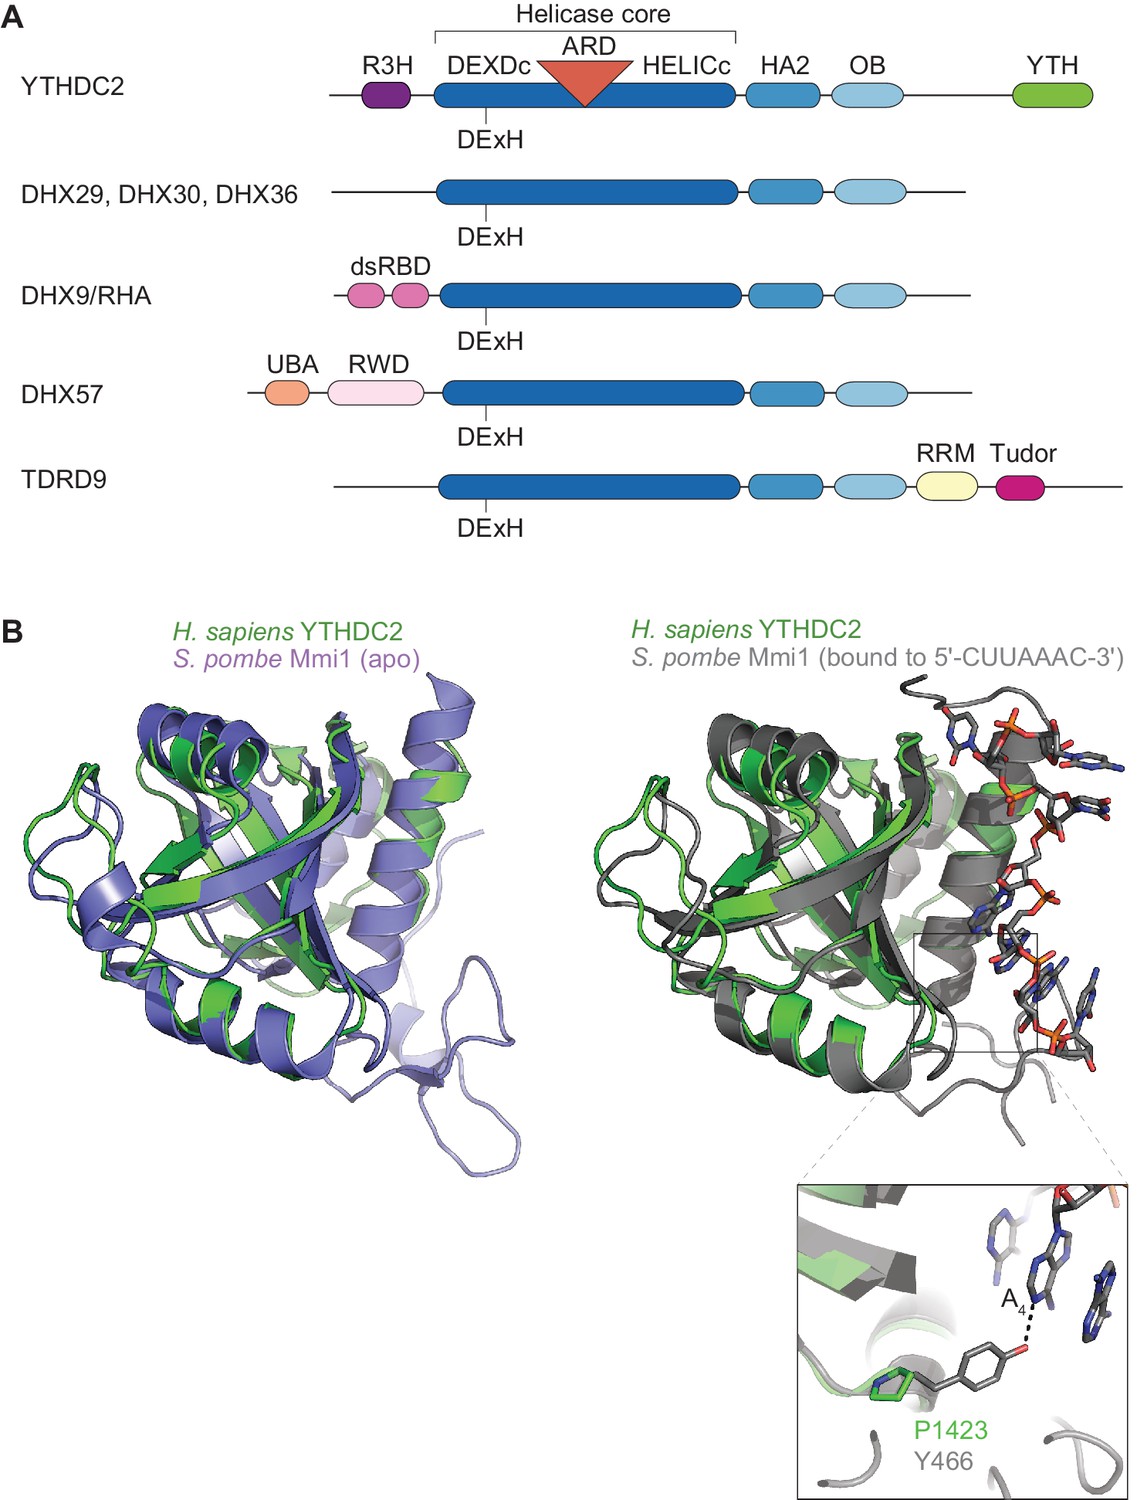
Domain architecture of YTHDC2 and related DEAH-box proteins.
(A) Schematics of domains in YTHDC2 and related DEAH-box proteins (not to scale). Domain annotations were obtained from SMART (Letunic et al., 2015) and pfam database (Finn et al., 2016) searches, except TDRD9, for which domains are as previously defined (Handler et al., 2011). DHX9/RHA contains two copies of a double-stranded RNA binding domain (dsRBD) (Fu and Yuan, 2013). DHX57 has a ubiquitin-associated (UBA) domain and an RWD domain whose functions have yet to be demonstrated. TDRD9 has an RNA recognition motif (RRM) typically involved in interacting with nucleic acids, and a Tudor domain that binds dimethylated arginine (Handler et al., 2011). (B) Superposition of YTH domain structures of human YTHDC2 and S. pombe Mmi1 in either the apo state (left; PDB ID: 5H8A) or RNA-bound state (right; PDB ID: 5DNO). A closer view of the interaction of S. pombe Mmi1 Tyr-466 with the DSR nucleobase A4 is also shown.
Figure 9 with 1 supplement
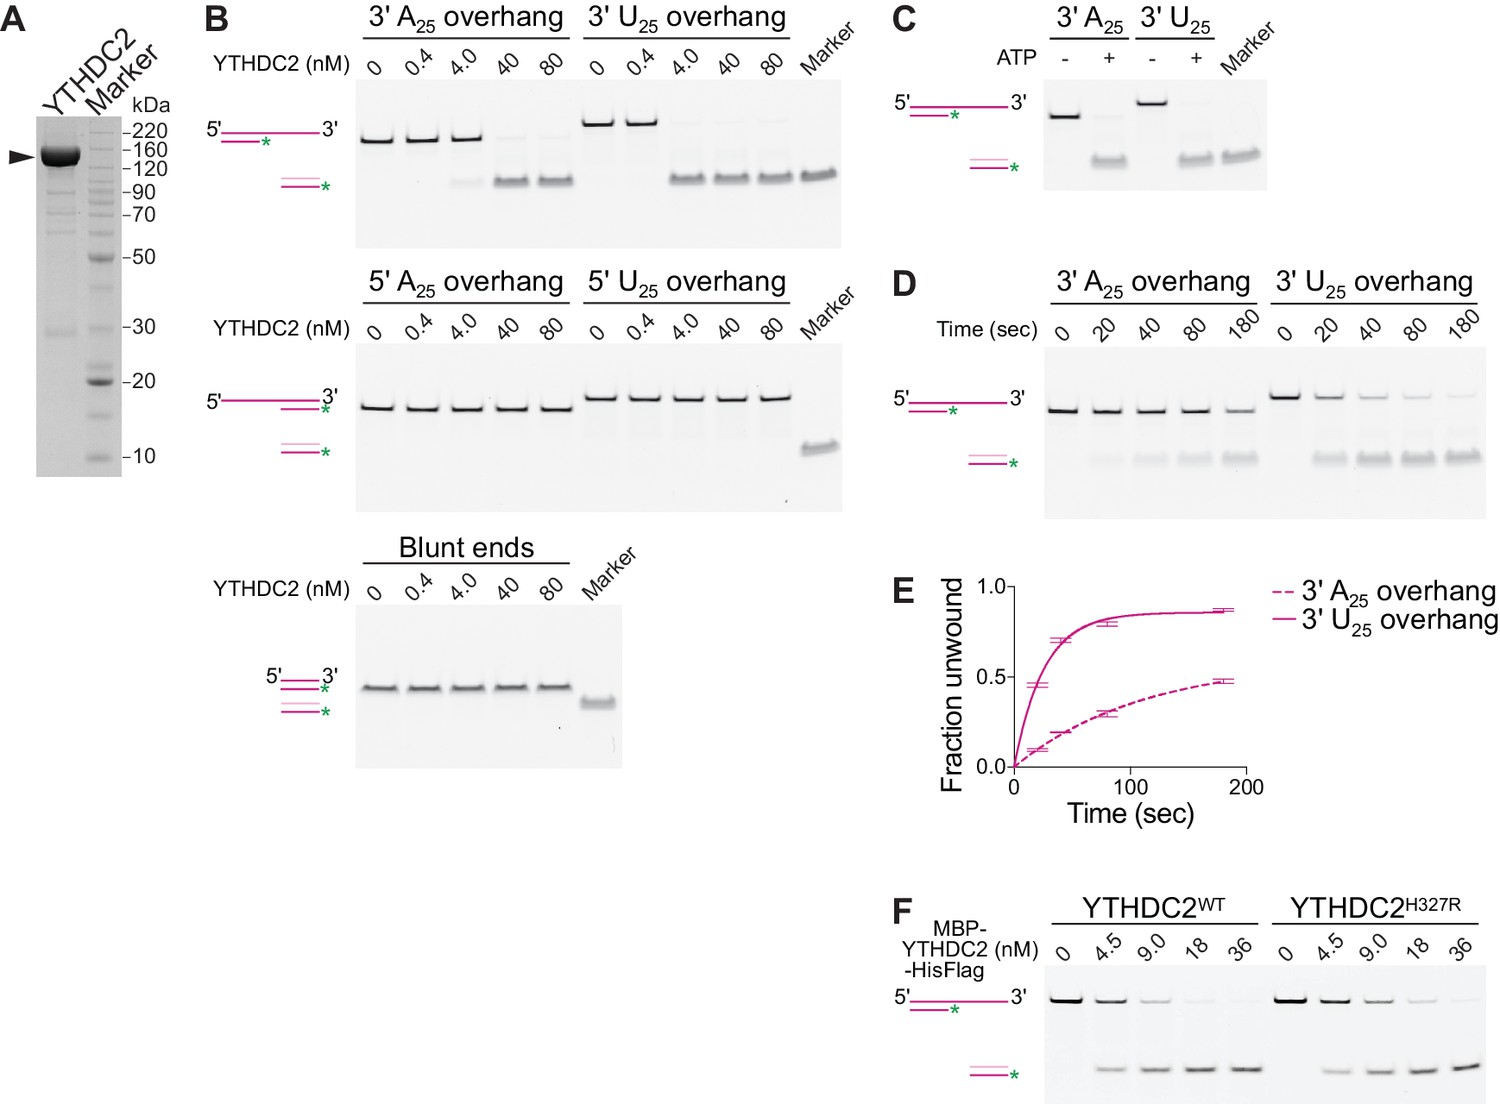
Mouse YTHDC2 is an ATP-dependent 3′→5′ RNA helicase.
(A) SDS-PAGE analysis of recombinant mouse YTHDC2 (arrowhead) expressed in insect cells. (B) Strand displacement assay on 3′-tailed, 5′-tailed or blunt RNA duplexes. (C) Dependence of YTHDC2 helicase activity on ATP. In panels B and C, end point unwinding reactions were carried out at 22°C for 30 min. Marker lanes depict the expected band for the unwound 6-FAM-labeled RNA strand annealed to the DNA trap. (D and E) Representative native PAGE (panel D) and quantification (panel E) of time courses of unwinding reactions on 3′ A25 and 3′ U25 tailed RNA duplexes at 22°C using identical protein concentration (40 nM). In panel E, error bars indicate standard deviation from three technical replicates. Curves were fitted to the integrated pseudo-first order rate law to calculate observed rate constants (kobs): 0.009 sec−1 for the 3′ poly(A) substrate and 0.04 sec−1 for the 3′ poly(U) substrate. (F) Comparison of helicase activities of wild-type YTHDC2 and YTHDC2H327R on 3′ U25 tailed RNA duplex. The recombinant proteins used contain an N-terminal MBP tag to improve the solubility of YTHDC2H327R and a C-terminal hexahistidine tag to allow purification. End point unwinding reactions were carried out at 30°C for 30 min. For helicase assays, a schematic of the substrate (dark pink) before and after the reaction is depicted with the DNA trap shown in light pink and the 6-FAM label shown as a green asterisk.
Figure 9—figure supplement 1

Protein expression and helicase activity of recombinant YTHDC2H327R.
(A) Recombinant mouse YTHDC2 H327R with a C-terminal decahistidine tag was expressed in Hi5 cells. The total cell lysate was centrifuged at 400,000 ×g to separate the insoluble (pellet) and soluble (supernatant) protein fractions. (B) Graph showing a comparison of the extent of unwinding of 3′ poly(U) tailed RNA duplex by wild-type YTHDC2 and YTHDC2H327R (assay in Figure 9F). Mean values are plotted and error bars indicate standard deviation from three technical replicates.
Figure 10 with 3 supplements
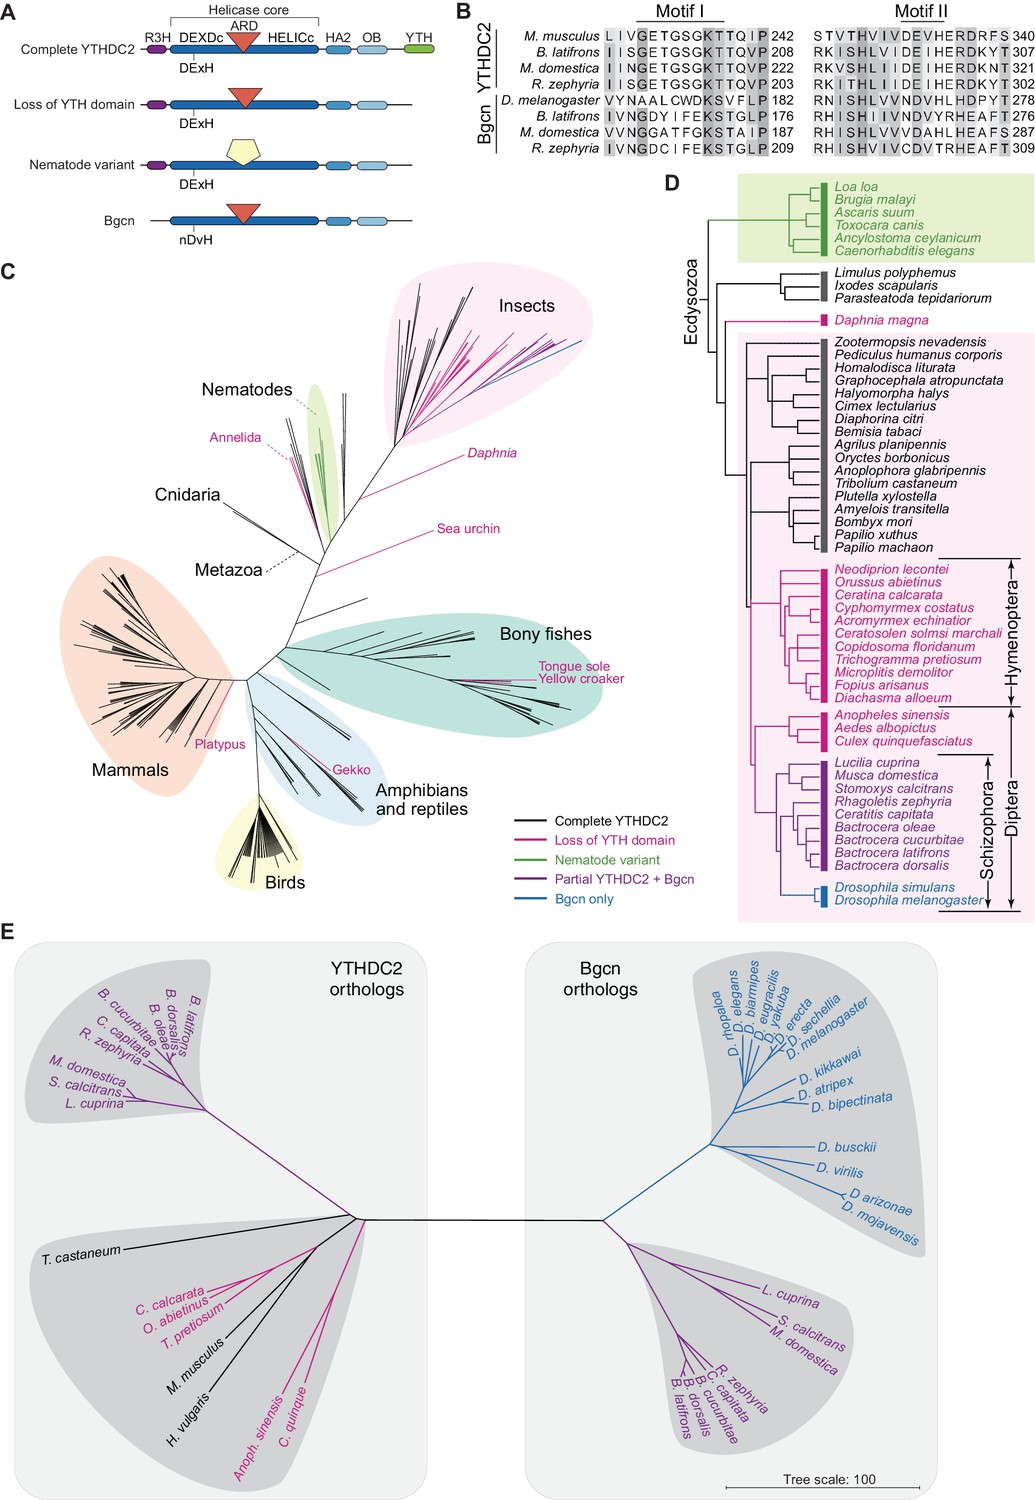
Distribution of YTHDC2 variants in Metazoa.
(A) Schematic of domain architectures (not to scale) of metazoan YTHDC2 orthologs and paralogs. (B) Clustal Omega alignment of sequences around helicase motifs I and II for YTHDC2-like and Bgcn-like proteins from schizophoran flies. Mouse YTHDC2 is shown for comparison. Bgcn proteins have amino acid changes that are incompatible with ATPase activity (Ohlstein et al., 2000). (C) Phylogenetic distribution of YTHDC2 in Metazoa. The tree is an unrooted cladogram of NCBI taxonomy for a non-exhaustive collection of 234 species in which at least one close YTHDC2 homolog was identified. Tree leaves are color coded according to YTHDC2 domain architecture. The same tree topology is reproduced in Figure 10—figure supplement 1 with complete species names. (D) Distribution of YTHDC2 variants in Ecdysozoa. The rooted cladogram shows NCBI taxonomy for the ecdysozoan portion of the metazoan tree in panel C. Background shading and color-coding of tree leaves is the same as in panel C. (E) Phylogram for sequence alignments of complete YTHDC2 and Bgcn orthologs from the indicated species. Note that protein sequence distances are similar within the YTHDC2 and Bgcn subfamily trees, but species in the YTHDC2 tree span much greater evolutionary distances. Sequences were aligned with Clustal Omega and the unrooted neighbor-joining tree was constructed from distances calculated using the scoredist function (Sonnhammer and Hollich, 2005). Tree leaves are color coded by YTHDC2 protein domain architecture as in panel C. Protein accession numbers are in Supplementary file 3.
Figure 10—figure supplement 1
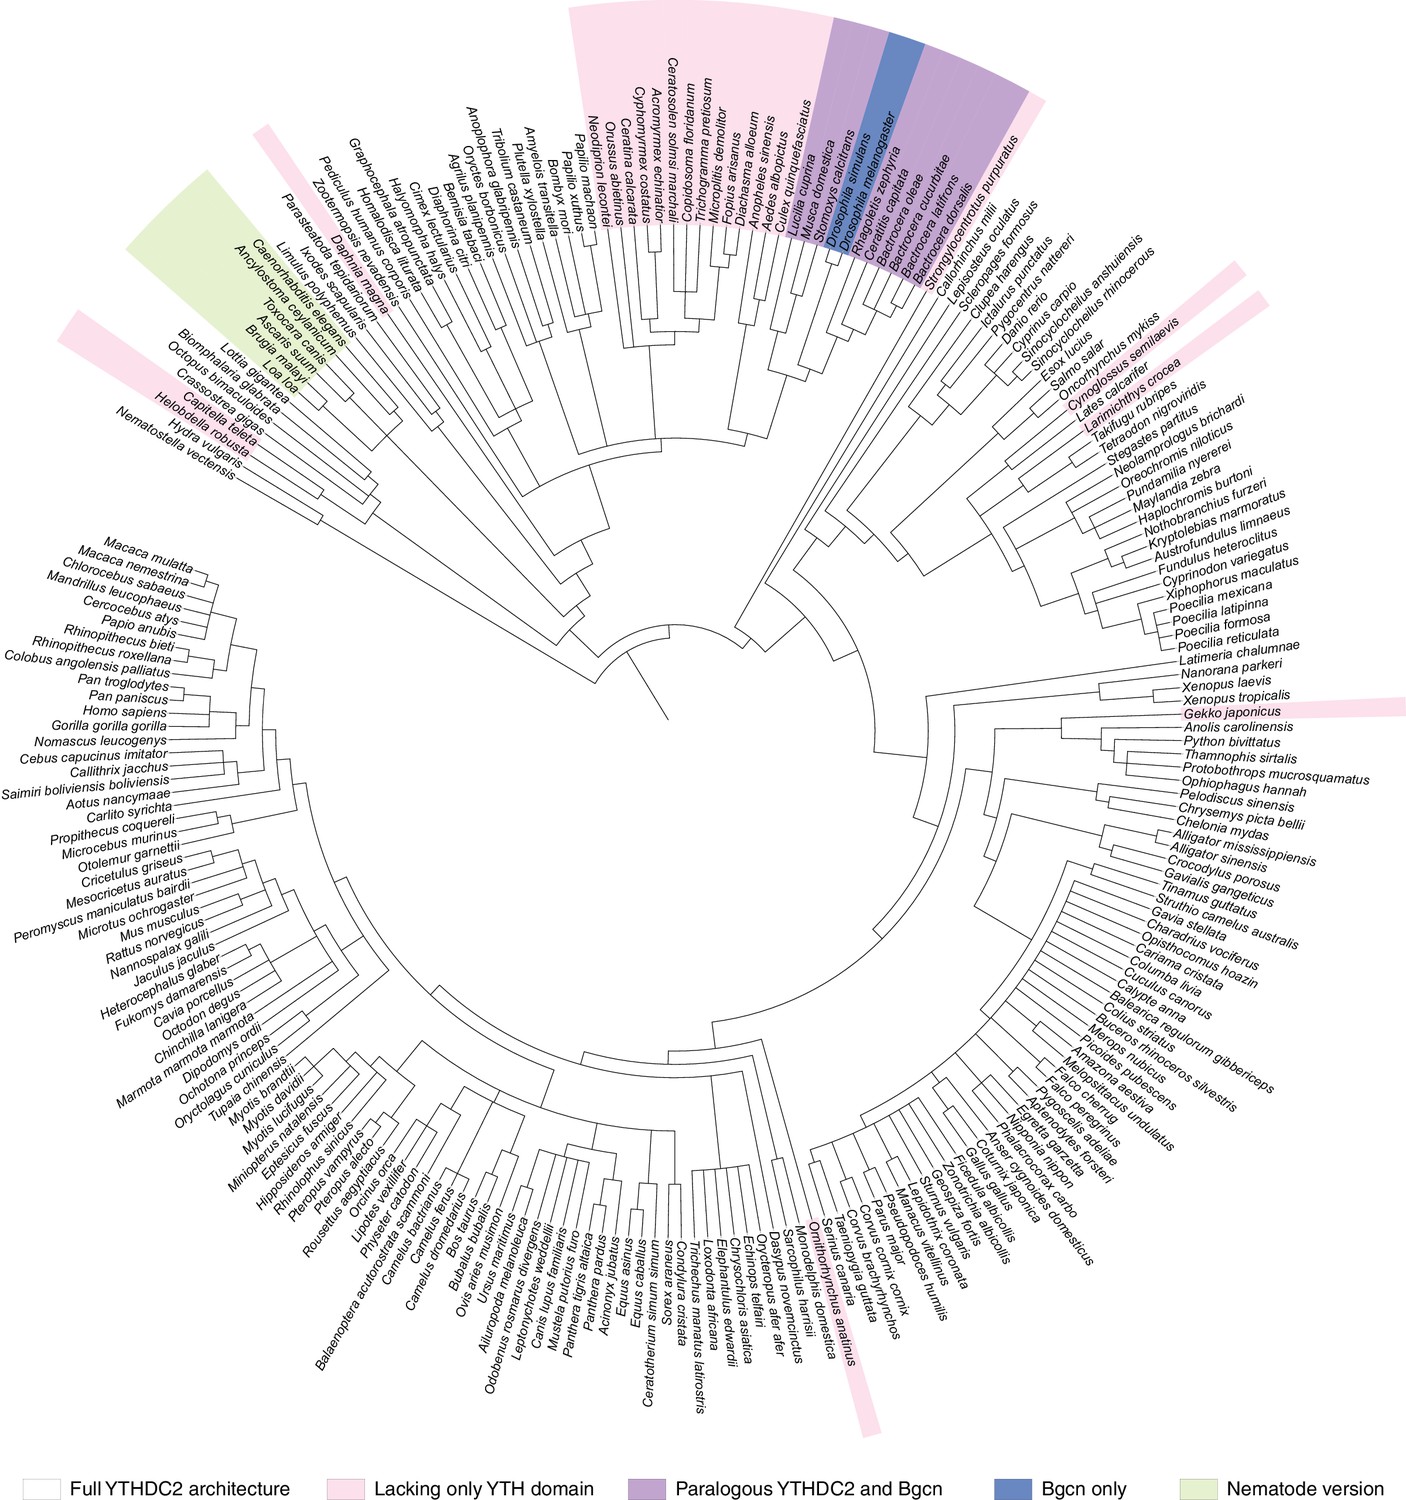
Phylogenetic distribution of YTHDC2 in Metazoa.
The same tree topology is reproduced in Figure 10C.
Figure 10—figure supplement 2
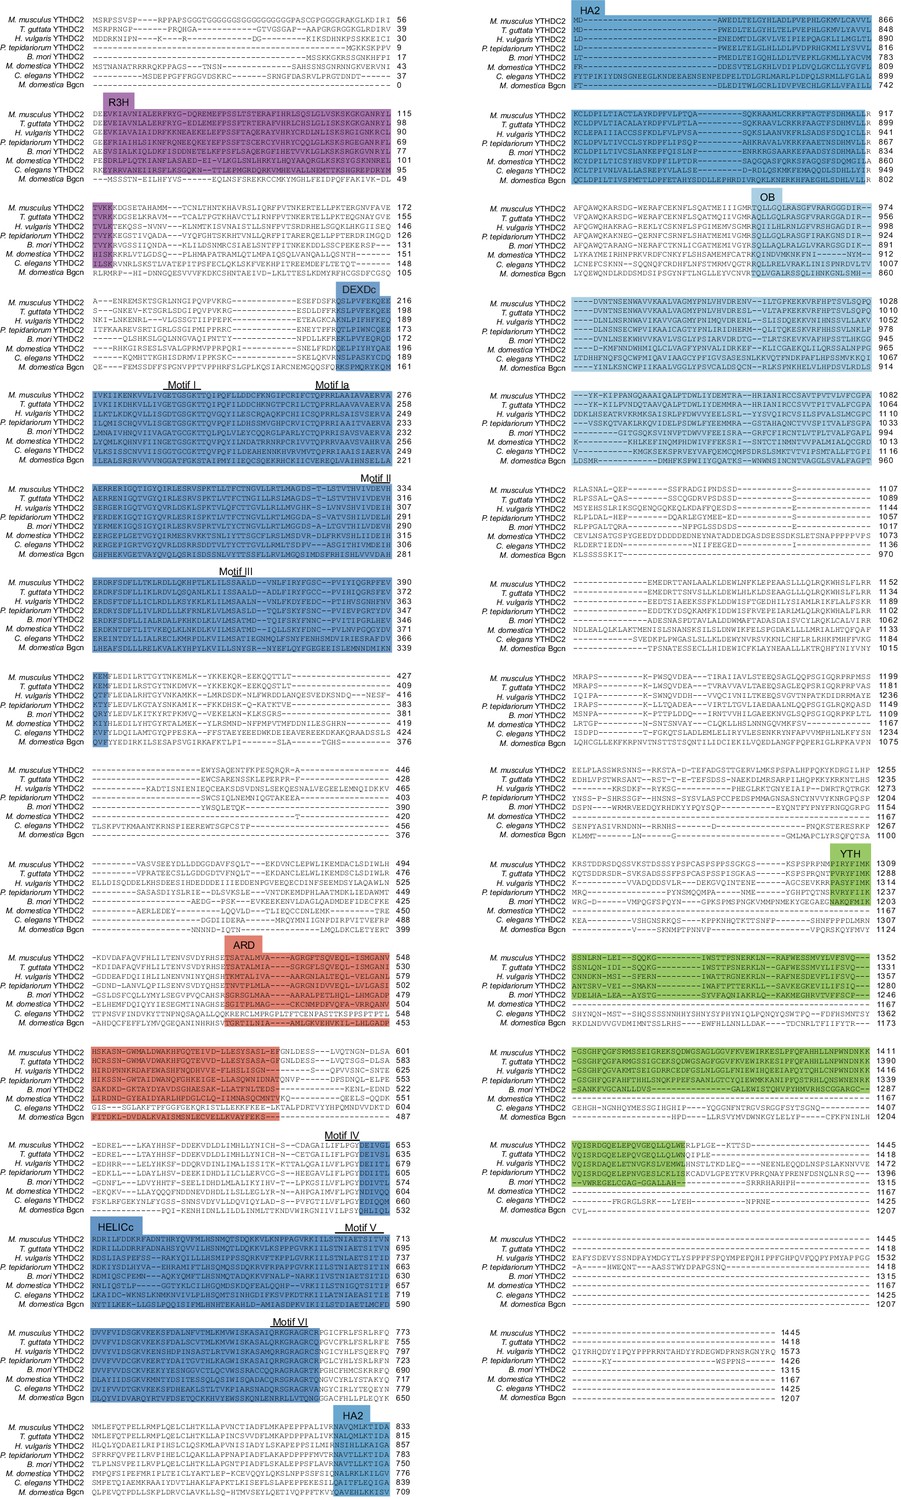
Full length alignment of YTHDC2 orthologs and paralogs.
Clustal Omega was used to align YTHDC2 or Bgcn sequences from the indicated species. Domains and helicase core motifs are indicated, defined according to the annotation for the mouse protein (see Figure 8A). Accession numbers are in Supplementary file 3.
Figure 10—figure supplement 3
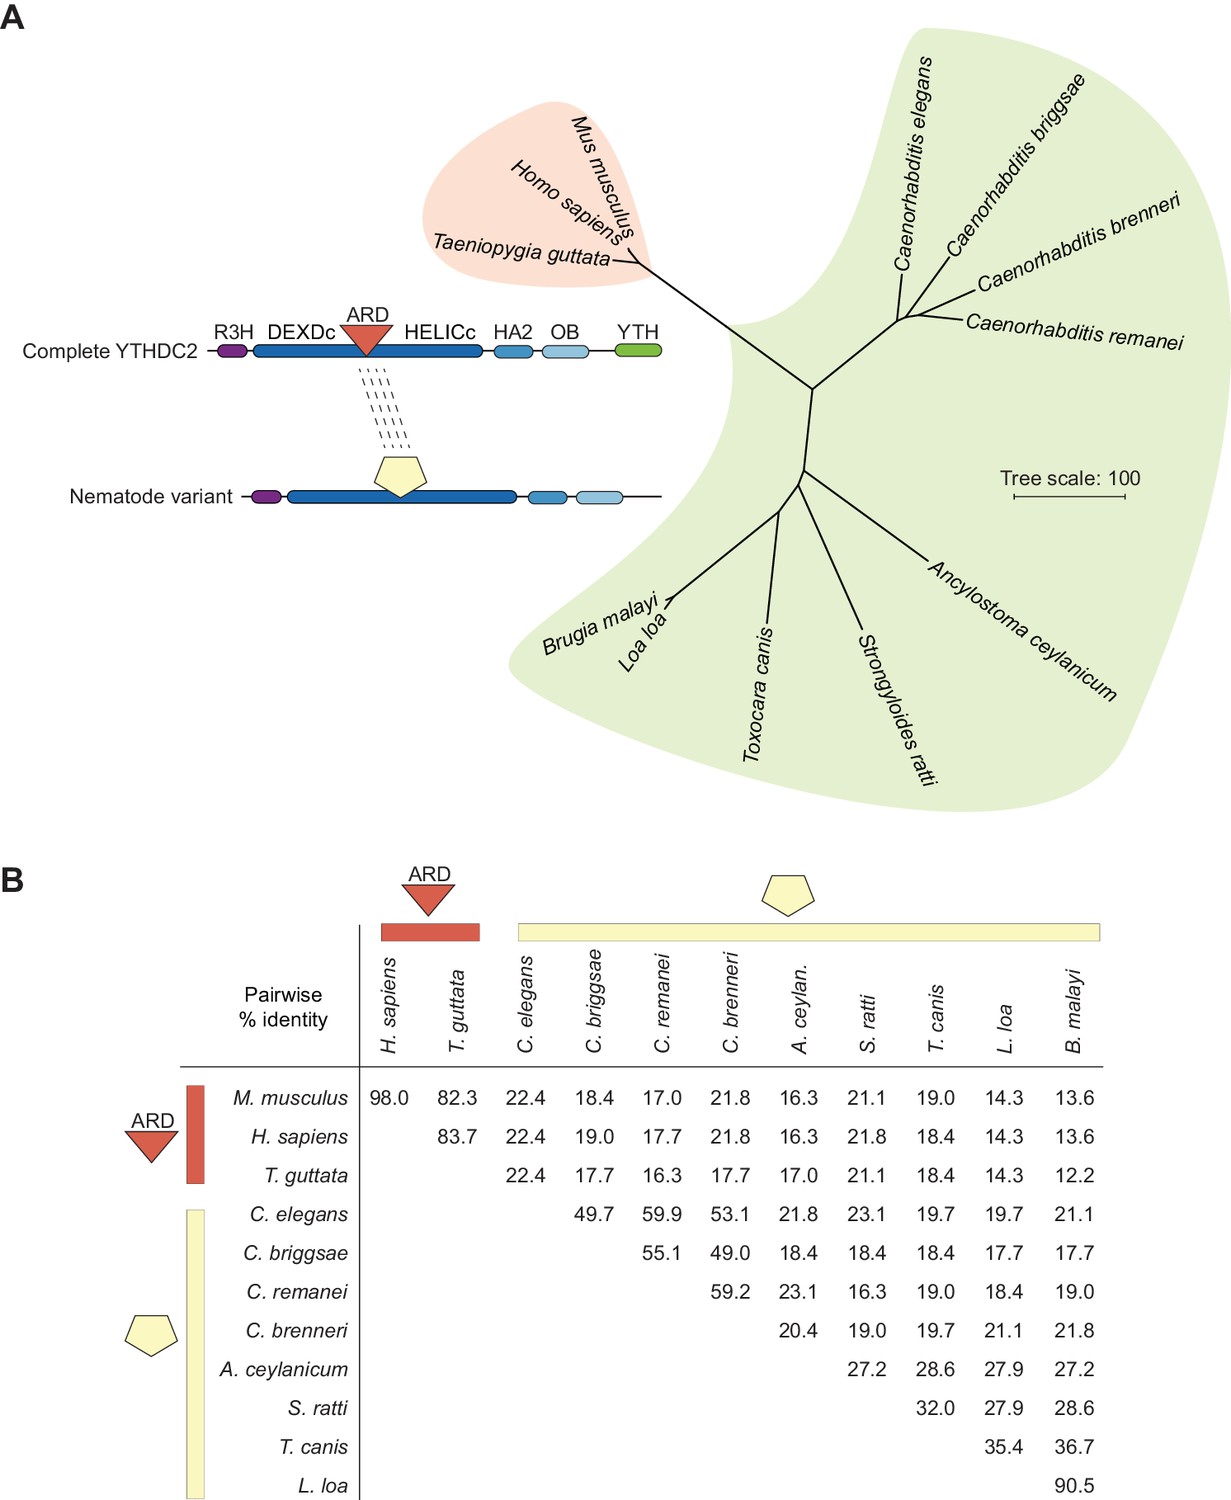
The YTHDC2 ortholog in nematodes has a distinct and highly diverse sequence in the location equivalent to the ARD insertion in other species.
Phylogram (A) and pairwise sequence identity matrix (B) for multiple sequence alignments of the regions between the DEXDc and HELICc domains of the YTHDC2 orthologs from the indicated nematode species (green shaded portion of tree), with mammalian and avian examples for comparison (coral shading). Because of the substantial divergence between these protein segments, sequences were aligned using MUSCLE and the VTML200 substitution matrix. The neighbor-joining tree was constructed with the vertebrate orthologs as the outgroup. Distances were calculated using the scoredist function. Accession numbers are in Supplementary file 3.
Figure 11
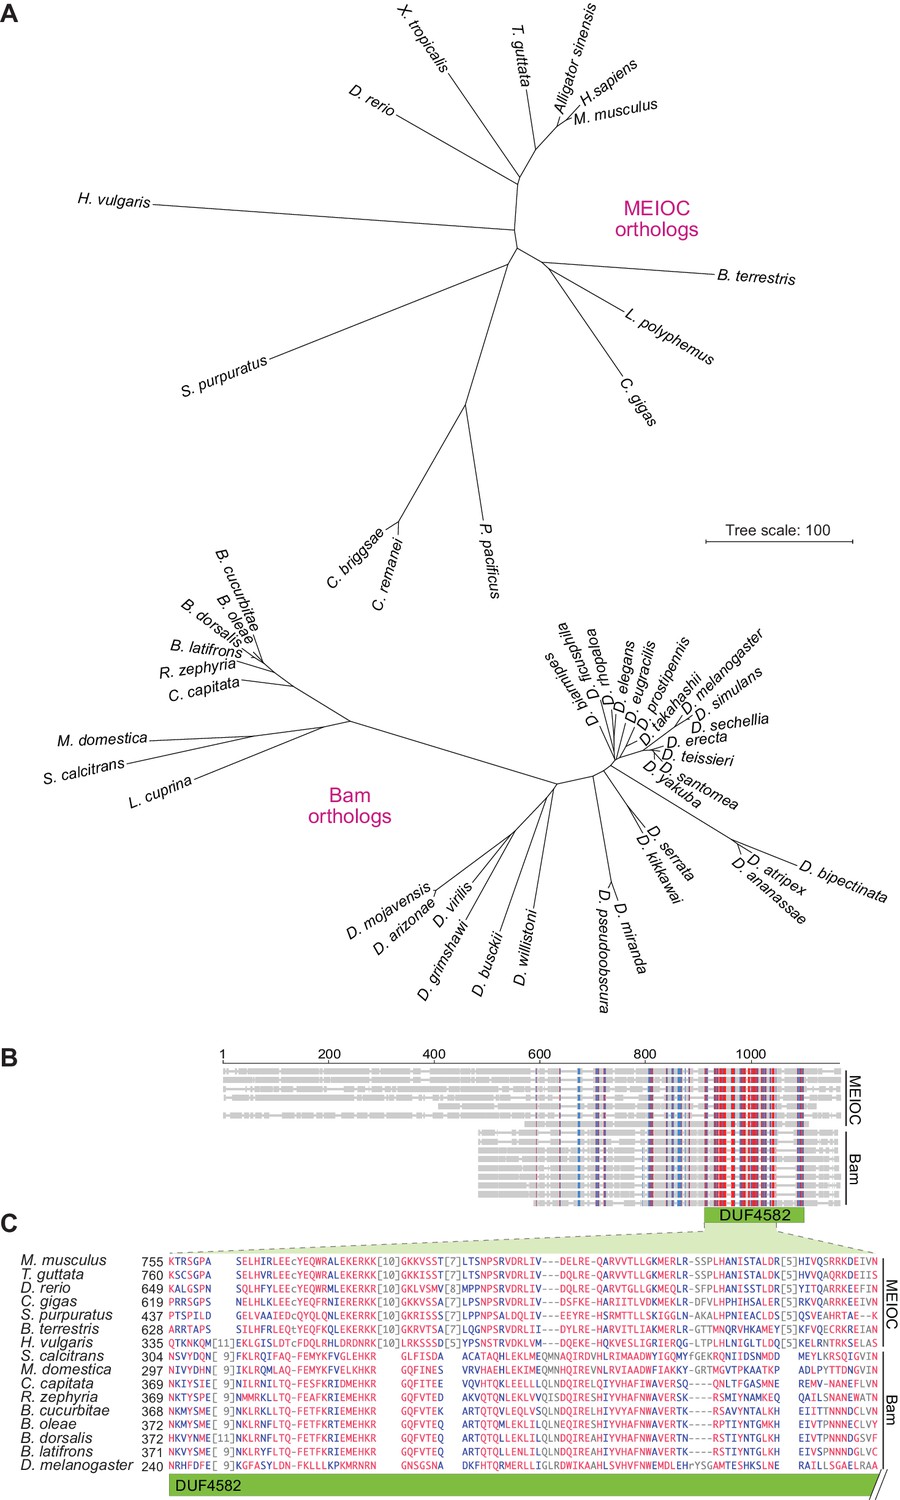
Bam shares distant sequence similarity with MEIOC.
(A) Phylograms based on sequence alignments of MEIOC or Bam orthologs. Sequences were aligned with Clustal Omega and the unrooted neighbor-joining trees were constructed from distances calculated using the scoredist function. Note that the two trees have the same scale, but the MEIOC proteins are from species separated by much greater evolutionary distances. (B and C) Remote sequence similarity between MEIOC and Bam, concentrated across the conserved DUF4582 domain of MEIOC. Sequences were aligned using COBALT (Papadopoulos and Agarwala, 2007). Panel B shows a schematic of the full alignment, with thin gray lines indicating gaps and thick gray lines indicating amino acid sequence. Species are in the same order as panel C, which shows a zoomed-in view of the region of greatest contiguous sequence similarity. Residues aligned across all proteins with no gaps are colored in blue or red according to relative entropy, with red indicating more highly conserved (entropy threshold = 2 bits) (https://www.ncbi.nlm.nih.gov/tools/cobalt/re_cobalt.cgi). Boundaries of DUF4582 are indicated relative to their annotation in the mouse protein. Protein accession numbers are in Supplementary file 3.
Additional files
-
Supplementary file 1
Expression fold changes of differentially expressed genes in Figure 6B.
- https://doi.org/10.7554/eLife.30919.036
-
Supplementary file 2
Protein accession numbers for Figure 8A.
- https://doi.org/10.7554/eLife.30919.037
-
Supplementary file 3
Protein accession numbers for Figures 8B–D, 10 and 11.
- https://doi.org/10.7554/eLife.30919.038
-
Supplementary file 4
Genotyping primers and oligos used to make helicase assay substrates.
- https://doi.org/10.7554/eLife.30919.039
-
Transparent reporting form
- https://doi.org/10.7554/eLife.30919.040
Download links
A two-part list of links to download the article, or parts of the article, in various formats.
Downloads (link to download the article as PDF)
Open citations (links to open the citations from this article in various online reference manager services)
Cite this article (links to download the citations from this article in formats compatible with various reference manager tools)
ketu mutant mice uncover an essential meiotic function for the ancient RNA helicase YTHDC2
eLife 7:e30919.
https://doi.org/10.7554/eLife.30919


