Bacterial fumarase and L-malic acid are evolutionary ancient components of the DNA damage response
- IMRIC, Faculty of Medicine, Hebrew University, Israel
- National University of Singapore, Sinapore
Figures
Figure 1 with 3 supplements

Fumarase is required for an efficient DNA damage response in Bacillus subtilis.
(A) Bacillus subtilis wild type (Bs WT) and Δfum (=ΔcitG) strains were untreated (control) or exposed to ionized radiation (150 Gy) and then serially diluted onto LB plates or minimal S7 medium plates (containing 0.1% glucose). (B) Bacillus subtilis Δfum strain is sensitive to DNA damage. Bacillus subtilis wild type (Bs WT), Δfum and Δfum+fum-bc strains were grown to logarithmic phase and MMS (methyl methanesulfonate) was added to a final concentration of 0.07%(v/v) for 45 min. The cells were then washed and serially diluted onto LB plates. (C) Quantitative analysis of Bacillus subtilis Δfum strain sensitivity to DNA damage. (Ci) MMS: Bacillus subtilis wild type (Bs WT), Δfum and Δfum+fum-bc strains were grown to logarithmic phase and MMS (methyl methanesulfonate) was added to a final concentration of 0.07%(v/v) for 50 min. Colony forming units (CFU) were determined after plating serial dilutions of cell cultures on LB agar plates. (mean ±SEM [n = 3], p=0.01). (Cii) Ionized radiation (IR): Bacillus subtilis wild type (Bs WT) and Δfum strains, grown as above, were untreated (control) or exposed to IR (150 Gy). The CFU was determined as above. (mean ±SEM [n = 3], p=0.04). (D) fum-bc can complement DNA damage sensitivity in yeast. Saccharomyces cerevisiae wild type (Sc WT) and Δfum1 strains harboring the indicated plasmids were serially diluted and grown on glucose (dextrose) or ethanol SD medium plates. (E) fum-bc can complement respiration in yeast. Saccharomyces cerevisiae wild type (Sc WT), FUM1m and FUM1m transformed with a plasmid-encoding Bacillus subtilis fumarase, were grown to logarithmic phase in galactose SD medium, irradiated and serially diluted onto galactose SD plates. The data presented in Figure 1, in each case, represent the results of three similar experiments.
Figure 1—figure supplement 1
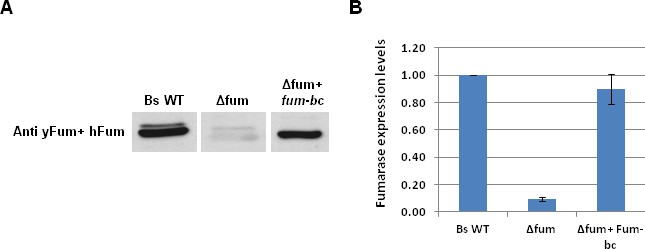
Expression of B. subtilis and yeast fumarases.
(A) B. subtilis wild type (Bs WT), Δfum and Δfum+Fum-bc strains were grown to logarithmic phase. The levels of fumarase in the cells were determined by western blot analysis. The Polyclonal antibodies anti-yeast fumarase and anti-human FH were mixed and use for the detection of Fum-bc. (B) The chart presents the relative amount of fumarase (densitometric analysis of Figure 1—figure supplement 1A) in cells (mean ± SEM [n = 4]).
Figure 1—figure supplement 2
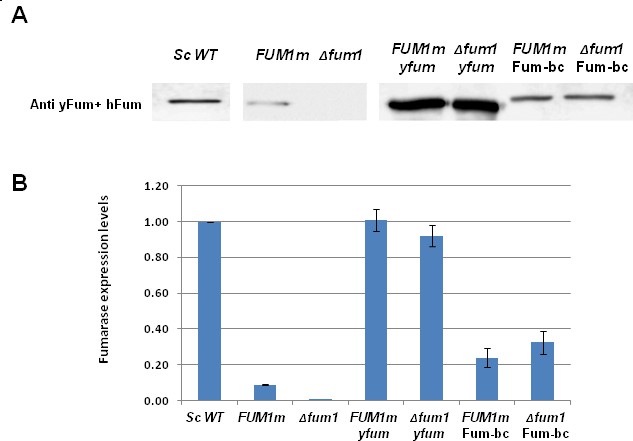
Expression of B. subtilis and yeast fumarases.
(A) S. cerevisiae wild type (Sc WT) and Δfum1 strains harboring the indicated plasmids were grown on dextrose (DEX). After o.n growth the cells were grown on galactose (GAL) SD media to express the indicated pladmids. Total cell extracts were prepared and subjected to Western blotting, using the indicated antibodies. (B) The chart presents the relative amount of fumarase (densitometric analysis of Figure 1—figure supplement 2C) in cells (mean ± SEM [n = 3]).
Figure 1—figure supplement 3
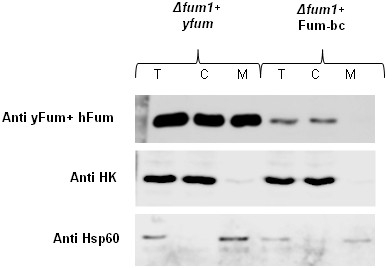
Subcellular fractionation of yeast cells.
Subcellular fractionation of yeast cells expressing Fum-bc. The total (T), cytosol (C), and mitochondria (M) fractions were analyzed by western blotting using the indicated antibodies. Controls: HK (hexokinase), a cytosolic marker, Hsp60, a mitochondrial marker.
Figure 2 with 2 supplements
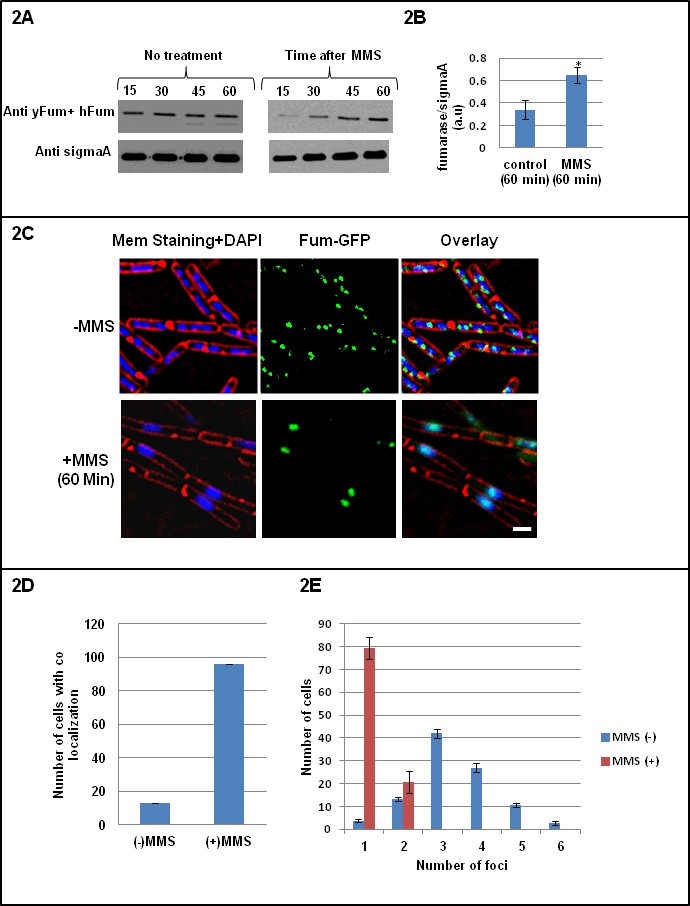
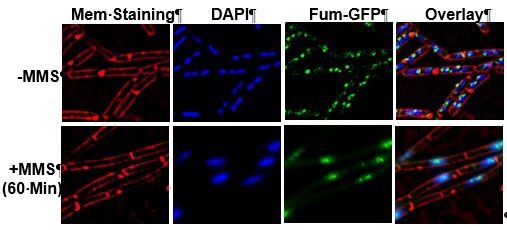
Fumarase is co-localized with the DNA after induction of DNA damage.
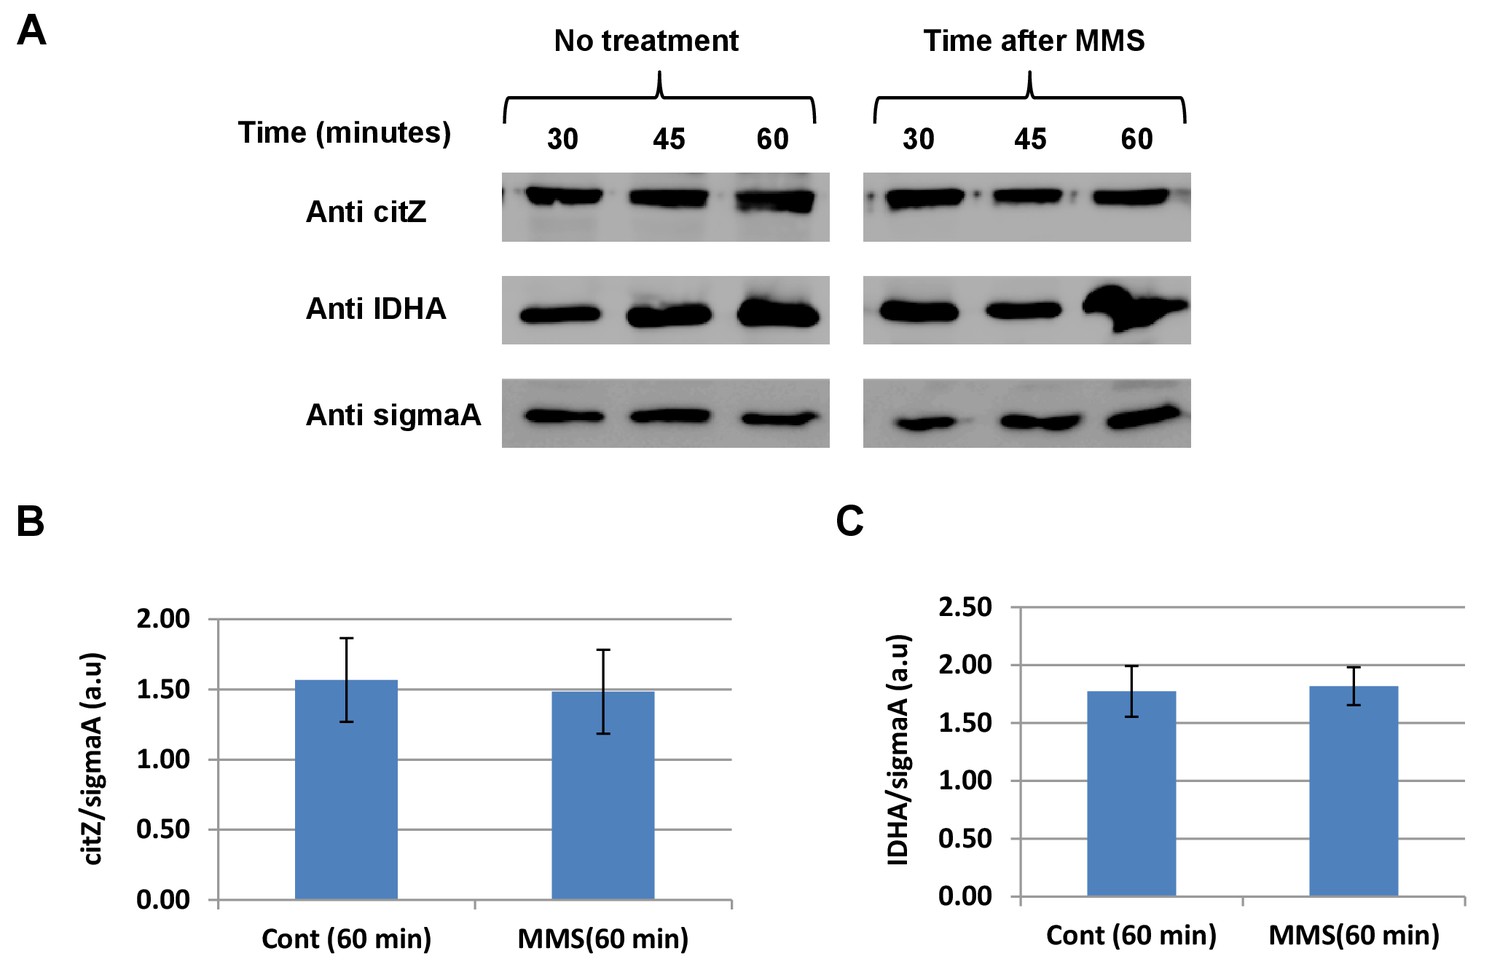
(A) B. subtilis was grown to logarithmic phase, MMS was added to final concentration of 0.07%(v/v) for 60 min. The levels of fumarase in the cells were determined at the indicated times by western blot analysis. Anti-SigmaA was used as a loading control. (B) The chart presents the relative amount of fumarase (densitometric analysis of Figure 2A, normalized to SigmaA) in cells grown in the absence or presence of MMS at 60 min (mean ±SEM [n = 5], p=0.01). (C) Fluorescence microscopy images of B. subtilis expressing fum-GFP in the absence (upper panel) and presence (lower panel) of MMS. FM4-64 (red), DAPI (blue), GFP (green) and a merge are shown. One representative experiment out of three independent experiments is shown. Bar, 1 μm. (D) Colocalization of Fum-bc-GFP and DAPI staining. The number of B. subtilis cells showing colocalization between GFP and DAPI staining with or without DNA damage induction by MMS. Error bars represent standard deviation (SD) of the mean fluorescence signal calculated from at least 100 cells. (E) The number of Fum-bc-GFP foci per cell with or without MMS. Shown is a representative experiment out of three independent repeats. (mean ±SEM [n = 3]).
Figure 2—figure supplement 1
TCA cycle enzymes.
(A) B. subtilis was grown to logarithmic phase, MMS was added to final concentration of 0.07%(v/v) for 60 min. The levels of citZ and ICDH in the cells were determined at the indicated times by western blot analysis. Anti-SigmaA was used as a loading control. (B) The chart presents the relative amount of citZ (densitometric analysis of Figure 2—figure supplement 2C, normalized to SigmaA) in cells grown in the absence or presence of MMS at 60 min (mean ± SEM [n = 3]). (C) The chart presents the relative amount of ICDH (densitometric analysis of Figure 2—figure supplement 2C, normalized to SigmaA) in cells grown in the absence or presence of MMS at 60 min (mean ± SEM [n = 3], p=0.01).
Figure 2—figure supplement 2
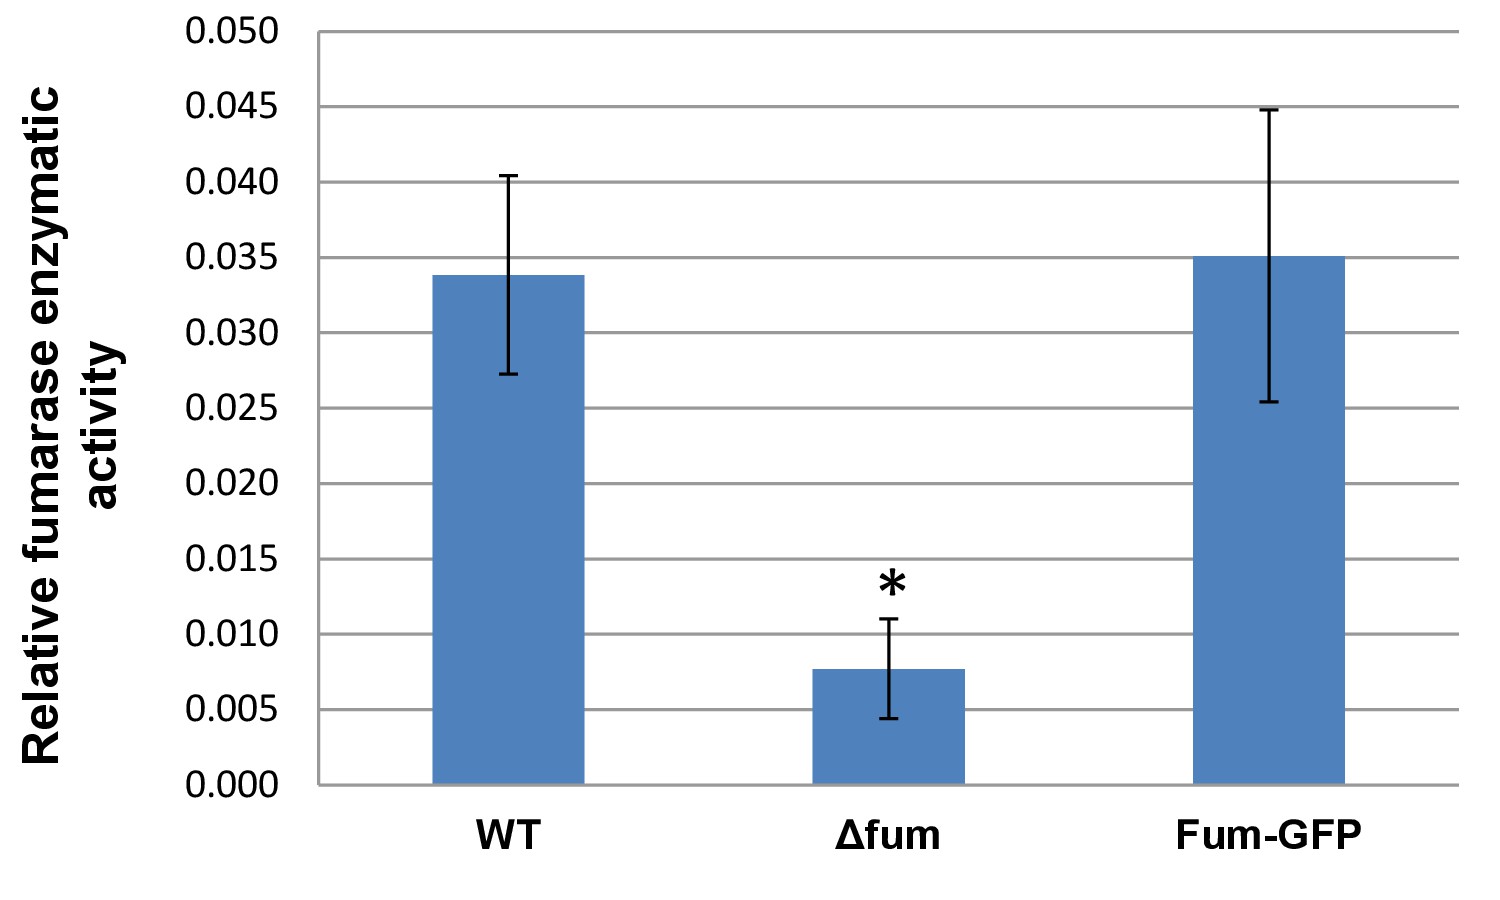
Enzymatic activity of B. subtilis fumarase fused to GFP.
B. subtilis cells were grown to logarithmic phase, harvested and resuspended in PBS. The cells were lysed and centrifuged to obtain the supernatant which was assayed for fumarase activity at 250 nm with L-malic acid as the substrate. (mean ± SEM [n = 3]).
Figure 3 with 4 supplements
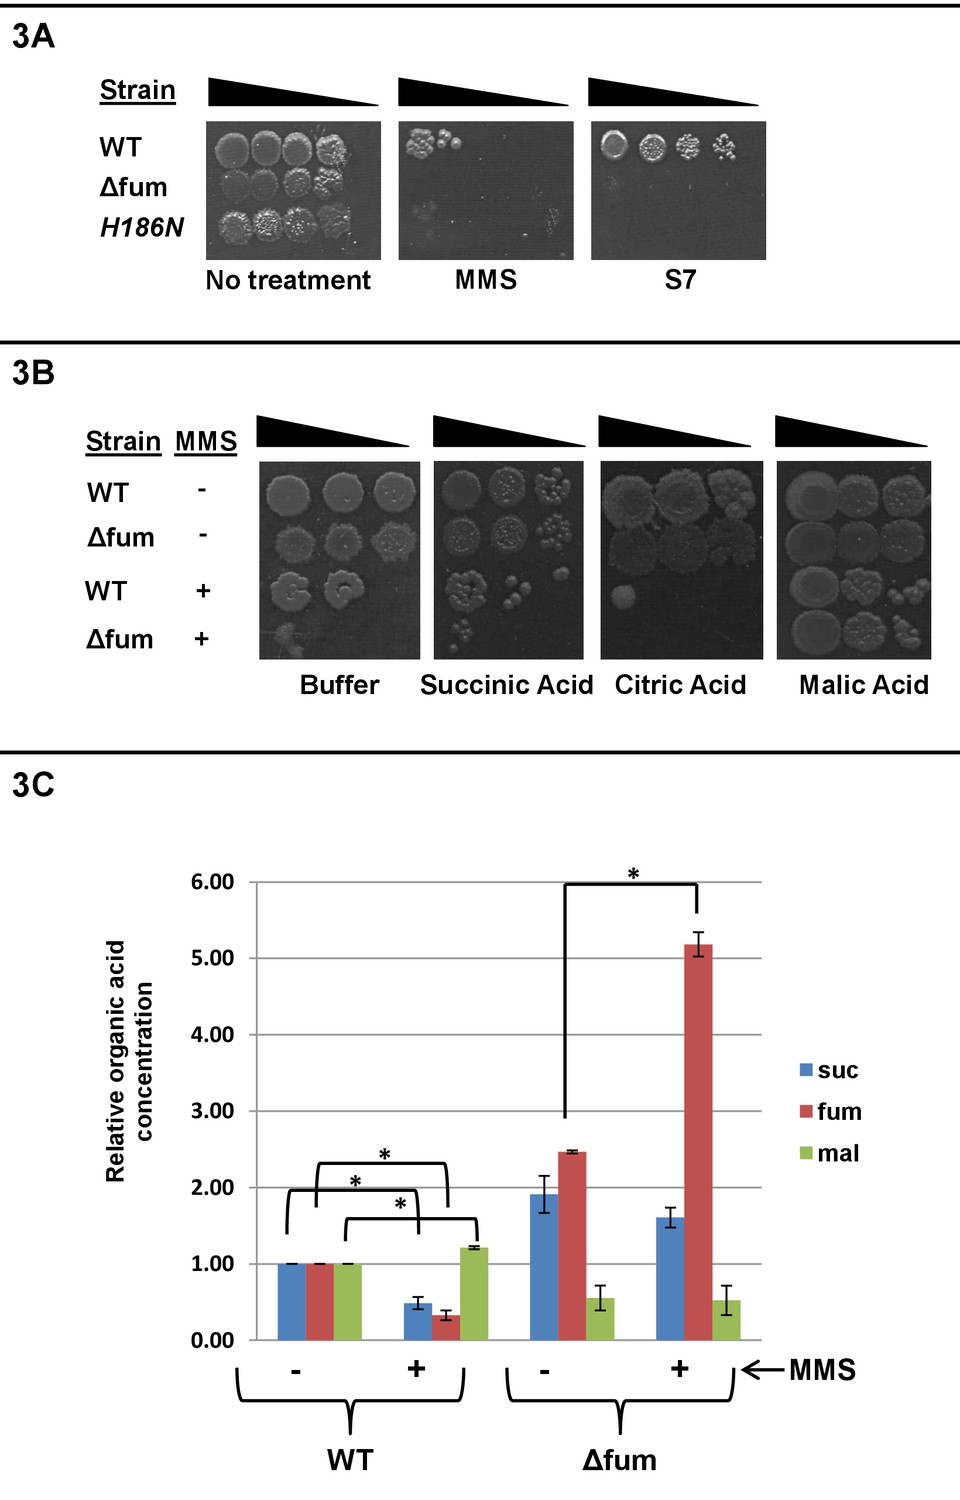
Fumarase enzymatic activity and L-malic acid are required for the DNA damage protective function.
(A) B. subtilis wild type, Δfum and mutant H186N fumarase strains were grown to logarithmic phase. MMS was added to a final concentration of 0.07% (v/v) for 45 min, the cells were washed and serially diluted onto LB plates. Untreated cells were serially diluted onto minimal S7 medium plates, containing 0.1% glucose. (B) Wild type and Δfum strains were grown to logarithmic phase, MMS was added to final concentration of 0.07% (v/v) for 45 min. The cells were washed and serially diluted onto LB plates containing 250 mM of phosphate buffer (pH = 6.8) and the indicated organic acids (Citric acid 10 mM, Malic acid 10 mM, Succinic Acid 25 mM). (C) Organic acid accumulation: Wild type and Δfum strains were grown to logarithmic phase, MMS was added to a final concentration of 0.07% (v/v) for 60 min. Metabolite extraction was followed by GC-MS as described in the Materials and methods The graph presents the relative amount of succinic, fumaric or L-malic acid before and after MMS treatment (blue- succinic acid, red- fumaric acid, green- L-malic acid). (mean ±SEM [n = 3], p<0.05). The data presented in Figure 3A and B, represent the results of three similar experiments.
Figure 3—figure supplement 1
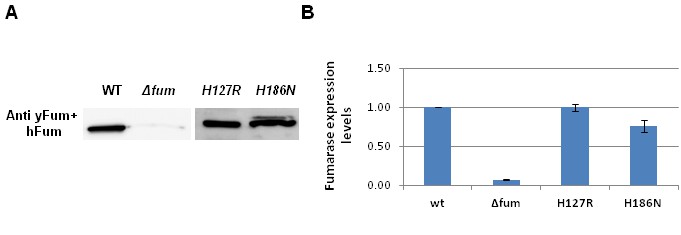
Expression of mutant fumarases.
(A) B. subtilis wild type (WT), Δfum, H127R and H186N strains were grown on LB media. Total cell extracts were prepared and subjected to western blotting, using the indicated antibodies. (B) The chart presents the relative amount of fumarase (densitometric analysis of Figure 3—figure supplement 3A) in cells (mean ± SEM [n = 3]).
Figure 3—figure supplement 2
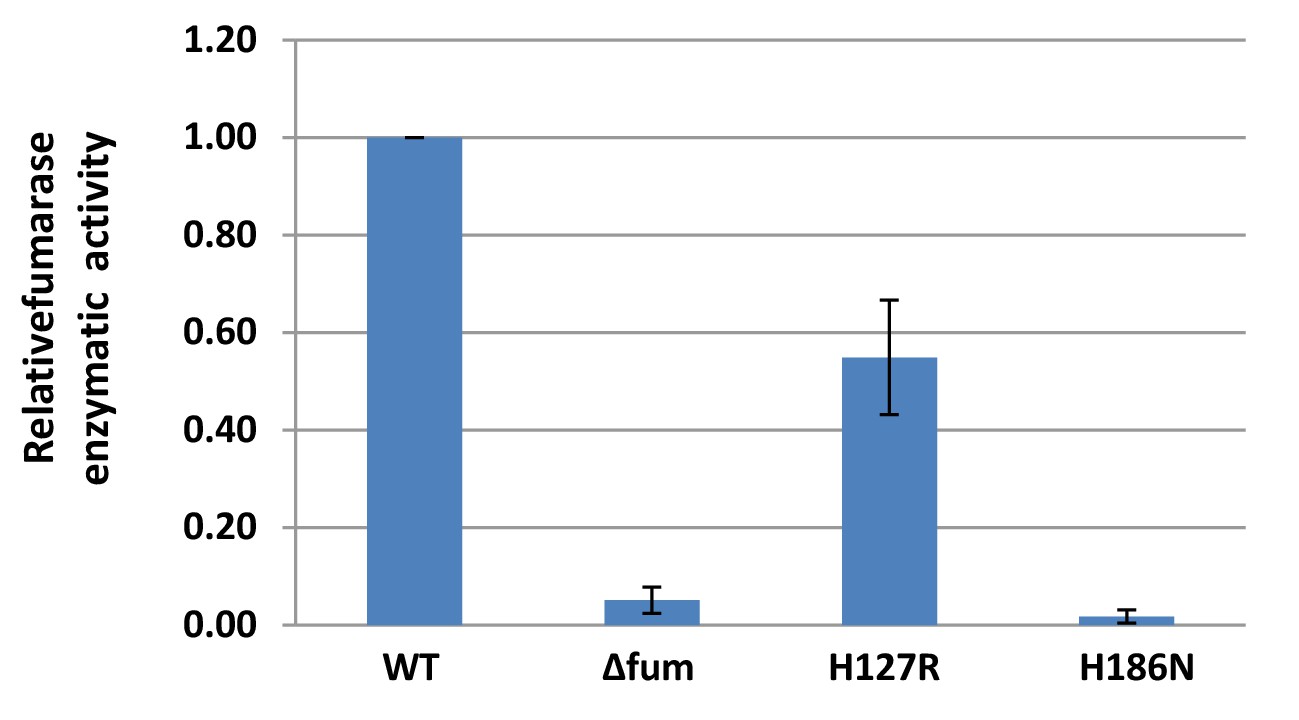
Enzymatic activity of mutant fumarases.
B. subtilis wild type (WT), Δfum, H127R and H186N strains were grown to logarithmic phase harvested and resuspended in PBS. The cells were lysed and centrifuged to obtain the supernatant which was assayed for fumarase activity at 250 nm with L-malic acid as the substrate. (mean ± SEM [n = 3]).
Figure 3—figure supplement 3

mutant fumarases.
B. subtilis wild type, Δfum and mutant H127R fumarase strains were grown to logarithmic phase. MMS was added to final concentration of 0.07% (v/v) for 45 min; the cells were washed and serially diluted onto LB plates. Untreated cells were serially diluted onto minimal S7 medium plates, containing 0.1% glucose. The data represent the results of three similar experiments.
Figure 3—figure supplement 4
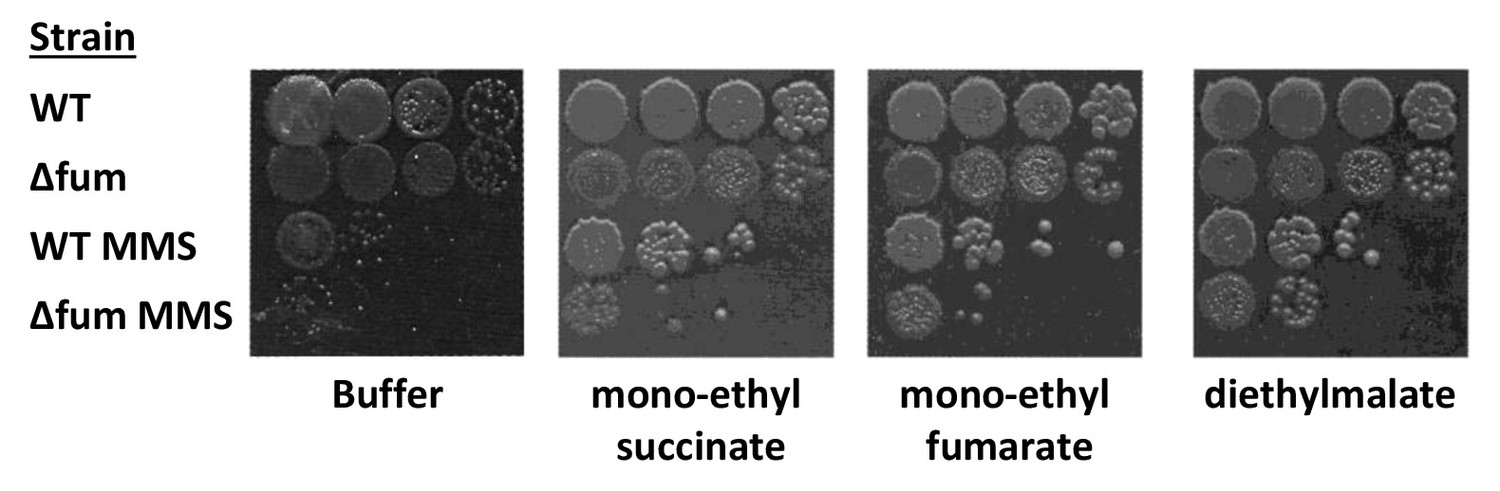
mutant fumarases.
Wild type and Δfum strains were grown to logarithmic phase, MMS was added to final concentration of 0.07% (v/v) for 45 min. The cells were washed and serially diluted onto LB plates containing 250 mM of phosphate buffer (pH = 6.8) and the indicated organic acid esters (mono-ethyl succinate 10 mM, mono-ethyl fumarate 25 mM, diethyl malate 25 mM). The data represent the results of three similar experiments.
Figure 4 with 1 supplement

Absence of fumarase affects RecN localization.
(A) Fluorescence microscopy images of B. subtilis expressing RecN-GFP in the absence (control) and presence of MMS (upper two rows of panels) and strains lacking the fumarase gene (Δfum, lower two rows of panels). FM4-64 (red), DAPI (blue), GFP (green) and a merge are shown. Representative panels from three independent experiments are shown. Bar, 1 μm. (B) Wild type, Δfum, ΔRecN and Δfum/ΔRecN strains were grown to logarithmic phase, MMS was added to a final concentration of 0.07%(v/v) for 45 min. The cells were washed and serially diluted onto LB plates containing 250 mM of phosphate buffer (pH = 6.8) and L-malic acid (10 mM). The data represent the results of three similar experiments.
Figure 4—figure supplement 1
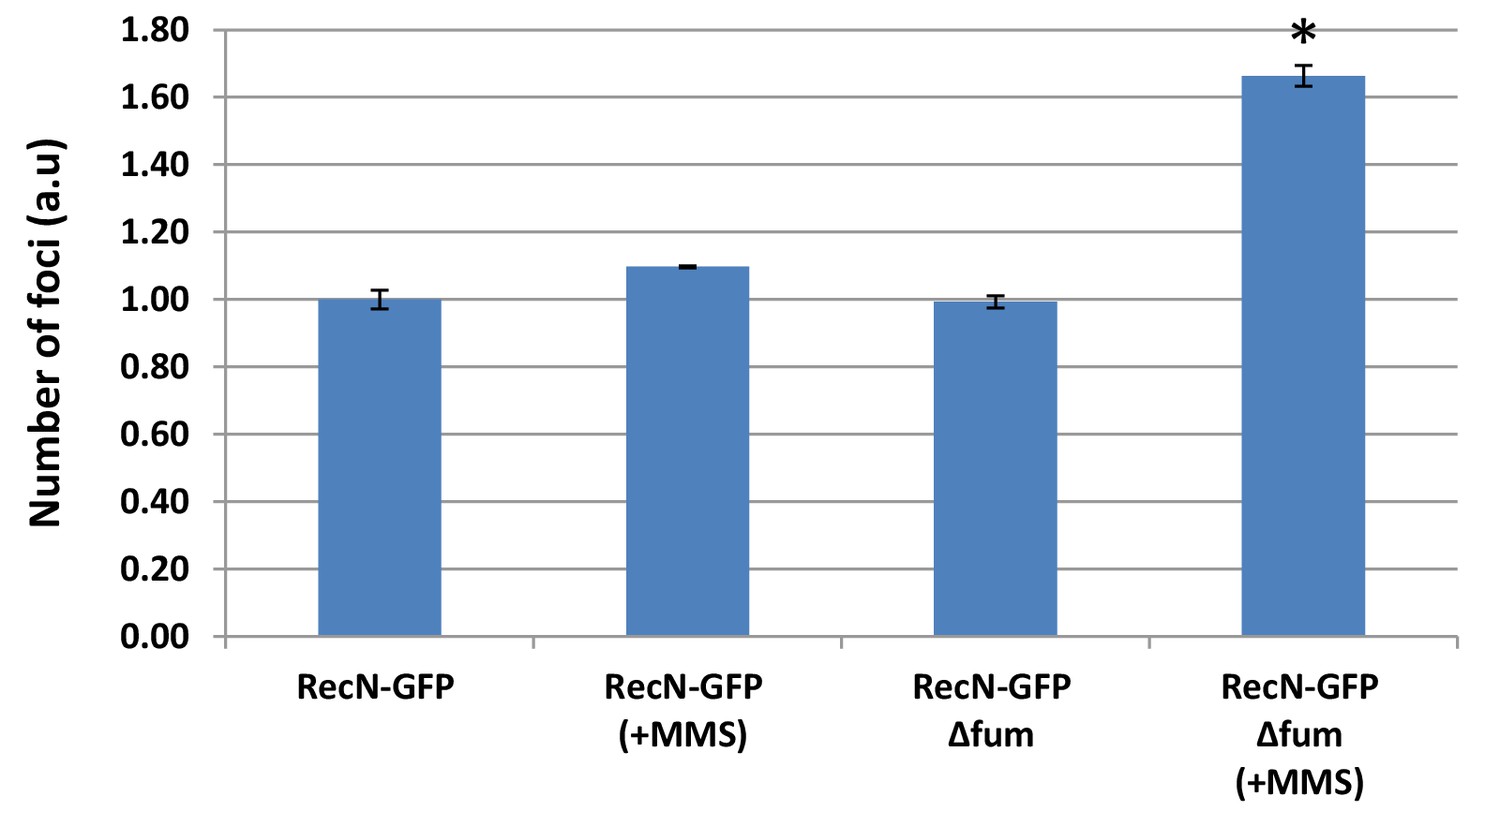
- Absence of fumarase affects the number of RecN foci.
The proportion of B. subtilis cells showing RecN-GFP foci with or without DNA damage induction by MMS (the RecN-GFP in WT cells shows a proportion of 0.37–0.46 which is normalized to one). Error bars represent standard deviation (SD) calculated from at least 100 cells.
Figure 5
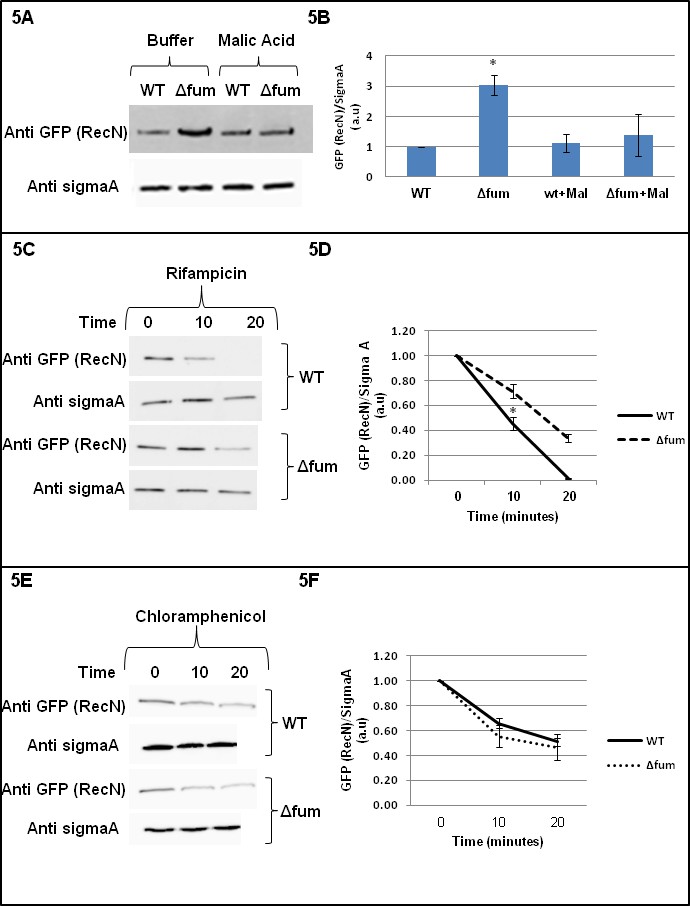
Fumarase affects RecN levels.
(A) RecN level is increased upon DNA damage. Wild type and Δfum strains, expressing RecN-GFP, were grown to logarithmic phase and MMS was added to final concentration of 0.07% (v.v). The cells were plated onto LB plates containing 250 mM of phosphate buffer (pH = 6.8) and L-malic acid, 10 mM. Cells were collected from the plates and the levels of RecN were determined in extracts by western blot analysis. Anti-SigmaA was used as a loading control. (B) RecN level is increased upon DNA damage. The chart presents the relative amount of RecN in the absence or presence of MMS with or without MMS (densitometric analysis of Figure 4C normalized to SigmaA, mean ±SEM [n = 3], p=0.05). (C) Wild type and Δfum cells containing RecN-GFP were grown exponentially in LB and exposed to 0.07% (v/v) MMS for 30 min at 37°C. Rifampicin (100 μg/ml) was added to inhibit transcription (time 0). The fate of RecN was followed by western blot and densitometric analysis (normalized to SigmaA and shown as optical density arbitrary units). (D) The chart presents the relative amount of RecN after treatment with Rifampicin (densitometric analysis of Figure 4E normalized to SigmaA). The RecN concentration at time 0 was arbitrarily determined as 100% and the results represent a mean ±SEM (n = 3), p=0.04. (E) Wild type and Δfum cells containing RecN-GFP were grown exponentially in LB and exposed to 0.07% (v/v) MMS for 30 min at 37°C. Chloramphenicol (Cm, 20 μg/ml) was added to inhibit protein synthesis (at time 0). At the times indicated cell growth was halted by addition of NaN3 (10 μM), and the fate of RecN was followed by western blot analysis. (F) The chart presents the relative amount of RecN after treatment with chloramphenicol (densitometric analysis of Figure 5E normalized to SigmaA). The RecN concentration at time 0 was arbitrarily determined as 100% and the results represent a mean ±SEM (n = 3).
Author response image 1
Additional files
-
Supplementary file 1
B. subtilis strains.
B. subtilis strains used in this study and their source.
- https://doi.org/10.7554/eLife.30927.018
-
Supplementary file 2
S. cerevisiae strains.
S. cerevisiae strains used in this study and their source.
- https://doi.org/10.7554/eLife.30927.019
-
Transparent reporting form
- https://doi.org/10.7554/eLife.30927.020
Download links
A two-part list of links to download the article, or parts of the article, in various formats.
Downloads (link to download the article as PDF)
Open citations (links to open the citations from this article in various online reference manager services)
Cite this article (links to download the citations from this article in formats compatible with various reference manager tools)
Bacterial fumarase and L-malic acid are evolutionary ancient components of the DNA damage response
eLife 6:e30927.
https://doi.org/10.7554/eLife.30927


