Structural insight into TPX2-stimulated microtubule assembly
- Lawrence Berkeley National Laboratory, United States
- The Francis Crick Institute, United Kingdom
- University of California, Berkeley, United States
- Howard Hughes Medical Institute, University of California, Berkeley, United States
Figures
Figure 1 with 5 supplements
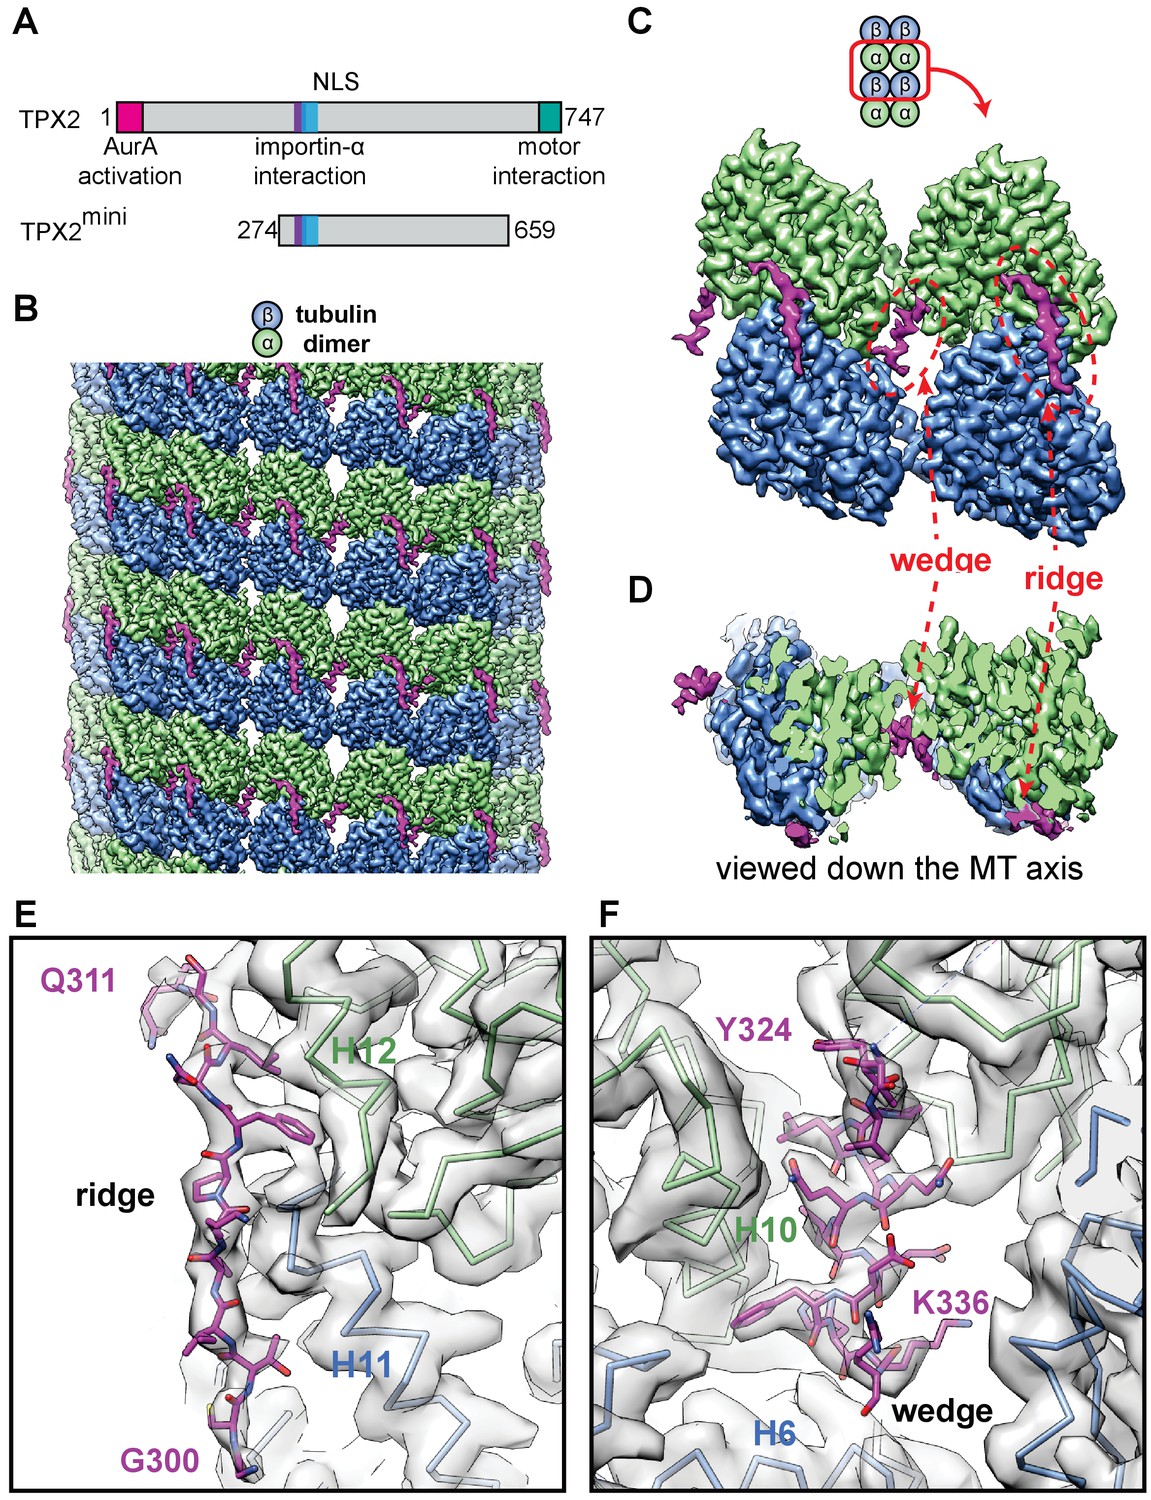
High-resolution cryo-EM structure of TPX2 bound to GMPCPP-MTs.
(A) Schematic of domain structure for full-length TPX2 and TPX2mini. (B) Cryo-EM reconstruction of mGFP-TPX2mini decorated GMPCPP-MT, with pseudo-helical symmetry applied. α-tubulin, β-tubulin and TPX2 are colored in green, blue and magenta, respectively. The same color scheme is used throughout. (C) Zoom-in view of two TPX2 molecules interacting with four neighboring tubulin monomers. (D) End-on view of the cryo-EM density, related to (c) by a 90° rotation, looking toward the MT minus end.( E–F) Zoom-in view of the cryo-EM density and atomic model of TPX2 ridge (E) and wedge (F) respectively.
Figure 1—figure supplement 1
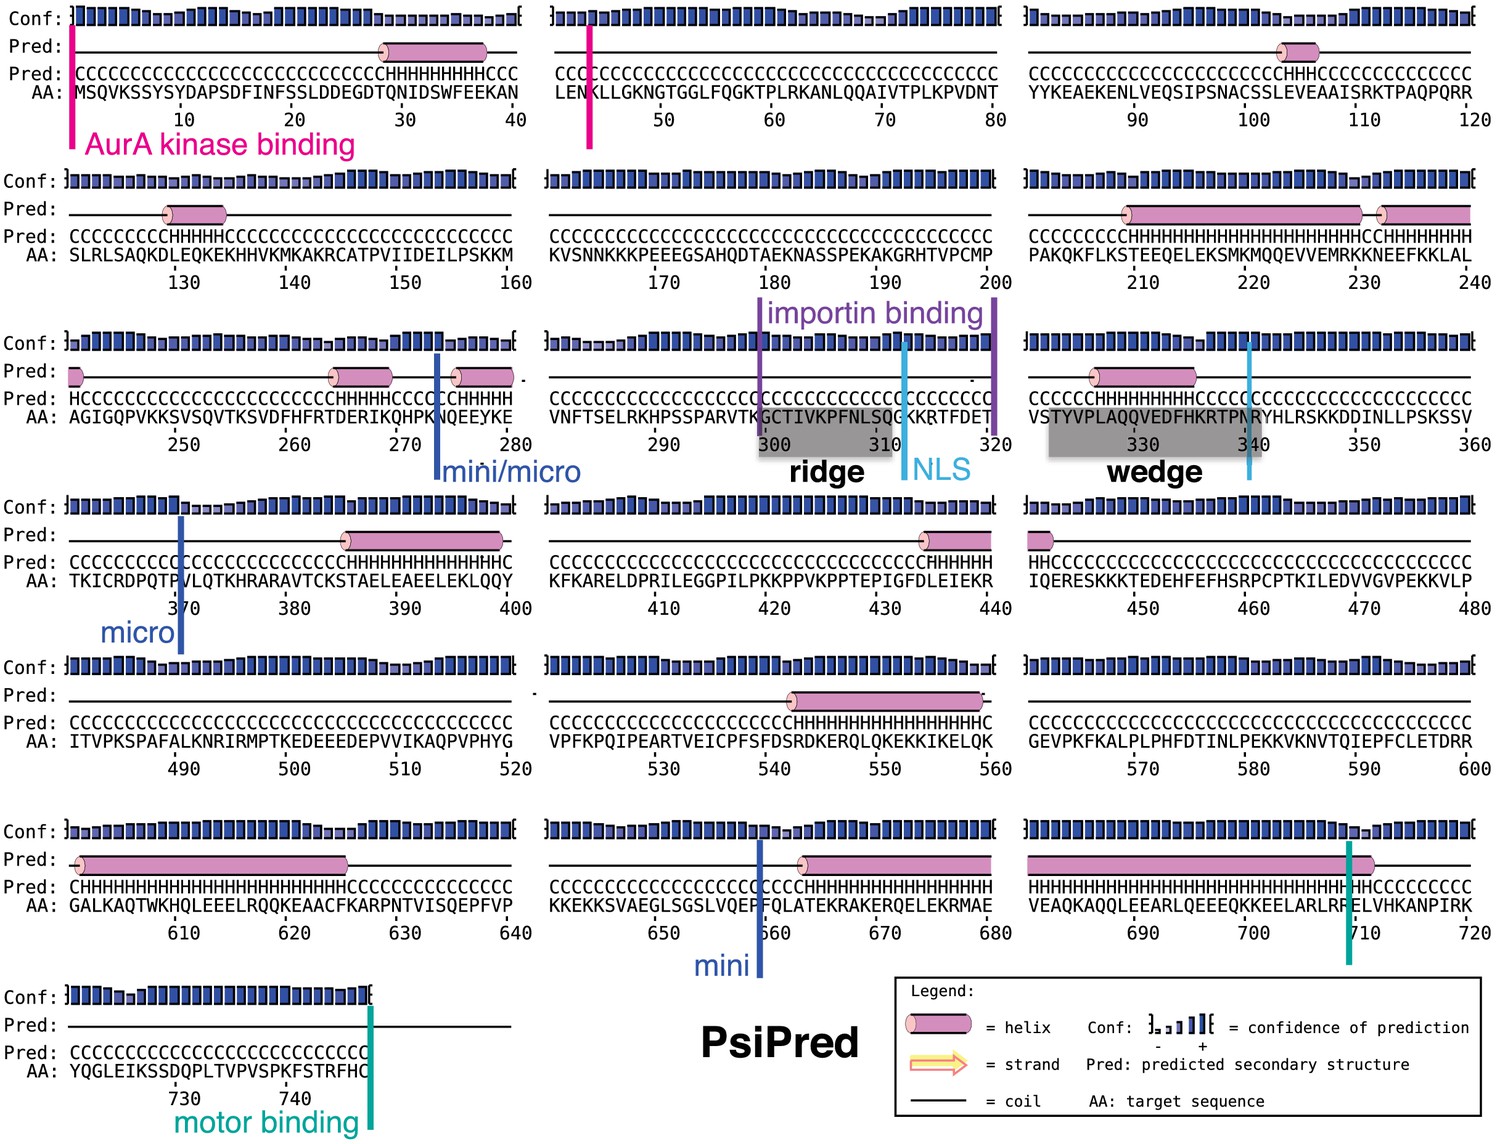
The sequence of human TPX2.
Predicted secondary structure for TPX2 obtained using PSIPRED (http://bioinf.cs.ucl.ac.uk/psipred/). α-helices are colored in magenta and beta sheets in yellow. The starting and ending residues for the mGFP-TPX2mini and mGFP-TPX2micro constructs are indicated. The binding sites for Aurora A kinase and importin, and its nuclear localization signal (NLS) sequence are marked. The modeled regions for the ridge and the wedge of TPX2 are highlighted in grey.
Figure 1—figure supplement 2
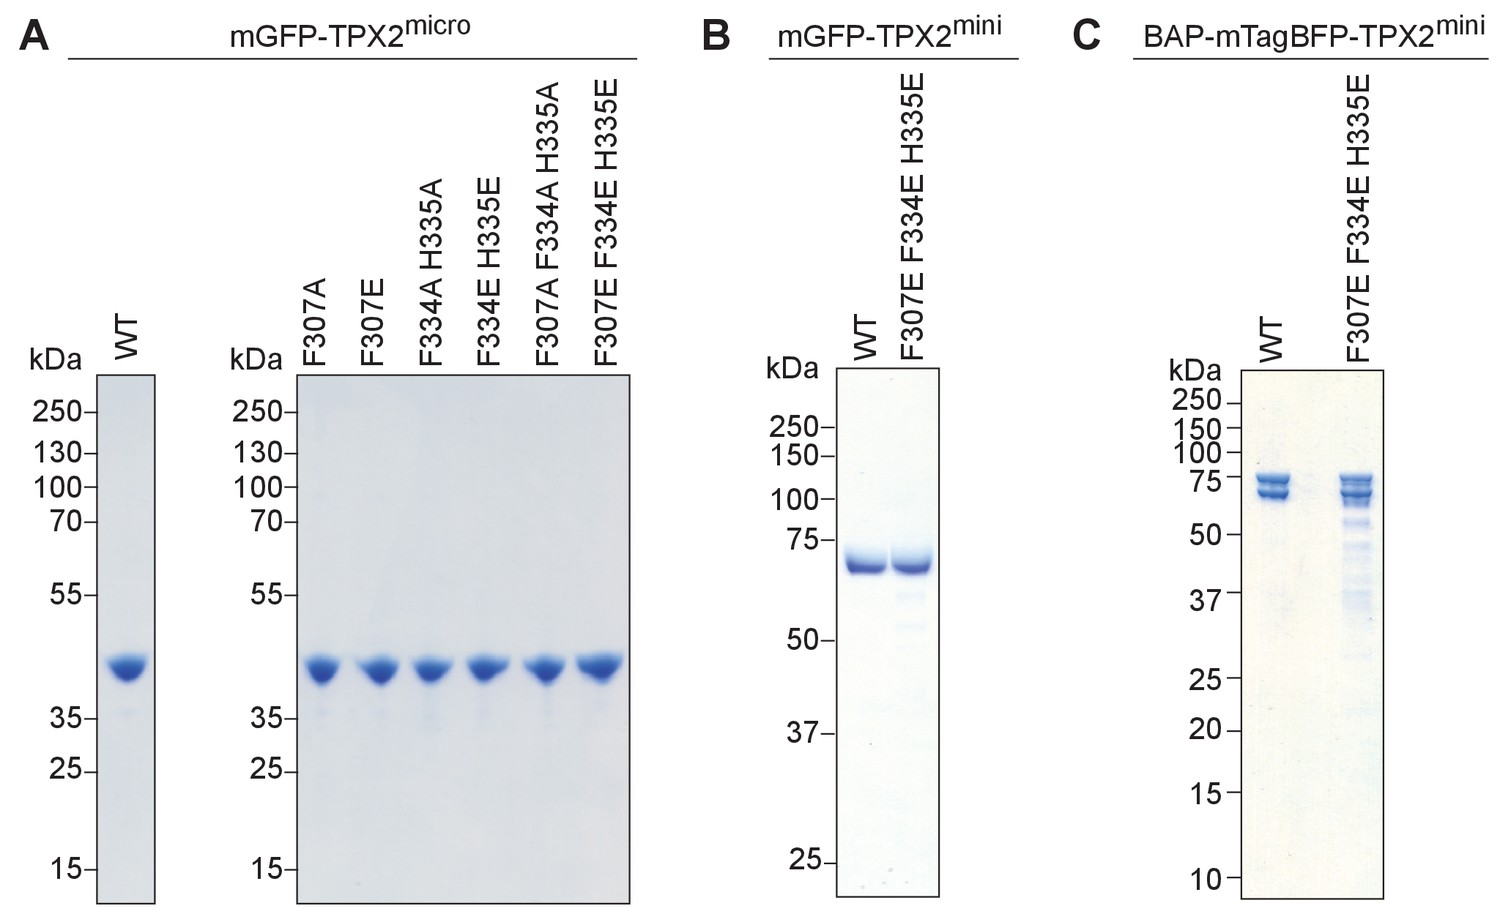
Coomassie Blue stained SDS page gels of purified TPX2 constructs used in this study.
Equal amounts of intact (A) wild-type and mutant versions of mGFP-TPX2micro, (B) wild-type and triple mutant of mGFP-TPX2mini, (C) wild-type and triple mutant of biotinylated TPX2mini were loaded on the gel. The double band seen for BAP-mTagBFP-tagged TPX2 constructs have been observed for other BAP-mTagBFP-tagged proteins in the past (Roostalu et al., 2015) and likely reflect the different maturation/folding states of mTagBFP.
Figure 1—figure supplement 3
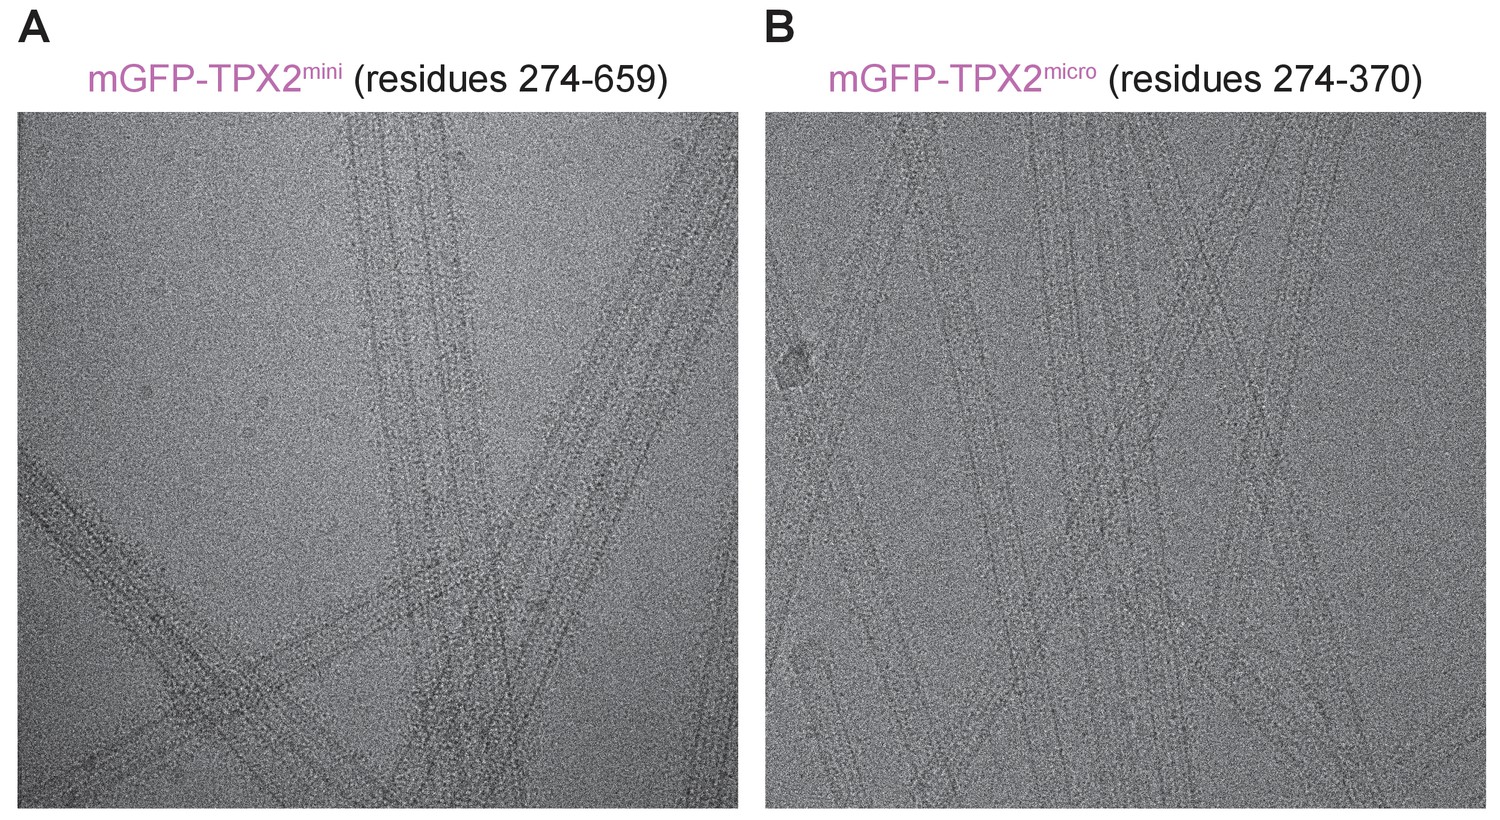
Cryo-EM images of GMPCPP-MTs decorated with TPX2mini or TPX2micro constructs.
Cryo-EM images of GMPCPP-MTs in the presence of saturating amounts of either mGFP-TPX2mini (A) or mGFP-TPX2micro (B) clearly show extra densities on the MT surface corresponding to the TPX2 molecules.
Figure 1—figure supplement 4
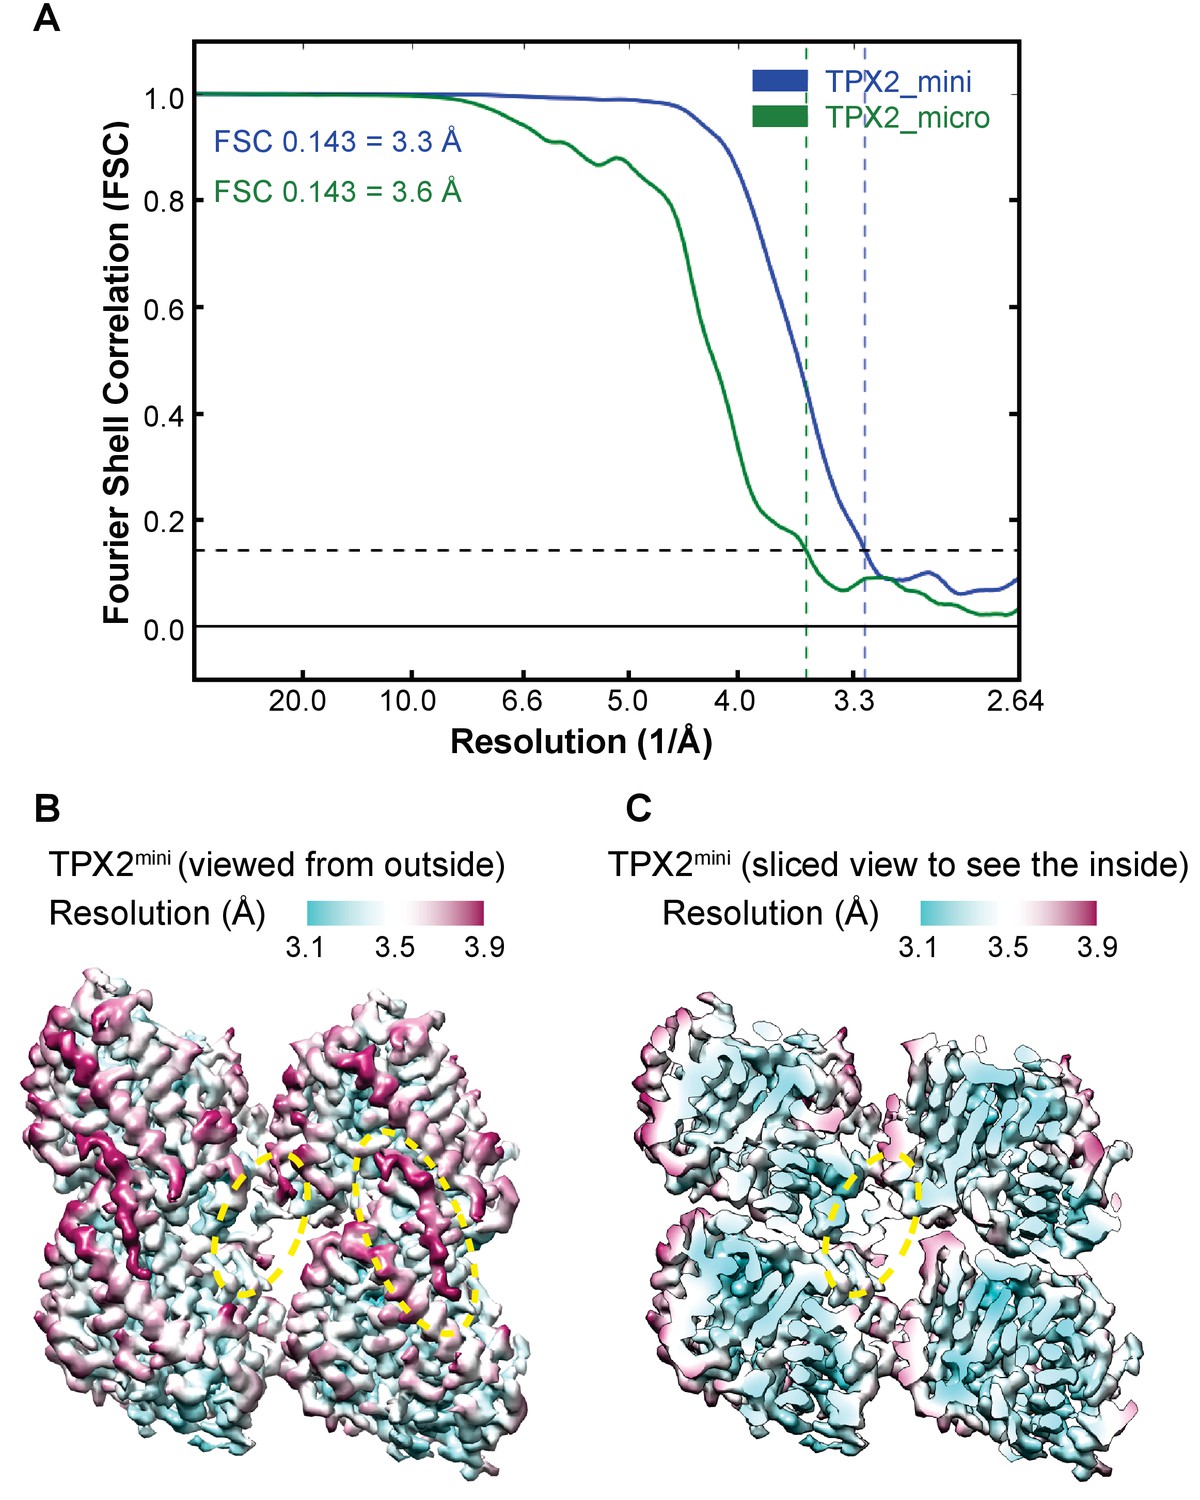
Resolution estimation of the cryo-EM structures of GMPCPP-MTs decorated with TPX2.
(A) Fourier Shell Correlation (FSC) curves for GMPCPP-MTs decorated with mGFP-TPX2mini and mGFP-TPX2micro. The final resolution for each reconstruction was estimated by calculating the Fourier Shell Correlation (FSC) of a single tubulin dimer at a ‘good’ protofilament following pseudo-helical averaging, using a FSC 0.143 criterion. (B) Local resolution distribution for the GMPCPP-MTs decorated with TPX2mini, viewed from the outside of MT. (C) Same orientation as (B) but a sliced view to see the density inside. The yellow dashed circles mark the locations of TPX2 wedge and ridge.
Figure 1—figure supplement 5
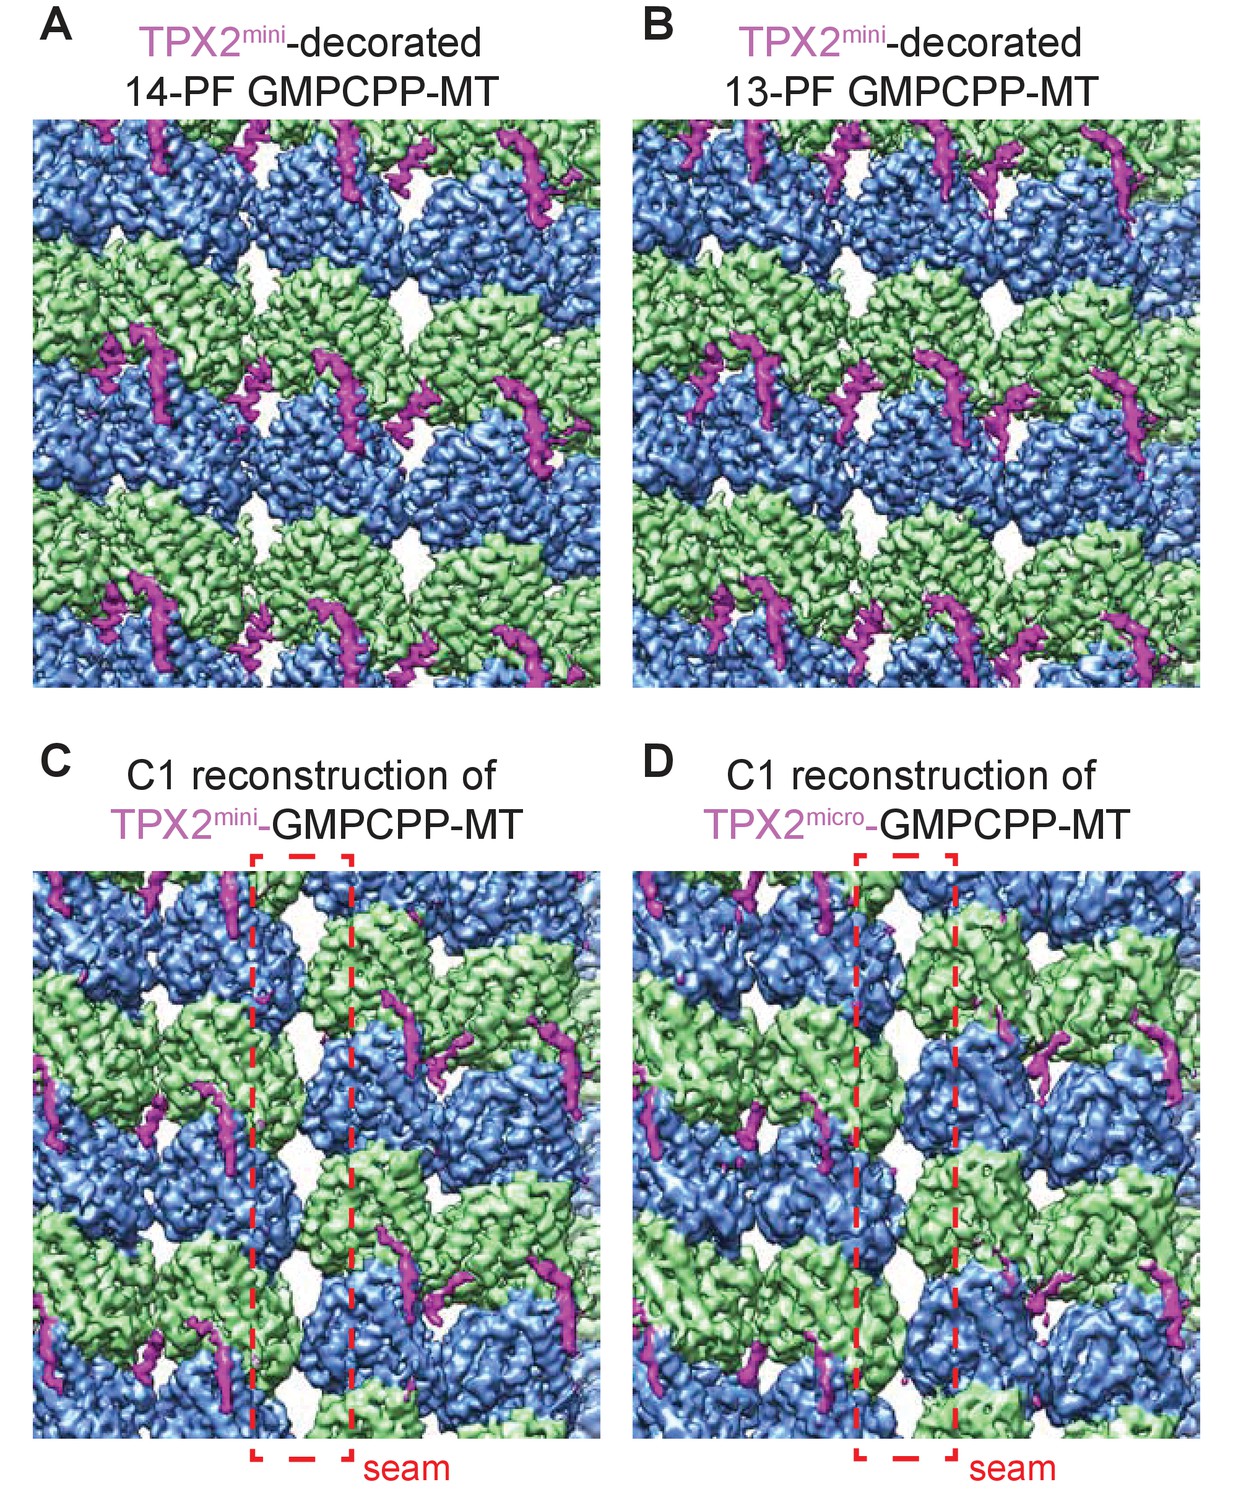
Cryo-EM reconstructions of GMPCPP-MTs decorated with TPX2 molecules.
(A–B) Zoom-in views of the symmetric reconstructions of 14-PF (A) and 13-PF (B) GMPCPP-MTs decorated with TPX2mini molecules show similar density levels for the TPX2. (C–D) Zoom-in view of the asymmetric (C1) reconstructions (without averaging PFs) of GMPCPP-MTs decorated with mGFP-TPX2mini (C) and mGFP-TPX2micro (D). The seam location is marked by red dashed rectangle. The C1 reconstructions show the absence of density corresponding to the wedge of TPX2mini near the seam, while the ridge is still present in (C).
Figure 2
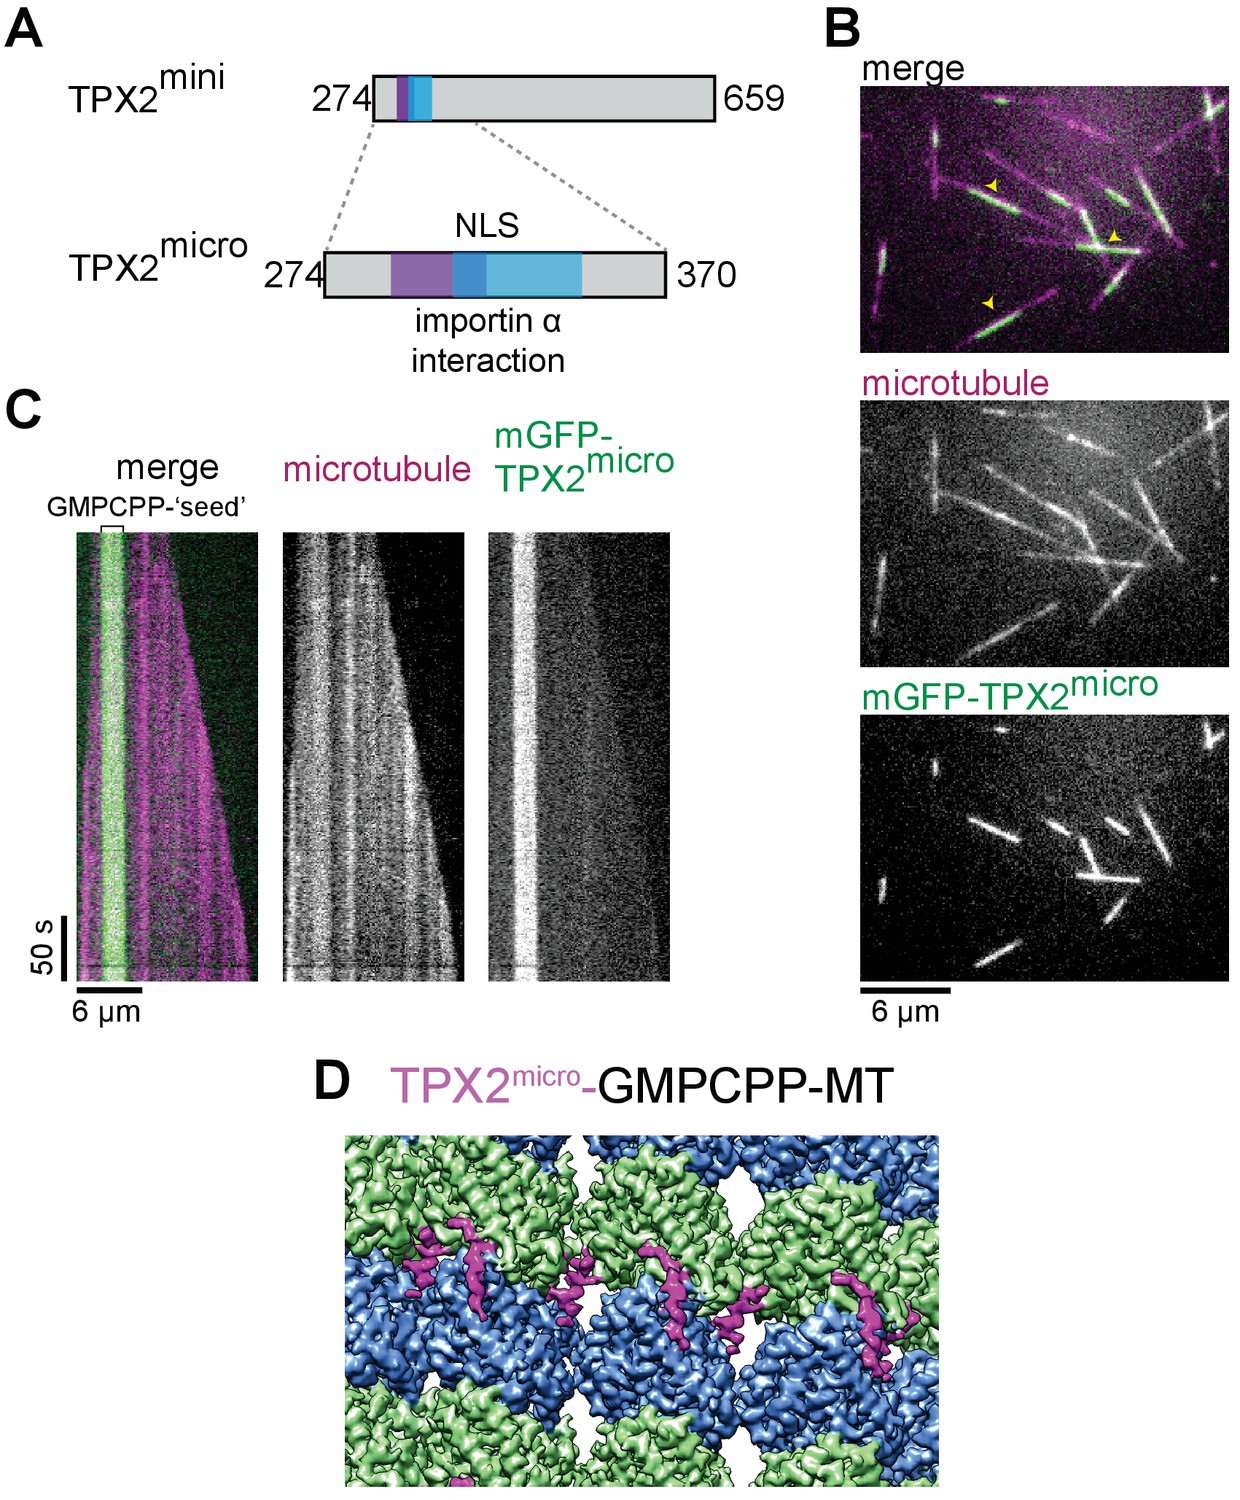
TPX2micro retains the MT lattice specificity for GMPCPP-MTs.
(A) Schematic of the TPX2mini and TPX2micro constructs. (B–C) TIRF microscopy images (B) and representative kymographs (C) showing mGFP-TPX2micro (green in merge) binding preferentially to the GMPCPP segment of MTs (magenta in merge) growing dynamically in the presence of GTP. Yellow arrowheads indicate GMPCPP-‘seed’ region. Tubulin and mGFP-TPX2micro concentrations were 15 μM and 500 nM, respectively. (D) Reconstruction of GMPCPP-MTs decorated with mGFP-TPX2micro.
Figure 3 with 1 supplement

Residues important for TPX2 interaction with MTs.
(A) Zoom-in view of the atomic model of the TPX2 ridge (left) and wedge (right). (B) Schematic of TPX2micro indicating the ‘ridge’ and the ‘wedge’ regions as well as the residues that were mutated to test for MT interaction. (C) TIRFM images depicting mGFP-TPX2micro (green) binding to growing Atto565-labeled MTs (magenta). Yellow arrowheads indicate the GMPCPP-‘seed’ region. (D–E) TIRFM images depicting mutant mGFP-TPX2micro (green) binding to MTs (magenta). Tubulin and mGFP-TPX2micro concentrations were 15 μM and 1 µM, respectively. Note that in all cases background subtracted 25-frame averages are shown to allow visualization of the differences between the faint signals of the mutants on the MT lattice. (F) Box-and-whiskers plot depicting average fluorescence intensity measurements for mGFP-TPX2micro GMPCPP MT ‘seed’ binding comparing wild-type and mutant proteins. The boxes extend from 25th to 75th percentiles, the whiskers extend from minimum to maximum values, and the mean value is plotted as a line in the middle of the box. 500 timeframes were averaged for each MT ‘seed’. Number of ‘seeds’ analyzed: WT – 18, F307A – 30, F307E – 25, F334A H335A – 25, F334E H334 – 29, F307A F334A H335E – 29, F307E F334E H335E – 24.
Figure 3—figure supplement 1
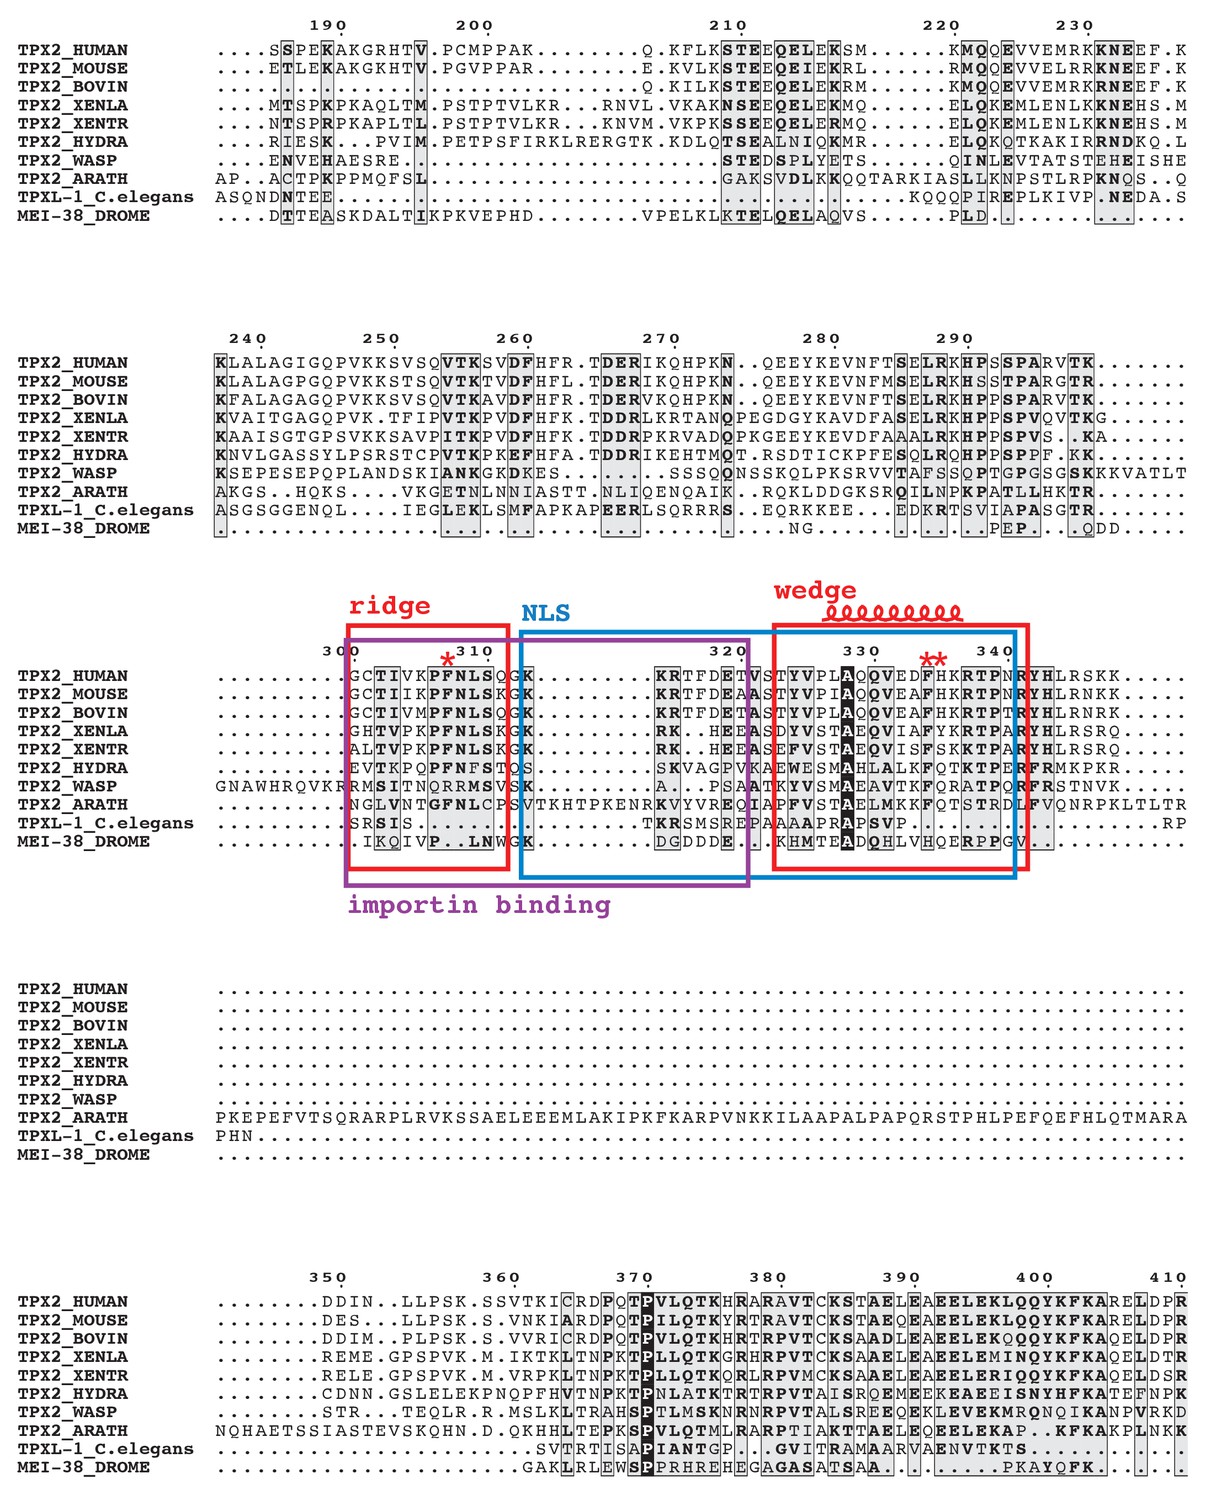
Alignment of TPX2 amino acid sequences from different species.
The alignment shows the region around the wedge, ridge and NLS. The figure was prepared using ESPript (Notredame et al., 2000) based on alignment results from T-coffee (Robert and Gouet, 2014). The assigned sequences for TPX2 ridge and wedge motifs are highlighted with red boxes. The NLS and importin-binding site of TPX2 are highlighted with blue and purple boxes, respectively. The short α-helix within the wedge motif is marked. The conserved residues that were mutated in our studies are indicated above the sequences by red asterisks.
Figure 4

Perturbing critical residues for MT interaction disrupts GMPCPP ‘seed’ and growing MT end binding of TPX2mini.
(A) Schematic of the TPX2mini indicating the three mutated residues (top), and representative TIRF microscopy images (bottom) comparing wild-type mGFP-TPX2mini and the F307E F334E H335E triple mutant of mGFP-TPX2mini (green in merge) binding to dynamic Alexa647-labeled MTs (magenta in merge). MT plus ends are indicated by yellow (+) signs, and GMPCPP ‘seeds’ by yellow arrowheads. (B) Representative kymographs of the same experiment. Tubulin and mGFP-TPX2mini concentrations were 12.5 μM and 125 nM, respectively. (C) Box-and-whiskers plot depicting average fluorescence intensity measurements for mGFP-TPX2mini GMPCPP MT ‘seed’ binding comparing wild-type and mutant protein. The boxes extend from 25th to 75th percentiles, the whiskers extend from minimum to maximum values, and the mean value is plotted as a line in the middle of the box. 250 time frames were averaged for each MT ‘seed’. Number of ‘seeds’ analyzed: WT – 57, F307E F334E H335E – 67. (D) Averaged fluorescence intensity profiles of wild-type and mutant mGFP-TPX2mini at growing MT ends. 180 timeframes were averaged for each growing plus end. Number of plus ends analyzed: WT – 42, F307E F335E H335E – 43. Error bars are s.e.m. (E) Schematic of the TIRF microscopy-based MT nucleation assay. (F) Representative TIRFM images of CF640R-labeled MT nucleation time course comparing the nucleation promoting ability of wild-type biotinylated TPX2mini and F307E F334E H335E triple mutant biotinylated TPX2mini. Fluorescently labeled tubulin concentration was 15 μM, biotinylated TPX2mini concentrations were 90 nM.
Figure 5 with 2 supplements

TPX2 binds at inter-dimer interfaces that change during the MT lattice compaction linked to GTP hydrolysis.
(A) Comparison of atomic models between the kinesin-bound GMPCPP-MT and GDP-MT states (both in the absence of TPX2 binding). The two models are aligned on the β1-tubulin subunit. Both α- and β-tubulin in the GMPCPP-state are colored in orange, whereas α-tubulin and β-tubulin in the GDP-state are colored in green and blue, respectively. The model of the TPX2 molecule (magenta) from the present study is also displayed at the corresponding location. (B) Zoom-in view of the TPX2-wedge-binding site. The black dashed circle marks the T5 loop in β-tubulin that show significant local changes during MT lattice compaction. The red dashed circles mark the regions of tubulin contacting the short helix of the wedge element. (C) Zoom-in view of the TPX2-ridge binding site. The black dashed circle marks the H5 helix in α-tubulin that show significant local changes during MT lattice compaction.
Figure 5—figure supplement 1
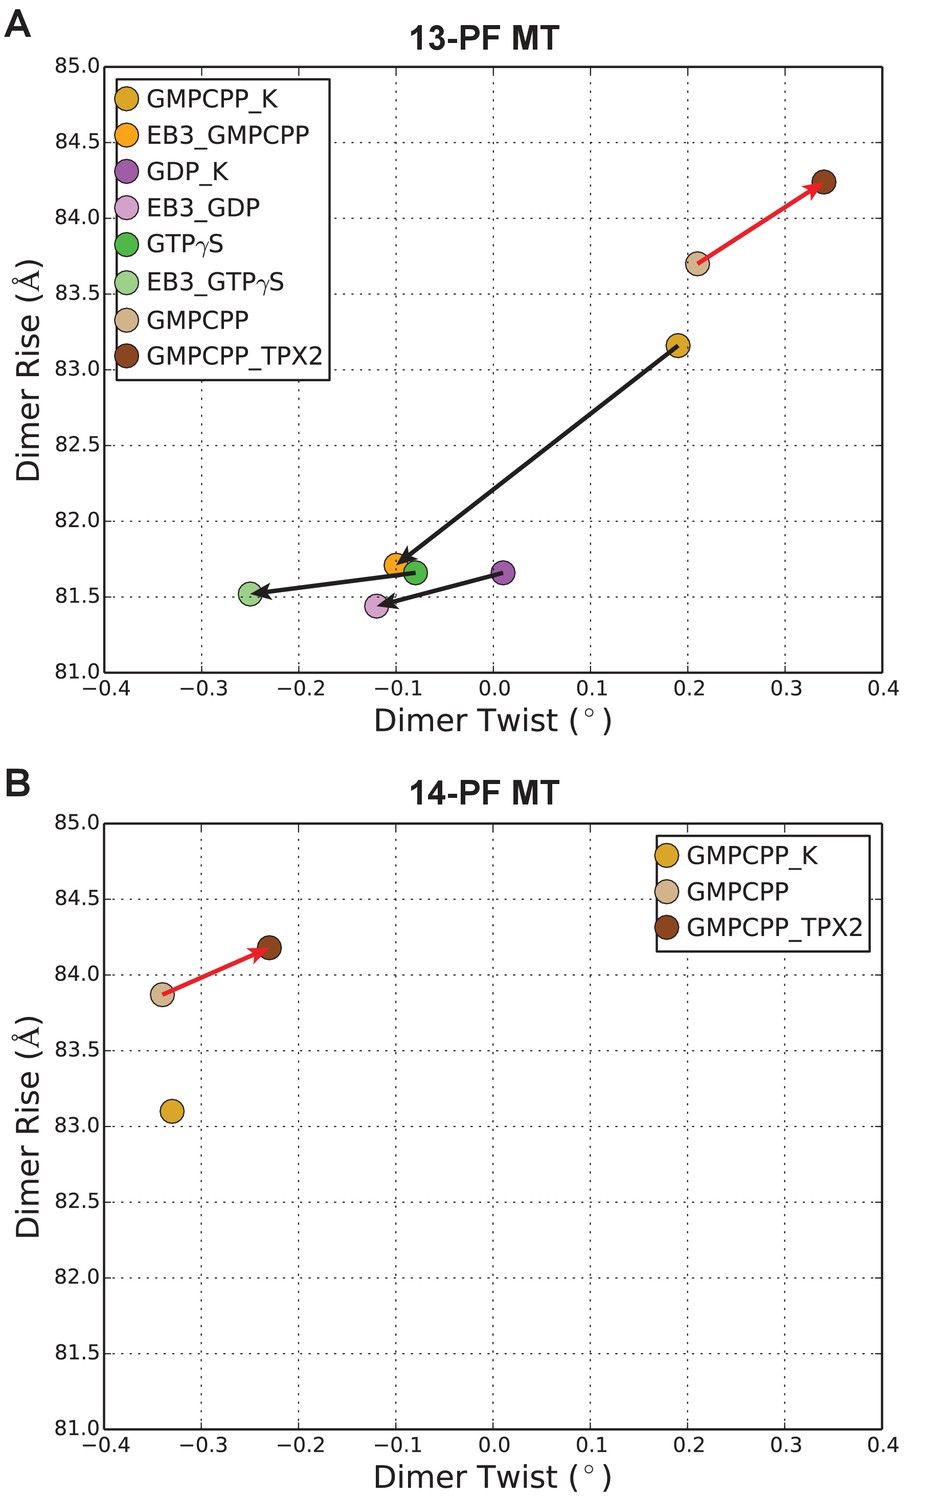
Plot of MT lattice parameters for different functional states.
Dimer twist versus dimer rise for MT cryo-EM reconstructions in different states, displaying values for the most abundant 13- (A) or 14- (B) start helix of the tubulin dimer. Note 14-PF MTs naturally have more dimer twist than the 13-PF MTs due to the presence of protofilament supertwist. The arrows indicate the changes of MT lattice parameters for a given nucleotide state upon binding of either EB3 or TPX2. Because TPX2mini and TPX2micro have very similar effects on the MT lattice, only TPX2mini are shown.
-
Figure 5—figure supplement 1—source data 1
Lattice parameters for different MT states.
- https://doi.org/10.7554/eLife.30959.014
Figure 5—figure supplement 2
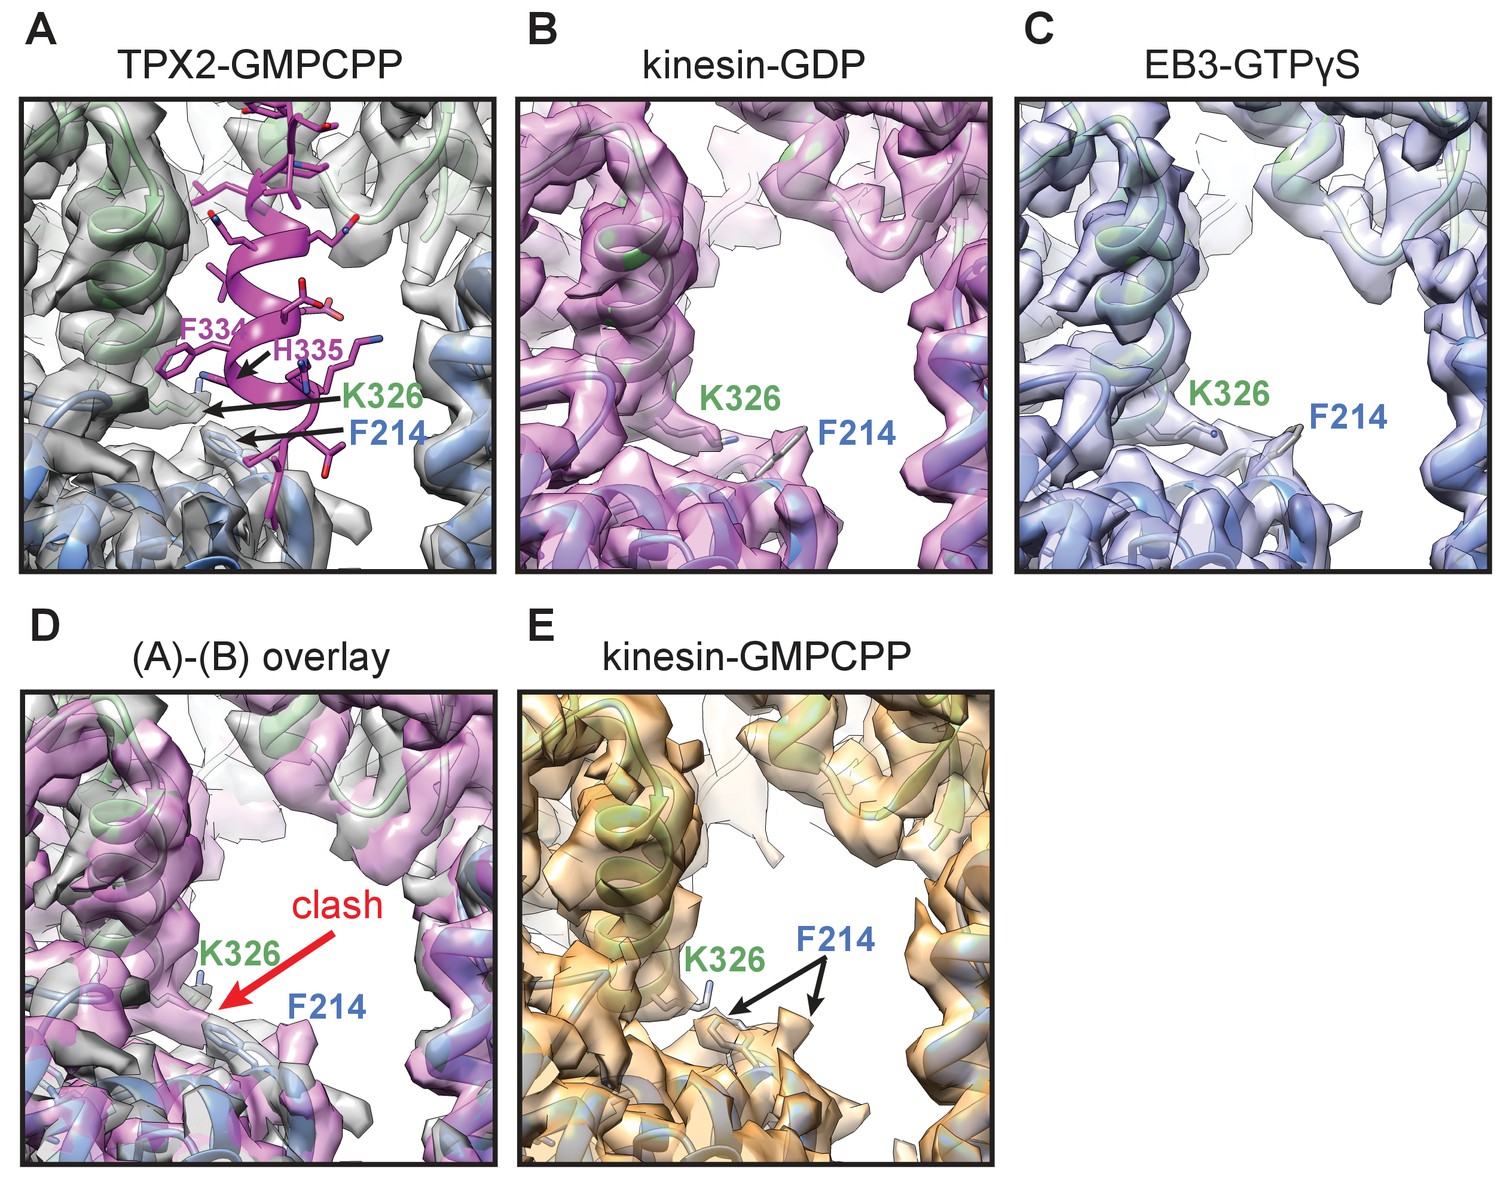
Effect of TPX2 binding on tubulin conformational transitions with nucleotide state.
Comparing cryo-EM structures of MTs in different nucleotide states reveals a pair of tubulin side chains at the inter-dimer interface, α:K326 and β:F214, that adopt different rotamer conformations between the extended GMPCPP-MT lattice with TPX2 bound, and the compacted lattice seen previously for GDP-MT and GTPγS-MT (Zhang et al., 2015). (A) High-resolution cryo-EM structure and atomic model of TPX2-bound GMPCPP-MT at the site of TPX2 wedge binding (showing an extended lattice). (B–C) The same location as (A) for kinesin decorated GDP-MT (B) and EB3 decorated GTPγS-MT (C) (both have compacted lattice). (D) Overlay of the cryo-EM densities in (A) and (B) aligning on the β-tubulin subunit. The two sets of rotamer conformations are sterically incompatible with each other.(E) The same location as (A) for kinesin decorated GMPCPP-MT (extended lattice), without TPX2. The lack of defined density for these side chains suggests that both residues can switch between these sets of rotamers in an extended lattice in the absence of TPX2. However, the binding of TPX2 appears to lock these residues in a configuration that is not allowed in the compacted lattice, potentially being one mechanism by which that TPX2 can slow down lattice compaction, and hence stabilize the MT.
Figure 6 with 1 supplement
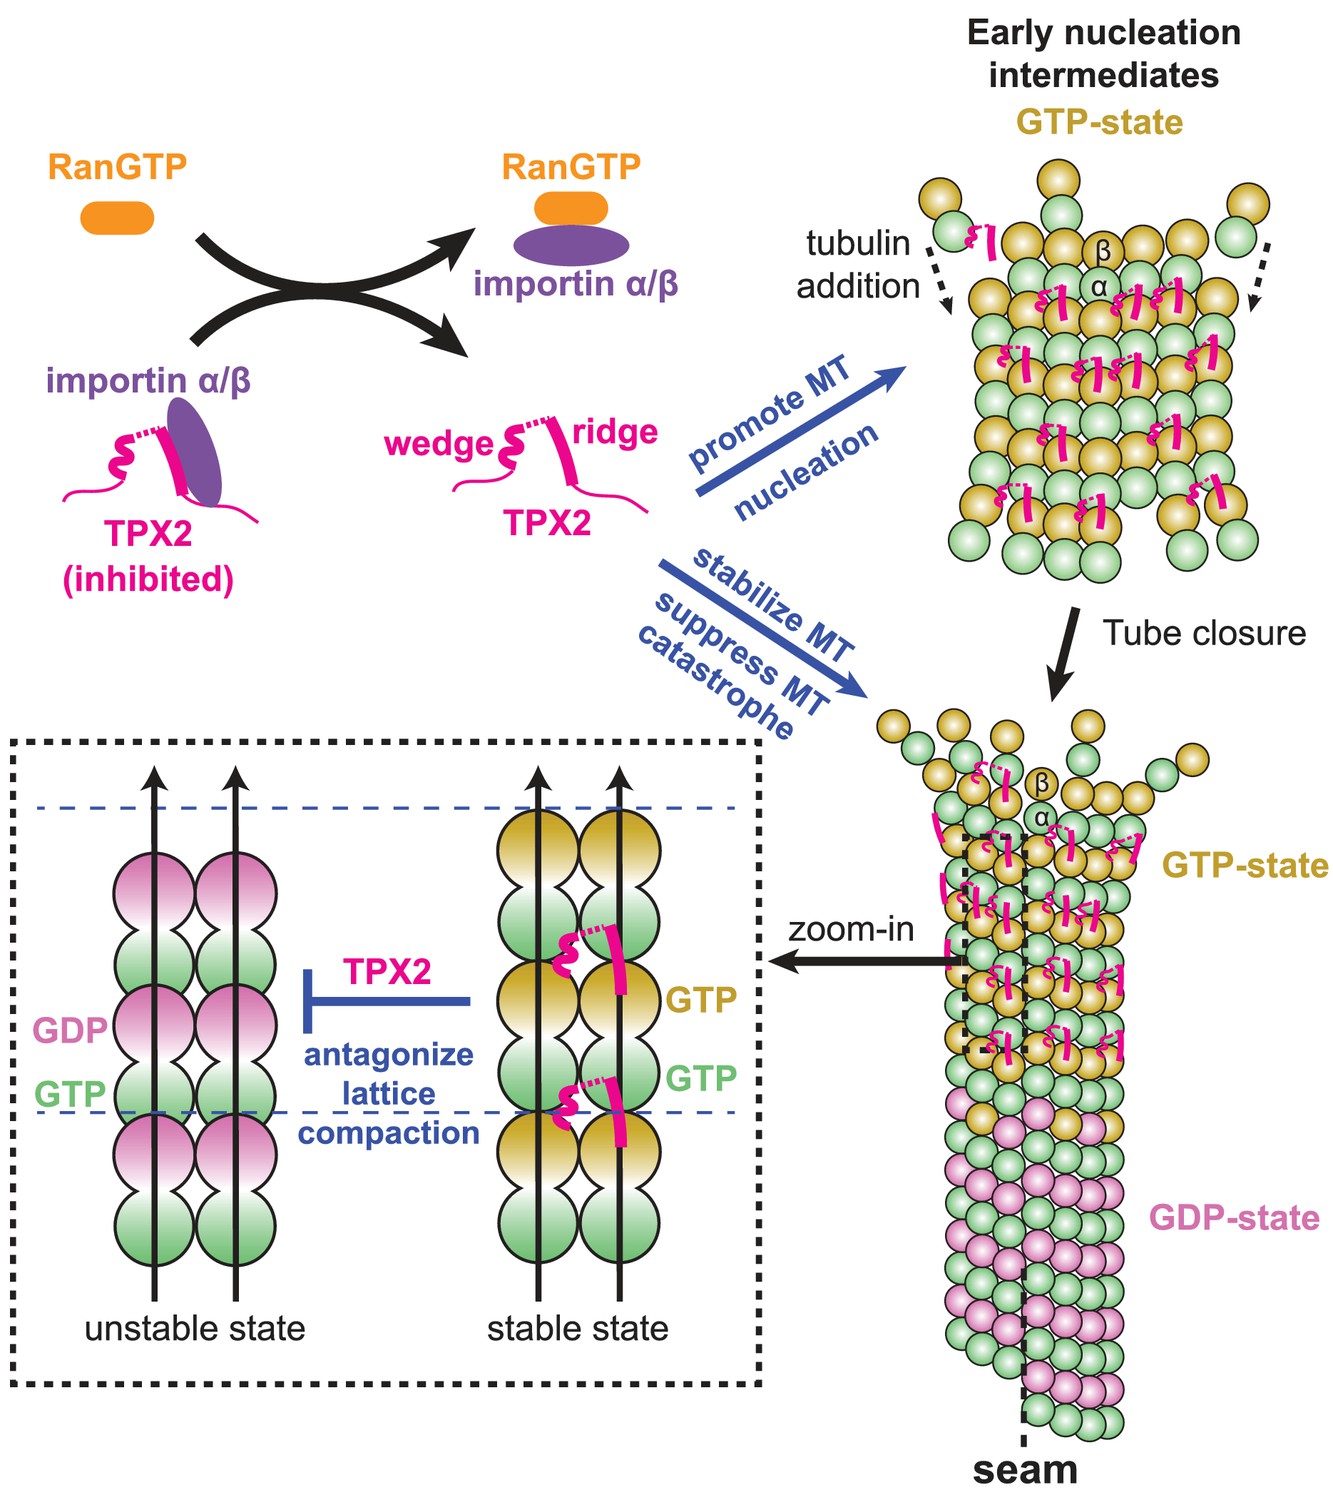
Model for the RanGTP-regulated interaction of TPX2 with tubulin assemblies during MT nucleation and MT growth.
Binding of importins by RanGTP releases the sequestration of structural elements in TPX2 that are involved in interaction with tubulin assemblies at polymerization interfaces. TPX2 then functions to bring together tubulin subunits during MT nucleation and MT growth. The binding of TPX2 at those interfaces is optimal for the GTP-bound, extended MT lattice, and may slow down the GTP hydrolysis process by antagonizing MT lattice compaction.
Figure 6—figure supplement 1
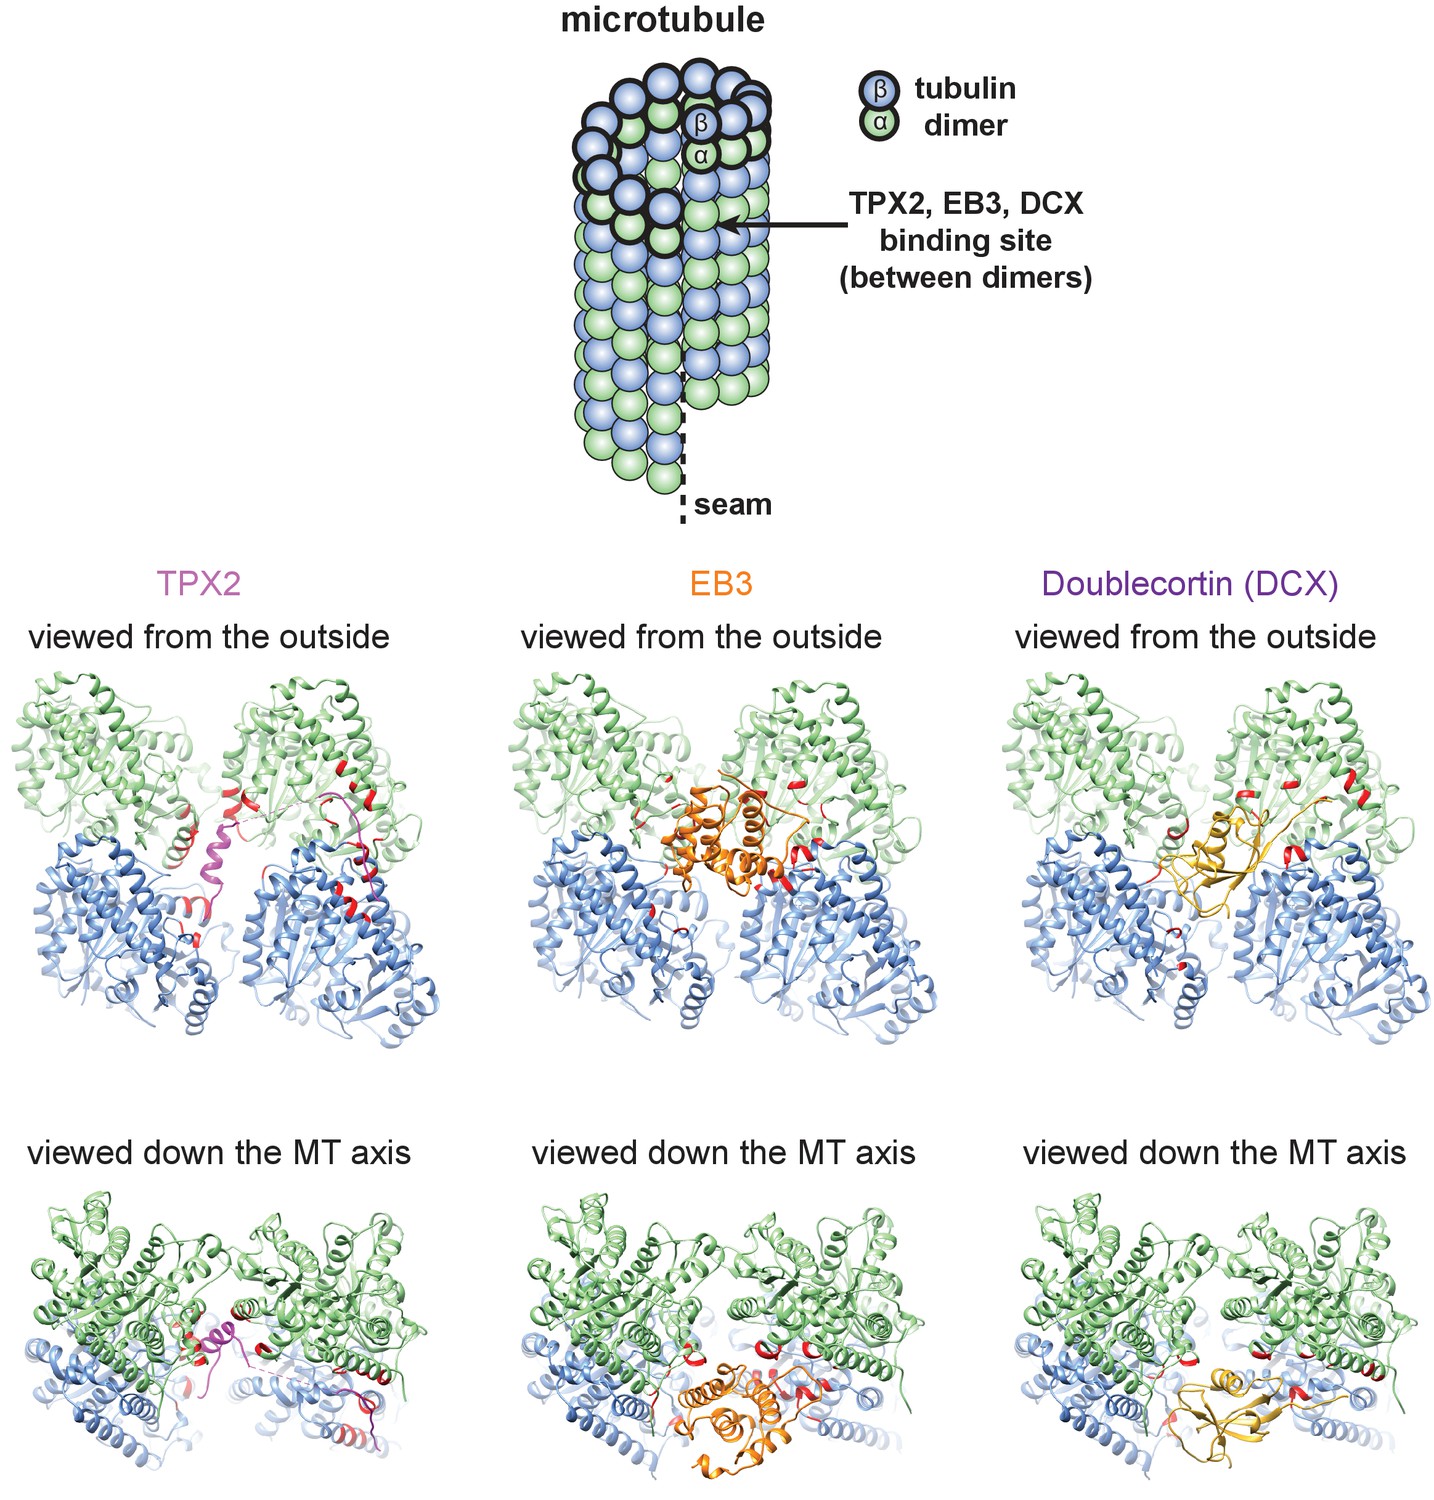
Comparison of the binding sites of TPX2, EB3 and doublecortin (DCX) on MTs.
α-tubulin, β-tubulin, TPX2, EB3 (PDB ID: 3JAK) and DCX (PDB ID: 2XRP) are colored in green, blue, magenta, orange and gold, respectively. Tubulin residues within 4 Å of the MAPs (TPX2, EB3 and DCX) are shown in red.
Additional files
-
Transparent reporting form
- https://doi.org/10.7554/eLife.30959.018
Download links
A two-part list of links to download the article, or parts of the article, in various formats.
Downloads (link to download the article as PDF)
Open citations (links to open the citations from this article in various online reference manager services)
Cite this article (links to download the citations from this article in formats compatible with various reference manager tools)
Structural insight into TPX2-stimulated microtubule assembly
eLife 6:e30959.
https://doi.org/10.7554/eLife.30959


