Otoferlin acts as a Ca2+ sensor for vesicle fusion and vesicle pool replenishment at auditory hair cell ribbon synapses
- Institut Pasteur, France
- UMRS 1120, Institut National de la Santé et de la Recherche Médicale, France
- Sorbonne Universités, UPMC Université Paris 06, Complexité du Vivant, France
- Instituto de Investigaciones en Ingeniería Genética y Biología Molecular, Consejo Nacional de Investigaciones Científicas y Técnicas, Argentina
- Yale University School of Medicine, United States
- Université de Bordeaux, France
- University Paris Descartes, Sorbonne Paris Cité, France
- Ultrapole, Institut Pasteur, France
- Centre National de la Recherche Scientifique, France
- Texas Tech University Health Sciences Center, United States
- Université Clermont Auvergne, France
- UMR 1107, Institut National de la Santé et de la Recherche Médicale, France
- Centre Jean Perrin, France
- Institute of Neurology, University College London, United Kingdom
- Institut de la Vision, France
- Collège de France, France
Figures
Figure 1
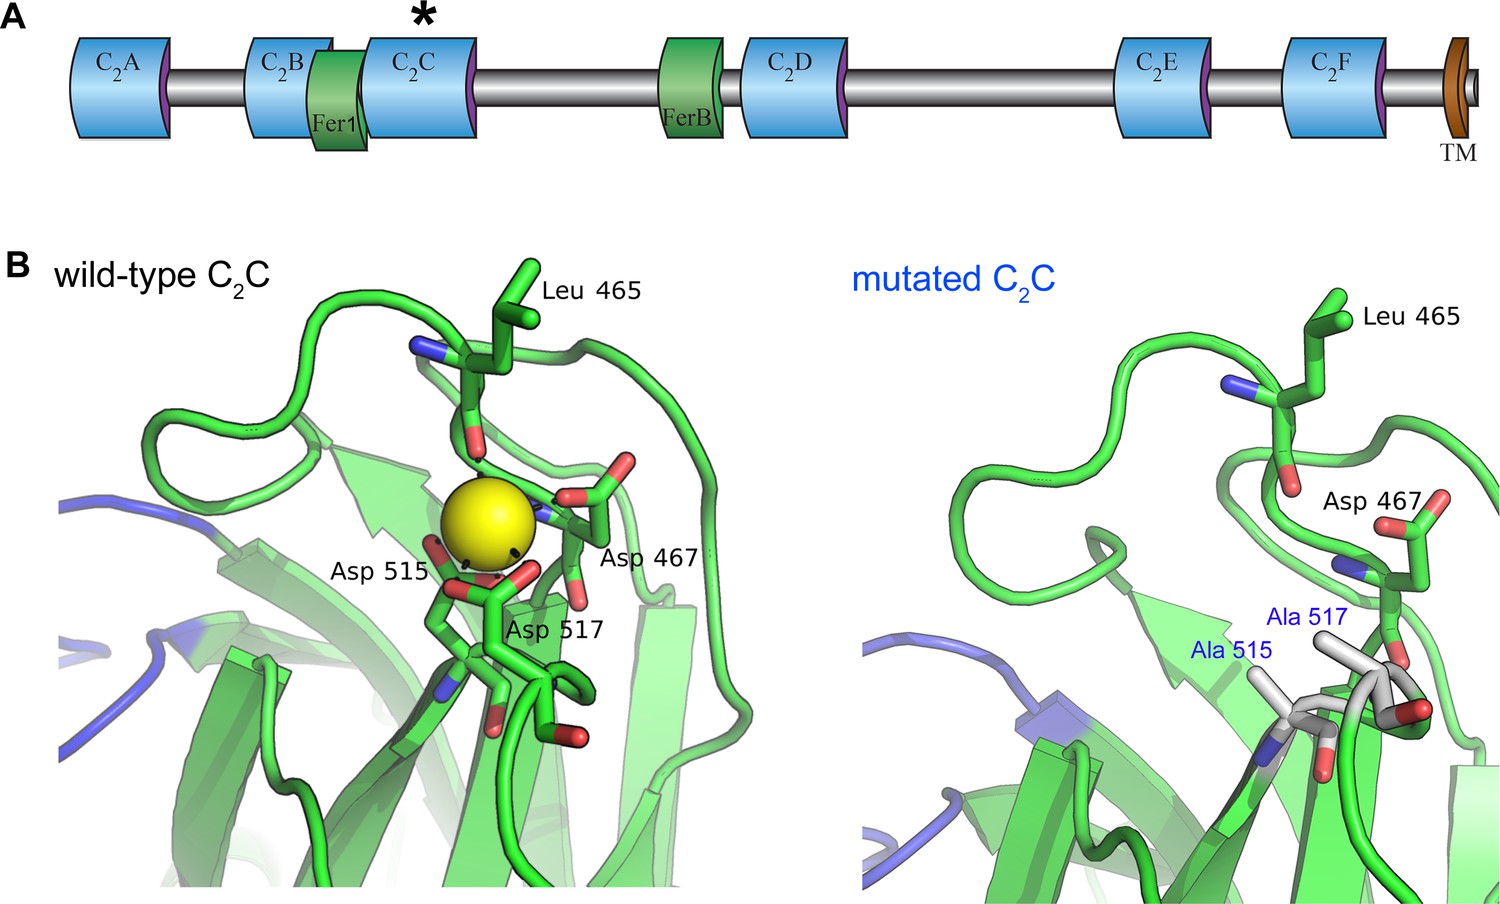
Homology model of the otoferlin C2C domain.
(A) Predicted domain structure of the otoferlin protein. Otoferlin is a transmembrane vesicular protein (1997 amino acids in the mouse) consisting of six C2 domains (C2A-F), one Fer1 domain, and one FerB domain (central domains of still unknown function in proteins of the ferlin family) in its extravesicular (i.e cytoplasmic) portion. The asterisk indicates the C2C domain targeted for mutagenesis. (B) Ten candidate models were calculated with MODELLER (Webb and Sali, 2014), based on the X-ray structure of the human dysferlin C2A domain (4ihb) (Fuson et al., 2014). The primary sequence identity between dysferlin C2A and mouse otoferlin C2C, assuming type II C2 domain topology, is 23%. The model with the lowest energy score was selected for analysis. Further refinement was performed with ModRefiner (Xu and Zhang, 2011) using dysferlin C2A as the structural reference. At least one Ca2+ ion (yellow sphere) could be modeled in the C2C domain of otoferlin. The position and coordination of this ion within the putative divalent cation binding pocket of the homology model was refined by simulating 20 ns of molecular dynamics using NAMD (Phillips et al., 2005).
Figure 2 with 1 supplement

Smaller amplitude of ABR wave-I in Otof C2C/C2C mice.
(A) ABR thresholds of one-month-old Otof C2C/+ (black) and Otof C2C/C2C (blue) mice, for pure tone frequencies between 5 kHz and 32 kHz. (B) Mean ABR trace recorded in Otof C2C/+ (black line, n = 7 mice) and Otof C2C/C2C (blue line, n = 7 mice) mice upon a 95 dB SPL (sound pressure level) pure tone stimulation at 10 kHz. The gray area and the area between the blue dotted lines denote the overlapping 95% confidence intervals of the traces recorded in Otof C2C/+ and Otof C2C/C2C mice, respectively. (C) Detailed view of ABR wave-I from individual ABR recordings in the Otof C2C/C2C mice, used to calculate the mean traces in (B). Each colored trace corresponds to an individual Otof C2C/C2C mouse. The 95% confidence intervals of the mean traces in (B) are shown in gray for Otof C2C/+ mice. (D) Left: ABR thresholds of P16-P21 Otof C2C/+ (black) and Otof C2C/C2C (blue) mice, for pure tone frequencies between 5 kHz and 32 kHz. Right: Plot of the amplitude of ABR wave-I as a function of sound level for a 10 kHz pure tone. (E) Plot of ABR wave-I amplitude against age (sound at 10 kHz and 105 dB SPL; the numbers indicated in parentheses correspond to the number of mice studied at each age). Data information: In (A, D), data are presented as the mean ±SEM. *p<0.05, ***p<0.001, ns not significant (two-way-ANOVA test). In (B), data are presented as the mean and its 95% confidence intervals. In (E), data are presented as the mean ± SEM. **p<0.01, ***p<0.001 (Student's t-test with Welch correction).
Figure 2—figure supplement 1
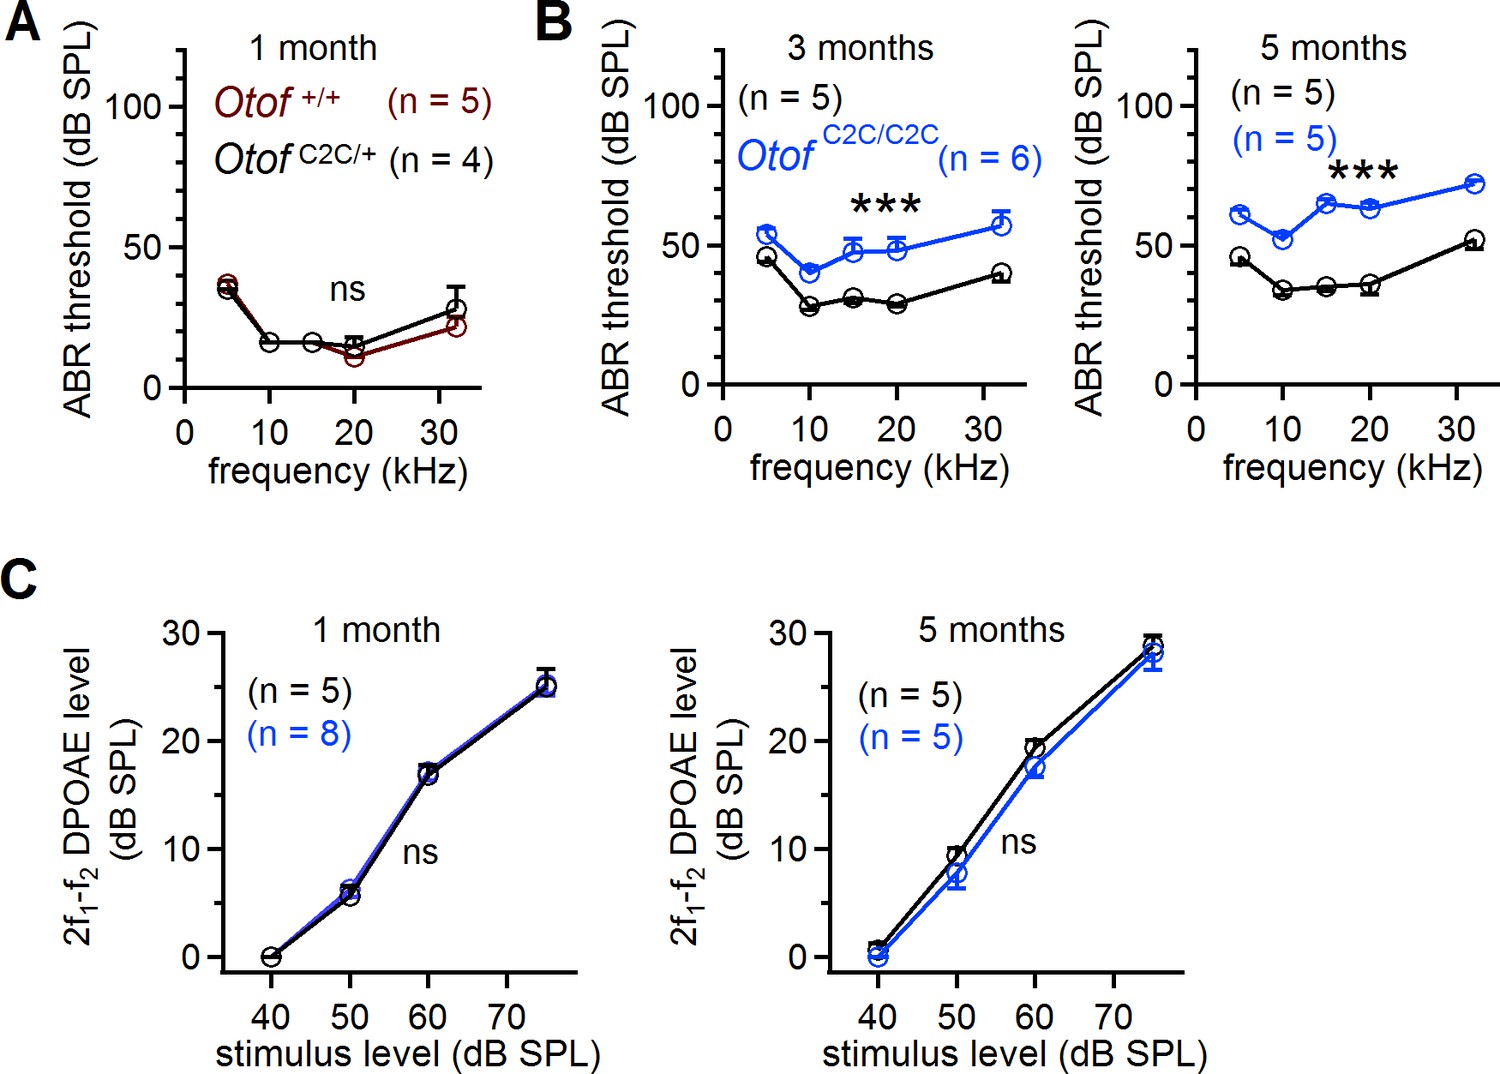
Progressive hearing loss in Otof C2C/C2C mice after one month of age.
(A) ABR thresholds in dB SPL (sound pressure level), for five different pure tone frequencies (5, 10, 15, 20, and 32 kHz), in Otof +/+ (brown) and Otof C2C/+ (black) mice at the age of one month. (B) ABR thresholds in Otof C2C/+ and Otof C2C/C2C (blue) mice aged 3 months and 5 months. (C) 2 f1-f2 DPOAE level recorded for f2 = 10 kHz and f2/f1 = 1.2 in Otof C2C/+ and Otof C2C/C2C mice aged 3 months and 5 months. Data information: In (A), the Otof C2C/+ data is different from the Otof C2C/+ data in Figure 2A. In (A–C), data are presented as the mean ± SEM. ***p<0.001, ns not significant (two-way-ANOVA).
Figure 3 with 2 supplements
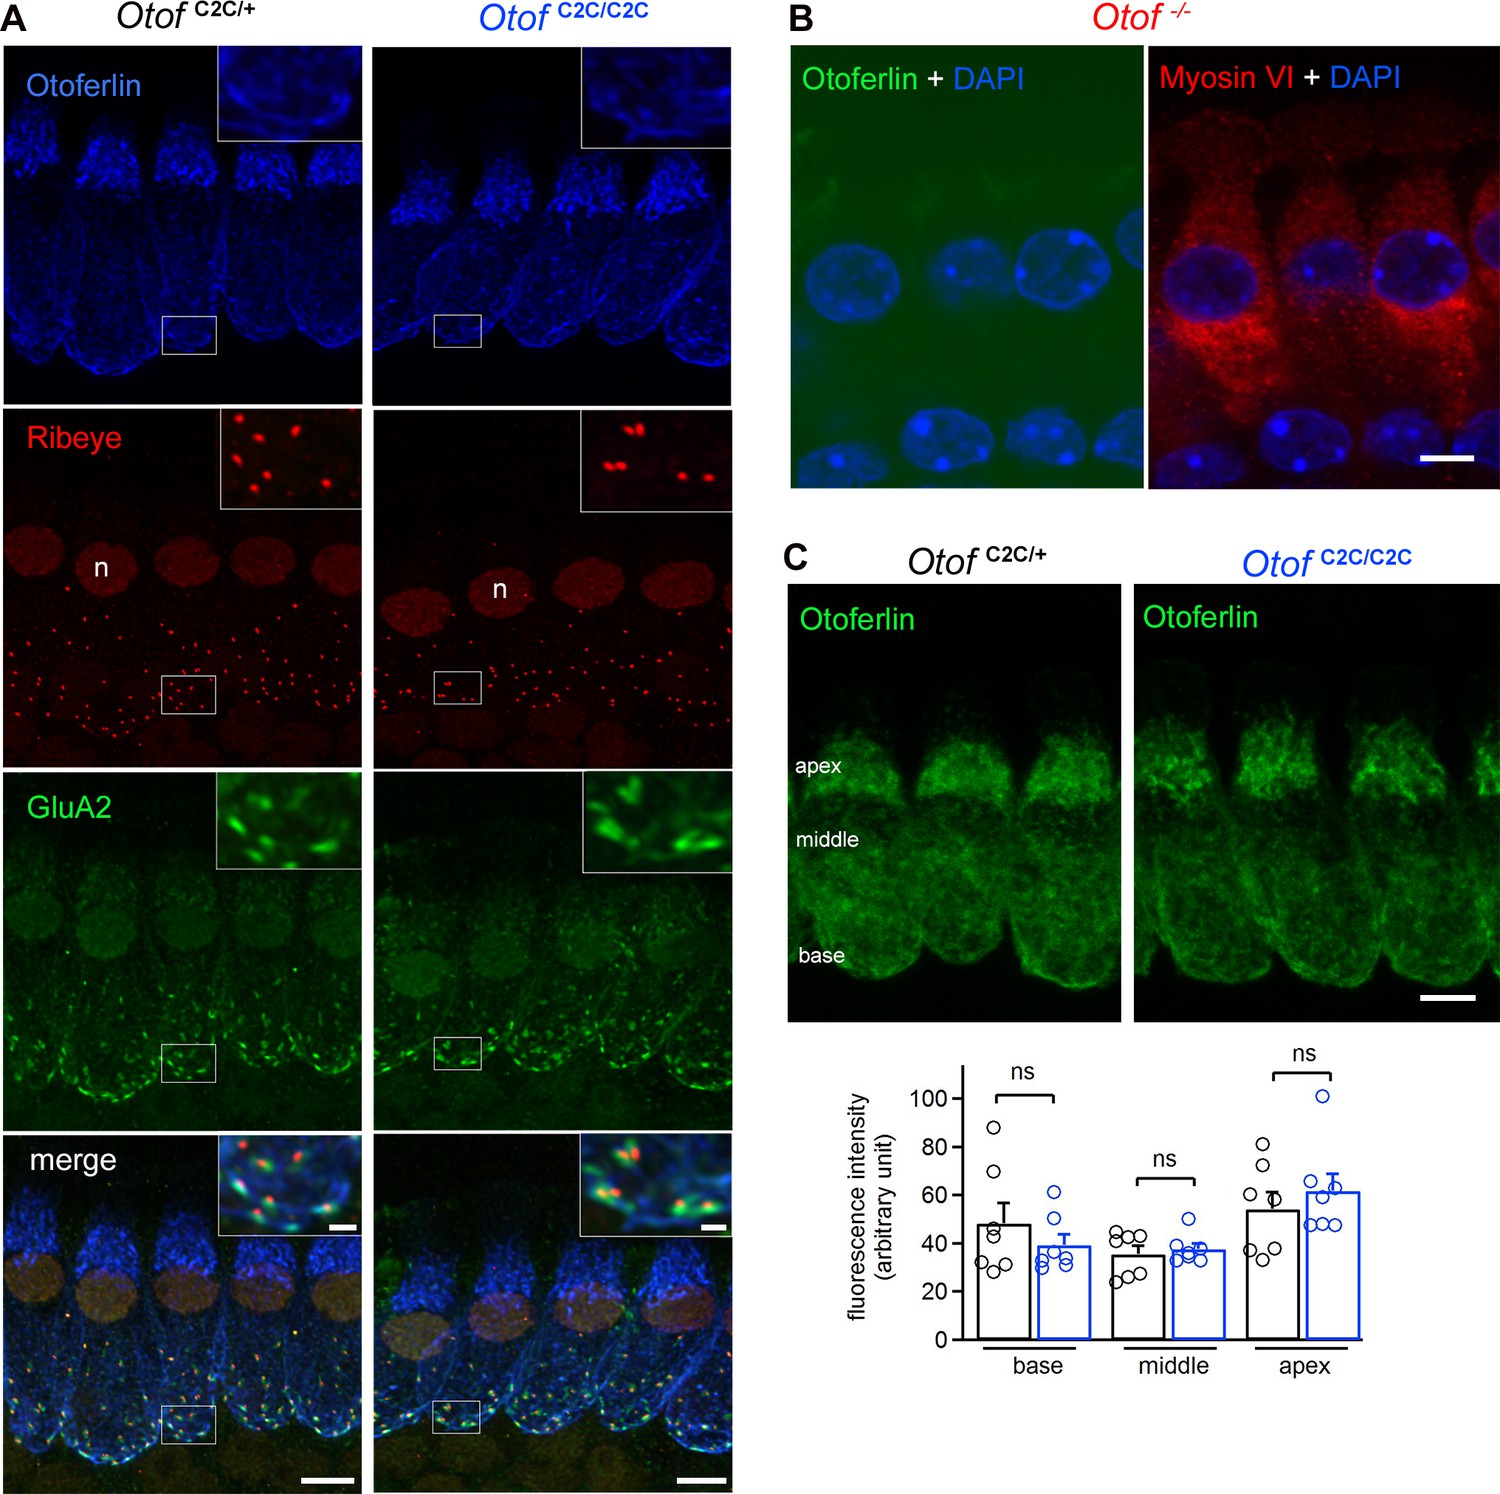
Normal expression and subcellular distribution of otoferlin in Otof C2C/C2C IHCs.
(A) Confocal microscopy images of IHCs from whole-mount preparations of the organ of Corti from P15 Otof C2C/+ and Otof C2C/C2C mice triple-labeled for otoferlin (blue), ribeye (red), and postsynaptic GluA2 receptors (green). Insets: detailed views of the boxed synaptic areas. n: cell nucleus. Scale bar: 5 µm. Inset scale bar: 1 µm. (B) Confocal microscopy image of IHCs from a whole-mount preparation of an organ of Corti from a P15 Otof -/- mouse triple-labeled for otoferlin (green), the hair cell marker myosin VI (red), and the cell nucleus marker DAPI (blue). Note that the luminosity of the green channel (otoferlin) has been enhanced to show the absence of otoferlin expression in Otof -/- mice. Scale bar: 5 µm. (C) Top: Summed projected z-stack confocal microscopy images of IHCs from whole-mount preparations of organs of Corti from P15 Otof C2C/+ and Otof C2C/C2C mice labeled for otoferlin (green). Scale bar: 5 µm. Bottom: Quantification of otoferlin fluorescence in Otof C2C/+ (n = 51 cells in 7 mice) and Otof C2C/C2C IHCs (n = 51 cells from 7 mice) at the apex, middle, and the base of IHCs. Data information: in (C), data are presented as the mean ± SEM. ns, not significant (Student's t-test with Welch correction).
Figure 3—figure supplement 1
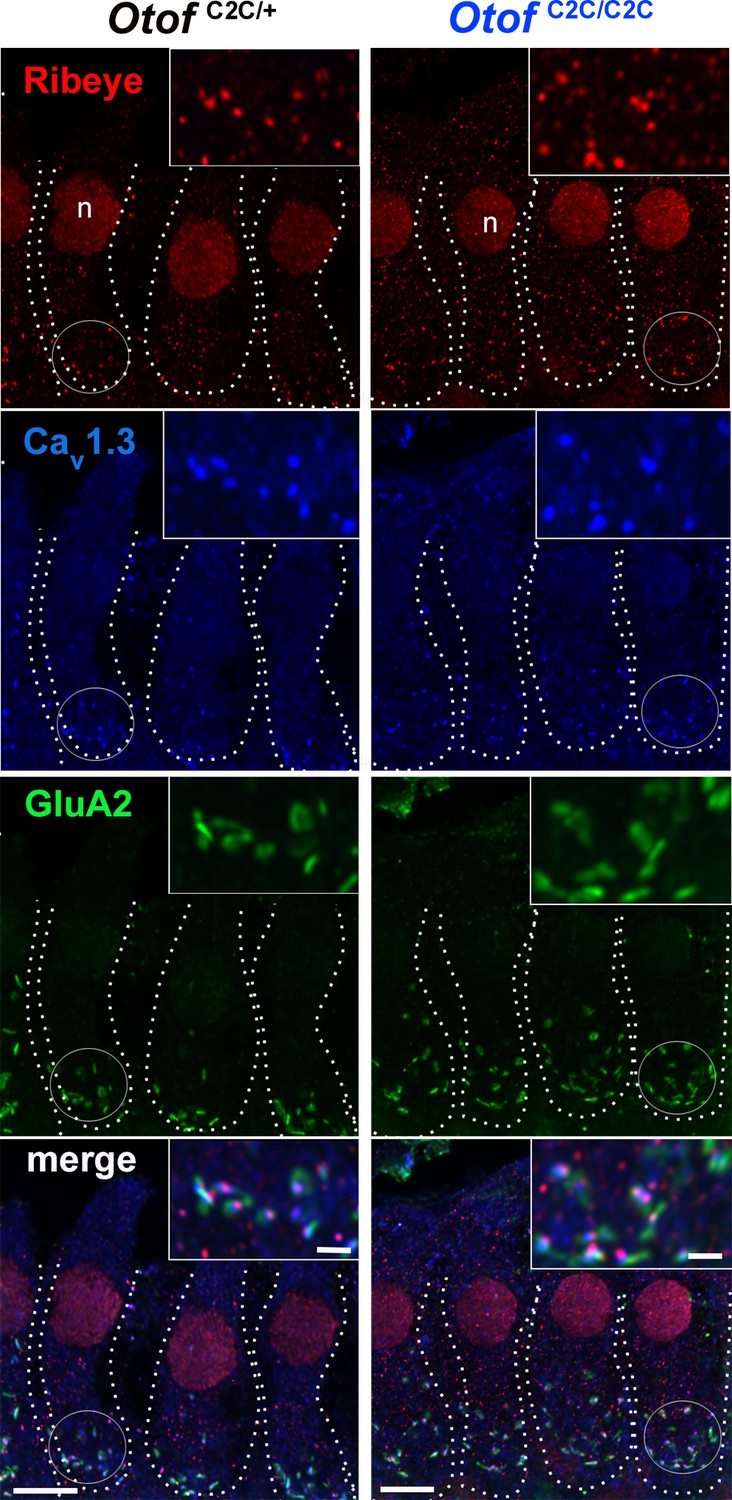
Normal number of ribbon synapses in Otof C2C/C2C IHCs.
Confocal microscopy images of IHCs from whole-mount preparations of the P15 organ of Corti, triple-labeled for the synaptic ribbon protein ribeye (red), presynaptic Cav1.3 L-type Ca2+ channels (blue), and postsynaptic GluA2 glutamate receptors (green), in Otof C2C/+ and Otof C2C/C2C mice. The Cav1.3 labeling overlaps with the ribeye labeling. The cell contours are indicated by dotted lines. n: cell nucleus. Scale bars: 5 µm. Insets: detailed views of the circled synaptic areas. Inset scale bars: 1 µm.
Figure 3—figure supplement 2
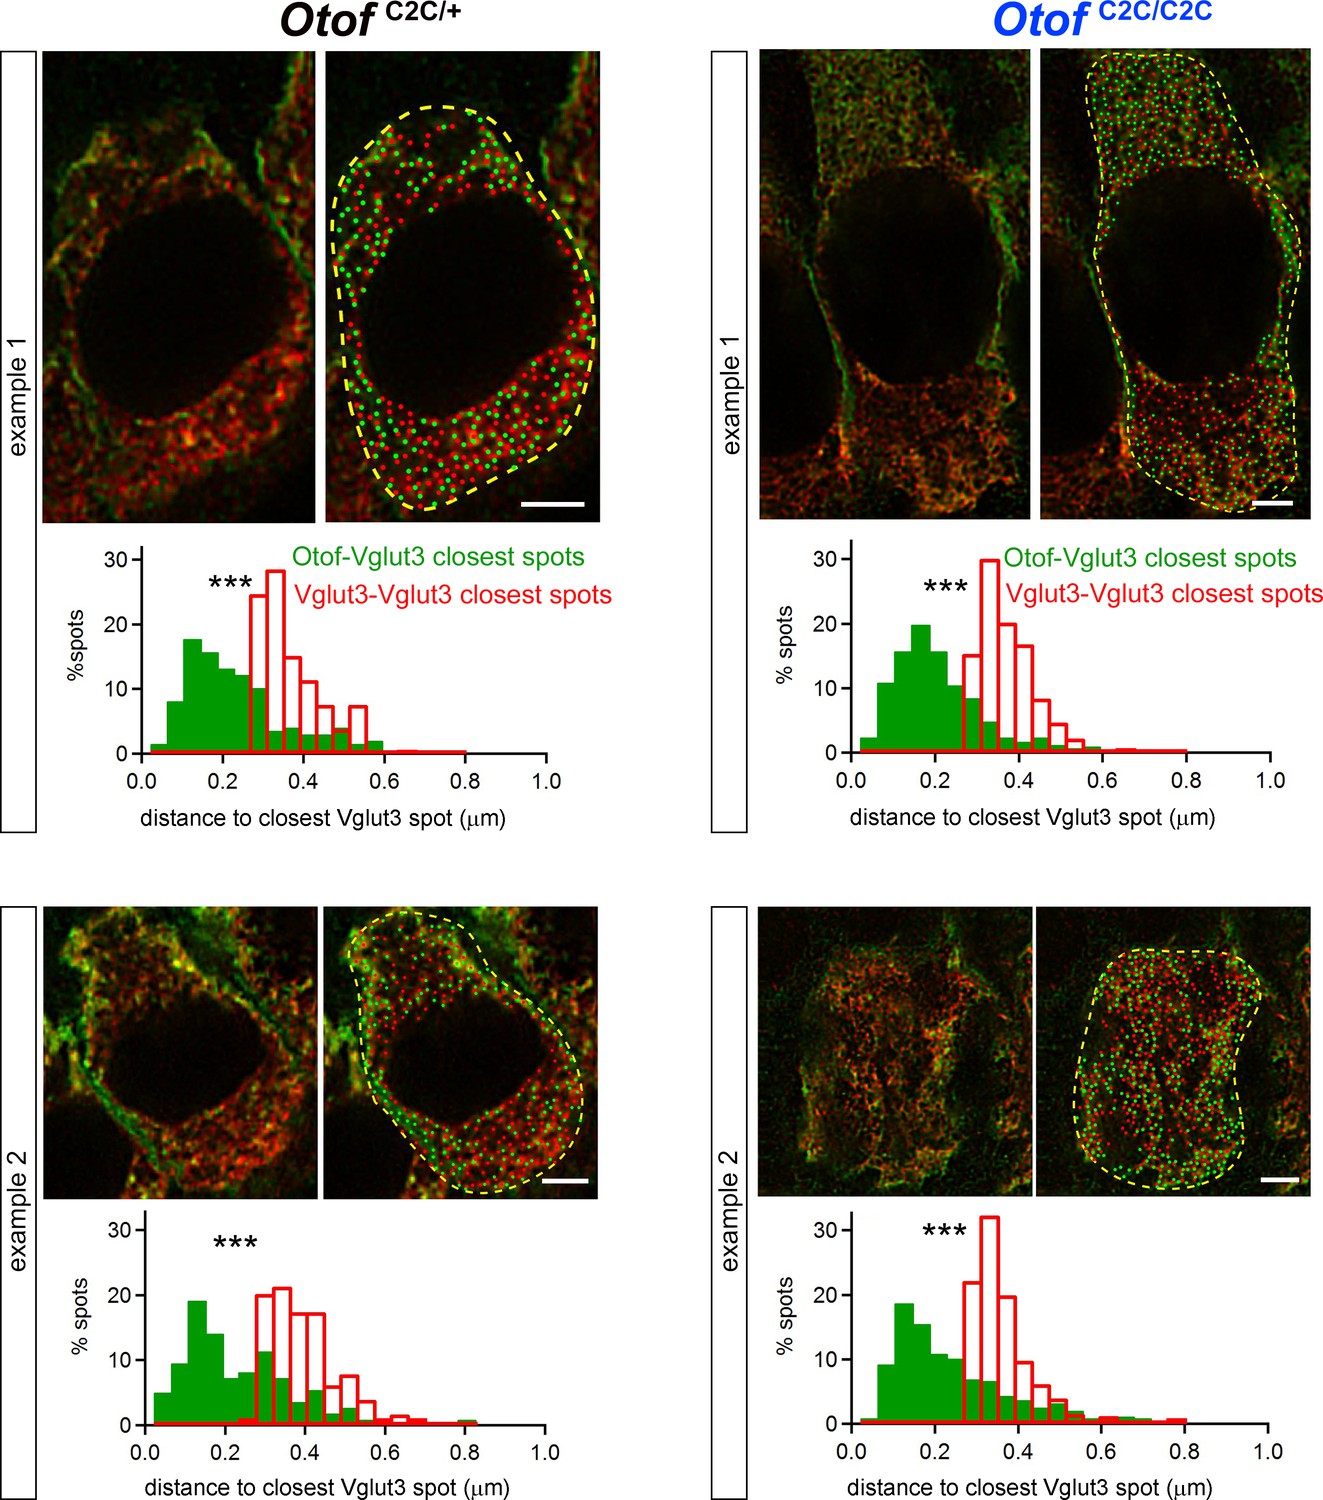
Normal colocalization of otoferlin and Vglut3 in Otof C2C/C2C IHCs.
Analysis of two representative STED images of individual IHCs from whole-mount preparations of organs of Corti from a P15 Otof C2C/+ mouse (left panels) and a P15 Otof C2C/C2C mouse (right panels) double-labeled for otoferlin (green) and Vglut3 (red). For each example, the STED image (top left), the STED image superimposed on the resolution-limited spots representing structures stained for otoferlin and Vglut3 (top right), and the corresponding distributions of nearest neighbor distances from otoferlin spots to the closest Vglut3 spots and from Vglut3 spots to the closest Vglut3 spots (bottom) are shown. Data information: Images are shown after demixing of the Atto565- and the DY485-channel images. The numbers of Vglut3 and otoferlin spots were similar in each example IHC, ***p<0.001 (Kolmogorov-Smirnov test).
Figure 4 with 2 supplements
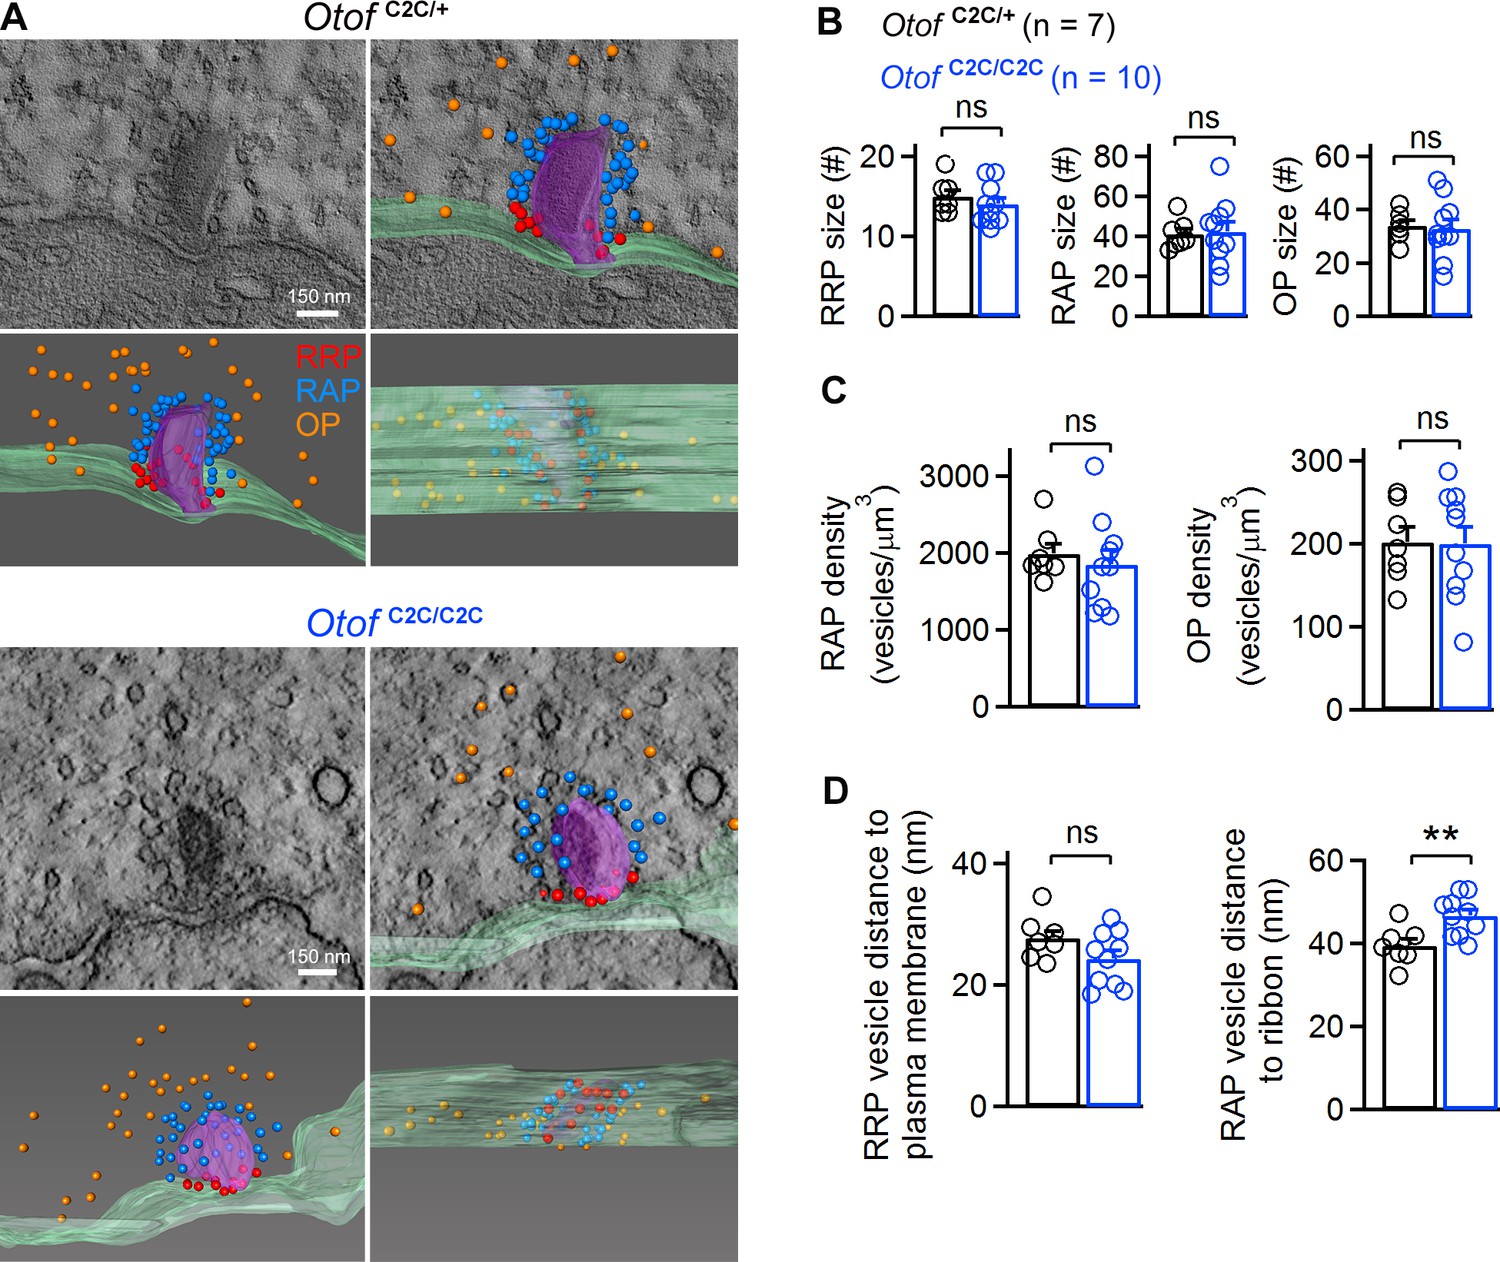
Ultrastructural analysis of the different vesicle pools in Otof C2C/C2C IHC ribbon synapses.
(A) Representative transmission electron micrographs of ribbon synapses from an Otof C2C/+ IHC (upper panels) and an Otof C2C/C2C IHC (lower panels). Side views of the electron tomographic reconstruction of Otof C2C/+ and Otof C2C/C2C ribbon synapses are overlaid on the 3D tomograms. Renderings show the presynaptic plasma membrane (green) relative to the ribbon (purple), vesicles of the presumptive readily-releasable pool (RRP) in red, of the ribbon-associated pool (RAP) in blue, and of the outlying pool (OP) in orange. The ribbon was made semitransparent for visualization of its 3D shape and of the vesicles behind it. (B) Mean numbers of vesicles in the RRP, RAP, and OP of reconstructed Otof C2C/+ (n = 7) and Otof C2C/C2C (n = 10) ribbon synapses. (C) Mean vesicle densities in the RAP and OP of reconstructed Otof C2C/+ (n = 7) and Otof C2C/C2C (n = 10) ribbon synapses. (D) Mean Euclidean distance from RRP vesicle centers to the plasma membrane and from RAP vesicle centers to the ribbon in reconstructed Otof C2C/+ (n = 7) and Otof C2C/C2C (n = 10) ribbon synapses. Data information: In (B–D), data are presented as the mean ± SEM. **p<0.01, ns not significant (Student's t-test with Welch correction).
Figure 4—video 1
Example of a ribbon synapse from an Otof C2C/+ mouse reconstructed by electron tomography
https://doi.org/10.7554/eLife.31013.009
Figure 4—video 2
Example of a ribbon synapse from an Otof C2C/C2C mouse reconstructed by electron tomography
https://doi.org/10.7554/eLife.31013.010
Figure 5 with 1 supplement

Ca2+-dependence of the RRP vesicle fusion defect in Otof C2C/C2C IHCs.
(A1) Protocol used to depolarize IHCs from −95 mV to potentials between −65 to +35 mV (top). Examples of Ca2+ currents (ICa) (middle) and corresponding Cm traces (bottom) for P15-P18 Otof C2C/+ and Otof C2C/C2C IHCs after 20 ms of depolarization to −10 mV. (A2) Mean Ca2+ current amplitudes (ICa) (top) and ΔCm (bottom) for P15-P18 Otof C2C/+ and Otof C2C/C2C IHCs after 20 ms of depolarization to potentials between −65 mV to +35 mV. The vertical dashed line indicates the −30 mV voltage point. (A3) Mean ΔCm values plotted against the Ca2+ currents elicited by depolarizing steps to potentials underlying the falling segment of the ICa/Vm curve (−65 mV to −10 mV), corresponding to increasing Ca2+ currents. The vertical dashed line indicates the −30 mV voltage point. The Otof C2C/+ and Otof C2C/C2C ΔCm data were fitted with a power function, yielding an exponent of 0.94 and 0.83, respectively. (B1) Protocol used to depolarize IHCs from −95 mV to −10 mV for voltage steps of different durations from 2 ms to 50 ms (top). Corresponding example Cm traces from P15-P18 Otof C2C/+ and Otof C2C/C2C IHCs (bottom). The example traces for each genotype come from the same patch-clamped IHC. (B2) Kinetics of Ca2+-dependent exocytosis in P15-P18 Otof C2C/+ and Otof C2C/C2C IHCs for voltage steps of 2 ms to 50 ms. Mean ΔCm is plotted against the duration of the depolarization to −10 mV (Δt). The inset shows the detail for Δt values between 2 ms and 10 ms. For the 2 ms and 5 ms depolarizations, five repetitions of the recordings were averaged, to increase the signal-to-noise ratio. The decrease in Ca2+-sensitivity of RRP vesicle fusion was evaluated by fitting the ΔCm versus Δt plots with a line for Δt between 2 and 10 ms in Otof C2C/+ IHCs and for Δt between 2 and 20 ms in Otof C2C/C2C IHCs. The Otof C2C/+ fit was plotted for durations greater than 10 ms, to illustrate the onset of the second component of release corresponding to the initiation of vesicle pool replenishment. (B3) We evaluated the coupling of voltage-gated Ca2+ channels to RRP vesicles, by setting the intracellular EGTA concentration to 5 mM in Otof C2C/+ IHCs (gray, n = 9) and in Otof C2C/C2C IHCs (light blue, n = 10). The data for an intracellular EGTA concentration of 0.5 mM are as in (B2). (C1) Protocol used to depolarize IHCs from −95 mV to −10 mV for 20 ms with different extracellular Ca2+ concentrations (top). Example Cm traces from P15-P18 Otof C2C/+ and Otof C2C/C2C IHCs for different extracellular Ca2+ concentrations (bottom). Each example Cm trace for a given genotype was obtained from a different IHC. (C2) ΔCm values plotted against the Ca2+ currents elicited at different extracellular Ca2+ concentrations ([Ca2+]e) in Otof C2C/+ and Otof C2C/C2C P15-P18 IHCs. Dashed lines show linear fits to the data. Data information: In (A2, B2–B3), data are presented as the mean ± SEM. ***p<0.001, ns not significant (two-way-ANOVA). In (B2, inset), *p<0.05 (Student's t-test with Welch correction). In A1, example Ca2+ traces are corrected for linear leak conductance, leading to a subtraction of the sinusoidal signal. In (A1, B1, C1), the raw Cm traces are shown.
Figure 5—figure supplement 1
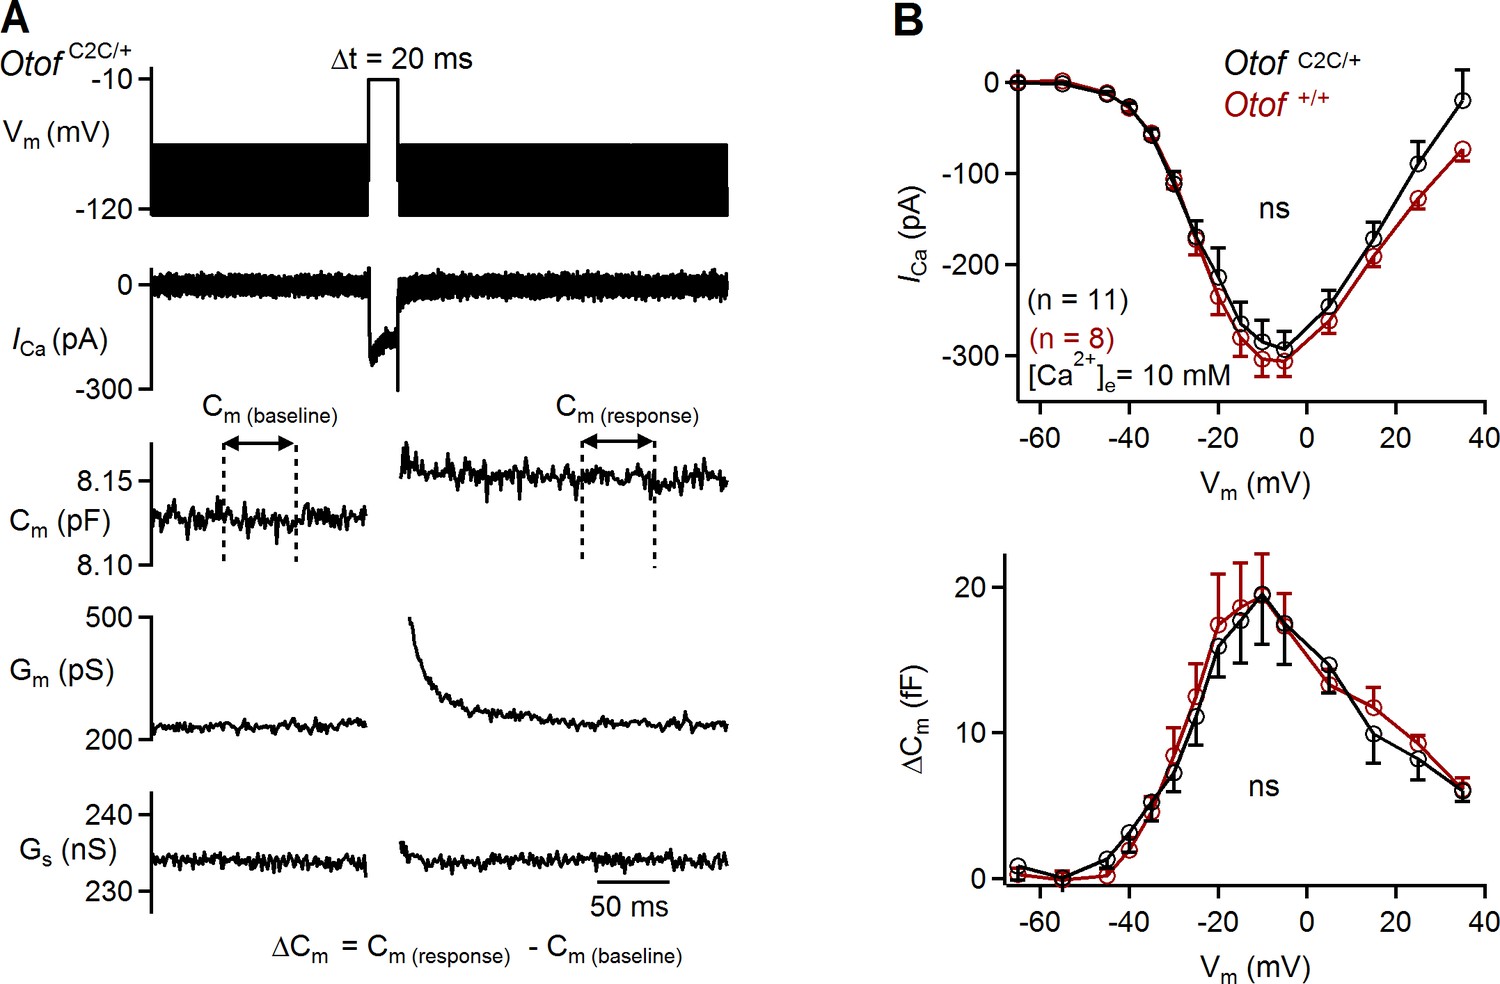
Ca2+-dependence of RRP vesicle fusion is normal in Otof C2C/+ IHCs.
(A) Example of Ca2+ current (ICa) and corresponding Cm, membrane conductance (Gm), and series conductance (Gs) traces recorded in a P15 Otof C2C/+ IHC after 20 ms of depolarization to −10 mV (same example as in Figure 5A1). The way in which the ΔCm evoked by membrane depolarization was measured throughout the article is illustrated for the Cm trace. (B) Mean Ca2+ current amplitudes (ICa) (top) and ΔCm (bottom) for P15-P18 Otof +/+ and Otof C2C/+ IHCs after 20 ms of depolarization to potentials between −65 mV to +35 mV. The Otof C2C/+ data are the same as in Figure 5A2. Data information: In (A), example Ca2+ traces are corrected for the linear leak conductance, leading to a subtraction of the sinusoidal signal. The raw Cm, Gm, and Gs traces are shown. In (B), data are presented as the mean ± SEM. ns not significant (two-way-ANOVA).
Figure 6
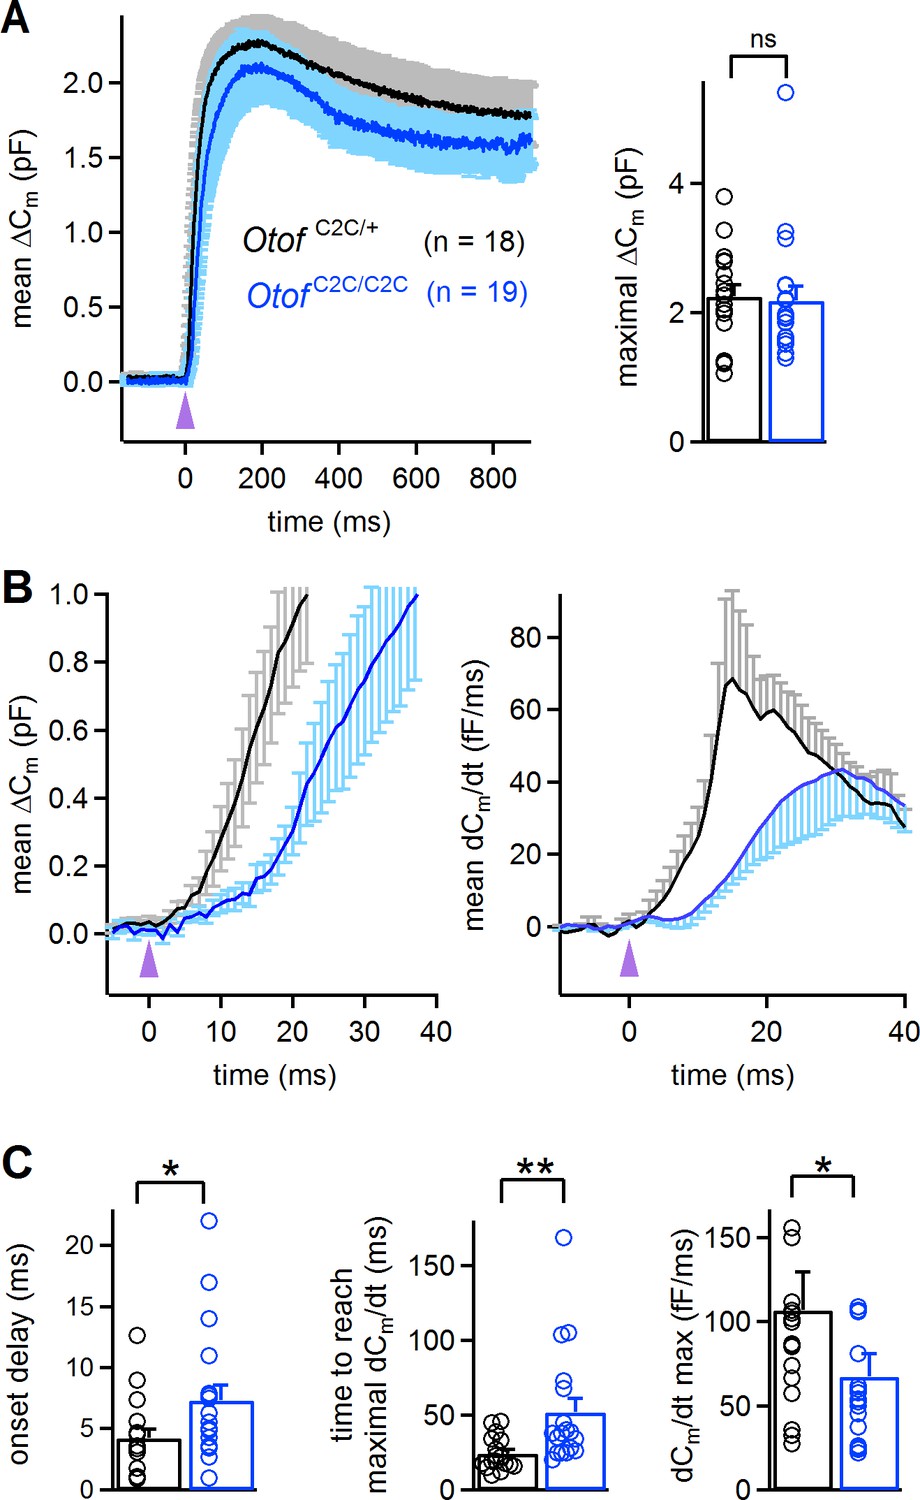
Abnormal kinetics of exocytosis evoked by intracellular Ca2+ uncaging in Otof C2C/C2C IHCs.
(A) Left: Mean ΔCm response curves in P14-P16 Otof C2C/+ and Otof C2C/C2C IHCs after a single UV flash (purple arrowhead) uncaging intracellular Ca2+. Right: Bar graph showing mean and individual maximal ΔCm values. (B) Left: Close-up of the wave shown in A, focusing on the first 40 ms after the UV flash (purple arrowhead). Right: Mean time derivative of the Cm response curves in the first 40 ms following the UV flash. (C) Bar graphs of the mean and individual onset delay of the ΔCm (left), time taken to reach the maximal release rate (middle), and time derivative of release (right) in Otof C2C/+ (n = 18) and Otof C2C/C2C (n = 19) IHCs. Data information: in (A–C), data are presented as the mean ± SEM. *p<0.05, **p<0.01, ns not significant (Mann-Whitney test).
Figure 7

Reduced Ca2+-sensitivity of exocytosis in Otof C2C/C2C IHCs.
(A) Mean ΔCm response curves (top) and normalized exocytosis rates (dCm/dt) (bottom), with mean intracellular fluorescent Ca2 signals of OGB-5N (green traces) recorded simultaneously after Ca2+ uncaging (purple arrowhead) in P14-P16 Otof C2C/+ (in black) and Otof C2C/C2C (in blue) IHCs. (B) Left: For each recorded Otof C2C/+ (in black) and Otof C2C/C2C (in blue) IHC, the rate of exocytosis was plotted as a function of [Ca2+]i, and each data set was fitted with a Hill function y = Vmax.xn /(EC50n + xn). Right: Mean cooperativity and Ca2+-affinity of release in Otof C2C/+ and Otof C2C/C2C IHCs. Note that for 3 out of 6 Otof C2C/C2C IHCs, the fit of the sigmoidal Hill function to the data was only partial. For those IHCs, the Ca2+ affinity was estimated as the value of [Ca2+] for which dCm/dt = 0.5, rather than the EC50 of the fitted Hill function, which was larger. Data information: in (B), one IHC of each genotype was removed because of the lack of experimental points for a reliable fitting with a Hill function. In (A–B), data are presented as the mean ± SEM. **p<0.01, ns not significant (Mann-Whitney test).
Figure 8 with 1 supplement
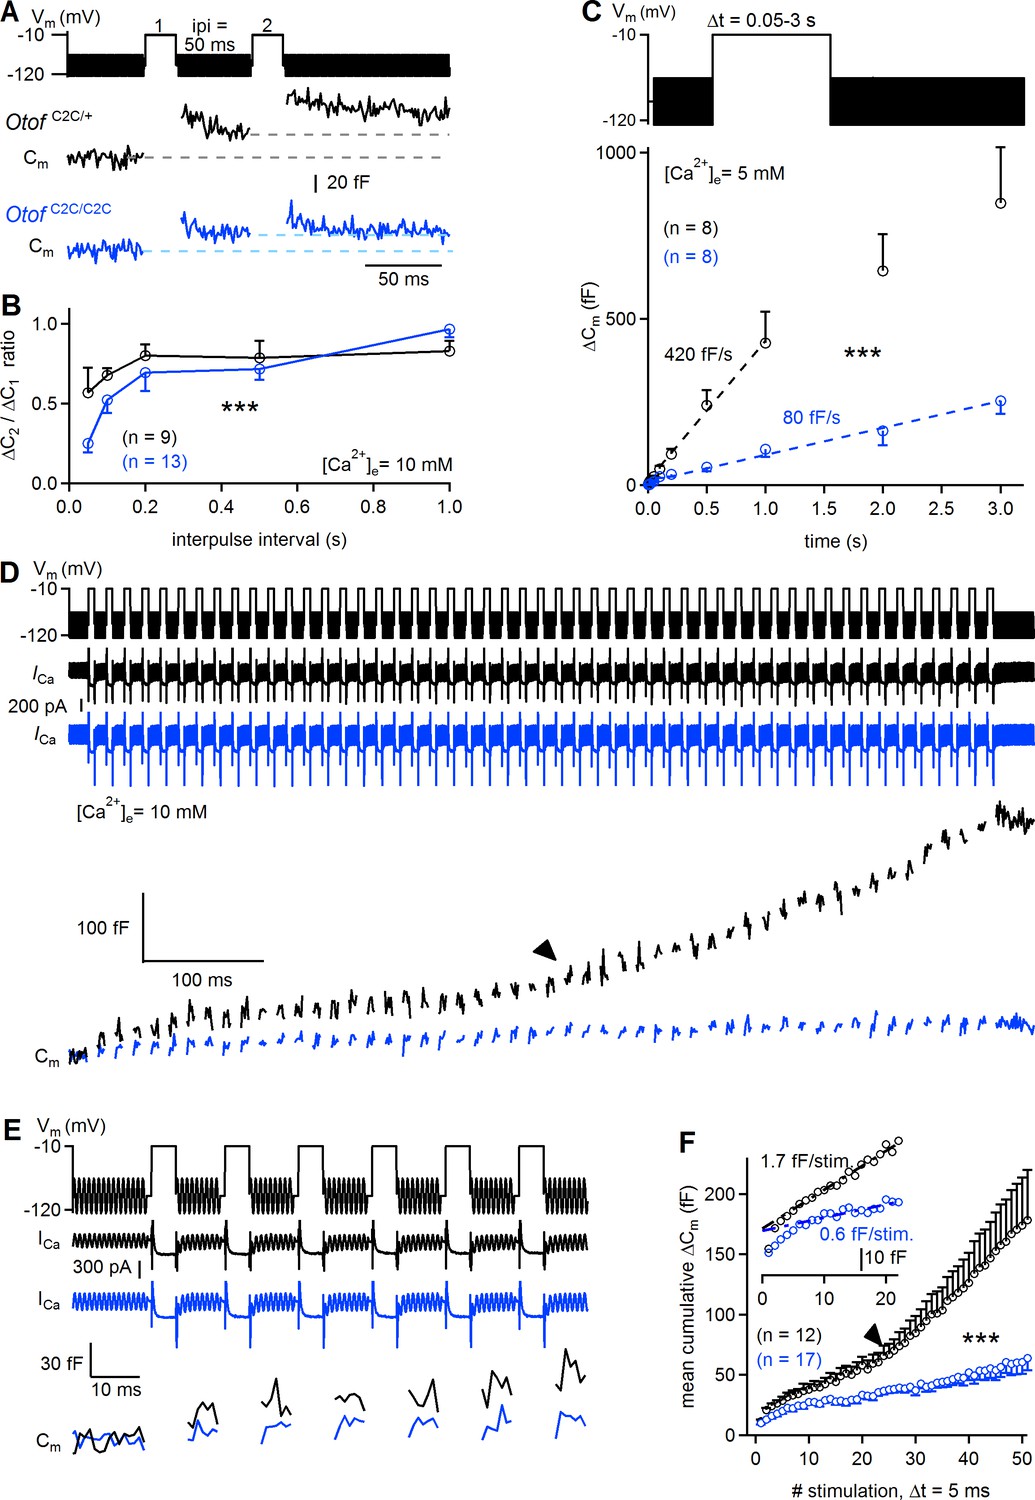
Reduced sustained release in Otof C2C/C2C IHCs.
(A) Paired-pulse stimulation protocol, showing two consecutive 20 ms depolarizations from a holding potential of −95 mV to −10 mV (top), and example Cm traces from Otof C2C/+ and Otof C2C/C2C IHCs (bottom). (B) Mean ΔCm ratio for the second depolarization relative to the first depolarization (ΔC2/ΔC1) as a function of interpulse interval (ipi = 50, 100, 200, 500, and 1000 ms), for P15-P18 Otof C2C/+ and Otof C2C/C2C IHCs. (C) Kinetics of Ca2+-dependent exocytosis for single depolarizations to −10 mV lasting between 50 ms and 3 s in P15-P18 IHCs. Mean ΔCm values are plotted as a function of depolarization duration (Δt), together with linear fits for Otof C2C/+ IHCs and Otof C2C/C2C IHCs. These recordings were carried out with an extracellular solution containing 5 mM Ca2+. (D) Protocol used to elicit a train of 50 successive short depolarizations (duration 5 ms, interpulse interval 10 ms) to −10 mV (top). Example ICa (middle) and corresponding Cm traces (bottom) in Otof C2C/+ and Otof C2C/C2C IHCs. Note the transition between the linear and superlinear components of release for the Otof C2C/+ IHC (arrowhead). (E) Expanded view of the first 100 ms in D. (F) Plots of mean cumulative ΔCm as a function of stimulus number in response to the train of 50 successive short depolarizations in Otof C2C/+ and Otof C2C/C2C P15-P18 IHCs. For each depolarization, ΔCm was evaluated in this particular case by averaging only the last 3 ms of the Cm values of each interstimulus interval to prevent contamination by the initial peaks. Note the transition from the linear component to a superlinear component of release for Otof C2C/+ IHCs (arrowhead). The inset is a magnification of the first 20 depolarizations, with linear fits to ΔCm during successive depolarizations for Otof C2C/+ and Otof C2C/C2C IHCs. Data information: in (B–C, F), data are presented as the mean ± SEM. ***p<0.001 (two-way-ANOVA). In (A, D, E) raw Cm traces are shown. In (D, E) the Cm transient change following each depolarization has been blanked for the sake of clarity. In (D), the example ICa traces were not corrected for the linear leak conductance, leaving the sinusoidal ICa component apparent.
Figure 8—figure supplement 1
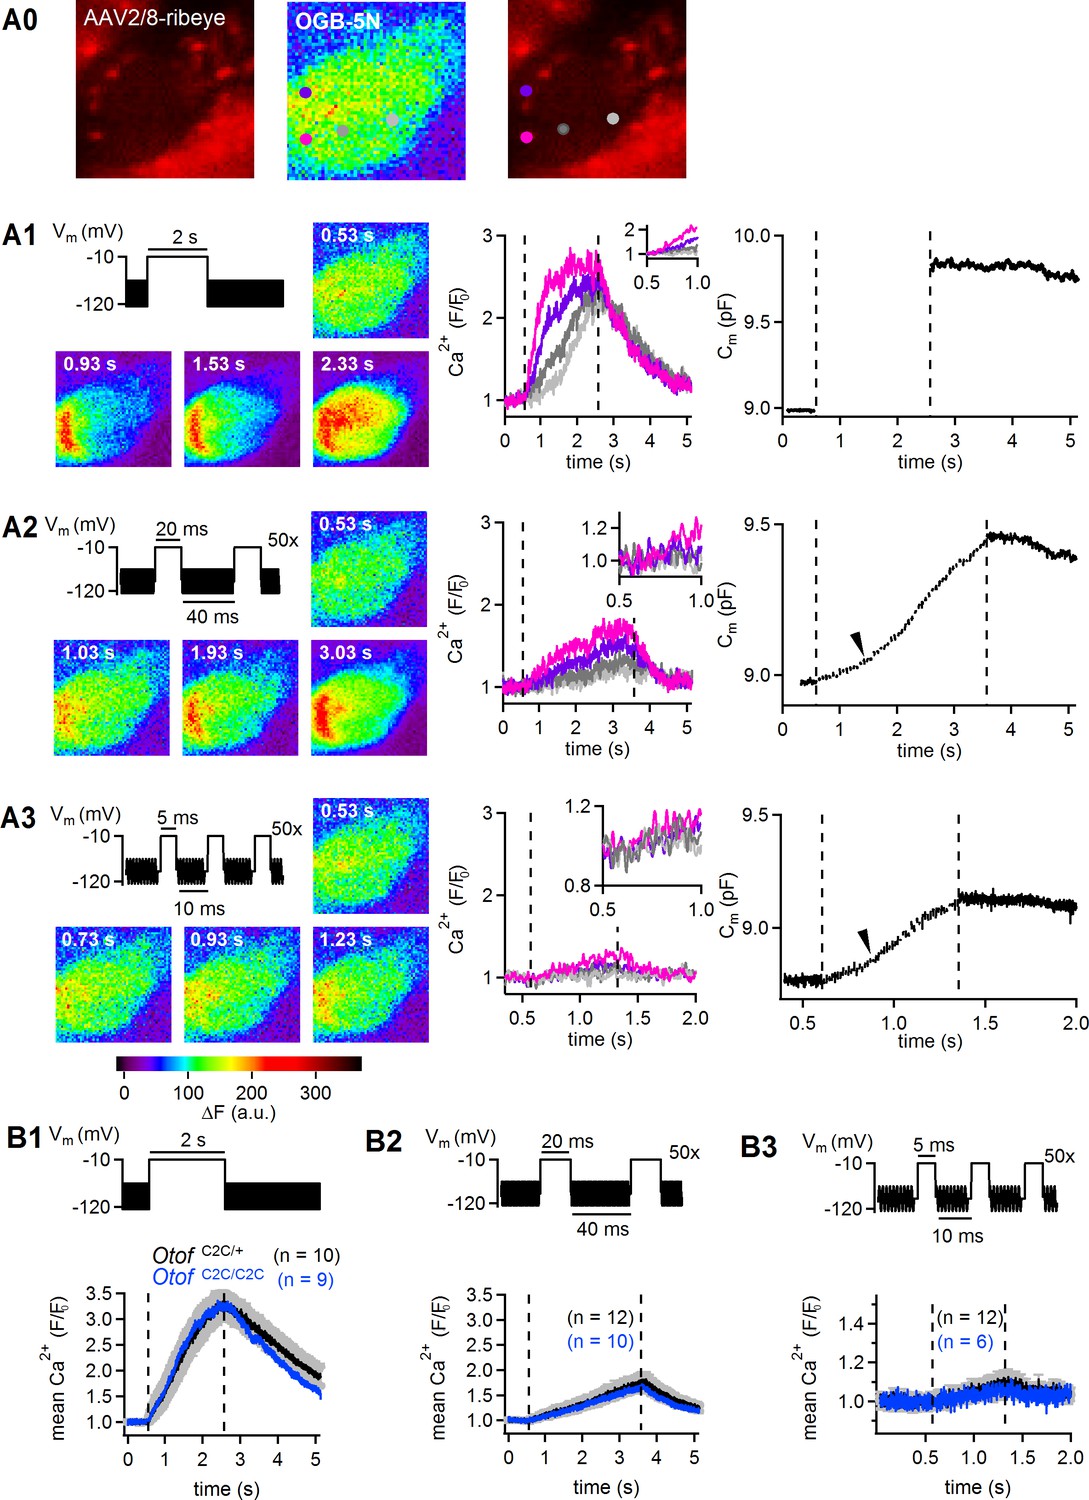
Normal Ca2+ entry, assessed by high-speed two-dimensional Ca2+ imaging, in Otof C2C/C2C IHCs.
(A0) Left: transverse section of an IHC from a P15 wild-type mouse transduced on P3 with an AAV2/8 viral vector expressing mCherry-conjugated ribeye-A to render the synaptic ribbons visible (red channel). Middle panel: the IHC was loaded with OGB-5N, using a patch pipette in the whole-cell configuration. Right: the four regions selected for fluorescence measurements (as a readout of local Ca2+ concentration) by high-speed swept-field confocal microscopy are indicated by spots of different colors. The pink and violet spots are located at a synaptic ribbon. The dark and light gray spots are located away from the basolateral membrane and do not overlap with a ribbon. (A1) After depolarization for 2 s, a massive Ca2+ wave diffused into the cytoplasm, reaching locations far from the synaptic release sites, as previously reported (Schnee et al., 2011b). The OGB-5N signal reflecting Ca2+ entry at the ribbon spots was saturated by such long depolarizations. Left: color-coded fluorescence images of an IHC loaded with OGB-5N before the depolarizing protocol (0.53 s time point) and during a 2 s depolarization to −10 mV (0.93 s, 1.53 s, 2.33 s time points) from a holding potential of −95 mV. Middle and right: the corresponding time-dependent fluorescence changes (F/F0) in the four selected regions (color code as in A0), and the change in IHC electrical capacitance (Cm) are plotted against time. (A2) The use of trains of short depolarization pulses (20 ms separated by 40 ms, or 5 ms separated by 10 ms) resulted in identifiable superlinear release, but the increase in Ca2+ concentration over time close to the synaptic ribbons was smaller than for a single long depolarization pulse and was not saturated. Left: color-coded fluorescence images of the same IHC loaded with OGB-5N before the depolarizing protocol (0.53 s time point) and during a train of 50 successive 20 ms depolarizations to −10 mV (1.03 s, 1.93 s, 3.03 s time points). Middle and right: the corresponding time-dependent fluorescence changes (F/F0) in the four selected regions, and the change in IHC membrane capacitance (Cm) are plotted against time. The arrowhead on the Cm trace indicates the start of the superlinear component of sustained release. (A3) Left: color-coded fluorescence images of the same IHC loaded with OGB-5N before the depolarizing protocol (0.53 s time point) and during a train of 50 successive 5 ms depolarizations to −10 mV (0.73 s, 0.93 s, and 1.23 s time points). Middle and right: the corresponding time-dependent fluorescence changes (F/F0) in the selected regions of interest and the change in IHC electrical capacitance (Cm) are plotted against time. The arrowhead on the Cm trace indicates the start of the superlinear component of sustained release. (B1–B3) Mean fluorescence changes (F/F0) measured in the IHC region of maximal ΔF change, during three different types of stimulation: (B1), a 2 s depolarization to −10 mV; (B2), a train of 50 successive 20 ms depolarizations to −10 mV; and (B3), a train of 50 successive 5 ms depolarizations to −10 mV. In each case, averaged results for Otof C2C/+ and Otof C2C/C2C IHCs on P8-P12 are shown. Signal patterns for the low-affinity fluorescent Ca2+-indicator OGB-5N were similar in Otof C2C/+ and Otof C2C/C2C IHCs. Note the larger scale in (B3) than in (B1–B2). Data information: in (A0–A3), the data come from a single recorded wild-type IHC. In (B1–B3), data are presented as the mean ± SEM (in gray) for Otof C2C/+ data, but as the mean only for Otof C2C/C2C, for the sake of clarity.
Figure 9 with 1 supplement
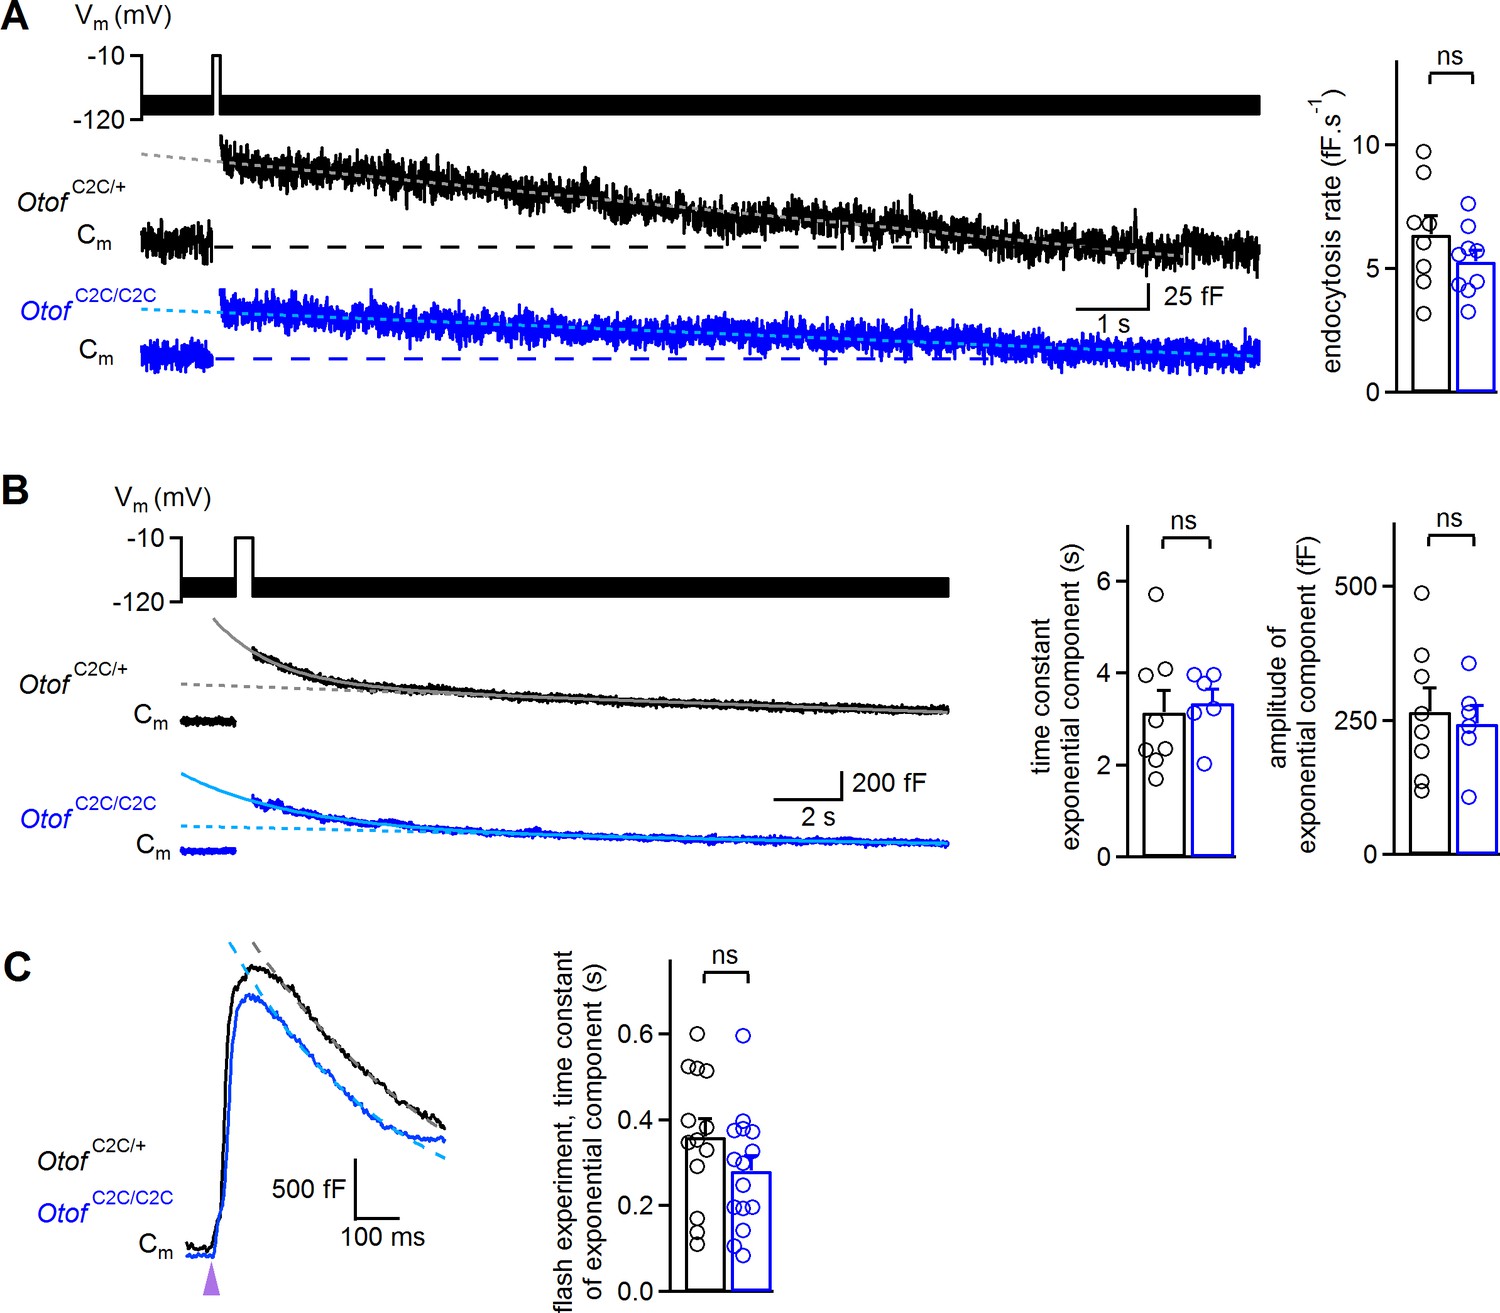
Normal endocytosis, assessed by prolonged Cm measurements, in Otof C2C/C2C IHCs.
(A) Left: Examples of Cm traces, recorded over a period of 15 s, in response to a 100 ms depolarization to −10 mV from a holding potential of −95 mV, in P14-P17 Otof C2C/+ and Otof C2C/C2C IHCs. Horizontal dashed lines indicate the baseline Cm. The decay phase of Cm traces was fitted with a linear function (gray and light blue dotted lines). Right: Mean endocytosis rate in response to depolarizations lasting 20–100 ms in P14-P17 Otof C2C/+ and Otof C2C/C2C IHCs. (B) Left: Examples of Cm traces, recorded over a period of 20 s, in response to a 500 ms long depolarization to −10 mV from a holding potential of −95 mV, in Otof C2C/+ and Otof C2C/C2C P14-P17 IHCs. The decay phase of Cm traces was fitted with a monoexponential function added to a linear function (gray and light blue lines). Dotted lines correspond to the linear component of these fits. Right: Mean time constant and amplitude of the exponential component of Cm decay in Otof C2C/+ and Otof C2C/C2C IHCs. (C) Left: Example traces of the decay following exocytosis evoked by intracellular Ca2+ uncaging (purple arrowhead) in Otof C2C/+ and Otof C2C/C2C IHCs. The decay period was fitted with a monoexponential function (gray and light blue dashed lines). Right: Mean time constant of the exponential component of Cm decay following exocytosis evoked by intracellular Ca2+ uncaging. The data were collected from the IHCs used in Figure 6. Data information: in (A–C), data are presented as the mean ± SEM. ns not significant (Student's t-test with Welch correction). In (A–B), Cm traces were 100 Hz low-pass filtered.
Figure 9—figure supplement 1
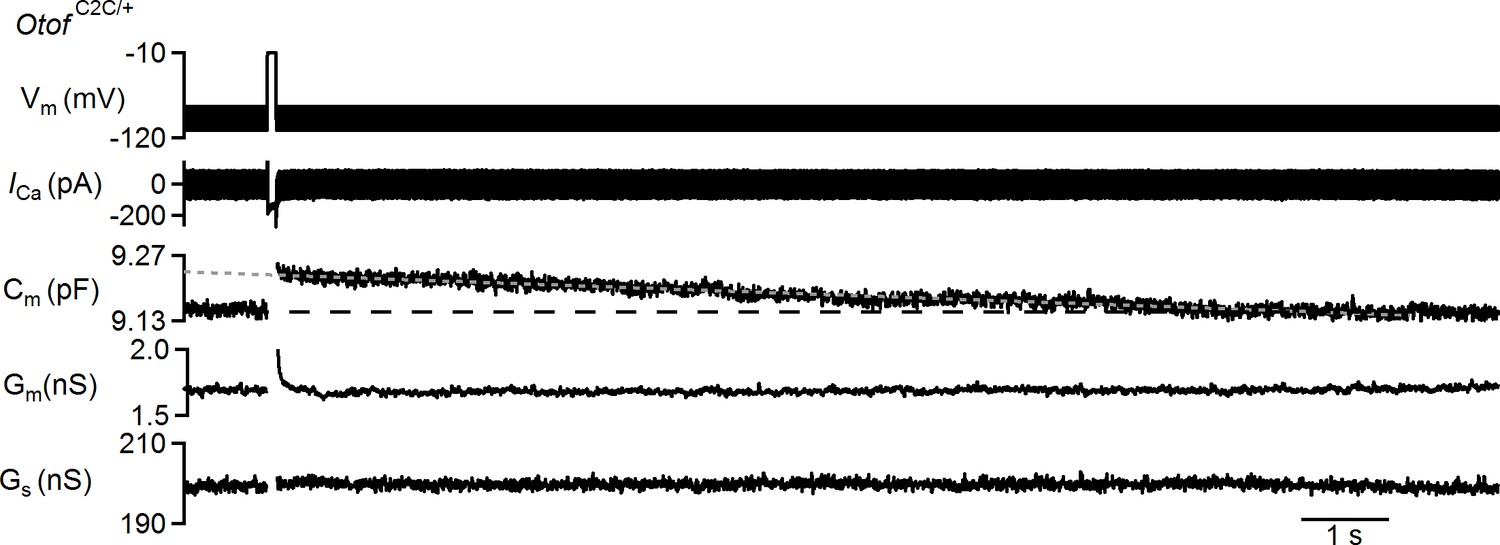
Example of a protocol used to probe endocytosis in an Otof C2C/+ IHC and corresponding recorded traces.
Example of Ca2+ current (ICa) and corresponding Cm, Gm, and Gs traces recorded in an Otof C2C/+ P15 IHC over a period of 15 s, in response to a 100 ms long depolarization to −10 mV from a holding potential of −95 mV. Data information: raw traces are shown except for the Cm trace that was 100 Hz low-pass filtered.
Figure 10

Lower EPSC rates in Otof C2C/C2C IHCs.
(A) Superimposed example EPSC traces (IEPSC) recorded at Otof +/+ and Otof C2C/C2C IHC afferent boutons on P8-P11, after extracellular application of 25 mM KCl (top), and histograms of EPSC amplitude distribution for the corresponding cells (bottom). (B) Bar graphs displaying the mean and individual EPSC amplitude and EPSC decay time constant (τ)in Otof +/+ (n = 8) and Otof C2C/C2C (n = 8) IHCs. (C) Left: EPSC count as a function of time after the extracellular application of 25 mM KCl (indicated by an arrowhead) for all recorded Otof +/+ and Otof C2C/C2C IHCs. Middle: Zoom on the first 10 s of recording. Right: Bar graph displaying mean EPSC rate in the first 10 s of the K+ challenge, in Otof +/+ and Otof C2C/C2C IHCs. (D) Mean and individual normalized cumulative EPSC number plotted against EPSC amplitude for Otof +/+ and Otof C2C/C2C IHCs. Data information: in (B–D), data are presented as the mean ± SEM. In (B–C), **p<0.01, ns not significant (Student's t-test with Welch correction). In (D), ***p<0.001 (Kolmogorov-Smirnov test).
Figure 11
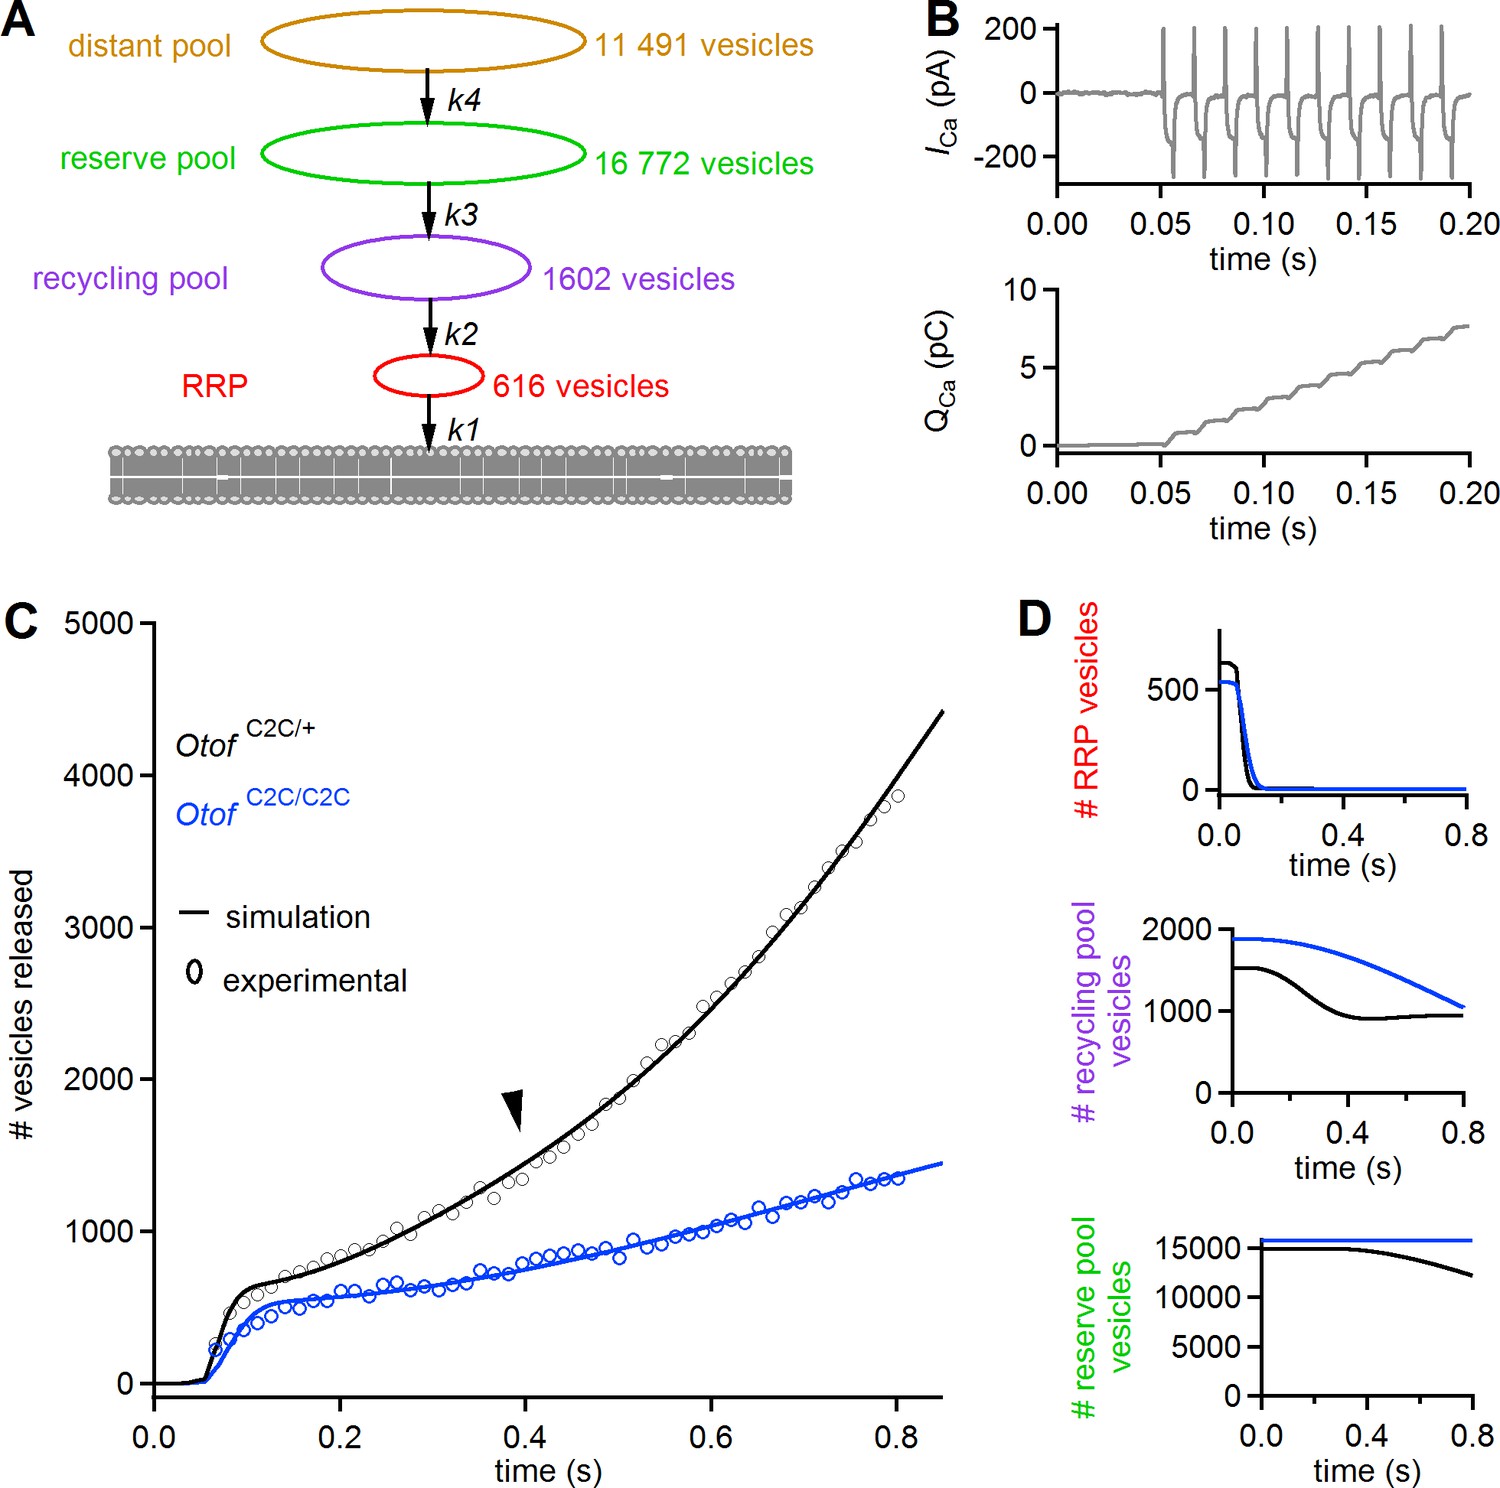
A mass action model of synaptic release reproduces Ca2+ sensitivity defects in Otof C2C/C2C IHCs.
(A) Diagram of the synaptic vesicle pools described by the model: the RRP (red), the recycling pool (violet), the reserve pool (green), and the distant pool (yellow). The process of synaptic exocytosis is governed by four rate constants, for RRP vesicle fusion (k1), replenishment of the RRP from the recycling pool (k2), replenishment of the recycling pool from the reserve pool (k3), and replenishment of the reserve pool from the distant pool (k4). The vesicle numbers indicated for each pool are the results obtained by least-squares fitting to the experimental data for Otof C2C/+ IHCs. (B) Original Ca2+ current (ICa) trace (recorded without the sine wave variation of the holding potential used to determine Cm) elicited by a train of 50 successive 5 ms depolarizations in an Otof C2C/+ IHC (upper panel), and the corresponding integrated charge QCa as a function of time (lower panel). (C) Experimental mean ΔCm data as in Figure 8F, converted into the number of fused vesicles (black and blue circles) during a train of 50 successive 5 ms depolarizations, superimposed onto the best least-squares fits (black and blue lines) of the model for Otof C2C/+ and Otof C2C/C2C IHCs (see Table 1). (D) Corresponding simulation of changes in vesicle numbers for each vesicle pool in Otof C2C/+ and Otof C2C/C2C IHCs.
Author response image 1
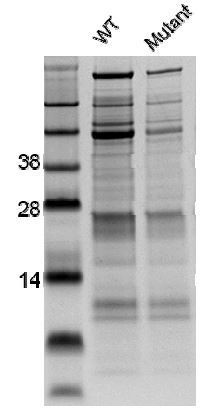
SDS-PAGE analysis showing the poor quality of the Otoferlin C2C proteins purified.
Tables
Table 1
Values of the parameters used in the mass action model of synaptic release
https://doi.org/10.7554/eLife.31013.021| Parameter | Otof C2C/+ | Otof C2C/C2C |
|---|---|---|
| VM1 | 616 ± 105 vesicles | 570 ± 81 vesicles |
| VM2 | 1 602 ± 248 vesicles | 1 877 ± 487 vesicles |
| VM3 | 16772 ± 8792 vesicles | 11 312 ± 3835 vesicles |
| VM4 | 11 491 ± 2015 vesicles | 14 171 ± 3562 vesicles |
| k1 | 1062 ± 583 C−1.s−1 | 349 ± 169 C−1.s−1 |
| k2 | 6.4 ± 3.9 C−1.s−1 | 0.8 ± 0.4 C−1.s−1 |
| k3 | 4.5 ± 9.9 C−1.s−1 | 0.95 ± 0.86 C−1.s−1 |
| k4 | (6.6 ± 5.2) x 10−3 C−1.s−1 | (8.5 ± 3.6) x 10−3 C−1.s−1 |
| [Ca2+]1 | (1.7 ± 0.8) x 10−14 C | (2.1 ± 0.1) x 10−14 C |
| [Ca2+]2 | (8.3 ± 5.9) x 10−13 C | (6.7 ± 2.7) x 10−13 C |
| [Ca2+]3 | (8. 7 ± 2. 6) x 10−12 C | (10.2 ± 1.4) x 10−12 C |
| [Ca2+]4 | (9.7 ± 3.4) x 10−12 C | (9.7 ± 1.6) x 10−12 C |
Additional files
-
Transparent reporting form
- https://doi.org/10.7554/eLife.31013.022
Download links
A two-part list of links to download the article, or parts of the article, in various formats.
Downloads (link to download the article as PDF)
Open citations (links to open the citations from this article in various online reference manager services)
Cite this article (links to download the citations from this article in formats compatible with various reference manager tools)
Otoferlin acts as a Ca2+ sensor for vesicle fusion and vesicle pool replenishment at auditory hair cell ribbon synapses
eLife 6:e31013.
https://doi.org/10.7554/eLife.31013


