Movement maintains forebrain neurogenesis via peripheral neural feedback in larval zebrafish
- University of Toronto, Canada
Figures
Figure 1 with 1 supplement
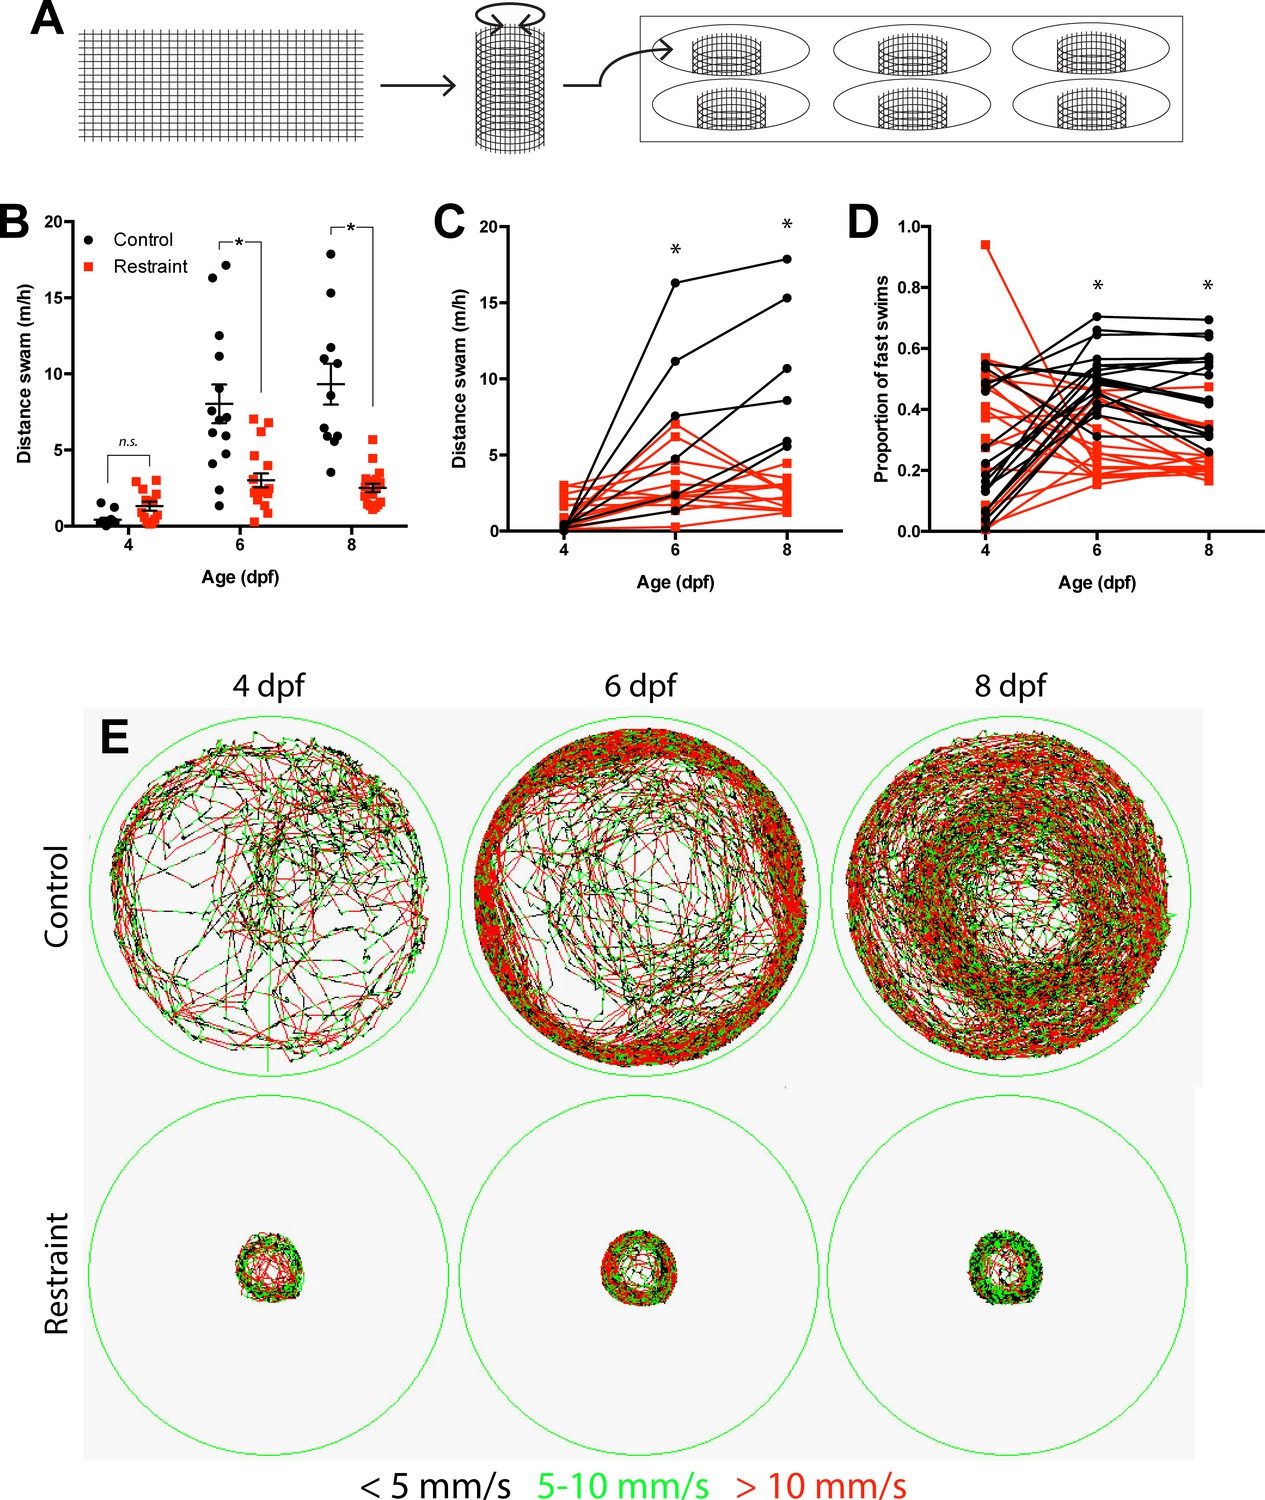
Movement restraint reduces swimming.
(A) Apparatus used to restrain movement in zebrafish larvae by reducing the volume of water available to the larvae to swim using a mesh barrier. Movement restraint reduced swimming on 6 to 8 dpf both between groups (B; control: n4,6,8 dpf = 12, 14, 11; restraint, n4,6,8 dpf = 13, 18, 18; Data are represented as mean ± SEM) and within individual larvae (C; control n = 6; restraint n = 13). Movement restraint also reduced the proportion of fast swims (>10 mm/s) exhibited by larvae by 6–8 dpf (D; n = 18). (E) Representative traces from 1 hr time-bins for recorded larvae from 4 to 8 dpf. Colour coding represents movement speed. *p<0.05.
Figure 1—figure supplement 1
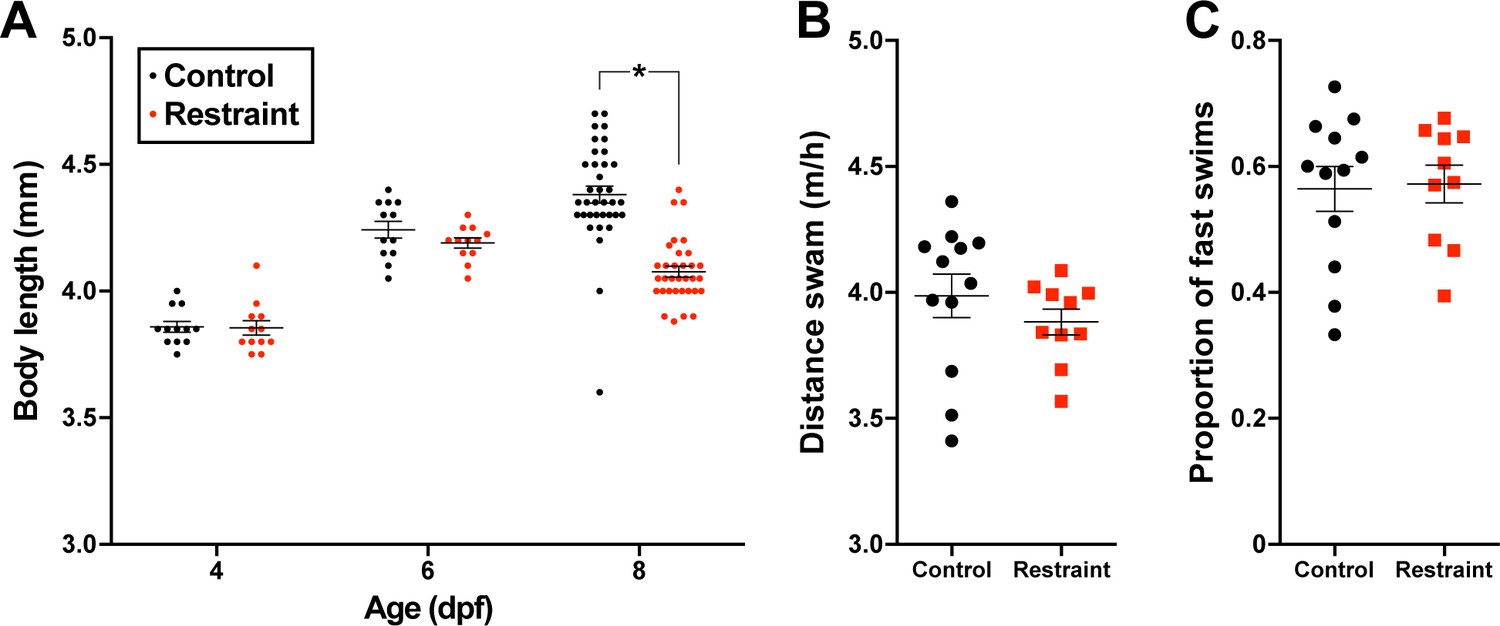
Body lengths of zebrafish larvae reared under physical restraint or control conditions on 3 dpf (n = 12), 6 dpf (control n = 12, restraint n = 12), and 9 dpf (control n = 36, restraint n = 33).
Hourly distance swam (B; control n = 12, restraint n = 10) and proportion of fast swims (>10 mm/s, C; control n = 12, restraint n = 10) in unrestrained wells by larvae reared previously under restraint or control conditions. Data are represented as mean ± SEM.
Figure 2 with 2 supplements
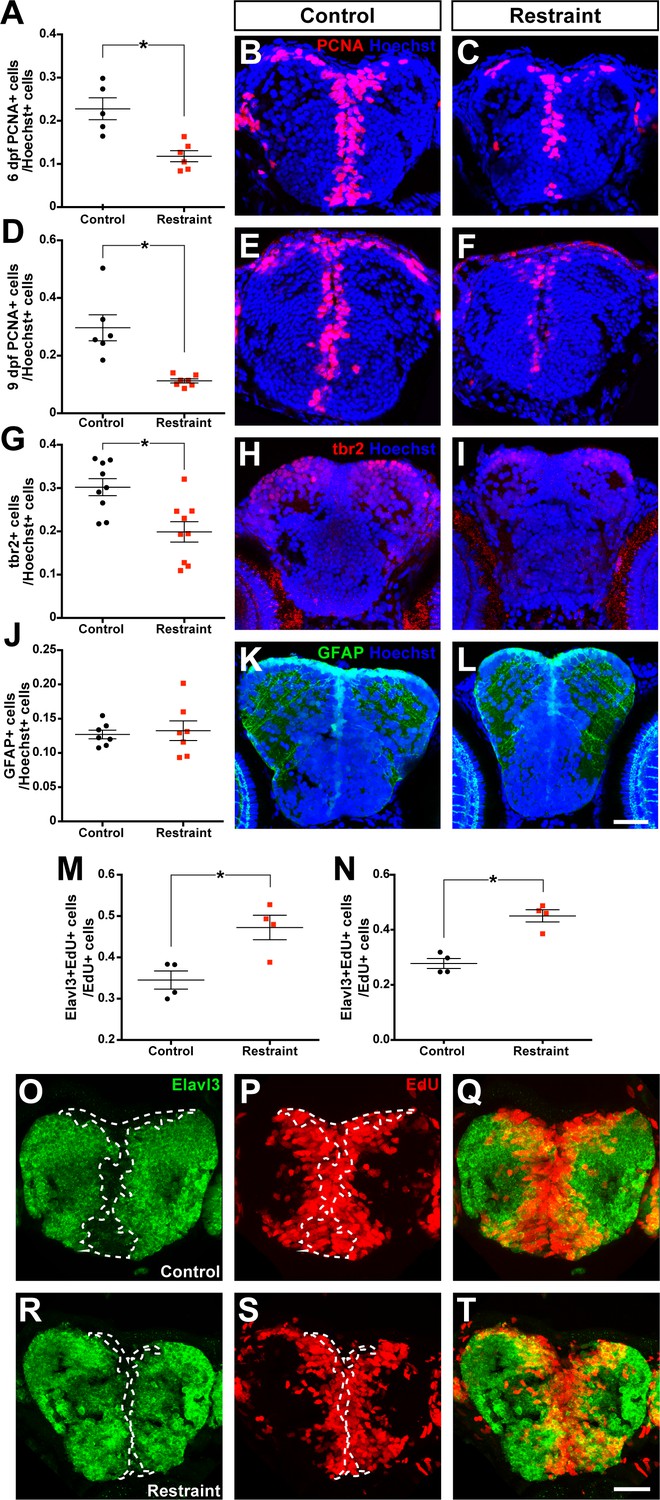
Movement restraint reduces cell proliferation in the larval forebrain.
By 6 dpf, movement restraint reduces the proportion of PCNA+ cells in the forebrain (A-C; control n = 5, restraint n = 6). This reduction in PCNA +cells is maintained when movement restraint is continued until 9 dpf (D-F; control n = 6, restraint n = 7). Movement restraint until 9 dpf also reduces tbr2+ cells in the pallium (G-I; n = 9) without affecting the number of GFAP+ radial glia stem cells in the pallium (J-L; n = 7; scale bar for micrographs in B-L = 30 µm). Following a 24 hr pulse with EdU starting on 5 dpf, fewer EdU+ cells in the subpallium (M) and pallium (N; n = 4) co-label for the neuronal fate marker Elavl3 in controls (O–Q) compared to movement restrained larvae (R-T; scale bar = 20 µm). White dotted lines mark the boundaries of Elavl3+ expression to highlight the increased overlap between EdU+ cell cohorts and Elavl3+ in restrained larvae. *p<0.05. Data are represented as mean ± SEM.
Figure 2—figure supplement 1
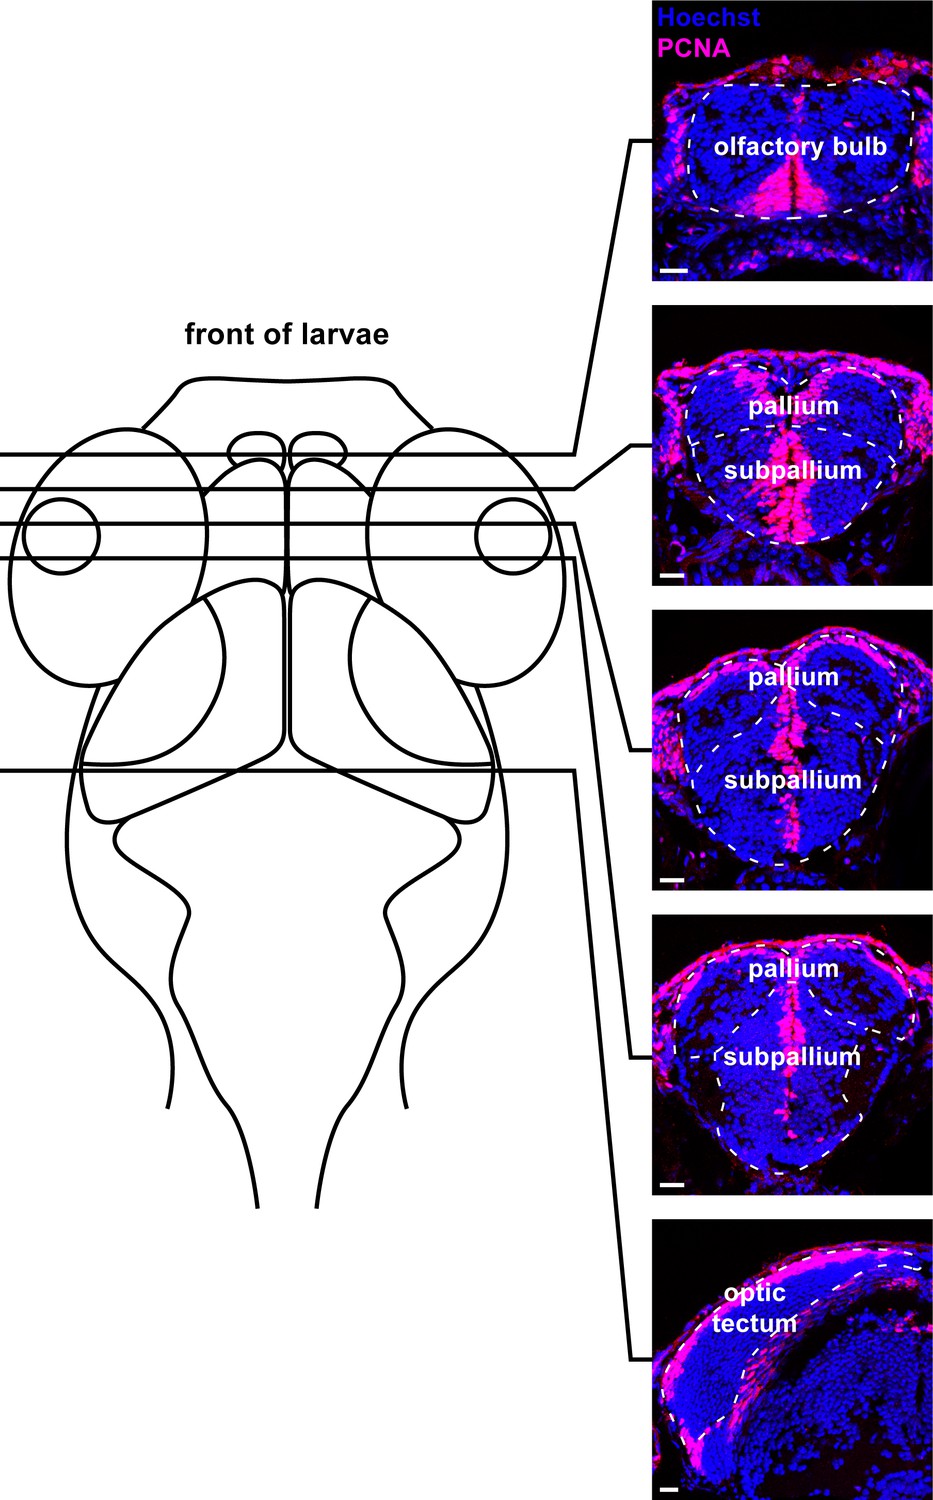
Example traces of brain regions sampled through coronal sections in the larval zebrafish brain.
Micrographs (20 µm thickness) with example boundaries traced for the olfactory bulb, pallium, subpallium, and optic tectum (white dotted line) along with their approximate rostrocaudal position on a schematic of a dorsal view of the larval zebrafish head. Scale bars = 20 µm.
Figure 2—figure supplement 2
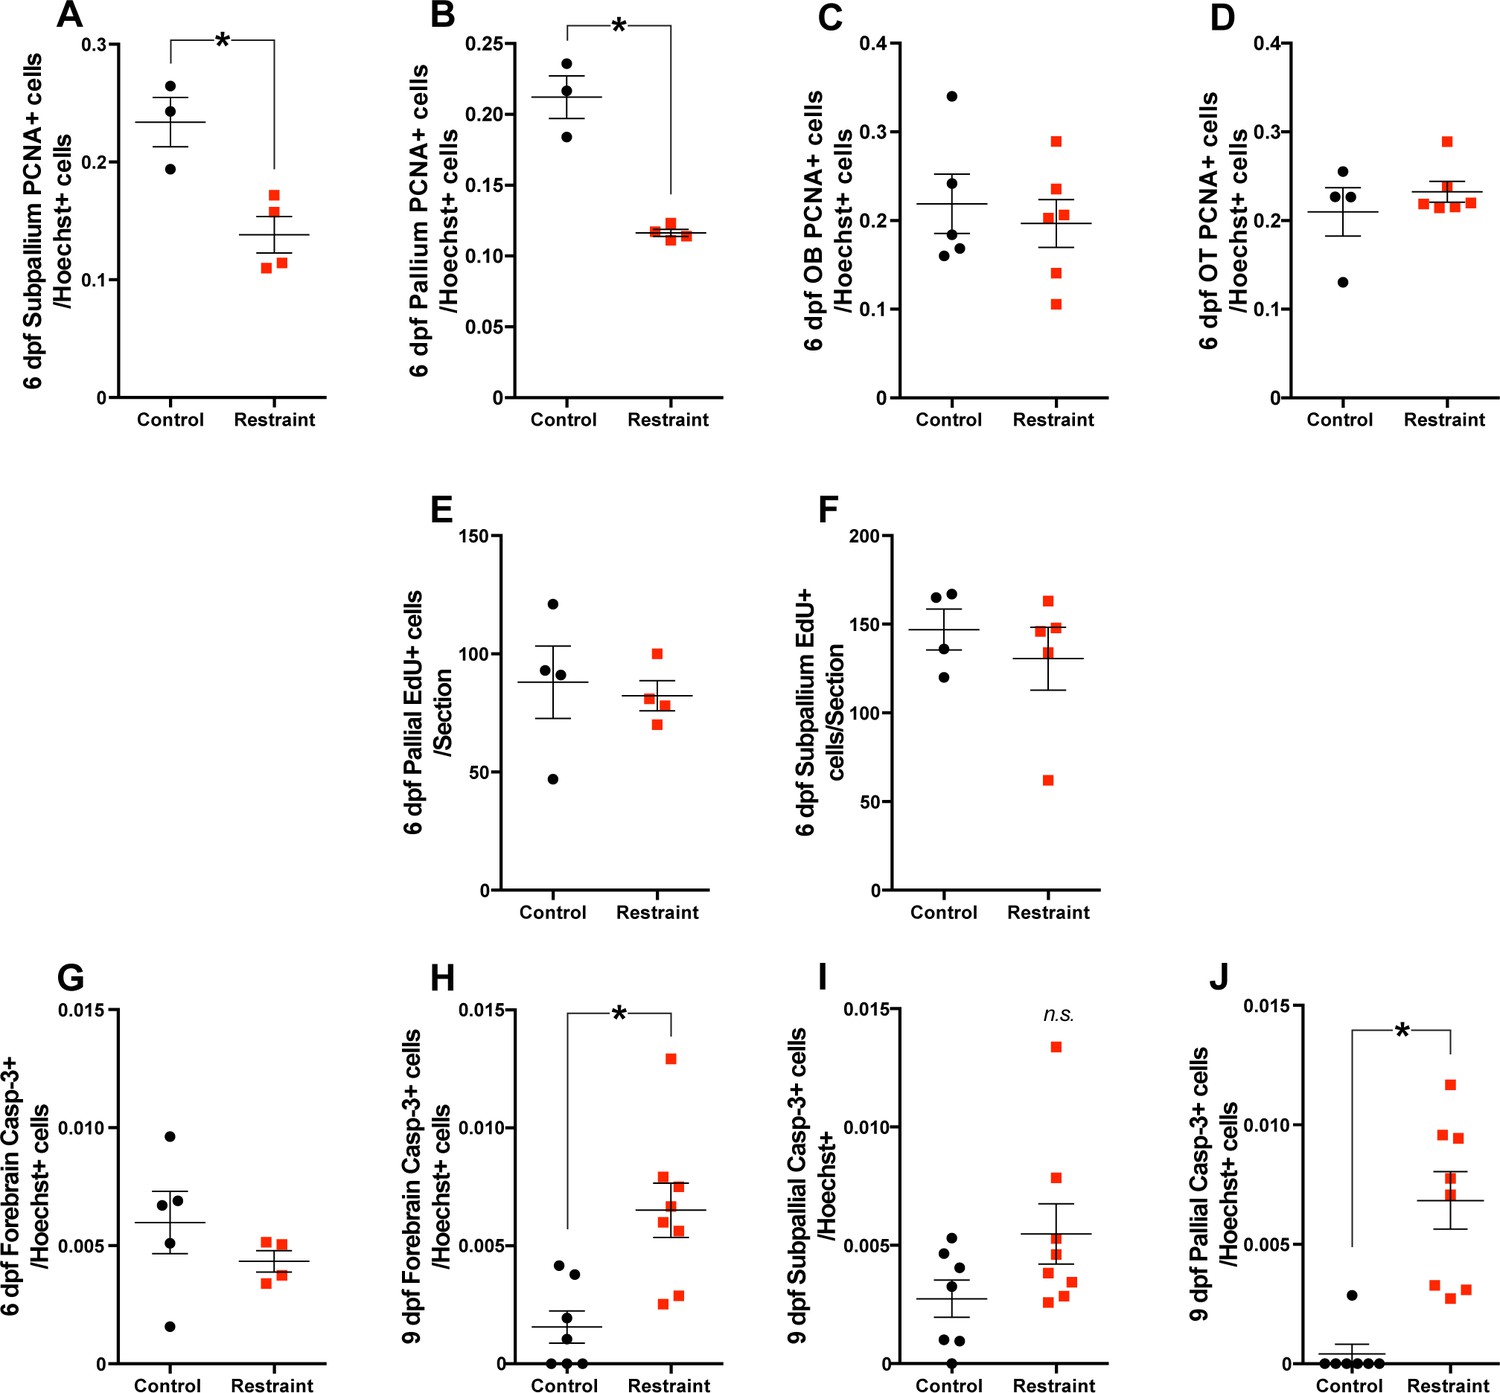
Movement restraint reduces the number of PCNA+ cells in the subpallium (A) and pallium (B; control n = 3; restraint n = 4) of 6 dpf zebrafish larvae compared to unrestrained controls.
Movement restraint did not affect the number of PCNA +cells in the olfactory bulb (OB; C; control n = 5, restraint n = 6) or optic tectum (OT; D; control n = 4, restraint n = 6) on 6 dpf. Movement restraint did not affect the number of EdU+ cells produced in the pallium (E; n = 4) or subpallium (F; control n = 4, restraint n = 5) over 24 hr from 5 to 6 dpf. Movement restraint did not affect the number of activated caspase-3+ (Casp3) cells in the zebrafish forebrain on 6 dpf (G; control n = 5, restraint n = 4) and increased the number of Casp3+ cells in the forebrain by 9 dpf (H; control n = 7, restraint n = 8): this effect was not found in the subpallium (I; control n = 7, restraint n = 8) and was specific to the pallium (J; control n = 7, restraint n = 8). Data are represented as mean ± SEM.
Figure 3 with 1 supplement
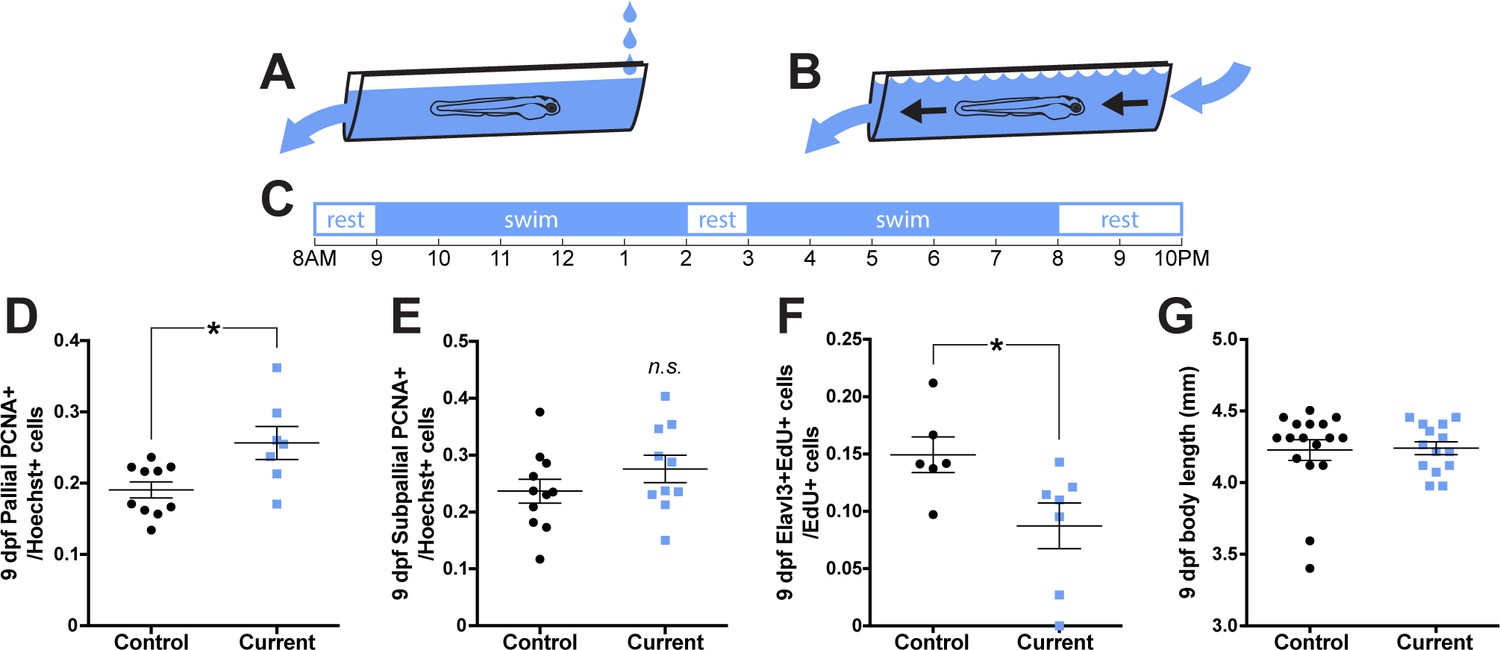
Rearing larvae against a displacing current increases pallial cell proliferation.
From 3 dpf, larvae were reared in groups in a plastic canal with water flow producing (A) a weak current that did not displace larvae or (B) a strong current that would displace larvae on a daily schedule (C). By 9 dpf, larvae reared against a strong current exhibited significantly more PCNA +cells in the pallium (D; control n = 10, current n = 7), but not subpallium (E; control n = 11, current n = 10) compared to controls. Larvae reared against a strong current exhibited significantly less Elavl3/EdU co-labeling compared to controls (F; n = 6) and did not differ in body length from controls (G; control n = 17, current n = 14). *p<0.05. n.s. = not significant. Data are represented as mean ± SEM.
Figure 3—figure supplement 1
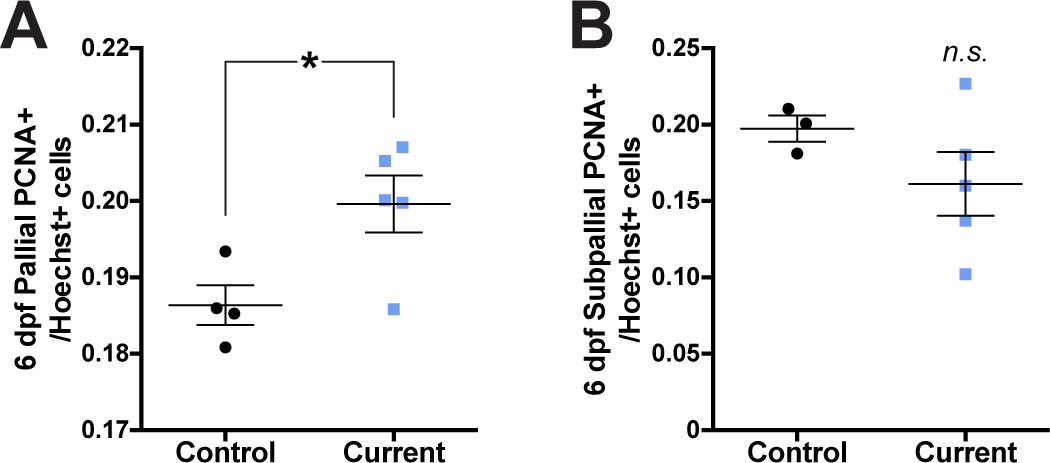
Rearing larvae against a strong current increased the proportion of PCNA+ cells in the pallium.
By 6 dpf, larvae reared against a strong current exhibited significantly more PCNA+ cells in the pallium (A; control n = 4, current n = 5), but not subpallium (B; control n = 3, current n = 4) compared to controls. *p<0.05. n.s. = not significant. Data are represented as mean ± SEM.
Figure 4
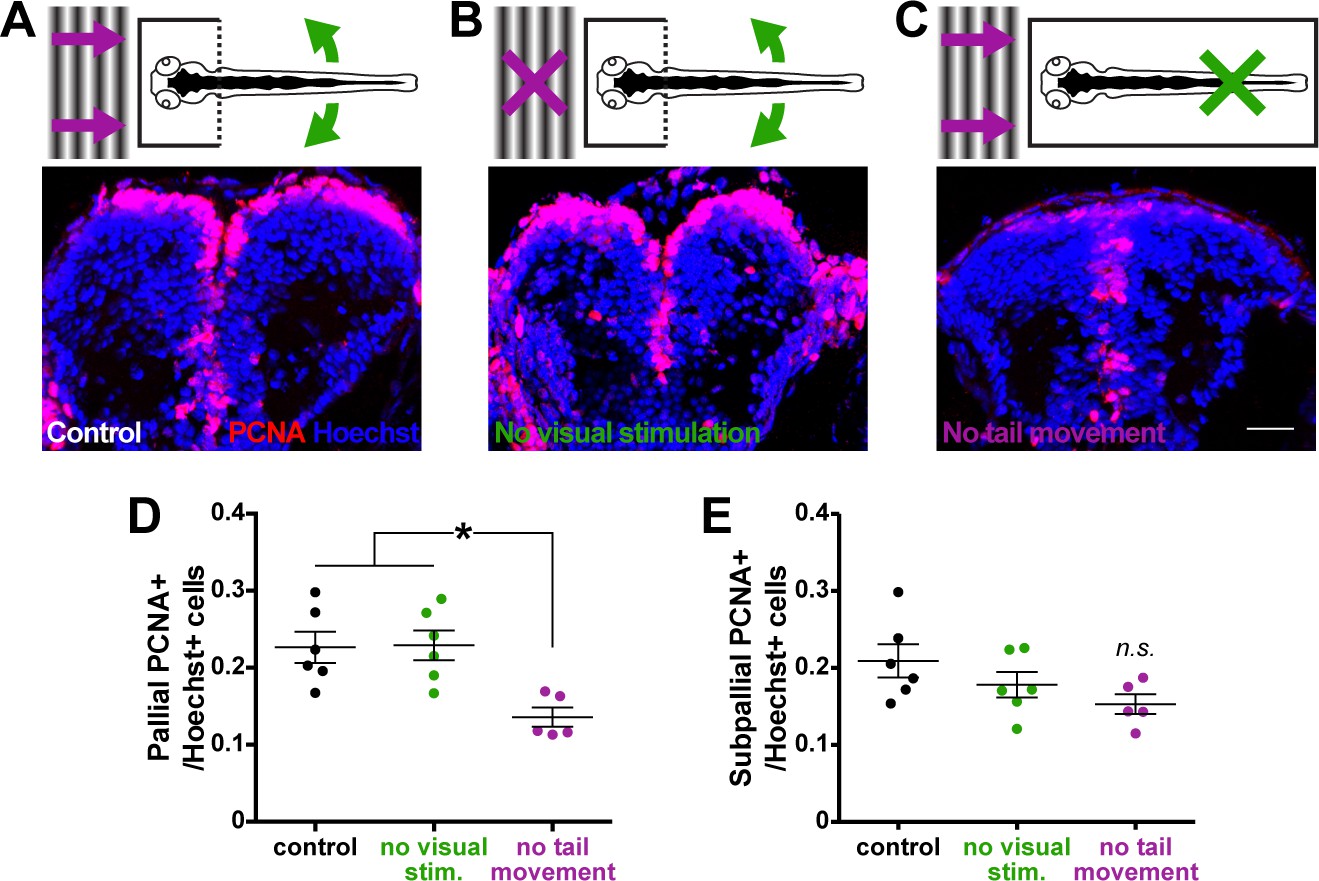
Tail movement, not visual stimulation, associated with locomotion maintains pallial cell proliferation.
Larvae were fully embedded in agarose at 3 dpf and reared able to perceive either (A) visual stimulation associated with movement (a moving gradient; purple arrows) and tail movement (tail cut free from agarose; green arrows), (B) tail movement only, or (C; scale bar = 20 µm) visual stimulation only. By 6 dpf, larvae capable of tail movement exhibited more PCNA+ cells in the pallium (D) compared to larvae perceiving only visual stimulation associated with movement. Isolating visual or physical cues of movement had no significant affect on PCNA+ cell counts in the subpallium (E; control n = 6, physical only n = 6, visual only n = 5) by 6 dpf. *p<0.05. n.s. = not significant. Data are represented as mean ± SEM.
Figure 5
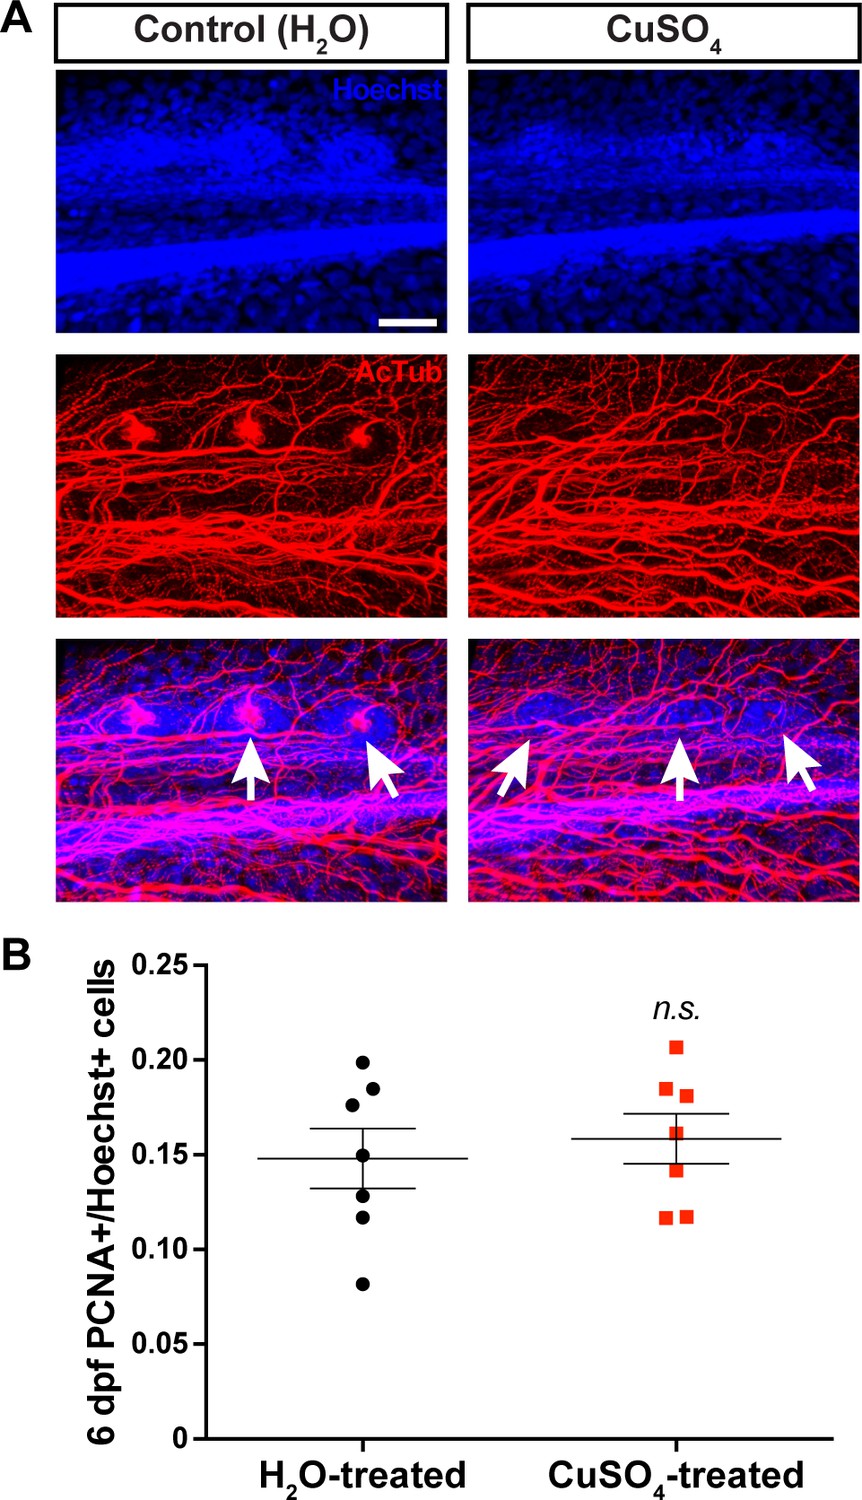
Ablation of the lateral line does not affect pallial cell proliferation.
On 3 dpf, 30 min exposure to CuSO4 destroyed kinocilia (as visualized by acetylated tubulin) associated with hair cell cupulae (white arrows) along the larval zebrafish lateral line (A). Prior ablation of lateral line hair cells on 3 dpf did not affect the number of PCNA+ cells in the pallium reared in unrestrained conditions (B; n = 7). Scale bar = 40 µm. n.s., not significant. Data are represented as mean ± SEM.
Figure 6 with 1 supplement
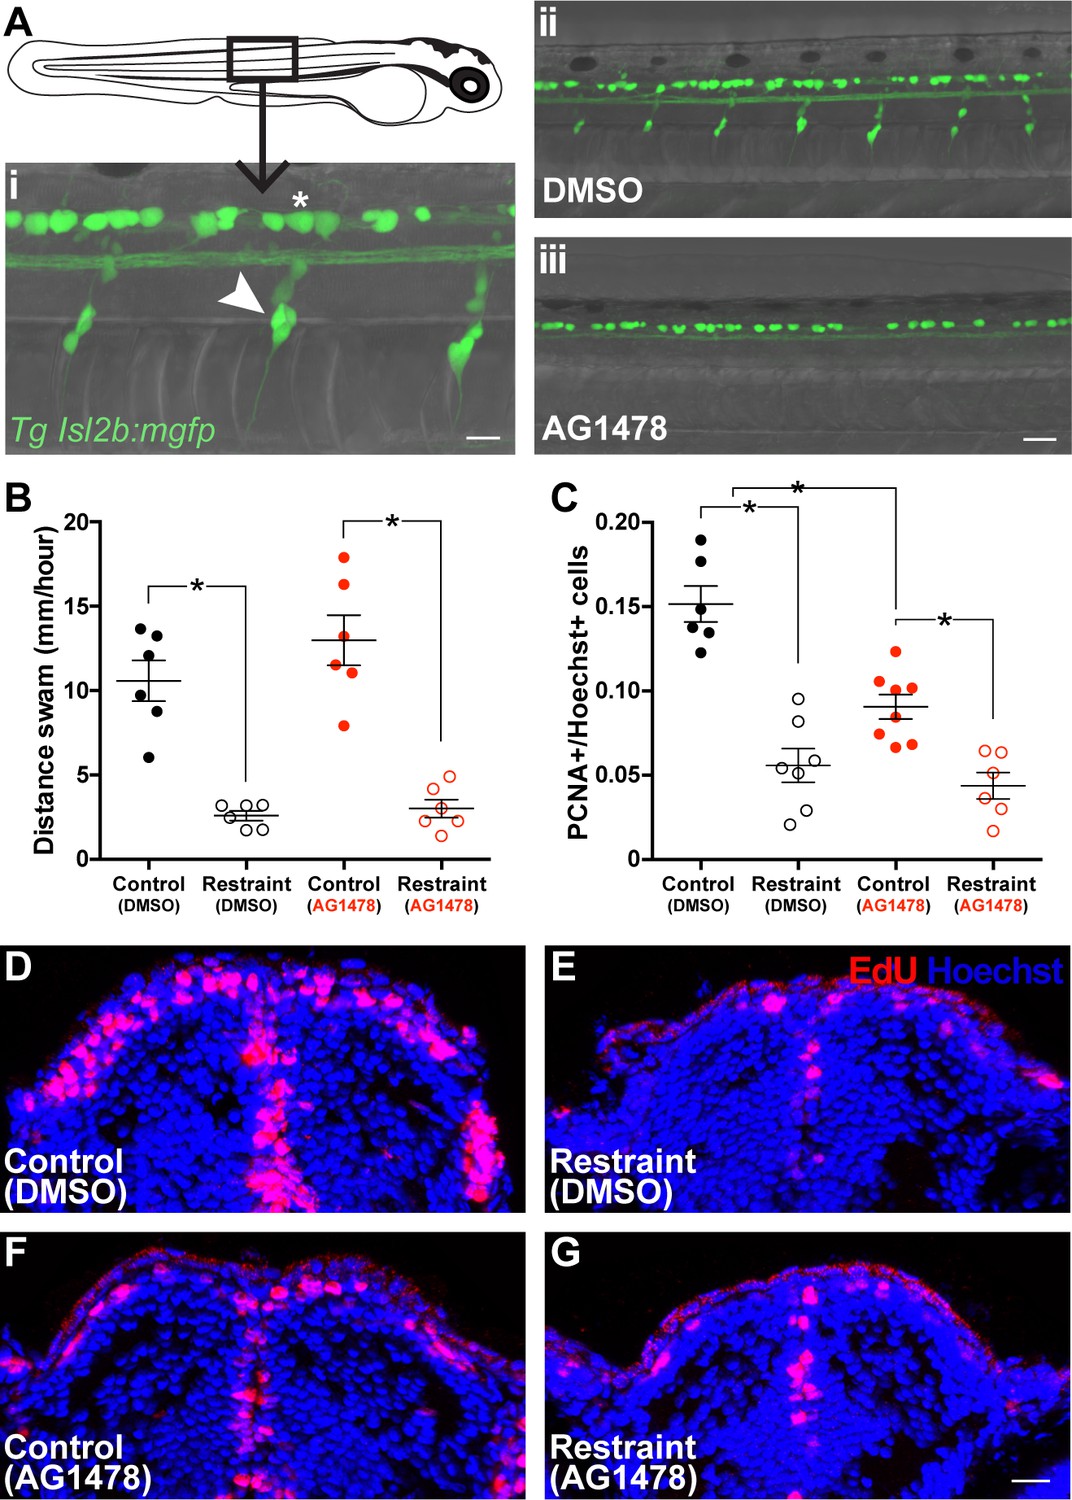
Impairing trunk DRG formation attenuates movement-dependent pallial neurogenesis.
(Ai) Dorsal root ganglia (white arrow) and Rohon-Beard neurons (white asterisk) were visualized in Tg(isl2b:mgfp) larvae (scale bar = 40 µm). Treatment with AG1478 from 8 to 30 hpf prevented development of DRG along the trunk in larvae by 3 dpf without affecting RB neuron populations dorsal to the spinal cord (Aii-iii). Earlier treatment with AG1478 did not affect swimming compared to DMSO-treated controls on 8 dpf (B; n = 6). By 9 dpf, restrained larvae in both DMSO (F-G; control n = 6, restraint n = 7) and AG1478 (H-I; control n = 8, restraint n = 6) treatments exhibited fewer pallial PCNA+ cells compared to controls, however, AG1478-treated controls exhibited fewer pallial PCNA+ cells compared to DMSO-treated controls, despite similar swimming behaviour. *p<0.05. Data are represented as mean ± SEM.
Figure 6—figure supplement 1
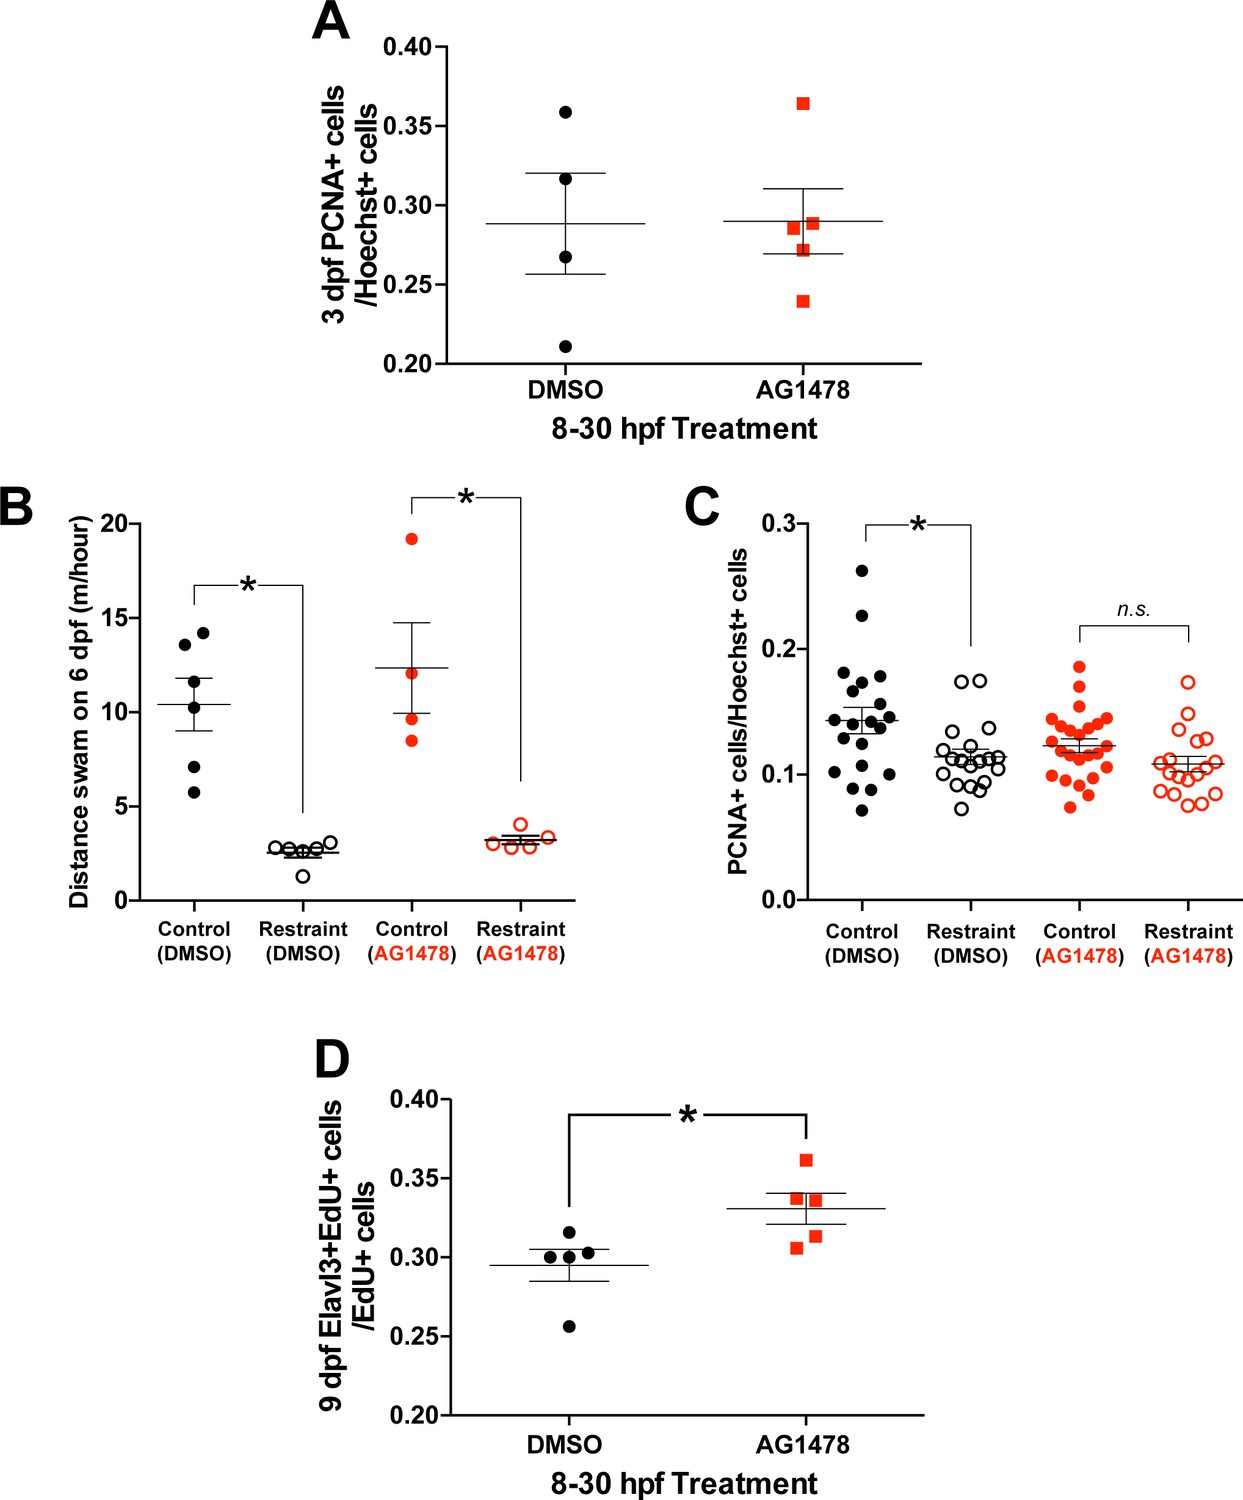
Treatment with AG1478 from 8 to 30 hpf did not affect the number of PCNA+ cells in the pallium by 3 dpf in zebrafish larvae (control n = 4, restraint n = 5).
Treatment with AG1478 from 8 to 30 hpf did not affect swimming on 6 dpf in both restrained and unrestrained conditions compared to DMSO-treated controls (B; DMSO control n = 6, DMSO restraint n = 6, AG1478 Control n = 4, AG1478 Control n = 5). Treatment with AG1478 from 8 to 30 hpf eliminated the movement-dependent changes in the number of pallial PCNA+ cells by 6 dpf, whereas larvae treated with DMSO still exhibited movement-dependent neurogenesis (C; DMSO control n = 20, DMSO restraint n = 19, AG1478 Control n = 24, AG1478 Control n = 18). Treatment with AG1478 from 8 to 30 hpf increased Elavl3/EdU co-localization in unrestrained 6 dpf larvae exposed to EdU from 5 to 6 dpf (D; n = 5). *p<0.05. n.s. = not significant. Data are represented as mean ± SEM.
Figure 7 with 1 supplement
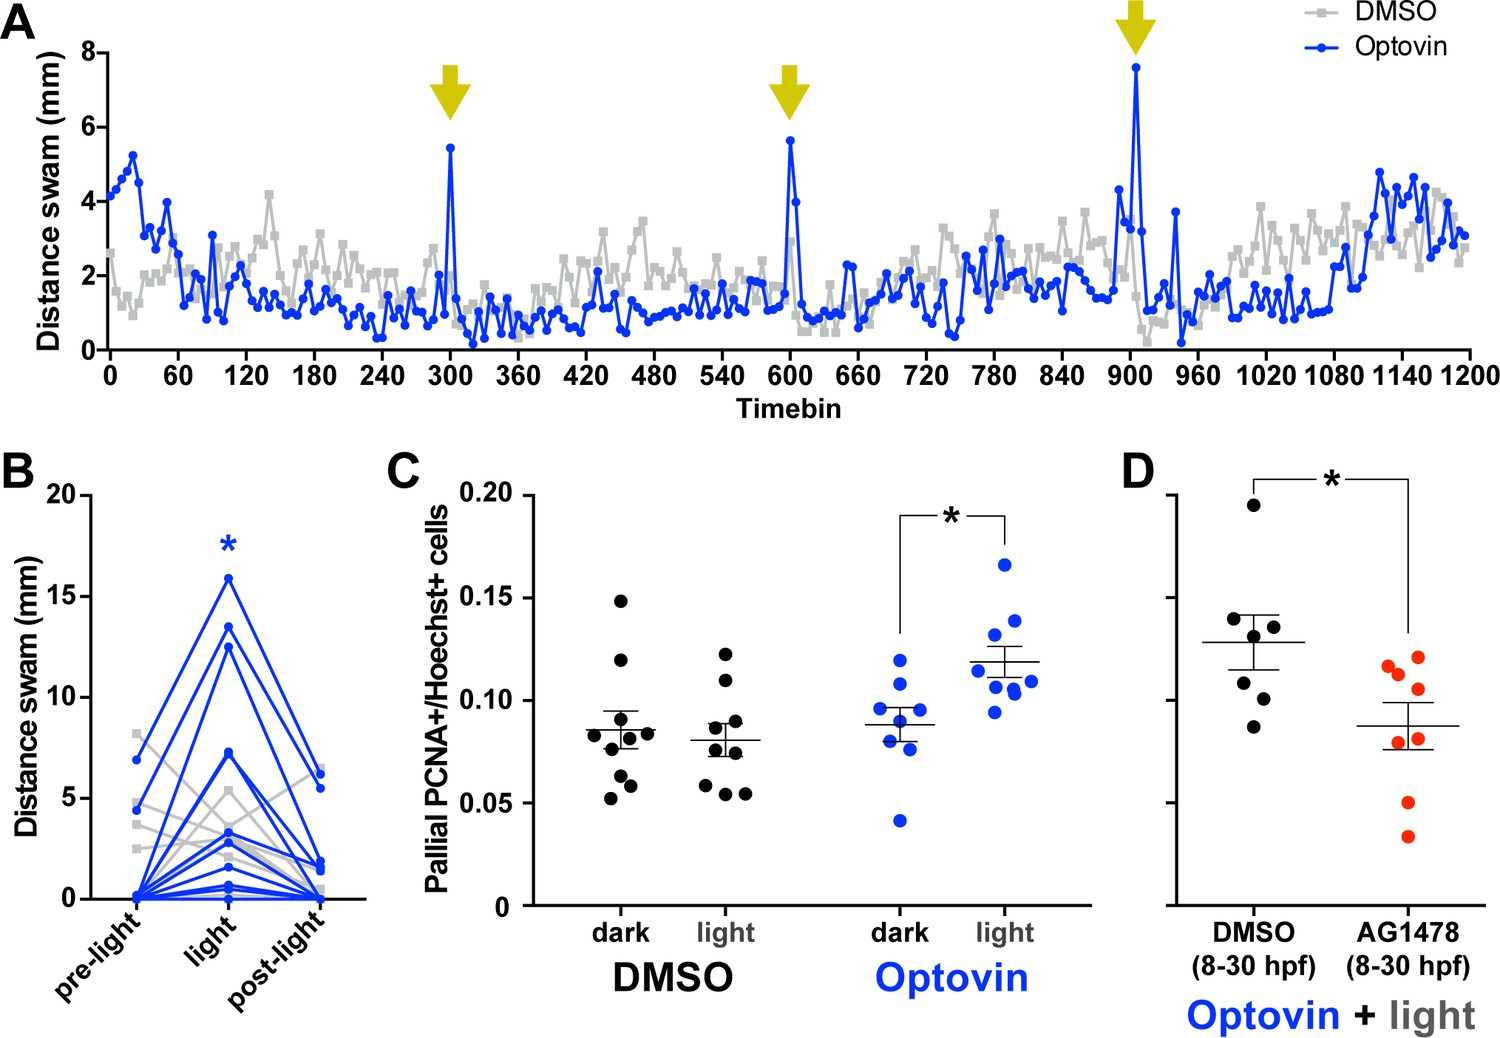
Photoactivation of DRGs using Optovin increases pallial neurogenesis.
5 dpf larvae incubated in Optovin exhibit repeatable movement bursts in response to light (A). Points on each line represent the mean distance swam (n = 12) during 5 s time bins by larvae treated with either Optovin (blue) or DMSO (grey) and exposed to 2 s of light (yellow arrows) every 5 min. (B) Expanded view of first light presentation from (A), including the 5 s of darkness prior to light presentation (pre-light), the 5 s time bin including light presentation for the first 2 s (light), and the following 5 s of darkness (post-light). Treating 5 dpf larvae immobilized in agarose with 2 s light pulses every 5 min for 5 hr increased the number of PCNA+ cells in the pallium 12 hr post treatment only when larvae were incubated with Optovin (C; DMSO dark n = 10, DMSO light n = 9, AG1478 dark n = 8, AG1478 light n = 9). Larvae treated with AG1478 from 8 to 30 hpf failed to exhibit an increase in the proportion of PCNA +cells in the pallium following this same Optovin + light treatment compared to controls (DMSO control n = 7, AG1478 n = 8). *p<0.05. Data are represented as mean ± SEM.
Figure 7—figure supplement 1
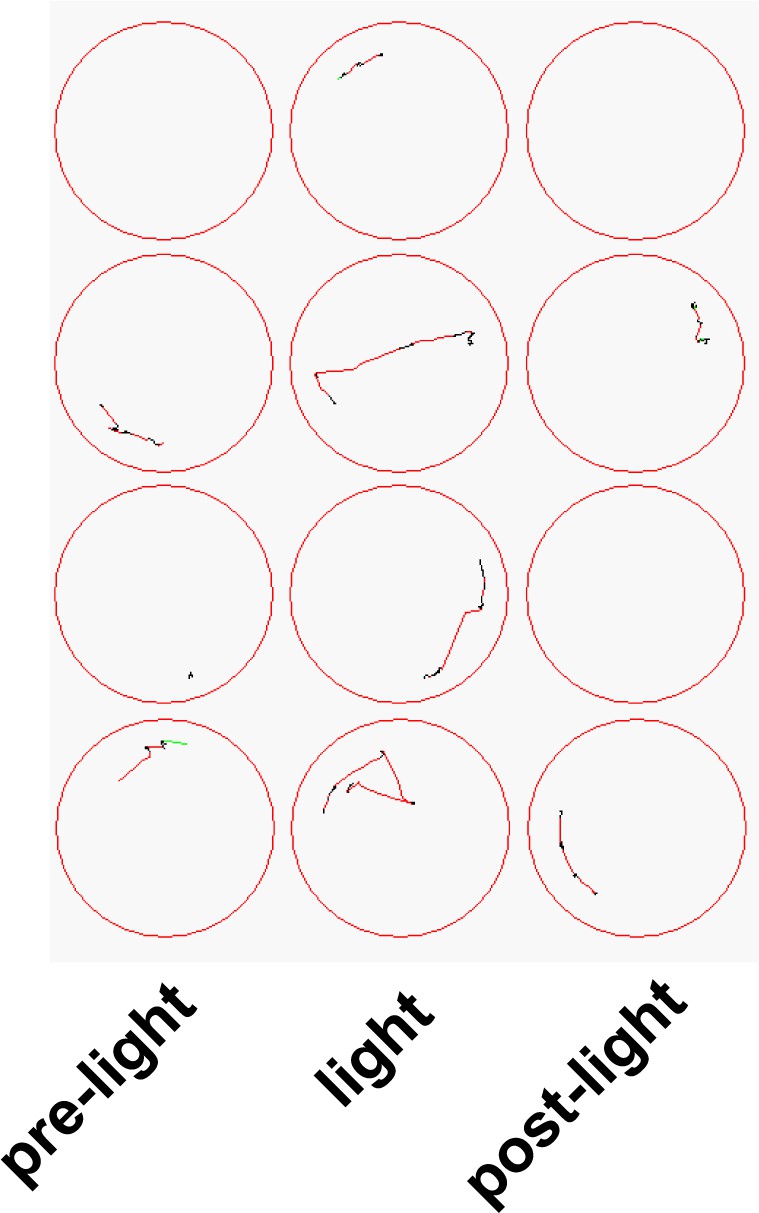
Example movement traces from 5 s timebins in 4 wells of larvae incubated with 10 µM Optovin prior to, during, and following a 2 s presentation of white light (800 lux).
https://doi.org/10.7554/eLife.31045.018Videos
Video 1
Video recorded using Zebralab software (Viewpoint) of 6 dpf zebrafish larvae swimming in restraint (above) or control (below) wells.
https://doi.org/10.7554/eLife.31045.006Tables
Table 1
Statistical powers derived from posthoc power calculations for all major findings.
All power analyses were performed using G*Power (Faul et al., 2007).
| Statistical test | Power (1-β error probability) |
|---|---|
| 1 | 0.999 |
| 2 | 1.000 |
| 3 | 1.000 |
| 4 | 0.983 |
| 5 | 0.159 |
| 6 | 0.053 |
| 7 | 0.939 |
| 8 | 0.840 |
| 9 | 0.999 |
| 10 | 0.076 |
| 11 | 0.110 |
| 12 | 0.956 |
| 13 | 0.886 |
| 14 | 0.062 |
| 15 | 0.998 |
| 16 | 0.814 |
| 17 | 0.060 |
| 18 | 0.101 |
| 19 | 0.164 |
| 20 | 0.918 |
| 21 | 0.992 |
| 22 | 0.383 |
| 23 | 0.683 |
| 24 | 0.226 |
| 25 | 0.702 |
| 26 | 0.212 |
| 27 | 0.600 |
| 28 | 0.052 |
| 29 | 0.910 |
| 30 | 0.420 |
| 31 | 0.075 |
| 32 | 0.050 |
| 33 | 1.000 |
| 34 | 0.836 |
| 35 | 0.603 |
| 36 | 1.000 |
| 37 | 1.000 |
| 38 | 1.000 |
| 39 | 0.585 |
| 40 | 0.575 |
Table 2
Changes in brain regions (sampled as Hoechst + cells/section following the procedures outlined underneath the ‘Cell Counting’ subheading in the Materials and methods) sampled across experiments.
All power analyses were performed using G*Power (Peirce, 2008).
| Experiment | Region sampled (Hoechst + cells/Section) | Significantly different? | Test statistic | P value | Power (1-β error probability) |
|---|---|---|---|---|---|
| Restraint (3–6 dpf) | Forebrain | No | t9 = 1.018 | 0.3351 | 0.104 |
| Pallium | No | t5 = 0.4206 | 0.6915 | 0.054 | |
| Subpallium | No | t5 = 1.685 | 0.1528 | 0.280 | |
| Olfactory Bulb | No | t7 = 0.3330 | 0.7489 | 0.060 | |
| Optic tectum | No | t8 = 1.664 | 0.1347 | 0.300 | |
| Restraint (3–9 dpf | Forebrain | Yes (Control > Restraint) | t11 = 3.890 | 0.0025 | 0.938 |
| Pallium | Yes (Control > Restraint) | t13 = 2.657 | 0.0198 | 0.704 | |
| Subpallium | Yes (Control > Restraint) | t23 = 4.725 | <0.0001 | 0.995 | |
| Exercise (3–6 dpf) | Pallium | No | t8 = 1.260 | 0.2430 | 0.199 |
| Subpallium | No | t7 = 1.435 | 0.1943 | 0.240 | |
| Exercise (3–9 dpf) | Pallium | No | t15 = 1.559 | 0.1397 | 0.310 |
| Subpallium | No | t19 = 0.2109 | 0.8352 | 0.055 | |
| Physical vs. Visual stimulation (3–6 dpf) | Pallium | No | F2,14 = 0.5679 | 0.5792 | 0.122 |
| Subpallium | No | F2,14 = 0.2594 | 0.7751 | 0.082 | |
| AG1478 vs. DMSO (3 dpf) | Pallium | No | t7 = 1.184 | 0.2751 | 0.170 |
| AG1478 vs. DMSO (6 dpf) | Pallium | No | F3,79 = 1.852 | 0.1445 | 0.484 |
Key resources table
| Reagent type (species) or resource | Designation | Source or reference | Identifiers |
|---|---|---|---|
| Strain, strain background (Danio rerio) | Tg(dlx5/6:gfp) | ZFIN ID: ZDB-FISH-150901–22615 | |
| Strain, strain background (D. rerio) | Tg(GFAP:gfp) | ZFIN ID: ZDB-ALT-060623–4 | |
| Strain, strain background (D. rerio) | Tg(βactin:gfp) | ZFIN ID: ZDB-ALT-061107–2 | |
| Strain, strain background (D. rerio) | Tg(isl2b:gfp) | ZFIN ID: ZDB-FISH-150901–2212 | |
| Software, algorithm | Zebralab | ViewPoint, Montreal, Canada | |
| Software, algorithm | IMARIS | Bitplane, Belfast, United Kingdom | |
| Antibody | mouse anti-Human Neuronal Protein HuC/HuD | Life Technologies, Waltham, Massachusetts | A-21271; RRID: AB_221448 |
| Antibody | mouse anti-PCNA | Invitrogen, Carlsbad, California | MA5-11358; RRID: AB_10982348 |
| Antibody | rabbit anti-activated caspase 3 | Cell Signaling Technology, Danvers, Massachusetts | Asp175; RRID: AB_2341188 |
| Antibody | rabbit anti-GFP alexa 488-conjugated | Life Technologies, Waltham, Massachusetts | A-21311; RRID: AB_221477 |
| Antibody | rabbit anti-tbr2 | Abcam, Cambridge, United Kingdom | ab23345; RRID: AB_778267 |
| Antibody | Cy3-conjugated goat anti-mouse | Jackson ImmunoReseach, West Grove, Pennsylvania | 115-165-146; RRID: AB_2338690 |
| Antibody | Cy3-conjugated goat anti-rabbit | Jackson ImmunoReseach, West Grove, Pennsylvania | 111-165-003; RRID: AB_2338000 |
| Antibody | Cy2-conjugated goat anti-rabbit | Jackson ImmunoReseach, West Grove, Pennsylvania | 111-225-114 |
| Chemical compound, drug | AG1478 | Sigma-Aldrich | T4182 SIGMA |
| Chemical compound, drug | Optovin | Hit2Lead, San Diego, California | Chemibridge ID#5707191 |
Additional files
-
Source code 1
Python code used to generate moving grating.
- https://doi.org/10.7554/eLife.31045.019
-
Transparent reporting form
- https://doi.org/10.7554/eLife.31045.020
Download links
A two-part list of links to download the article, or parts of the article, in various formats.
Downloads (link to download the article as PDF)
Open citations (links to open the citations from this article in various online reference manager services)
Cite this article (links to download the citations from this article in formats compatible with various reference manager tools)
Movement maintains forebrain neurogenesis via peripheral neural feedback in larval zebrafish
eLife 7:e31045.
https://doi.org/10.7554/eLife.31045


