Prediction of enzymatic pathways by integrative pathway mapping
- University of California, San Francisco, United States
- University of Illinois, United States
- Sanford Burnham Prebys Medical Discovery Institute, United States
- Russian Academy of Sciences, Russia
- Albert Einstein College of Medicine, United States
Figures
Figure 1 with 3 supplements
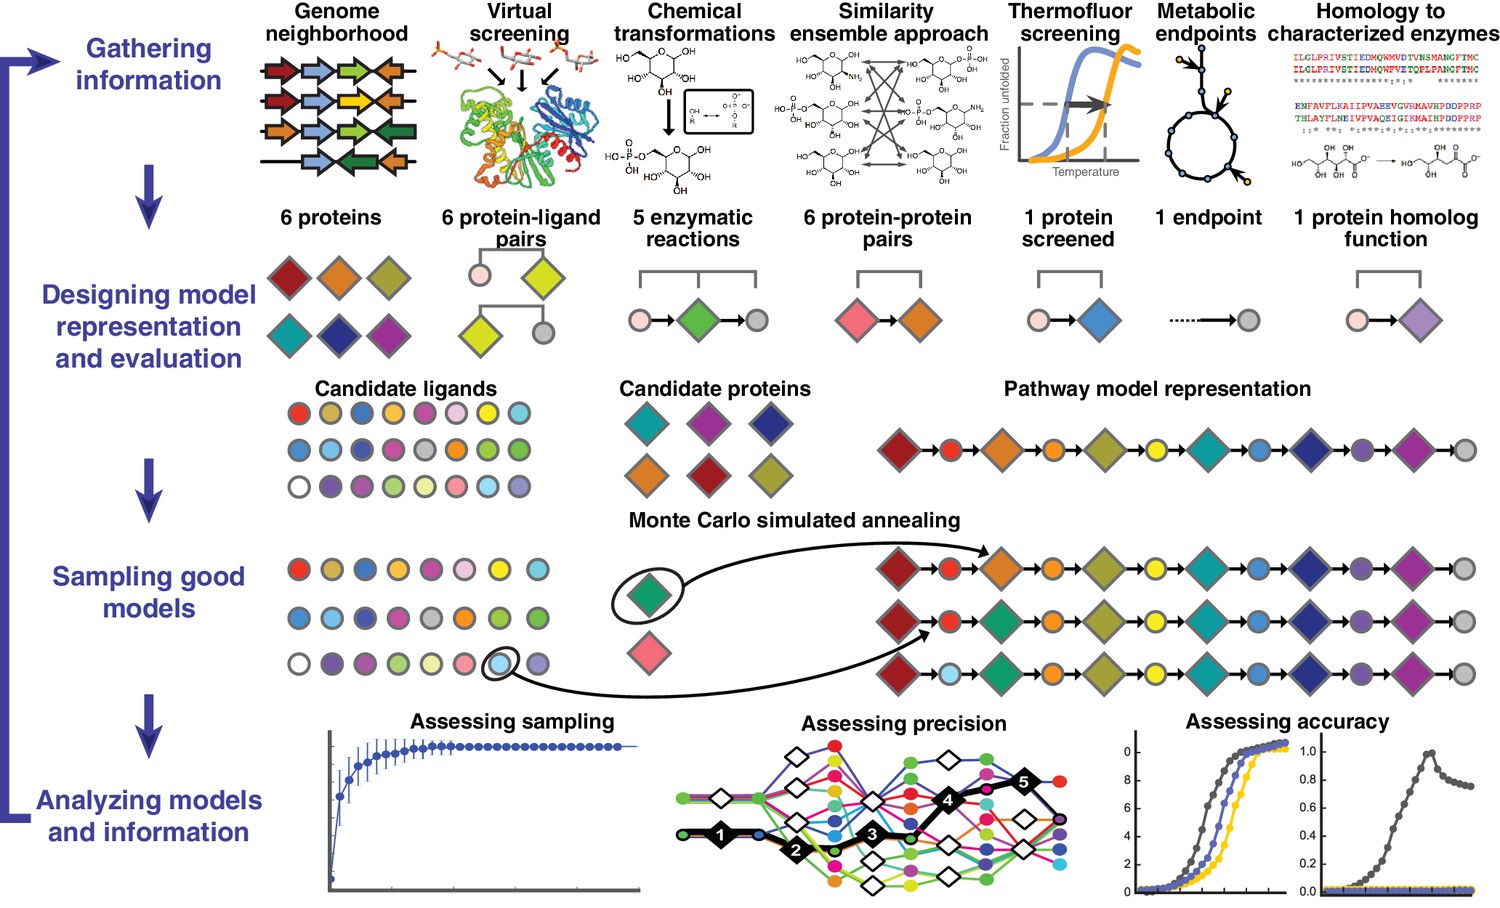
Overview of integrative pathway mapping method.
The four stages of integrative modeling are: (1) Gathering information, (2) Designing model representation and evaluation, (3) Sampling good models, and (4) Analyzing models and information. (1) Here, the input information is gathered from seven different sources used to determine the candidate proteins, such as co-localization and conservation in the genome neighborhood, and the scoring restraints (docking scores from virtual screening, chemical transformations, ensemble similarity calculations of virtual screening hits from similarity ensemble approach, DSF screening hits, metabolic endpoints, and characterized chemical reactions). (2) A pathway model is represented as a graph composed of protein and ligand nodes. Proteins are depicted as diamonds and ligands are depicted as circles, with lines showing the node patterns evaluated by a given type of information. (3) The combinatorial optimization problem is solved by Monte Carlo simulated annealing sampling, consisting of randomly swapping nodes in and out of the pathway model and rearranging the edges between the nodes. (4) The final analysis stage involves assessing the sampling, precision, and accuracy of the models.
Figure 1—figure supplement 1
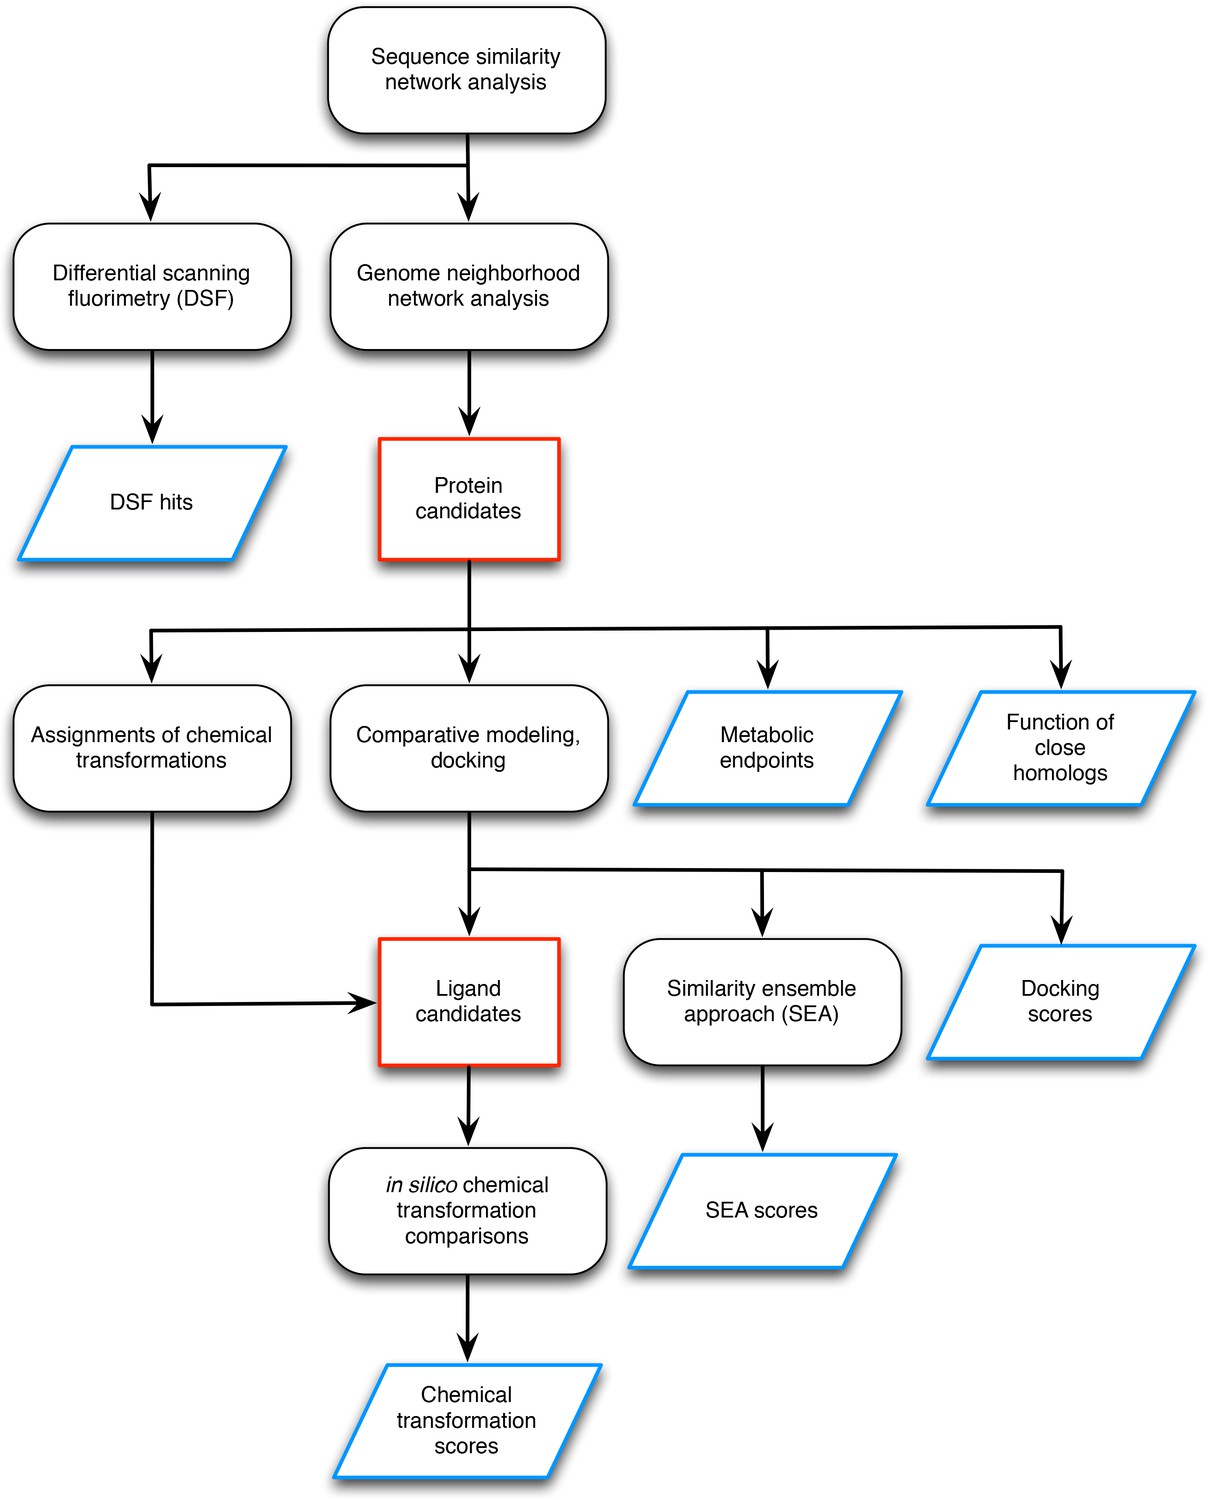
Workflow for preparing input data for the L-gulonate catabolic pathway prediction.
The preparation of the input data entails identification of the candidate proteins and candidate ligands (outlined in red) and the generation of information to be used as scoring restraints (outlined in blue). The initial step was sequence analysis of the TRAP solute binding proteins, and target proteins were identified for follow-up screening by DSF and genome neighborhood analysis (Uniprot ID P71336 and Uniprot ID A7JQX0). Analysis of the genome neighborhood network led to the selection of possible pathway proteins. In this case, the candidate proteins were hypothesized to be involved in sugar catabolism, so metabolic endpoints were selected from intermediates in central metabolism mapped in the KEGG database. The functions of close homologs (>70% sequence identity) were identified, which in this case, included D-mannonate dehydratase. Chemical transformation patterns were inferred by the Pfam annotations of each of the candidate proteins. Structural models of the candidate proteins were created by comparative modeling, and metabolite docking of a large screening library against each of these models was performed. The chemical structures of the metabolites with the top docking scores were compared chemoinformatically to produce SEA scores. With the chemical transformations and docking scores, the metabolite library was filtered down to a smaller set of candidate ligands. For every candidate ligand, each chemical transformation was applied in silico, and the results were compared chemoinformatically with every other candidate ligand to produce chemical transformation scores. This workflow resulted in the following sources of information to be used in scoring: DSF hits, metabolic endpoints, functions of close homologs, docking scores, SEA scores, and chemical transformation scores.
Figure 1—figure supplement 2
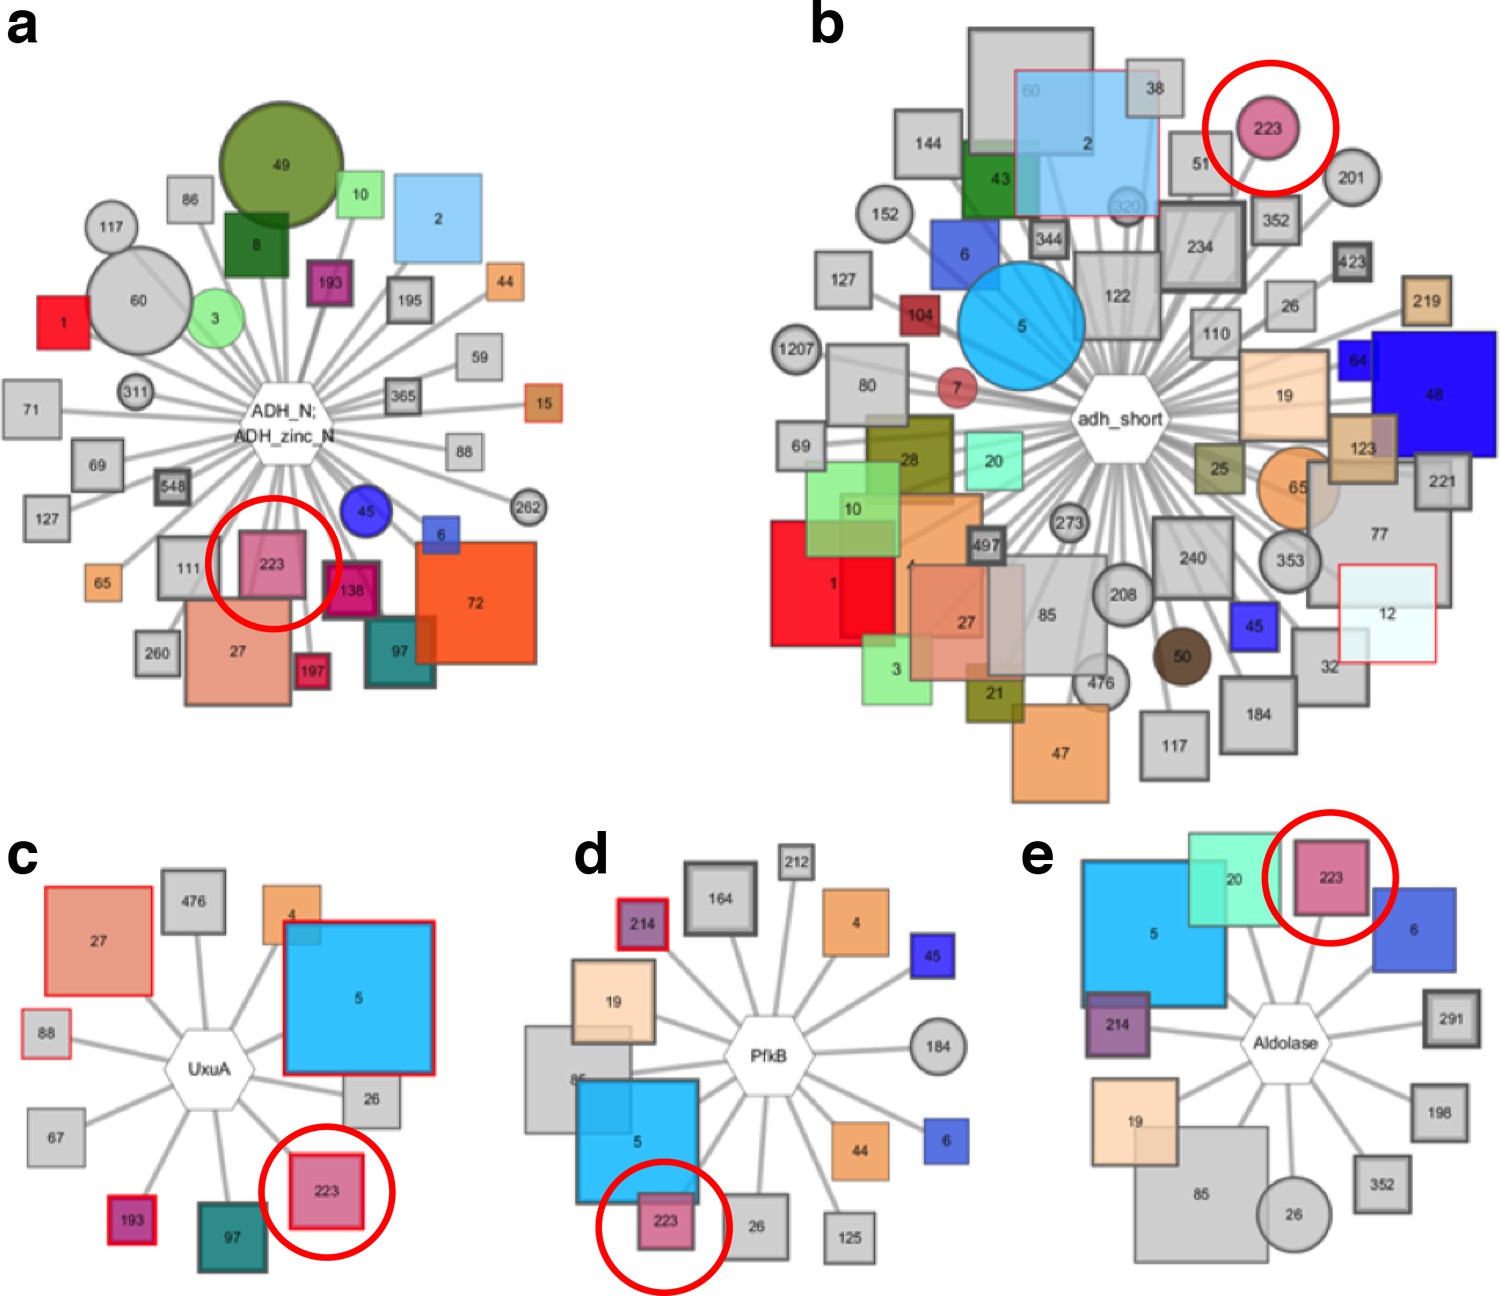
Pfam genome neighborhood network (GNN).
Five enzyme families are extracted from the Pfam GNN, they are identified by cluster 223 in the SSN indicated by red circles. The Pfam families include; (A) alcohol dehydrogenases, (B) short chain dehydrogenases, (C) UxuA family sugar dehydratases, (D) pfkB family carbohydrate kinases, and (E) aldolases.
Figure 1—figure supplement 3

NetIMP cytoscape application for pathway model visualization.
(A) Cytoscape app loads in good-scoring pathway models and displays them as a network built from the union of edges present in the ensemble of models. The automated yFiles hierarchic layout was applied to the network. The thickness of the edge represents the frequency that the edge appears in the ensemble. (B) The slider in the Results Panel can adjust the score cutoff for the models included in the network. In this view, the automated yFiles hierarchic layout is reapplied and singleton nodes are hidden for clarity. (C) An individual model is selected in the Results Panel, and the nodes and edges in the individual model are highlighted in the model’s unique color (in blue, here) on the network. The restraints are represented by the hatched edges connecting nodes corresponding to the restraints. Restraints that are violated in the mode are colored red.
Figure 2 with 1 supplement
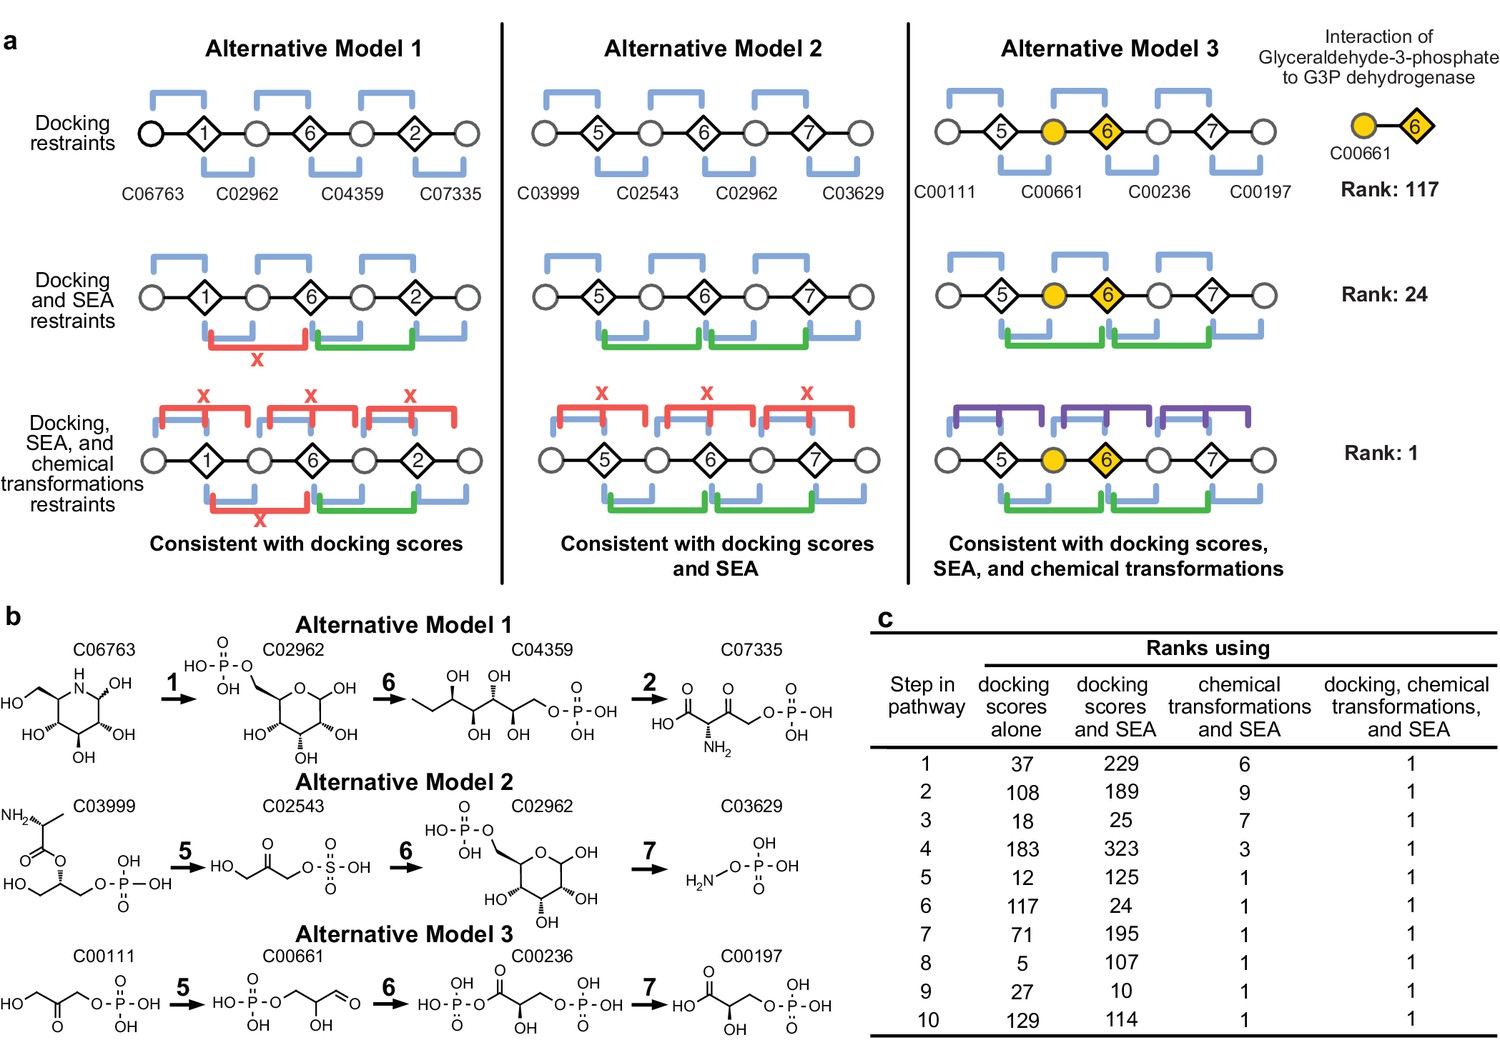
Representation of alternative models obtained based on consistency with input information provided for the glycolysis benchmark pathway.
(A) Example of three alternative models evaluated using different types of restraints based on modeling of the glycolysis pathway with a subset of pathways shown. The restraints on node patterns are shown using colored lines (blue – docking restraints, green – SEA restraints, purple – chemical transformation restraints, red – restraints with unfavorable scores). Metabolites are labeled by KEGG ID and enzymes are labeled by step in glycolysis pathway. On the left, alternate model one is consistent with docking scores, but not with all SEA scores and chemical transformations. In the middle, alternate model two is consistent with the docking scores and SEA scores, but not with chemical transformations. On the right, alternate model three is consistent with docking scores, SEA scores, and chemical transformations, thus increasing the rank of the correct enzyme-substrate pairings. (B) Alternative models shown with chemical structures. (C), Ranks of correct substrate for the corresponding enzyme at each step in the glycolysis benchmark case. 1 – glucokinase, 2 – phosphoglucose isomerase, 3 – phosphofructokinase, 4 – fructose bisphosphate aldolase, 5 – triosephosphate isomerase, 6 – glyceraldehyde 3-phosphate dehydrogenase, 7 – phosphoglycerate 8 – phosphoglycerate mutase 9 – enolase and 10 – pyruvate kinase.
Figure 2—figure supplement 1
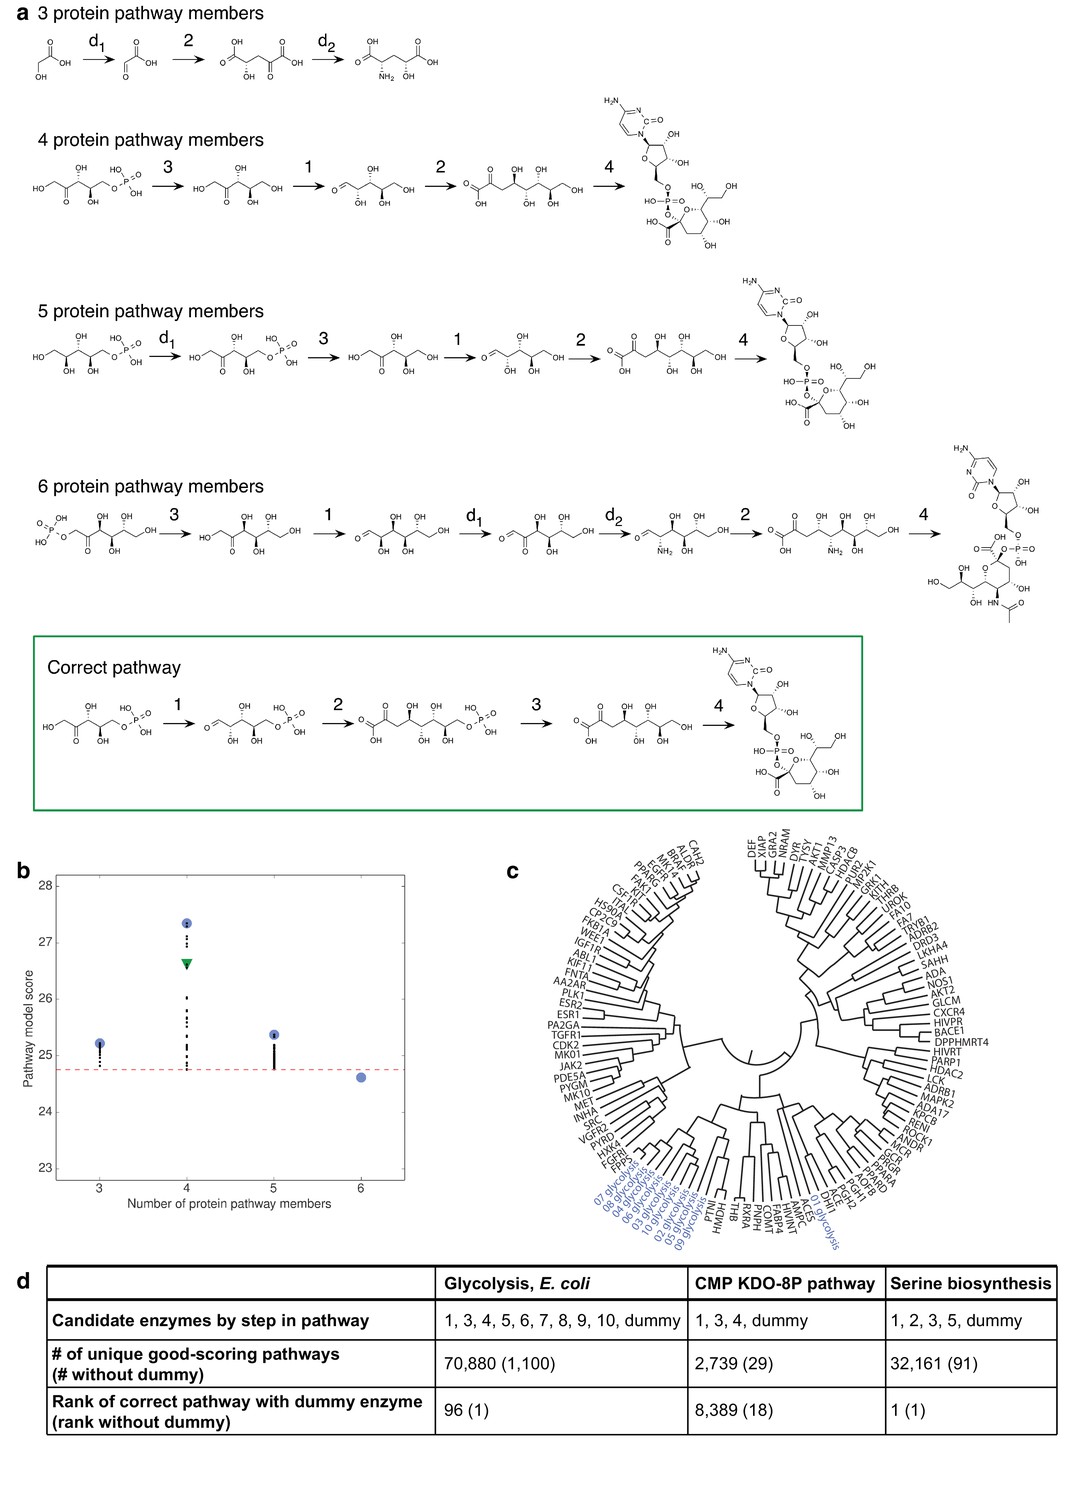
Benchmark assessment for decoy and dummy enzymes.
(A) Two decoy enzymes were included with the four enzymes in the CMP KDO-8P biosynthesis pathway, with lengths from three to six enzymes sampled. Pathway models with the best score for different number of protein pathway members. For comparison, the correct pathway is outlined in green. (B) Scores of pathway models at different pathway lengths. The top-scoring models consisted of the four known CMP KDO-8P pathway enzymes. The best score at each pathway length is shown as a blue circle, the score of the pathway model that matches the correct pathway is shown as a green triangle, and all other scores as black dots. The cutoff for good-scoring models, which is two standard deviations below the best score, is shown as a red dashed line. (C) Enzymes in the same pathway often cluster together in dendrograms constructed based on the SEA score as a distance metric. Such clustering is illustrated for glycolysis here. (D) Assessments of the three benchmark pathways for which the candidate enzyme set is incomplete. In each pathway, one enzyme is replaced with a ‘dummy’ enzyme, for which there is a lack of input information. For serine biosynthesis, the correct pathway remained the top-scoring model. For the other cases, the inclusion of the dummy enzyme lowered the correct pathway ranking, which, nevertheless, remained within the top-scoring models.
Figure 3 with 2 supplements

12 representative predictions of the L-gulonate TRAP-SBP catabolic pathway.
(A) 12 representative pathway models of TRAP SBP pathway predictions ordered by score, starting from the top with the best-scored prediction. The scores of the representative pathways are listed to the right of the corresponding pathway. Pathway enzymes are labeled by numbers as follows: 1 – HiGulD, 2 – HiUxuB, 3 – HiUxuA, 4 – HiKdgK, 5 – HiKdgA. (B) Graphical representation of an ensemble of representative pathway models. The predicted components in the ensemble of pathway models at each position are vertically aligned to the corresponding position in the gray pathway on the top. Ligand components are shown as circle nodes with the color corresponding to the ligand identity. Chemical structures are shown in Figure 3—figure supplement 2. Pathway enzymes are shown as diamond nodes with the same numbering as above. Edges are colored by individual pathway model prediction. The validated prediction is shown by black edges, enzyme nodes are colored black, and substrate/product nodes are outlined in black.
Figure 3—figure supplement 1
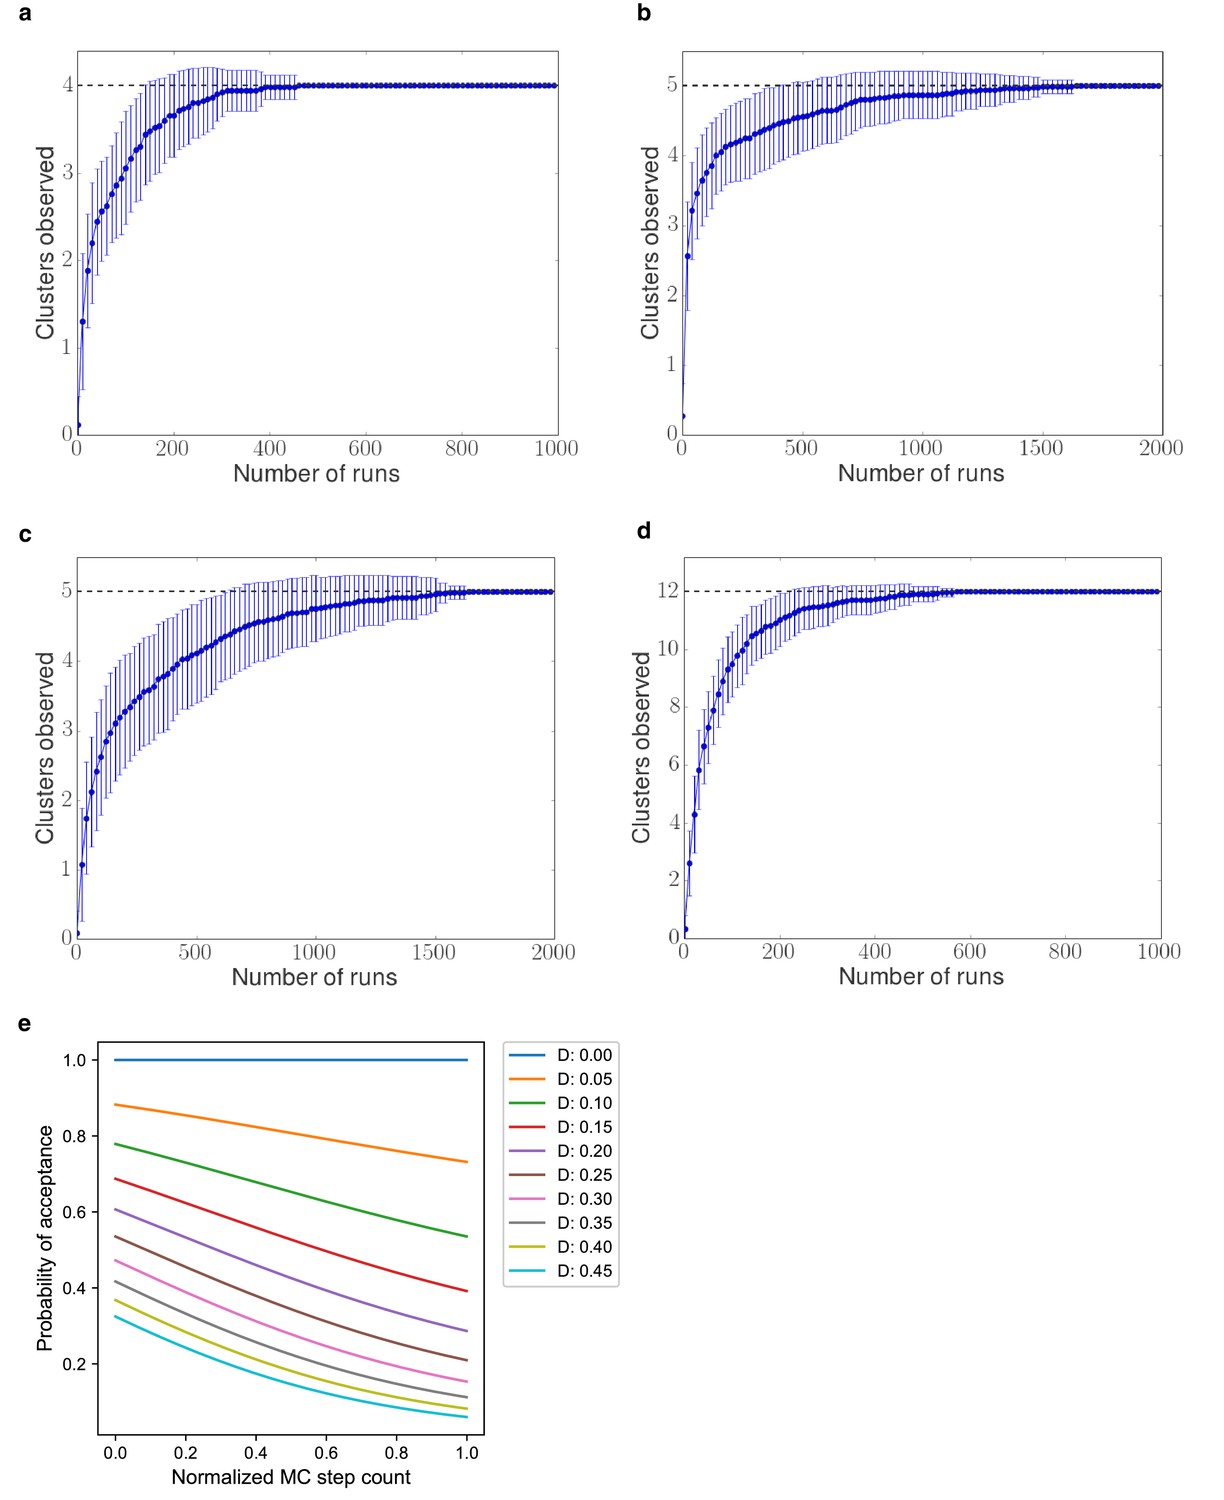
Sampling convergence test.
Independent Monte Carlo sampling runs were performed, and the number of clusters of similar pathways for each number of runs was computed. (A) Glycolysis pathway, (B) CMP KDO-CMP biosynthesis pathway, (C) Serine synthesis pathway, and (D) L-gulonate catabolism pathway. (E) Probability of acceptance at the MC step in a sampling run, where D is the difference between the scores of the current pathway model and the new pathway model.
Figure 3—figure supplement 2
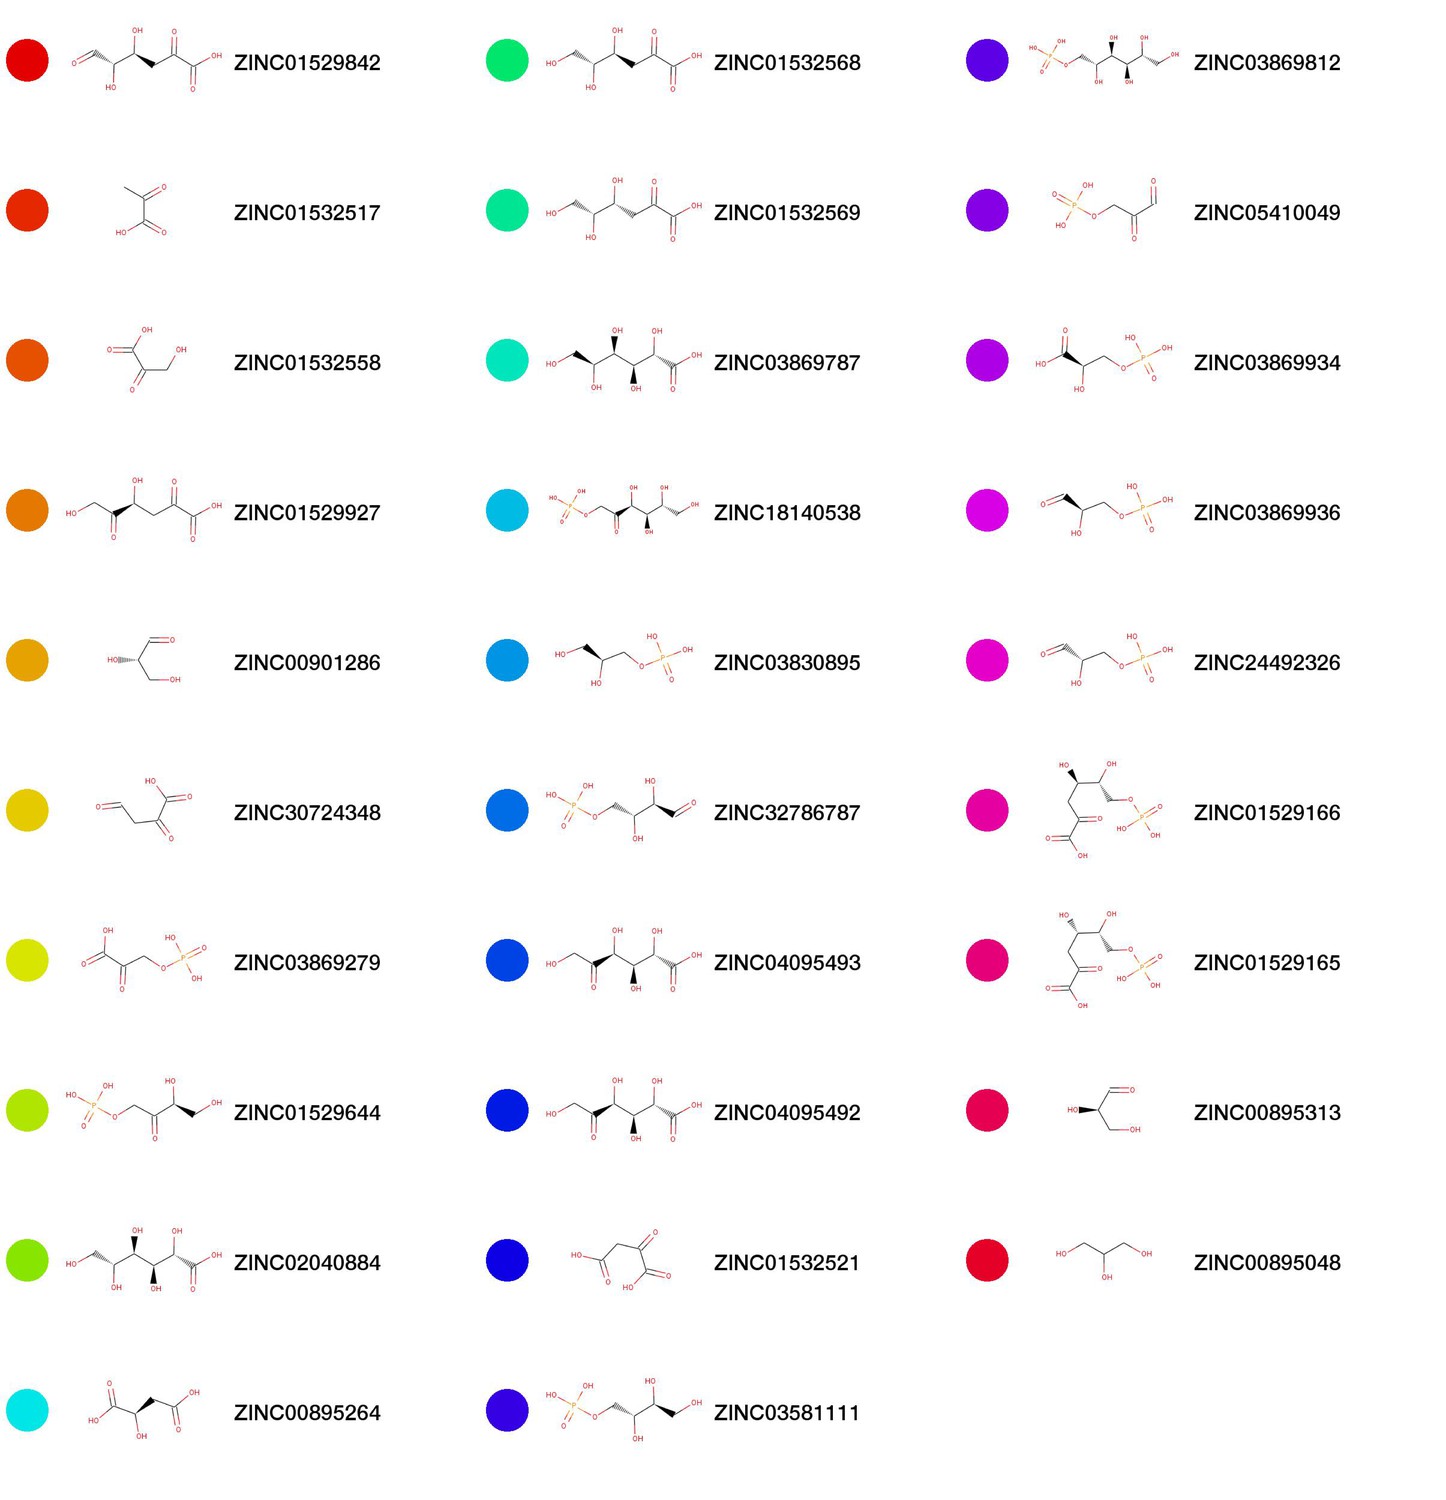
Chemical structures for top scoring pathway model predictions.
The colored nodes correspond to the coloring in Figure 3..
Figure 4 with 2 supplements

Catabolic pathway of H. influenzae Rd KW20.
(A) The best-scoring pathway identified using the integrative mapping approach is annotated with experimental evidence: enzyme activity (blue), fitness growth determinants (red), transcript analyses on L-gulonate media (orange), atomic structure (green), and isotopic metabolic labeling (purple). The pathway demonstrates L-gulonate degradation into glyceraldehyde 3-phosphate and pyruvate. Bonds undergoing changes in the subsequent steps are colored in red. (B) Kinetics of pathway enzymes on predicted substrates. (C) Crystal structure of L-gulonate bound to SBP TRAP (PDB ID: 4PBQ). (D) Knockout growth assays of H. influenzae strains, ΔGulP (gulonate transporter periplasmic subunit) and ΔGulD (L-gulonate dehydrogenase), when grown on D-glucose vs. L-gulonate as a sole carbon source. (E) Fold change in expression for each gene when grown on the indicated carbon source, relative to growth on glucose. Error bars indicate one standard deviation for three biological replicates.
Figure 4—figure supplement 1

Isotopic labeling of L-gulonate as sole carbon source.
(A) Time-dependent labeling of central metabolites utilizing 50% U-13C-L-gulonate as sole carbon source. 3 PG (3-phosphoglycerate). PEP (phosphoenolpyruvate). (B) Time-dependent labeling of fructuronate utilizing 50% U-13C-L-gulonate as sole carbon source. (C) The catalysis of L-gulonate (orange) enters central metabolism (blue) of Hemophilus influenzae str. Rd KW20 at glyceraldehyde 3-phosphate and pyruvate. This metabolic network also outlines the truncated TCA cycle found in Hemophilus influenza (Othman et al., 2014). Metabolites detectable via GC-MS are marked with an asterisks (*).
Figure 4—figure supplement 2
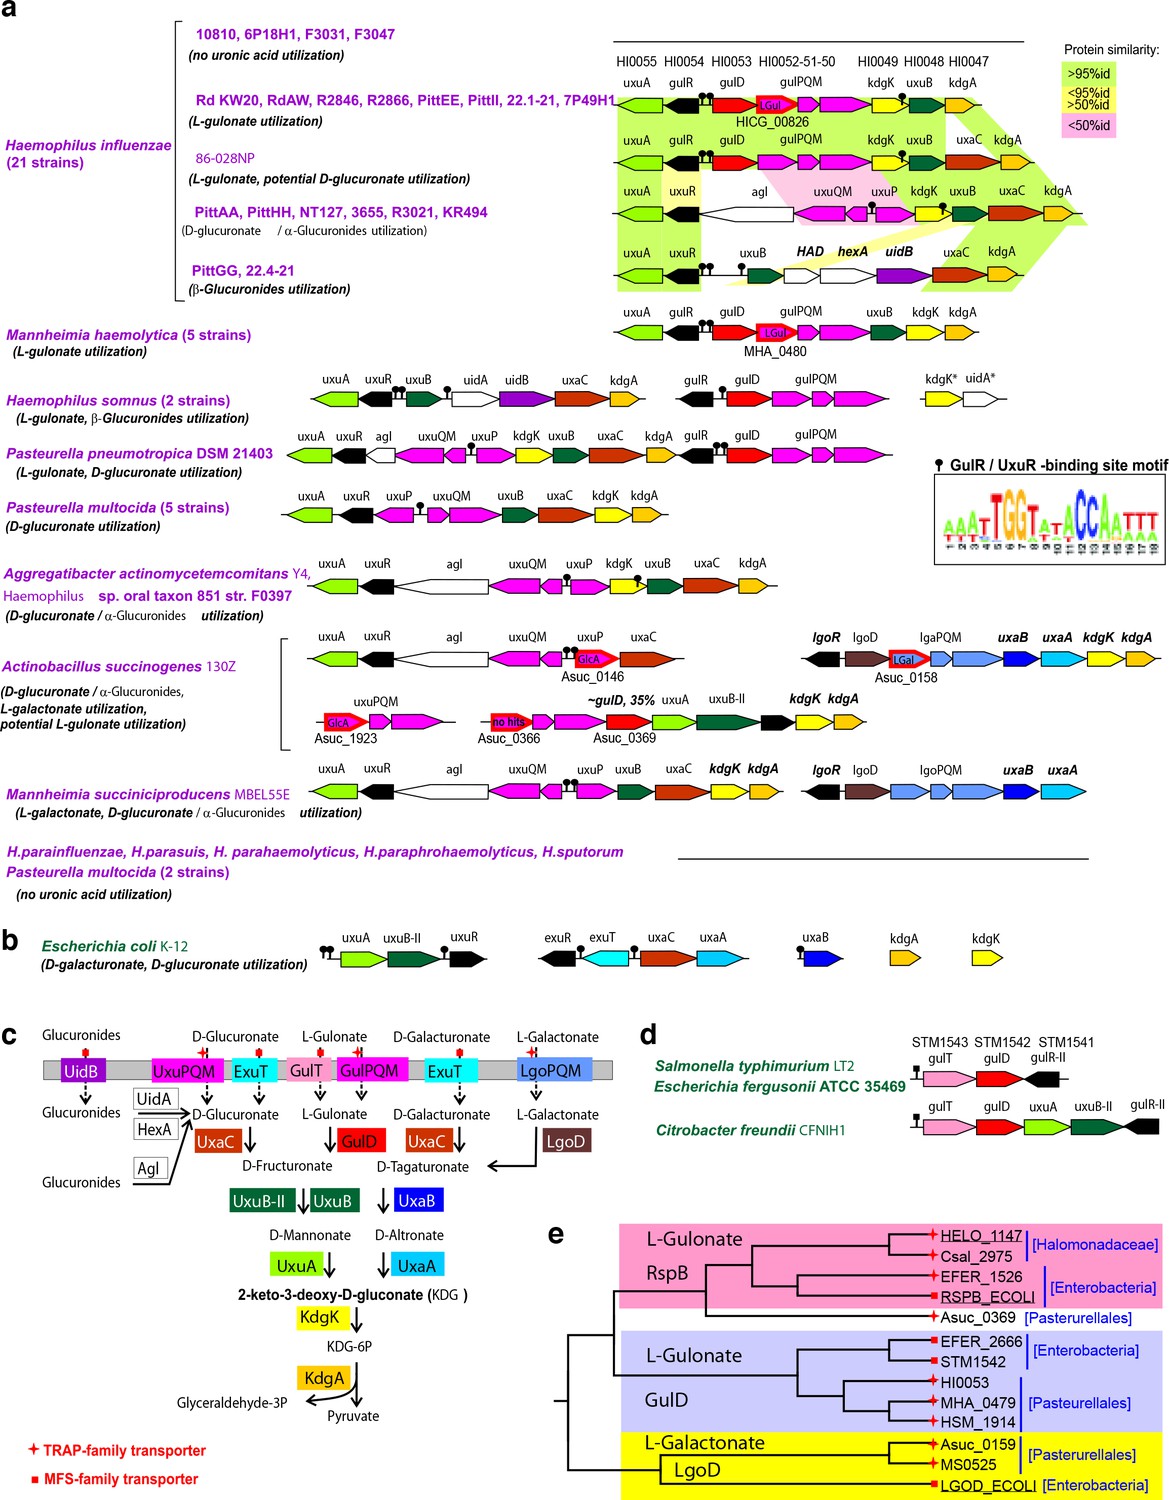
Comparative genomic reconstruction of L-gulonate and related uronic acid catabolic pathways and regulons in gammaproteobacteria.
(A) Genomic context of L-gulonate, D-glucuronate, and L-galactonate utilization genes and regulons in 45 bacteria from the Pasteurellales lineage. The L-gulonate catabolic pathway from H. influenzae Rd KW20 was projected onto the pathogenic gammaproteobacteria, using the subsystems approach in the SEED genomic platform (Overbeek et al., 2005). Analysis of the adjacent metabolic pathways for use of hexuronates (D-glucuronate, D-galacturonate) and another 6-carbon aldonic acid (L-galactonate) revealed that the signature enzymes for the L-gulonate and the D-glucuronate (GlcA) pathways are the L-gulonate dehydrogenase; the GulD and the GlcA isomerases; and UxaC, respectively. Predicted sugar utilization phenotypes are given in parentheses. Among 21 analyzed strains of H. influenzae, 17 strains possess the uronate catabolic genes. Genes with the same functional roles are marked in matching colors. Pairwise similarity between orthologs in different H. influenzae strains is highlighted by light green (>95% protein identity), yellow (>50%), and pink (<50%). Tripartite TRAP transporters are shown by magenta arrows. Experimentally defined specificities of TRAP SBPs are indicated for gulP/uxuP/lgoP (LGul, L-gulonate, GlcA, D-glucuronate, LGal, L-galactonate), these genes are outlined in red and their locus tags are given below. Transcriptional regulators are shown by black arrows. Predicted DNA-binding sites of GulR and UxuR regulators are shown by black pins, and their common DNA motif is shown as a logo. For reconstruction of UxaR and GulR regulons, we used an established comparative genomics approach, based on identification of candidate regulator-binding sites using RegPredict tool (Novichkov et al., 2010). LGul pathway gene organization is conserved in 8 out of 21 hr. influenza strains into a single genetic locus containing two divergently transcribed operons, gulD-gulPQM-kdgK-uxuB-kdgA and gulR-uxuA, that are controlled by candidate GulR-binding sites in their common promoter region. Glucuronide hydrolases from different families are shown by white arrows. (B) Genomic context of D-glucuronate and D-galacturonate utilization genes and regulons in E. coli K-12. (C) Reconstructed metabolic pathways for utilization of hexuronic and aldonic acids. Solid and broken arrows indicate enzymatic reactions and transport, respectively. The TRAP and MFS transporter families are indicated by red stars and squares, respectively. (D) Genomic context of GulD orthologs in Enterobacteria. The uncharacterized genes gulT and gulR-II encode a novel MFS-transporter and a GntR-family regulator that are likely specific to L-gulonate. (E) Phylogenetic tree for selected zinc-dependent dehydrogenases from the COG1063 family. The analyzed GulD orthologs from the Pasteurellales and Enterobacteria are 62% identical to each other, while within the Pasteurellales lineage all GulDs are >70 identical. The previously characterized L-gulonate-specific dehydrogenases from E. coli K-12 and Halomonas spp. (Wichelecki et al., 2014) belong to the RspB branch, which is distinct from the GulD branch established in this work.
Tables
Key resources table
| Reagent type (species) or resource | Designation | Source or reference | Identifiers | Additional information |
|---|---|---|---|---|
| Gene (Haemophilus influenzae) | UxuA | This paper, pNYCOMPSC-tagless HiUxuA vector | Uniprot:P44488 | See Supplementary file 7. cloned into the C-terminal TEV cleavable 10x-Histag containing vector pNYCOMPS-LIC-TH10- ccdB (C-term) such that the tag is out of frame |
| Gene (H. influenzae) | GulD | This paper, pNYCOMPSC-tagless HiGulD vector | Uniprot:Q57517 | See Supplementary file 7. cloned into the C-terminal TEV cleavable 10x-Histag containing vector pNYCOMPS-LIC-TH10- ccdB (C-term) such that the tag is out of frame |
| Gene (H. influenzae) | KdgK | This paper, HiKdgK-pSGC-His vector | Uniprot:P44482 | See Supplementary file 7. cloned into the N-terminal TEV cleavable 6x-Histag containing vector pNIC28-Bsa4 |
| Gene (H. influenzae) | UxuB | This paper, HiUxuB-pSGC-His vector | Uniprot:P44481 | See Supplementary file 7. cloned into the N-terminal TEV cleavable 6x-Histag containing vector pNIC28-Bsa4 |
| Gene (H. influenzae) | KdgA | This paper, HiKdgA-pSGC-His vector | Uniprot:P44480 | See Supplementary file 7. cloned into the N-terminal TEV cleavable 6x-Histag containing vector pNIC28-Bsa4 |
| Gene (H. influenzae) | GulP | This paper | Uniprot:P71336 | See Supplementary files 8 and 9 |
| Gene (H. influenzae) | GulQ | This paper | Uniprot:P44484 | See Supplementary files 8 and 9 |
| Gene (H. influenzae) | GulM | This paper | Uniprot:P44483 | See Supplementary files 8 and 9 |
| Gene (H. influenzae) | UxuR | This paper | Uniprot:P44487 | See Supplementary files 8 and 9 |
| Oligonucleotide (H. influenzae) | UxuA, UxuR, GulD, GulP, GulQ, GulM, KdgK, UxuB, KdgA, Hflu | This paper | See Supplementary file 8. qRT-PCR oligonucleotide sequences used for gene expression profiling | |
| Strain, strain background (H. influenzae Rd KW20) | H. flu | https://www.atcc.org | ATCC 51907 | Supplementary file 9. Genetic deletion mutants of the putative L-gulonate catabolism pathway in H. influenzae Rd KW20 |
| Genetic reagent (H. influenzae) | ∆GulP | This paper | Supplementary file 8. Genetic deletion mutants of the putative L-gulonate catabolism pathway in H. influenzae Rd KW20 | |
| Genetic reagent (H. influenzae) | ∆GulD | This paper | Supplementary file 8. Genetic deletion mutants of the putative L-gulonate catabolism pathway in H. influenzae Rd KW20 | |
| Transfected construct (E. coli BL21 (DE3) | BL21 (DE3) E. coli containing the pRIL plasmid | Stratagene | Growth media contain 25 μg/mL Kanamycin or 100 μg/mL Carbomycin and 34 μg/mL Chloramphenicol | |
| Commercial assay or kit | RNAprotect Bacteria Reagent | Qiagen | Cat No./ID: 76506 | |
| Commercial assay or kit | RNeasy Mini Kit | Qiagen | Cat No./ID: 74104 | |
| Commercial assay or kit | ProtoScript First Strand cDNA Synthesis Kit | New England BioLabs | Cat No./ID: E6300S | |
| Chemical compound, drug | 2-keto-3-deoxy-D- gluconate | Enzymatically synthesized | CAS: 17510-99-5 | Enzymatic synthesis by D-mannonate dehydratase (Uniprot ID B0T0B1). Verified via 1H-NMR |
| Chemical compound, drug | 2-keto-3-deoxy-D- gluconate-6- phosphate | Enzymatically synthesized | CAS: 884312-23-6 | Enzymatic synthesis by D-mannonate dehydratase (Uniprot ID B0T0B1) and 1 μM 2-keto-3-deoxy-D-gluconate kinase (Uniprot ID A4XF21). Verified via 1H-NMR |
| Software, algorithm | Integrative Pathway Mapping | This paper | https://github.com/salilab/pathway_mapping | The source code for the IMP program, benchmark, input scripts files, and output files for the benchmark and the gulonate pathway calculations are available here(50) |
| Software, algorithm | IMP program | Russel D, et al, Putting the pieces together: integrative structure determination of macromolecular assemblies. PLoS Biology. 10(1):e1001244, 2012 | http://integrativemodeling.org | Integrative modeling |
| Software, algorithm | MODELLER | B. Webb, A. Sali. Comparative Protein Structure Modeling Using Modeller. Current Protocols in Bioinformatics, John Wiley & Sons, Inc., 5.6.1- 5.6.32, 2014. | https://salilab.org/modeller/ | Comparative modeling |
| Software, algorithm | DOCK3.6 | Mysinger MM, Shoichet BK. Rapid context-dependent ligand desolvation in molecular docking. J Chem Inf Model. 50(9):1561-73, 2010. | http://dock.compbio.ucsf.edu/ | Docking |
| Software, algorithm | Automated version DOCK3.6 | Irwin JJ, et al. Automated Docking Screens: A Feasibility Study. J. Med. Chem. 52(18)5712–5720, 2009. | http://blaster.docking.org/ | Docking |
| Software, algorithm | Similarity Ensemble Approach (SEA) | Keiser MJ, et al. Relating protein pharmacology by ligand chemistry. Nat Biotechnol. 25(2): 197-206, 2007. | http://sea.bkslab.org/ | SEA chemo-informatic calculations |
| Software, algorithm | OpenEye Scientific Software | OpenEye Scientific Software I. OEChem. 2.0.2 ed2014. | https://www.eyesopen.com/ | In silico chemical transformations |
| Software, algorithm | RDKit | Landrum G. RDKit: Open-source cheminformatics. Release_2016.03.1 ed2016 | http://www.rdkit.org/ | Chemical similarity calculations |
| Software, algorithm | EFI-EST | Gerlt JA, et al. Enzyme Function Initiative-Enzyme Similarity Tool (EFI-EST): A web tool for generating protein sequence similarity networks. Biochim. Biophys. Acta. 1854(8):1019- 1037, 2015. | http://efi.igb.illinois.edu/efi-est/index.php | Genome neighborhood networks |
| Software, algorithm | Pythoscape v1.0 | Barber AE, Babbitt PC. Pythoscape: a framework for generation of large protein similarity networks. Bioinformatics. 28(21):2845- 2846, 2012. | http://www.rbvi.ucsf.edu/trac/Pythoscape | Sequence similarity networks |
| Software, algorithm | Cytoscape v3.4 | Shannon P, et al. Cytoscape: a software environment for integrated models of biomolecular interaction networks. Genome Res. 13(11):2498-504, 2003. | http://www.cytoscape.org/ | Network visualization |
Additional files
-
Supplementary file 1
Benchmark pathways.
Three well characterized pathways were used for benchmarking of the integrative pathway mapping: glycolysis (10 enzymes) (Kalyanaraman and Jacobson, 2010), cytidine monophosphate 3-deoxy-D-manno-octulosonate 8-phosphate (CMP KDO-8P) biosynthesis (four enzymes), and serine biosynthesis (five enzymes).
- https://doi.org/10.7554/eLife.31097.014
-
Supplementary file 2
Substrate and product ranks by enzyme using virtual screening and integrative pathway mapping for benchmark and prospective pathway construction.
The number of candidate ligands as input is 3650 for the L-gulonate catabolic pathway. The ranks from individual docking runs are determined by docking score for an enzyme. The ranks by the integrative approach are determined from the relative frequency of ligand-enzyme pairs in the ensemble of high-scoring pathway models. This frequency is then used to order ligands for a given enzyme.
- https://doi.org/10.7554/eLife.31097.015
-
Supplementary file 3
DSF screening of a library of 189 compounds (Vetting et al., 2015) indicating ligands that stabilized thermal denaturation of SBPs.
The ΔTm for each ligand was calculated as the difference of the Tm values measured with a ligand and without ligand for SBS from Haemophilus influenzae RdAW and Mannheimia haemolytica PHL213 (GulP: 82% sequence identity).
- https://doi.org/10.7554/eLife.31097.016
-
Supplementary file 4
Central carbon metabolism compound set.
- https://doi.org/10.7554/eLife.31097.017
-
Supplementary file 5
Structural models for virtual screening and chemical transformations of enzymes in benchmark pathways.
- https://doi.org/10.7554/eLife.31097.018
-
Supplementary file 6
Structural models for virtual screening and chemical transformations of proteins in L-gulonate catabolic pathway.
- https://doi.org/10.7554/eLife.31097.019
-
Supplementary file 7
Primer sequences used for cloning genes in L-gulonate catabolic pathway.
- https://doi.org/10.7554/eLife.31097.020
-
Supplementary file 8
qRT-PCR oligonucleotide sequences used for gene expression profiling.
- https://doi.org/10.7554/eLife.31097.021
-
Supplementary file 9
Genetic deletion mutants of the putative L-gulonate catabolism pathway in H. influenzae Rd KW20 were generated with the following oligonucleotide sequences.
- https://doi.org/10.7554/eLife.31097.022
-
Transparent reporting form
- https://doi.org/10.7554/eLife.31097.023
Download links
A two-part list of links to download the article, or parts of the article, in various formats.
Downloads (link to download the article as PDF)
Open citations (links to open the citations from this article in various online reference manager services)
Cite this article (links to download the citations from this article in formats compatible with various reference manager tools)
Prediction of enzymatic pathways by integrative pathway mapping
eLife 7:e31097.
https://doi.org/10.7554/eLife.31097


