Output variability across animals and levels in a motor system
- Emory University, United States
- California State University, United States
- Georgia Gwinnett College, United States
Figures
Figure 1 with 2 supplements
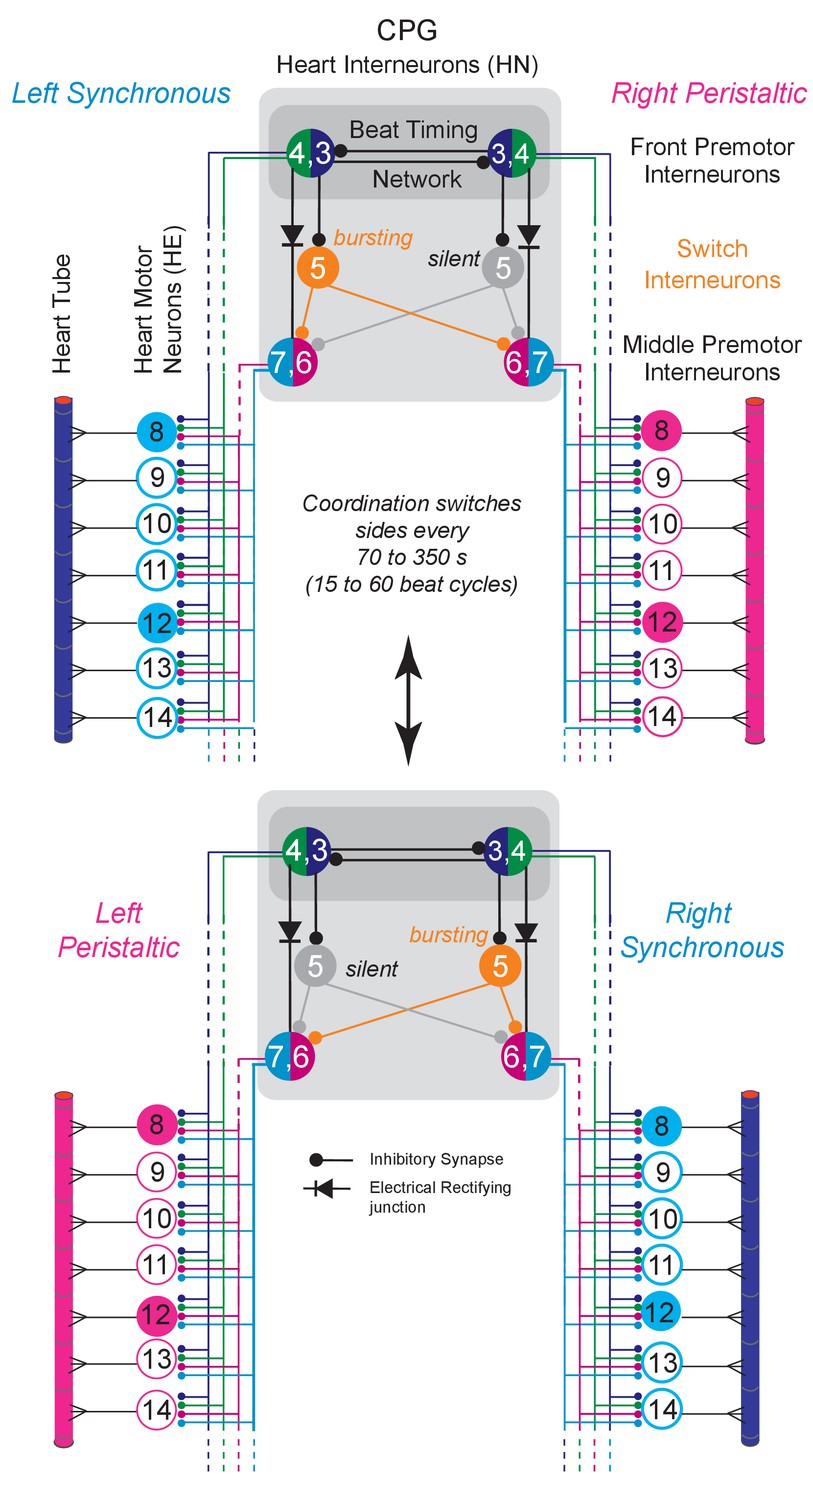
The Leech Heartbeat System switches between two coordination states.
Circuit diagram including the bilateral homologous pairs of the relevant heart (HN) interneurons of the core CPG, the heart (HE) motor neurons and the heart tube segments of midbody ganglia 8 to 14. Large colored circles are cell bodies and associated input processes. Cells with similar input and output connections and function share a circle. Lines indicate cell processes, small circles indicate inhibitory chemical synapses, diodes electrical connections. The HN interneurons of ganglia 3 and 4 (HN(R/L,3) and HN(R/L,4) are part of the beat timing network and make mutual inhibitory connections. The HN(R/L,1,2) coordinating interneurons of the timing network are not illustrated for simplicity. Four pairs of premotor HN interneuron (front premotor interneurons: HN(3) and HN(4); middle premotor interneurons HN(6) and HN(7)) make inhibitory connections to all ipsilateral HE motor neurons shown here (HE(8) to HE(14)). The two bilateral heart tubes, which run the length of the animal, form the motor plant. Each individual heart segment is entrained by phasic excitatory input from its ipsilateral segmental HE motor neuron. The entire heartbeat system switches between two coordination states, left rear-to-front peristaltic/right synchronous and vice versa (peristaltic magenta, synchronous blue) about every 70 to 350 s (15 to 60 beat cycles). The two intersegmental coordination states of interneurons, motor neurons and hearts are set up by interactions between the timing network’s front premotor interneurons and the middle premotor interneurons linked by the switch HN interneurons of segment 5 (HN(R/L,5)) and by direct electrical connections. On the synchronous side the switch interneuron HN(5) (ochre) bursts with the beat timing but the HN(5) on the peristaltic side is silent (greyed out). Note that the switch interneurons make bilateral connections to the middle premotor interneurons and that phasing in these CPG premotor interneurons is dominated by the single active switch interneuron. Switches (double-headed vertical arrow) in coordination state occur when the silent switch interneuron starts to burst and the bursting switch interneuron simultaneously becomes silent. The CPG switches between left synchronous/right peristaltic (top) and left peristaltic/right synchronous (bottom) states of coordination.
Figure 1—figure supplement 1
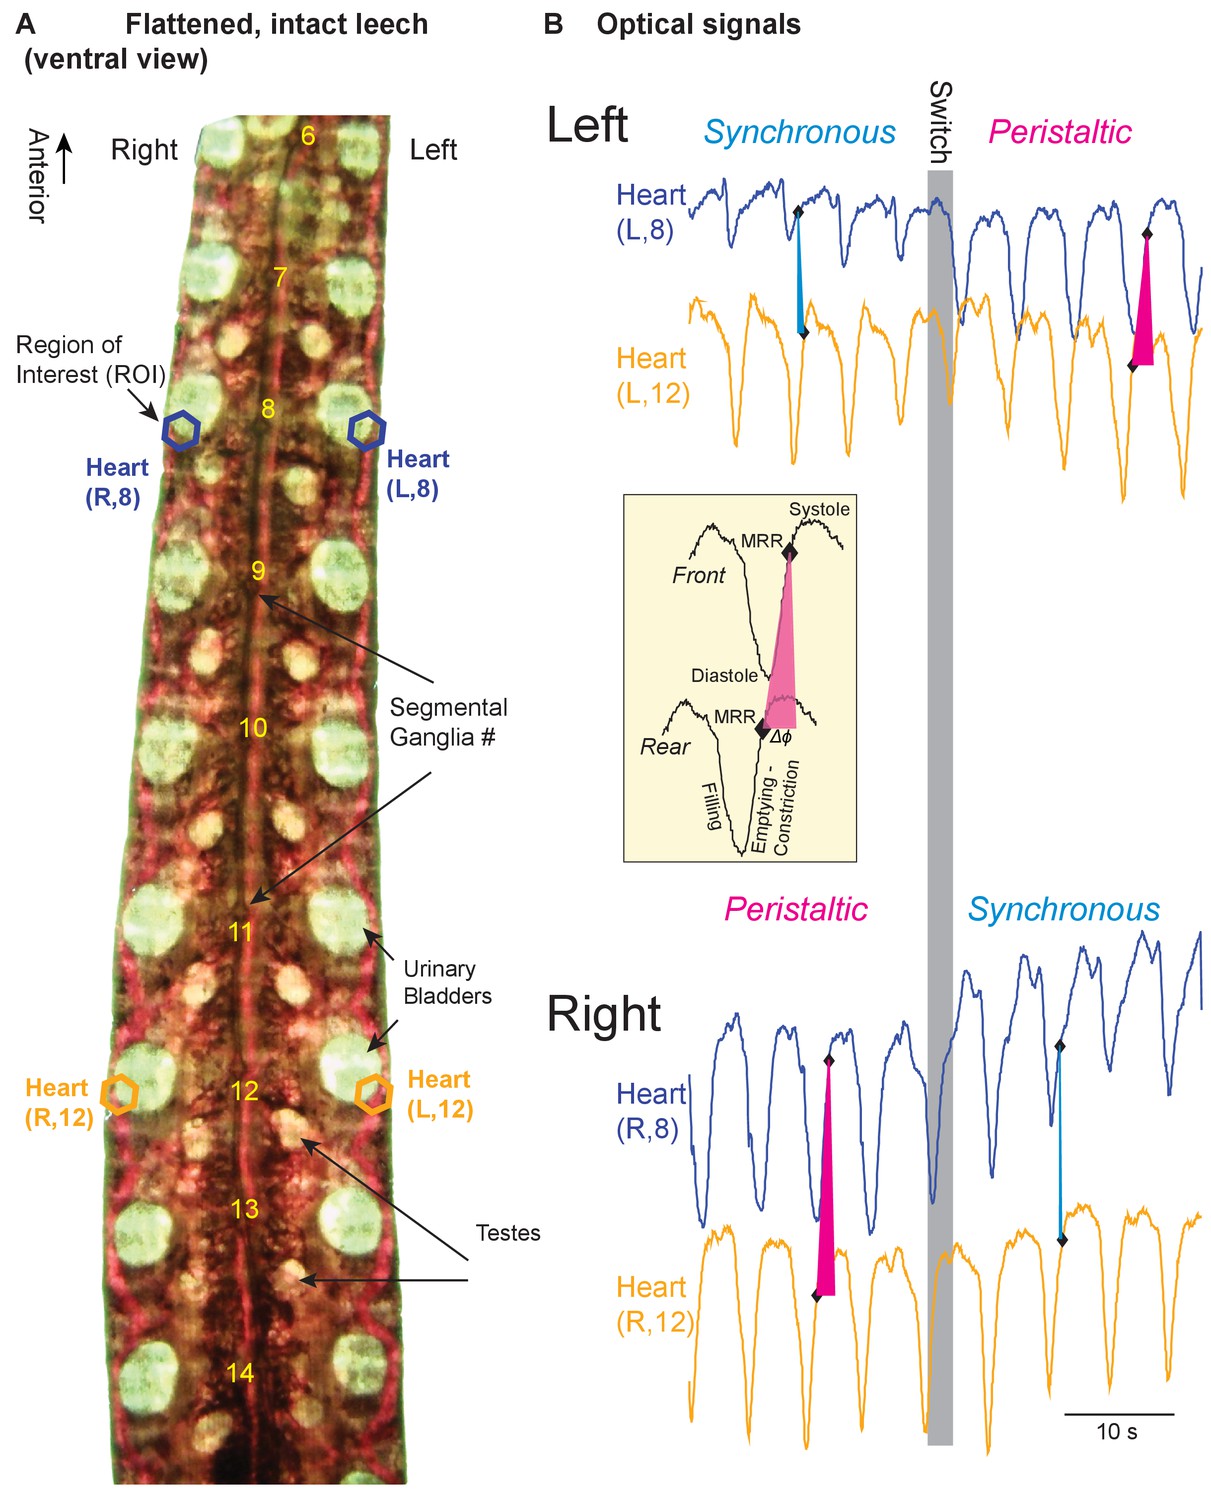
Imaging the hearts and analyzing the bilateral beat pattern of adult leeches in vivo.
(A) Ventral view of a flattened, intact leech illuminated from below. Regions of interest (ROIs; polygons) were placed over similar sections of the hearts in segments 8 and 12 on both sides, yielding 2 pairs of digitized optical signals. Still from Figure 1—video 1. (B) Digitized optical signals for heart segments 8 and 12 are shown for the same animal as in Figure 1—video 1 over a switch (grey bar) in coordination state. The inset illustrates key points on the optical signals for one heartbeat cycle. Phase marker for constriction is its maximum rate of rise (MRR) (Wenning et al., 2014). Initially, the left side (top recording) is synchronous with hearts (8) and (12) constricting almost at the same time (blue triangles connect the MRRs), while the right side (bottom recording) is peristaltic with heart (8) constricting before heart (12) (pink triangles connect the MRRs). After the switch, the corresponding relation between the MRRs pertain. Animal Group: ‘Intact Animal Database’, Figure 2—figure supplement 1D.
Figure 1—video 1
Ventral view of a flattened, intact leech illuminated from below (same animal as in Figure 1—figure supplement 1, anterior is to the left).
Midbody segments 6 to 15 are visible. Initially, the left (top) side is in peristaltic coordination with blood moving through the tubular heart in a rear-to-front peristaltic wave, and the right side in synchronous coordination with the heart segments constricting almost synchronously. A switch in coordination state occurs after about 20 s.
Figure 2 with 1 supplement
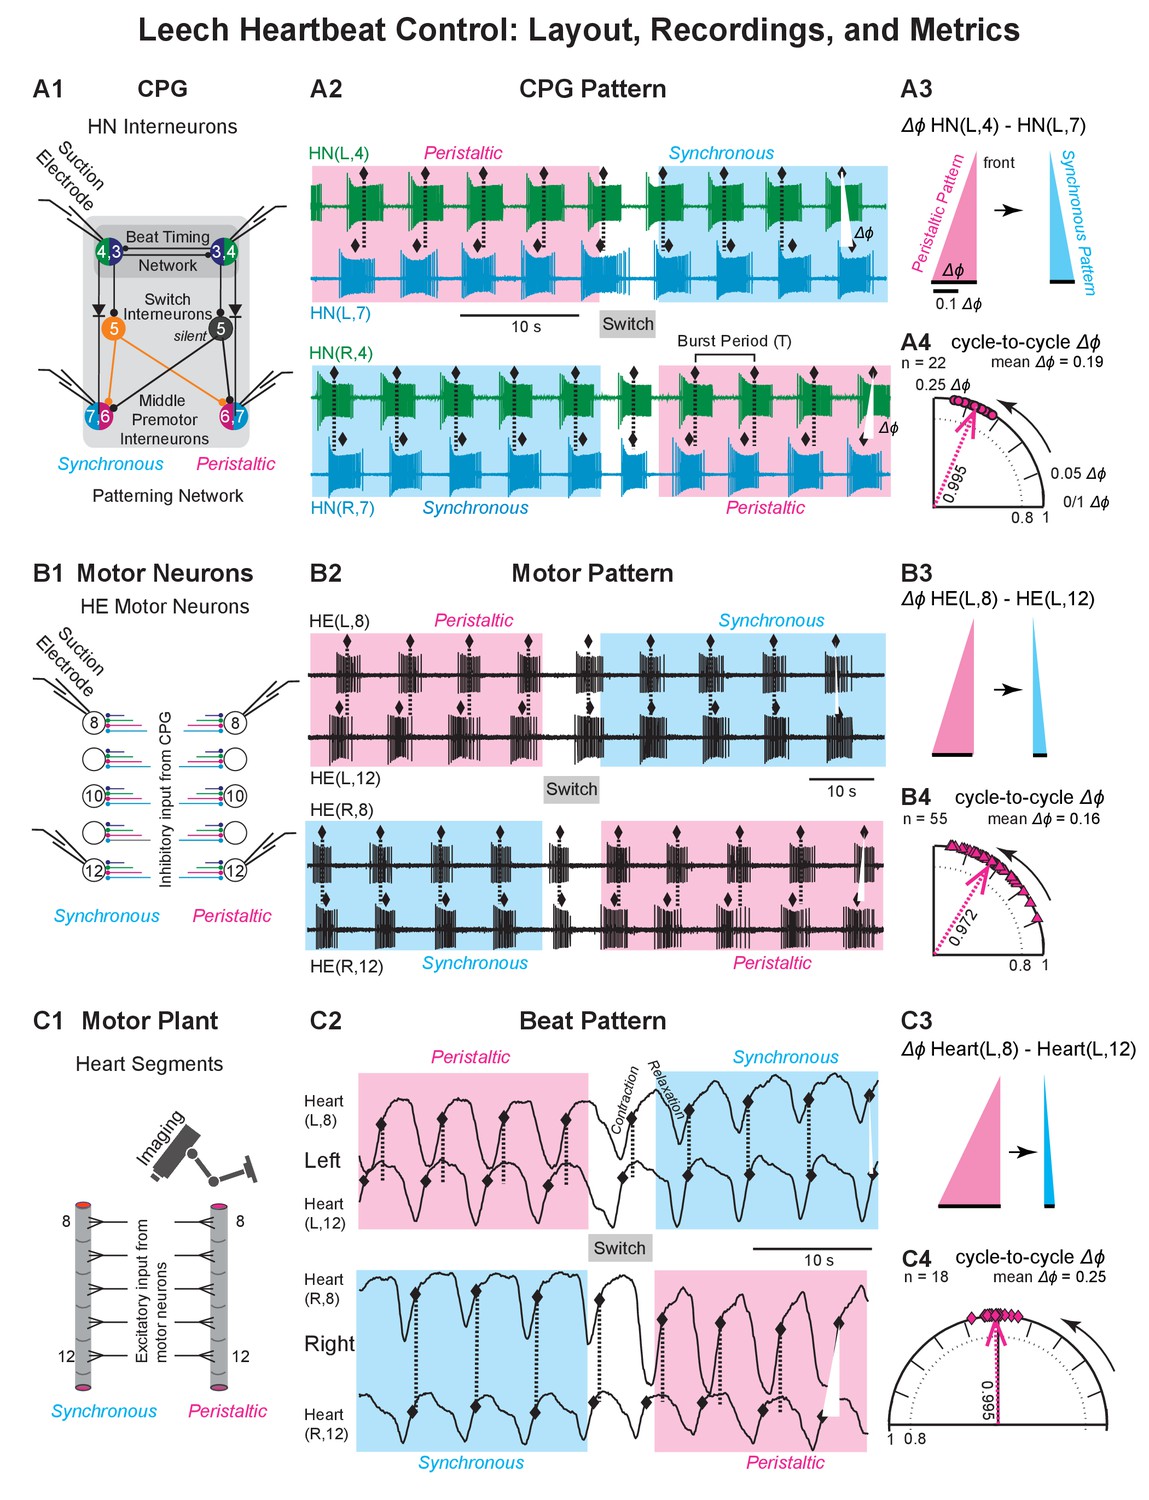
Recordings of the CPG pattern, the motor pattern, and the beat pattern.
(A1, B1, C1) Recording sites and methods for all levels of the heartbeat control system. (A2, B2, C2) Recordings for all levels of the heartbeat control system. (A3, B3, C3) The base of the triangle represents the intersegmental phase differences (Δϕ) between the front segment and the rear segment in the two coordinations (left side). (A4, B4, C4) Circular phase plots illustrate the cycle-to-cycle variability in peristaltic coordination (left side). The vector length (value next to each vector) was used to calculate the angular variance (s2 = 2(1 r)). Longer vectors indicate less variance. (A1) Suction electrodes were placed on the left and right HN(4) and HN(7) interneurons. (A2) Simultaneous extracellular recordings from these four premotor HN interneurons across a switch in coordination state (top: left heart interneurons; HN(L,4) and HN(L,7); below: right heart interneurons (HN(R,4) and HN(R,7)). Phase marker (♦) is the middle spike in each burst. Dashed lines and white triangles aid in assessing the phase differences between the two interneurons in the two coordinations. Initially, the left side is peristaltic (magenta shaded box) and the right side is synchronous (light blue shaded box). State switches midway. (A3) Colored triangles illustrate the average intersegmental Δϕ (black bars) between the ipsilateral pair of HN interneurons in the peristaltic (magenta) and synchronous (light blue) coordinations of the recording of (A2). (A4) The circular phase plot shows the cycle-to-cycle variability in peristaltic coordination for the recording of (A2). Each circle represents the Δϕ between the two ipsilateral HN interneurons of one burst cycle (n = 22 bursts, mean Δϕ = 0.19). (B1) Suction electrodes were placed on the left and right HE(8) and HN(12) motor neurons. (B2) Simultaneous extracellular recordings from these four heart motor neurons across a switch in coordination state (top, left motor neurons HE(L,8) and HE(L,12); below, right motor neurons (HE(R,8) and HE(R,12)). Phase marker (♦) is the middle spike in each burst. Labeling as in (A2). Initially, the left side is peristaltic and the right side is synchronous. State switches midway. (B3) Labels as in (A3). (B4) The circular phase plot shows the cycle-to-cycle variability in peristaltic coordination for the recording of (B2). Each triangle represents the Δϕ between the two ipsilateral heart motor neurons for one burst cycle (n = 55 bursts, mean Δϕ = 0.16). Labeling as in (A4). Phase scale bars as in (A3). (C1) Video imaging of intact animals yielded optical signals to extract the constriction/relaxation cycles for both hearts in multiple segments. (C2) The beat cycles of two bilateral pairs of heart segments are shown across a switch in coordination state (top: Heart (L,8) and Heart (L,12); below: Heart (R,8) and Heart (R,12)). Phase marker (♦) is the maximum rate of rise (MRR) during the constriction (Wenning et al., 2014). Initially, the left side is peristaltic and the right side is synchronous. State switches midway. (C3) Labels as in (A3). (C4) The circular phase plot shows the cycle-to-cycle variability in peristaltic coordination for the video recording of (C2). Each diamond represents the Δϕ between the two ipsilateral heart segments for one beat cycle (n = 18 beats, mean Δϕ = 0.25). Labeling as in (A4) Phase scale bars as in (A3). Data from the animal shown in Figure 1—video 1. Animal Groups: Bilateral Recordings (Figure 2—figure supplement 1C) and Intact Animal Database (Figure 2—figure supplement 1D).
Figure 2—figure supplement 1
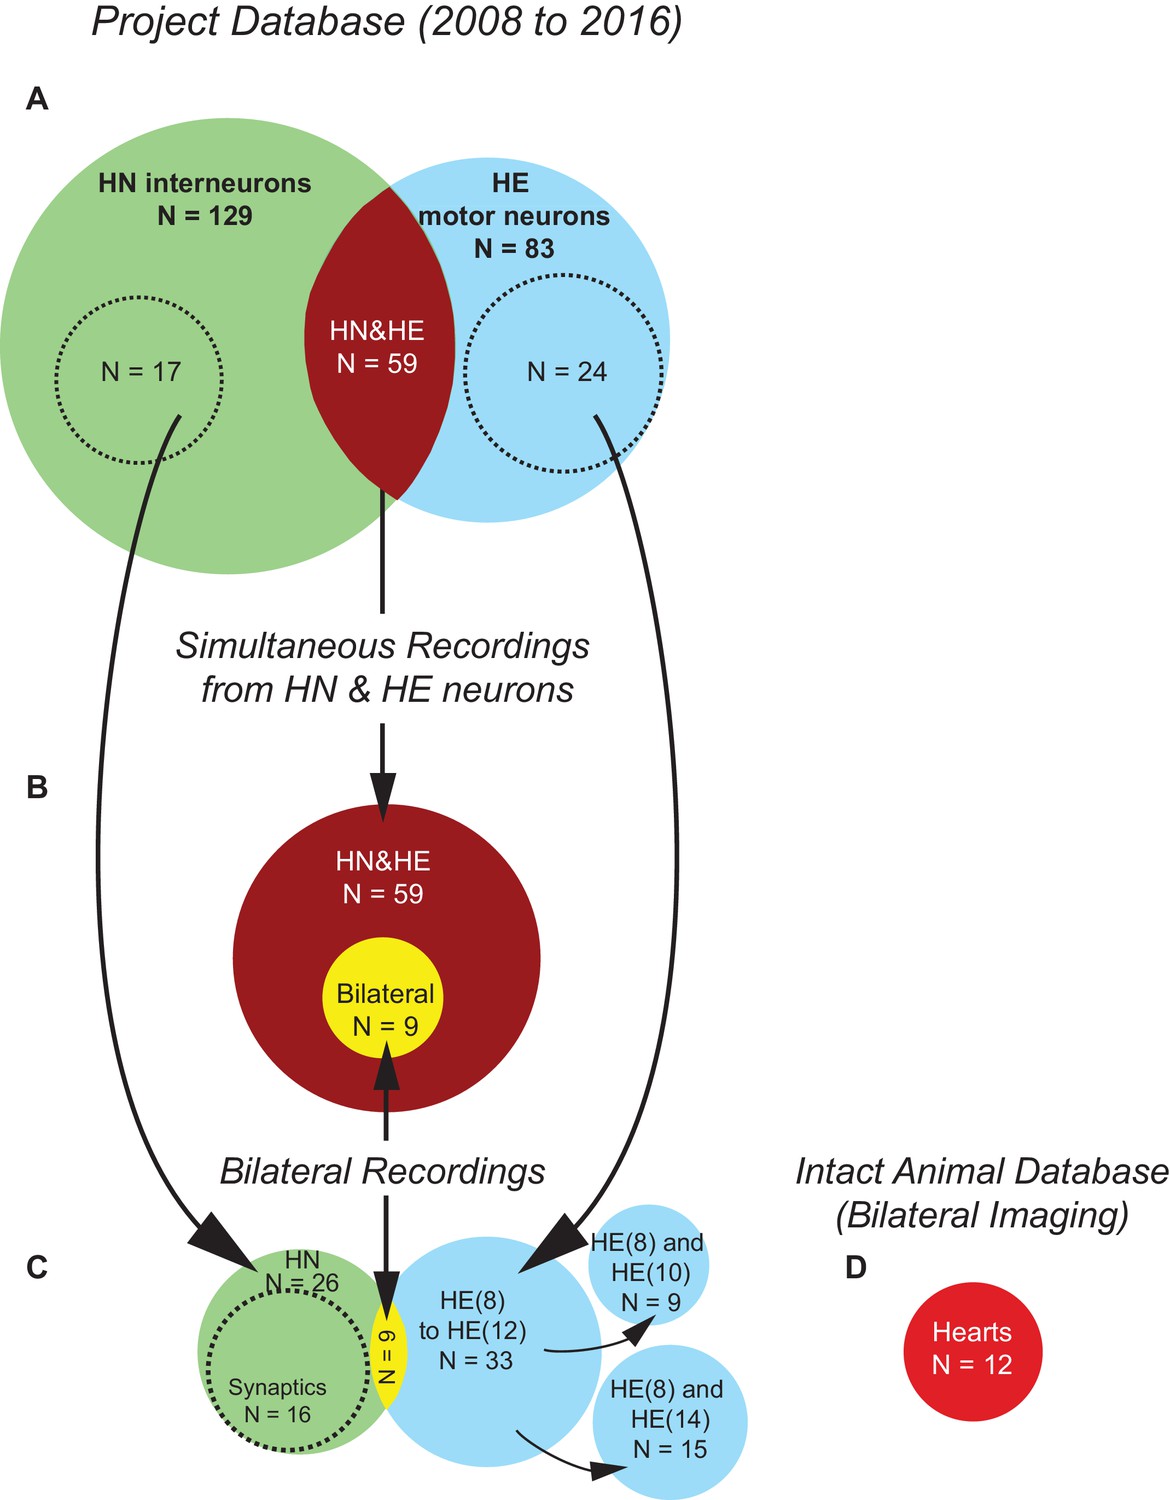
Project Database and animals used in this study.
(A) The entire Project Database comprises mostly unilateral recordings collected between 2008 and 2016. Extracellular recordings from the HN(4) and HN(7) interneurons were made in 129 preparations (green circle), 17 of these were bilateral recordings (dotted green circle). Extracellular recordings from the HE(8) and HE(12) motor neurons were made in 83 preparations (blue circle), 24 of these were bilateral recordings (dotted blue circle). In 59 of these recordings (overlap, chocolate), HN interneurons and HE motor neurons were recorded simultaneously. (B) Of the 59 Simultaneous Recordings from HN interneurons and HE motor neurons (chocolate circle), nine were bilateral recordings (i.e., 8-point recordings, from the HE(R/L8), HE(R/L,12), (HN(R/L,4), HN(R/L,7); yellow circle). (C) Bilateral recordings are the focus of this study. In all, there were 26 bilateral recordings from the HN(R/L,4) and HN(R/L,7) interneurons (17 (A) + 9 (B), green circle) and 33 bilateral recordings from the HE(R/L8) and the HE(R/L,12) motor neurons (24 (A) + 9 (B), blue circle). 16 of the 26 bilateral HN interneuron recordings were also used to determine the synaptic strength of the HE(R/L8), HE(R/L,10), and HE(R/L,12) motor neurons (‘Synaptics’, dotted green circle). In 9 of the 33 bilateral HE(R/L8) and HE(R/L,12) motor neuron recordings, the HE(R/L,10) motor neurons were also recorded, in 15 of the 33 bilateral HE(R/L8) and HE(R/L,12) motor neuron recordings, the HE(R/L,14) motor neurons were also recorded (smaller blue circles). (D) Heart segments 7 to 14 were imaged bilaterally in 12 intact animals. For this study, we analyzed the intersegmental phase relations for heart segments 8 and 12 on both sides.
Figure 3
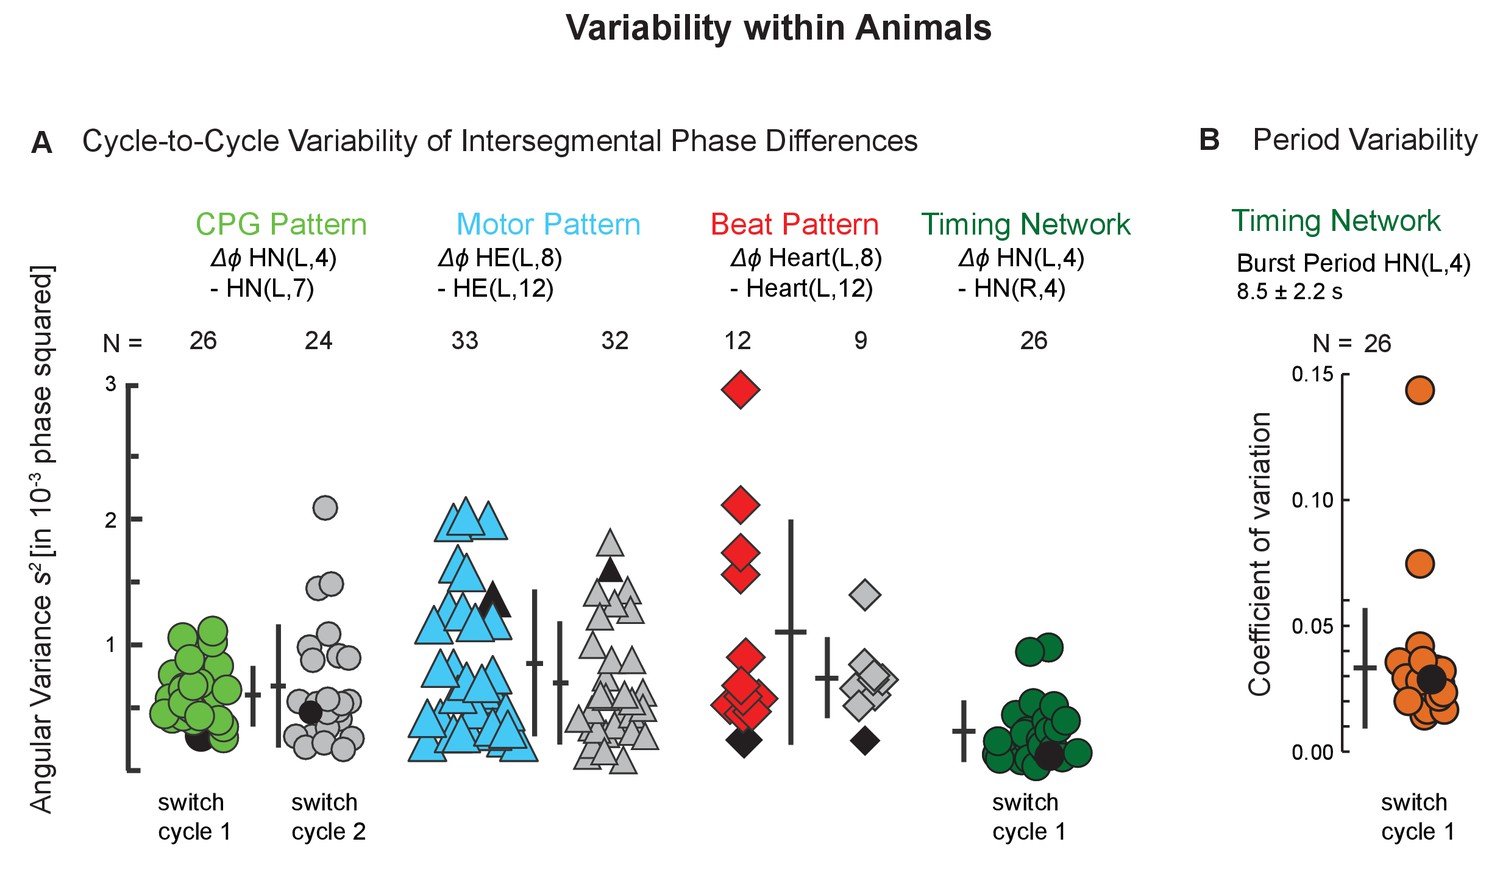
Variability within animals: cycle-to-cycle and period variability across individuals.
(A) The angular variance s2 of intersegmental phase differences for all bursts (CPG, motor neurons) and beats (hearts) are plotted for two subsequent switch cycles for the CPG pattern (green circles), the motor pattern (aqua triangles), and the beat pattern (red diamonds) within side (left) and coordination (peristaltic). Each symbol represents one preparation. The number of preparations is indicated for each level. Colored symbols: switch cycle 1; grey symbols: switch cycle 2. The angular variance is also shown for one switch cycle for the timing network of the CPG (side-to-side phase difference between the left and the right HN(4) interneurons; dark green circles). Note the low variability on all levels. Number of cycles per switch cycle (n’s) were 7 to 58 (CPG), 14 to 68 (Motor Pattern), and 7 to 31 (Beat Pattern). (B) Period variability of the timing network is shown as the coefficient of variation for the 26 preparations of switch cycle 1. Black symbols represent the preparations shown in Figure 2. Means ± SD are shown next to each group as horizontal and vertical bars, respectively. Animal Groups: Bilateral Recordings (Figure 2—figure supplement 1C) and Intact Animal Database (Figure 2—figure supplement 1D).
-
Figure 3—source data 1
Cycle-to-Cycle variances for the CPG pattern, the motor pattern, and the beat pattern for both coordinations, peristaltic and synchronous, and for both sides.
Data in grey boxes are plotted in Figure 3.
- https://doi.org/10.7554/eLife.31123.009
Figure 4 with 1 supplement
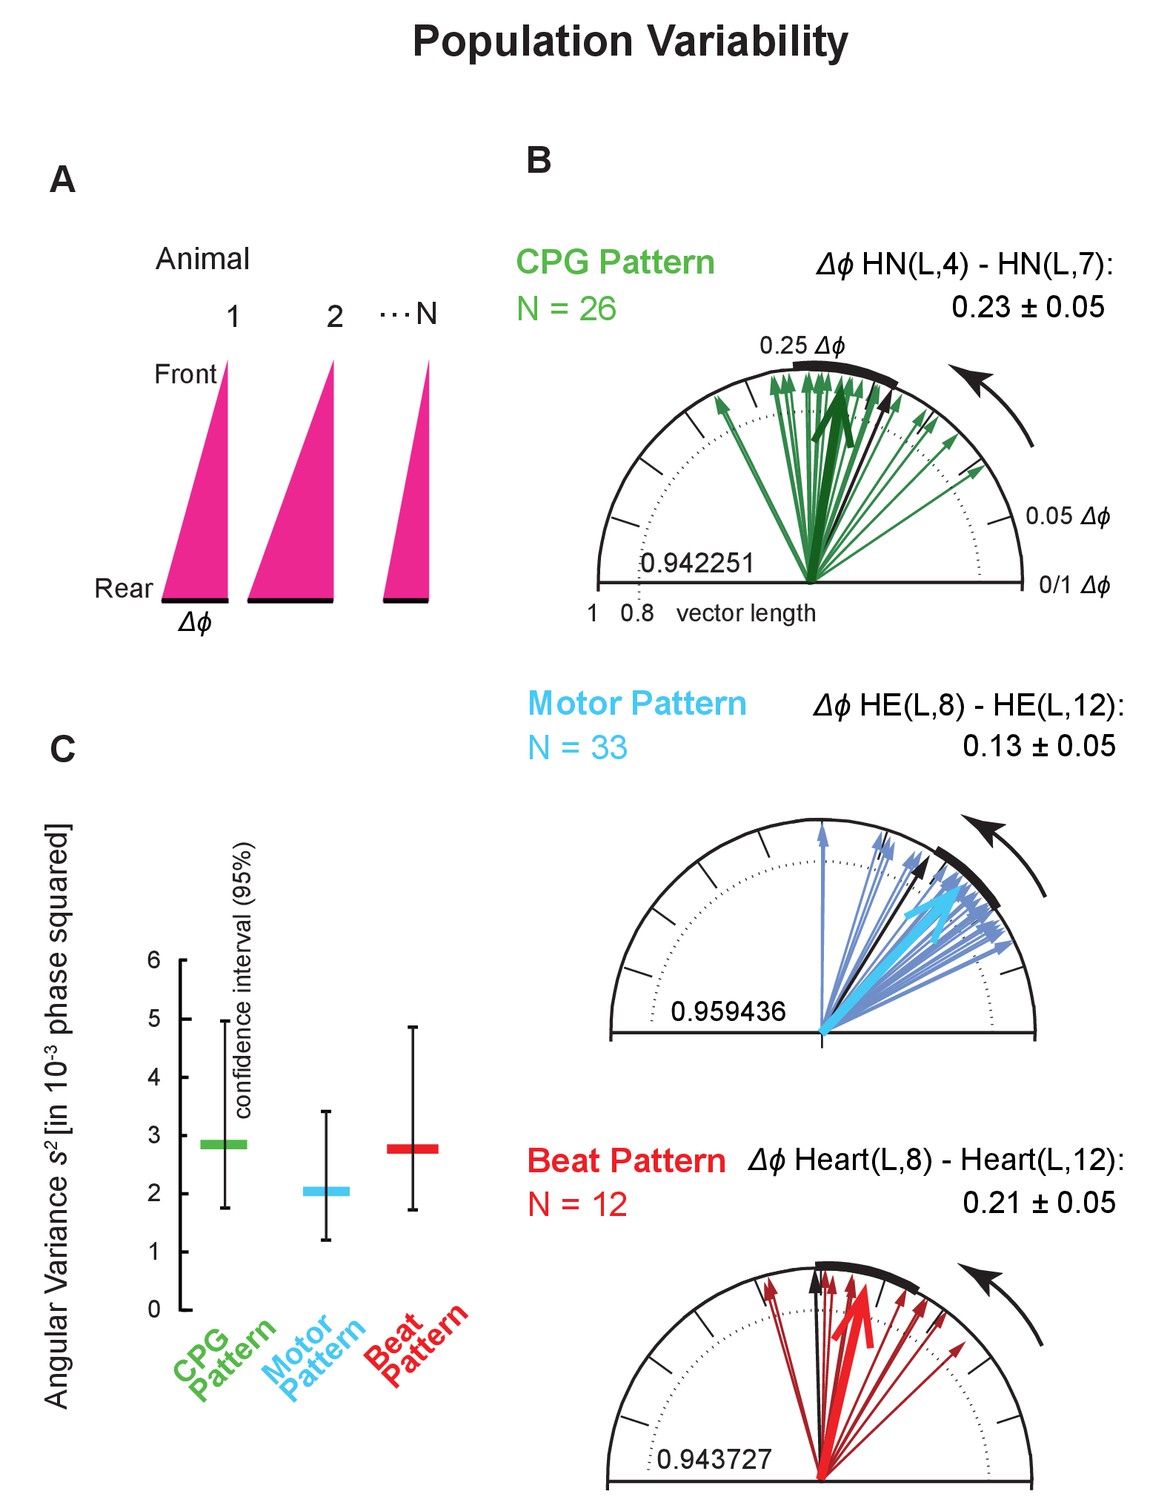
Intersegmental phase variability across animals.
(A) Population variances were calculated using the average intersegmental Δϕ of all bursts or beats in a single switch cycle per animal (peristaltic, left side). (B) Circular plots show the population variability for each level (color code Figure 3). Each thin arrow represents the average intersegmental Δϕ of one preparation and its length represents the angular variance of the cycle-to-cycle variability of that animal. Each thick arrow represents the average intersegmental Δϕ across preparations (values indicated for each level), its length is inversely proportional to the angular variance (vector lengths given inside the circles), and the black arc is the angular standard deviation. Note that the average intersegmental Δϕ is smaller for the motor pattern than for the CPG pattern. The number of preparations (N’s) and the mean (±SD) intersegmental Δϕ is indicated for each level. Black arrows are the vectors of the preparations shown in Figure 1 (their cycle-to-cycle variances are shown as black symbols in Figure 4). (C) Angular variances are similar for all patterns (colored horizontal bars). The confidence intervals (95%) of 10,000 bootstrapped populations overlap across levels (vertical lines). Animal Groups: Bilateral Recordings (Figure 2—figure supplement 1C) and Intact Animal Database (Figure 2—figure supplement 1D).
-
Figure 4—source data 1
Intersegmental phase differences and population variances for the CPG pattern, the motor pattern, and the beat pattern for both coordinations, peristaltic and synchronous, and for both sides.
(TOP) Note that intersegmental Δϕ differs significantly between the CPG pattern and the motor pattern in both coordinations and on both sides. (BOTTOM) Note that population variances are lowest in the motor pattern in both coordinations and on both sides. Data in grey boxes are plotted in Figure 4.
- https://doi.org/10.7554/eLife.31123.012
Figure 4—figure supplement 1

Angular variances for three motor patterns (peristaltic; left side).
(A) Each concentric circle represents the average Δϕ between the HE(8) to three different HE motor neurons (HE(8) to (12), light blue; HE(8) to (14), lavender; HE(8) to (10), navy). Vector lengths are given for each HE neuron pair and are scaled to largest radius on plot. (B) Angular variances and the confidence intervals of 10,000 bootstrapped populations (vertical lines) are shown for the three motor patterns, and for comparison, for the CPG pattern (green). Note that variances increase with increasing intersegmental distance. Animal group: Bilateral Recordings (Figure 2—figure supplement 1C).
Figure 5
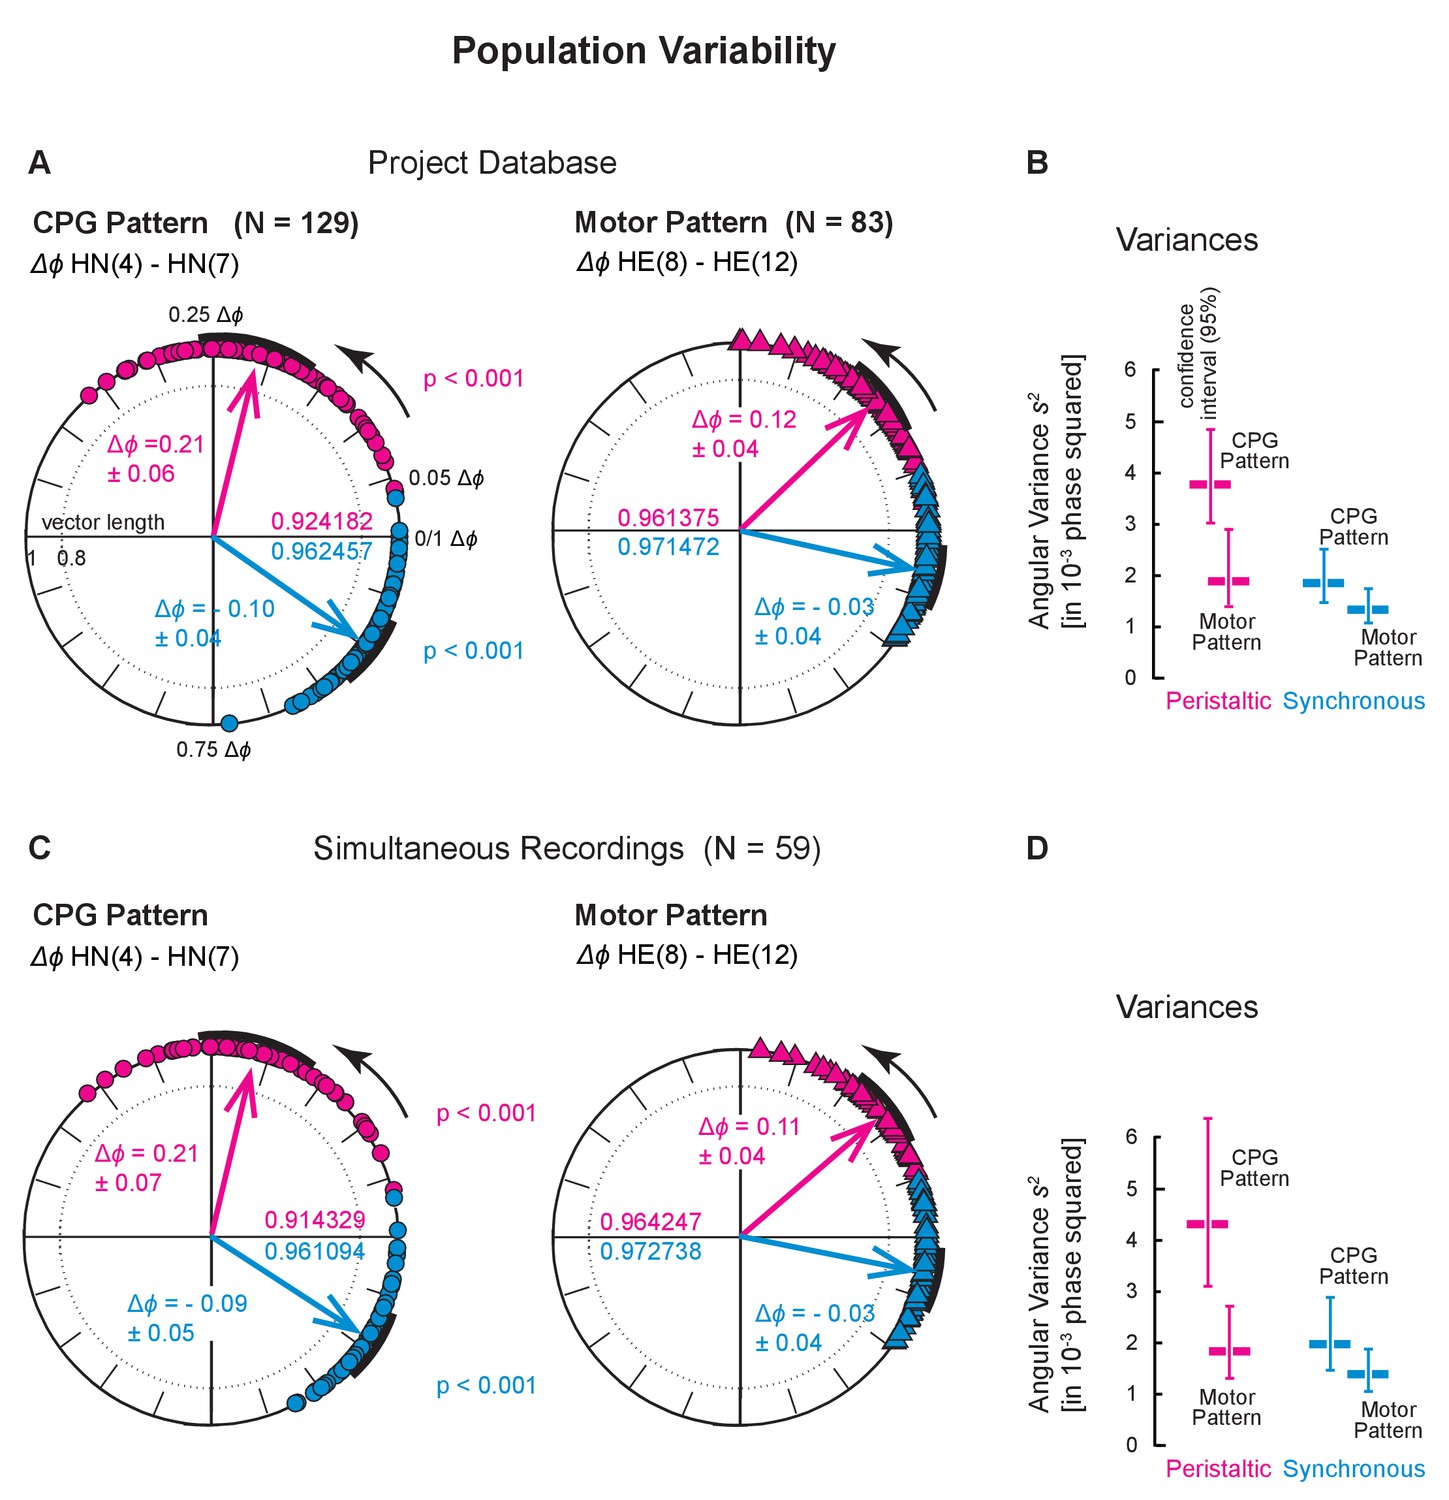
Population variability across two larger populations.
Population variances for the Project Database (Top) and for the Simultaneous Recordings from the HN interneurons and HE motor neurons (Bottom). (A) Variances across all preparations in the Project Database (Figure 2—figure supplement 1A). Each symbol on the circular phase plots represents the average intersegmental Δϕ of one preparation in one switch cycle. The number of preparations and the mean intersegmental Δϕ (±SD) is indicated for the CPG pattern (N = 129; circles) and of the motor pattern (N = 83, triangles) for peristaltic (magenta) and synchronous (blue) coordination. Thick arrows represent the average intersegmental Δϕ across preparations (values indicated for each level), their length the angular variance (values inside each circle), and the black arcs the angular standard deviation. Note that the intersegmental Δϕ of the CPG pattern is larger than that of the motor pattern (peristaltic: p<0.001, synchronous: p<0.001, unpaired t-test). (B) Angular variances and the confidence intervals of 10,000 bootstrapped populations (vertical lines) for the CPG pattern and the motor pattern. Note that confidence intervals (95%) do not overlap in the peristaltic coordination. (C) Variances across all Simultaneous Recordings (Figure 2—figure supplement 1B). Each symbol on the circular phase plot represents the average Δϕ of a preparation in which HN interneurons and HE motor neurons were simultaneously recorded. Layout, symbols and colors as in (A). Note that the average intersegmental Δϕ of the CPG pattern is larger than that of the motor pattern (peristaltic: p<0.001, synchronous: p<0.001, paired t-test). (D) Angular variances and their confidence intervals are shown for the CPG pattern and the motor pattern. Note that confidence intervals (95%) do not overlap in peristaltic coordination. Color code and labels as in (B).
Figure 6
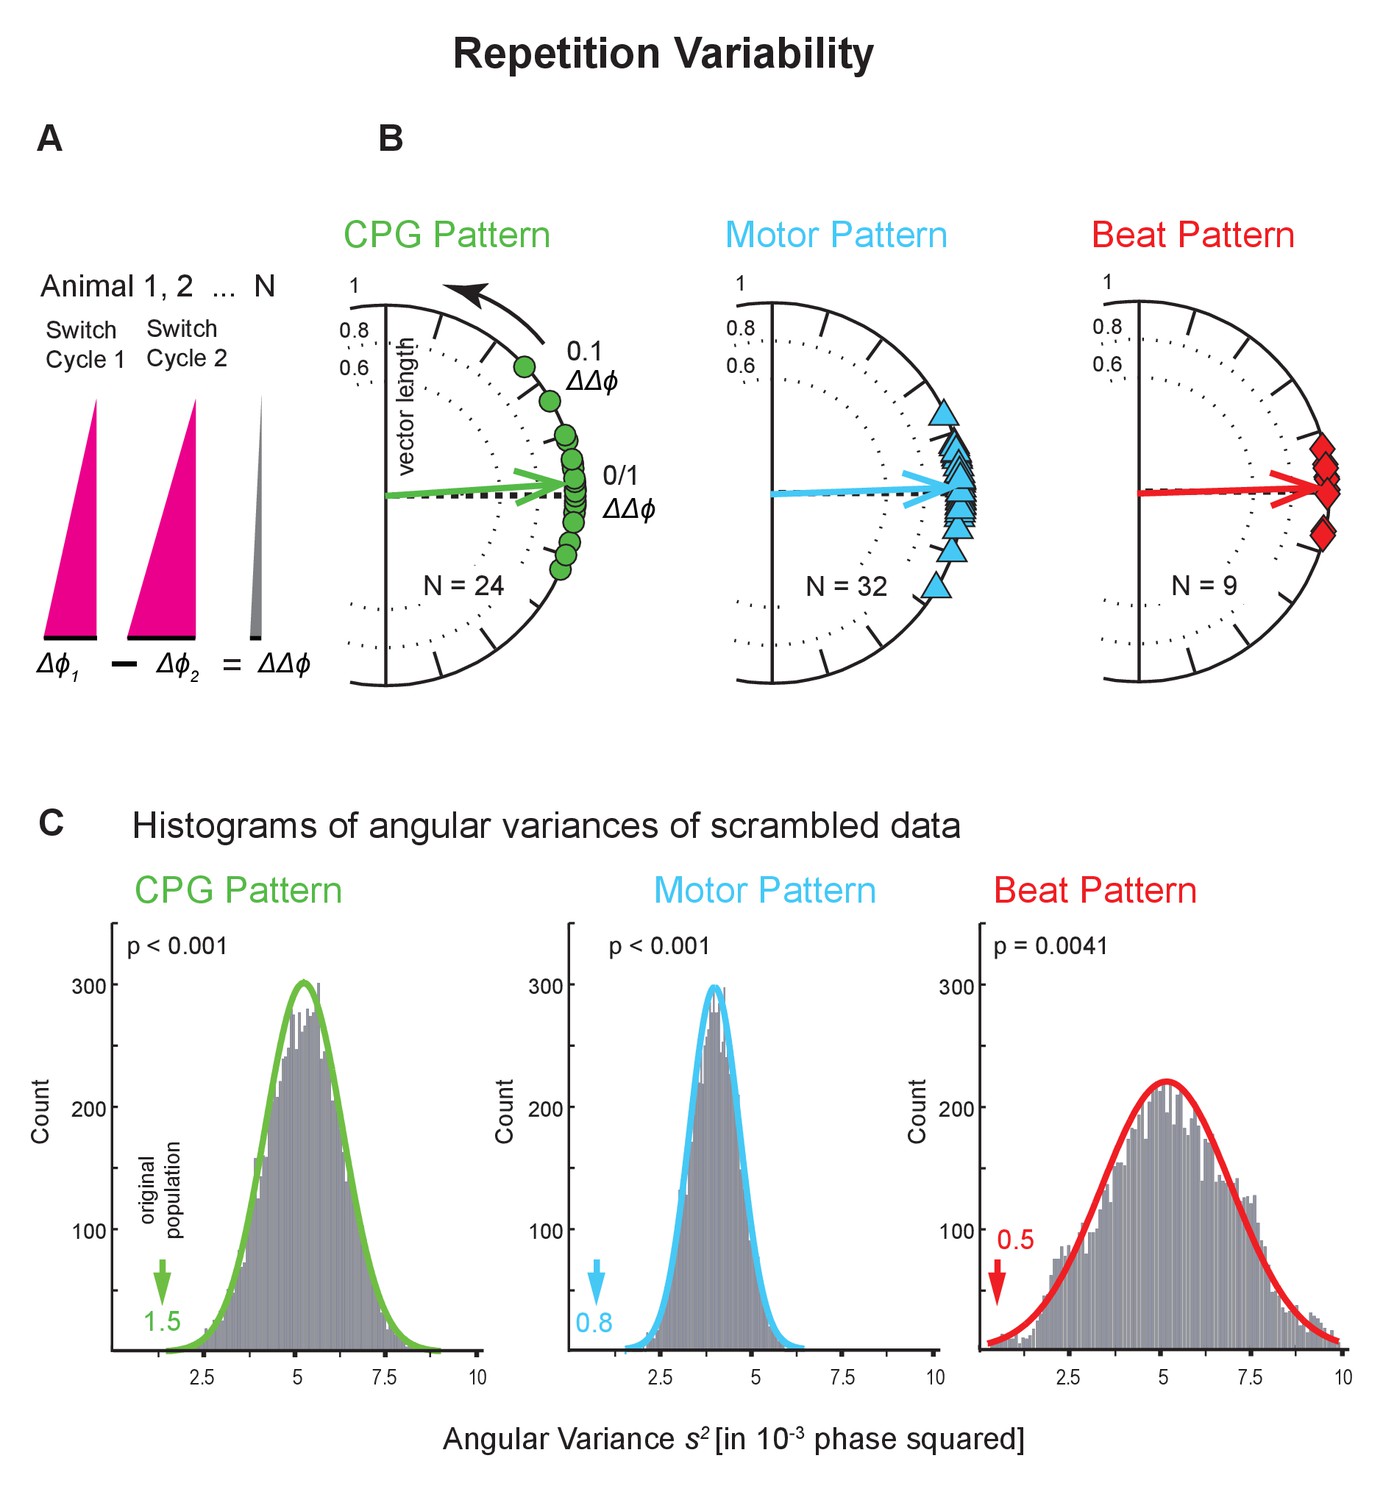
Repetition variability across levels and animals.
(A) The average intersegmental Δϕ of two subsequent switch cycles were subtracted from each other (Δϕ1 - Δϕ2). This difference of phase differences (ΔΔϕ) becomes 0 if Δϕ1 and Δϕ2 are identical. (B) Circular phase plots show ΔΔϕ for all preparations for all levels colors as in Figure 4. Each symbol on the circular phase plots represents the ΔΔϕ of one preparation. Thick arrows show the average ΔΔϕ and their length the angular variance. Note that vector phases are close to 0. (C) Histograms of the angular variances of 10,000 populations where the average intersegmental Δϕ of switch cycle two from one animal had been randomly subtracted from the average intersegmental Δϕ of switch cycle one from another animal (scrambling). Colored arrows point to the variance of the original population (value next to each arrow). The p values for each histogram were calculated from the z score of the normal distribution (colored lines) of the scrambled populations. Note that on each level scrambling resulted in significantly higher variances than that of the original population. Data within side (left) and coordination (peristaltic). Animal Groups: Bilateral Recordings (Figure 2—figure supplement 1C) and Intact Animal Database (Figure 2—figure supplement 1D).
-
Figure 6—source data 1
Repetition variances of the CPG pattern, the motor pattern, and the beat pattern for both coordinations and for both sides.
Note that all variances (both coordinations, both sides) are smaller than those of 10,000 scrambled populations. Data in grey boxes are plotted on Figure 6.
- https://doi.org/10.7554/eLife.31123.015
Figure 7 with 1 supplement
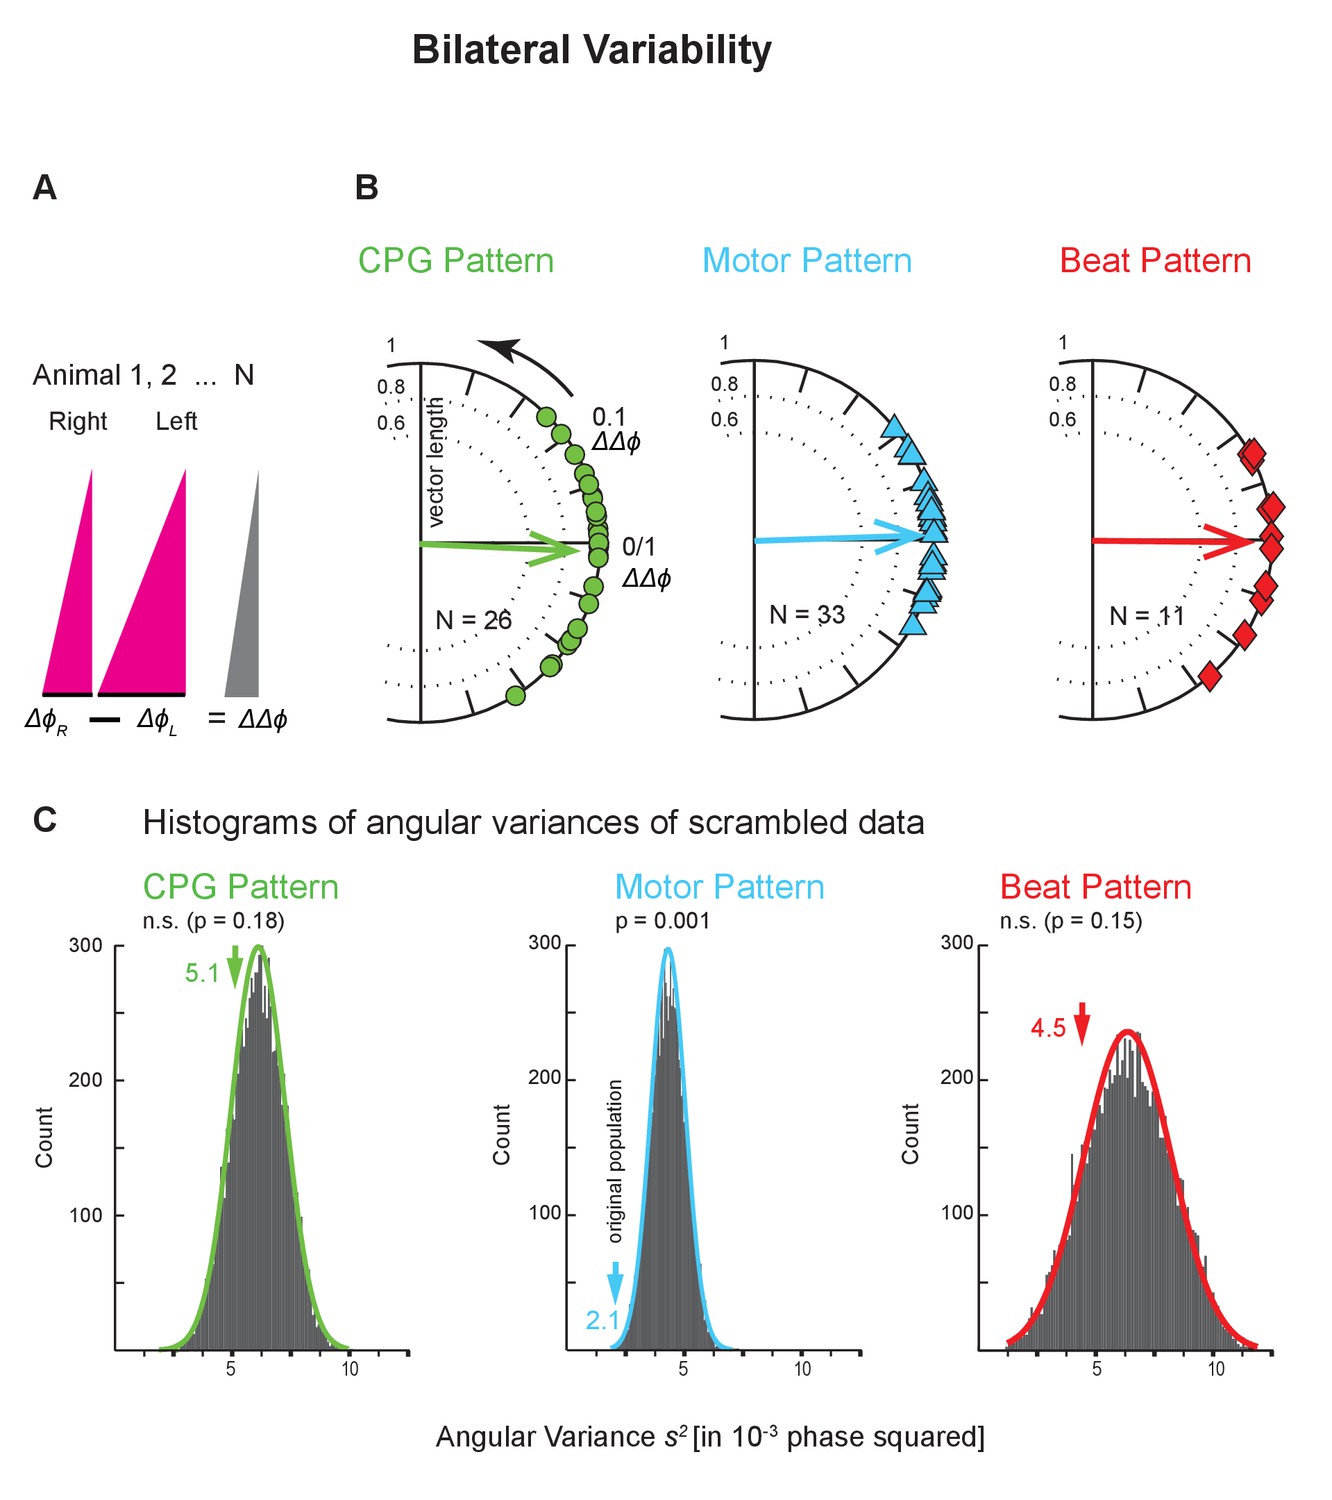
Bilateral variability across levels and animals.
(A) The average intersegmental Δϕ between two segments on the right and on the left body side were subtracted from each other (ΔϕL - ΔϕR) (peristaltic). This difference of phase differences (ΔΔϕ) becomes 0 if phase differences are identical on the two sides. (B) Circular phase plots show ΔΔϕ for all preparations for all levels (colors as in Figure 6). Each symbol on the circular phase plots represents the ΔΔϕ of one preparation. Thick arrows show the average ΔΔϕ and their length the angular variance. Note that vector phases are close to 0. (C) Histograms of the angular variances of 10,000 populations where the intersegmental Δϕ on the right side of one animals had been randomly subtracted from the left side from another animal (scrambling). Colored arrows represent the variance of the original population (value next to each arrow). Note that the variances of the CPG pattern and the beat pattern of the original population do not differ from the scrambled populations, while in the motor pattern the variance from the original population is significantly lower than the variances of the scrambled population. The p values for each histogram were calculated from the z score of the normal distribution (colored line) of the scrambled populations. Layout as in Figure 6. Animal Groups: Bilateral Recordings (Figure 2—figure supplement 1C) and Intact Animal Database (Figure 2—figure supplement 1D).
-
Figure 7—source data 1
Bilateral variances of the CPG pattern, the motor pattern, and the beat pattern for both coordinations.
Note that variances in synchronous coordination are smaller than those of 10,000 scrambled populations while those in peristaltic coordination are similar to the scrambled populations in the CPG pattern and the beat pattern, but smaller in the motor pattern. Data in grey boxes are plotted on Figure 7.
- https://doi.org/10.7554/eLife.31123.018
Figure 7—figure supplement 1
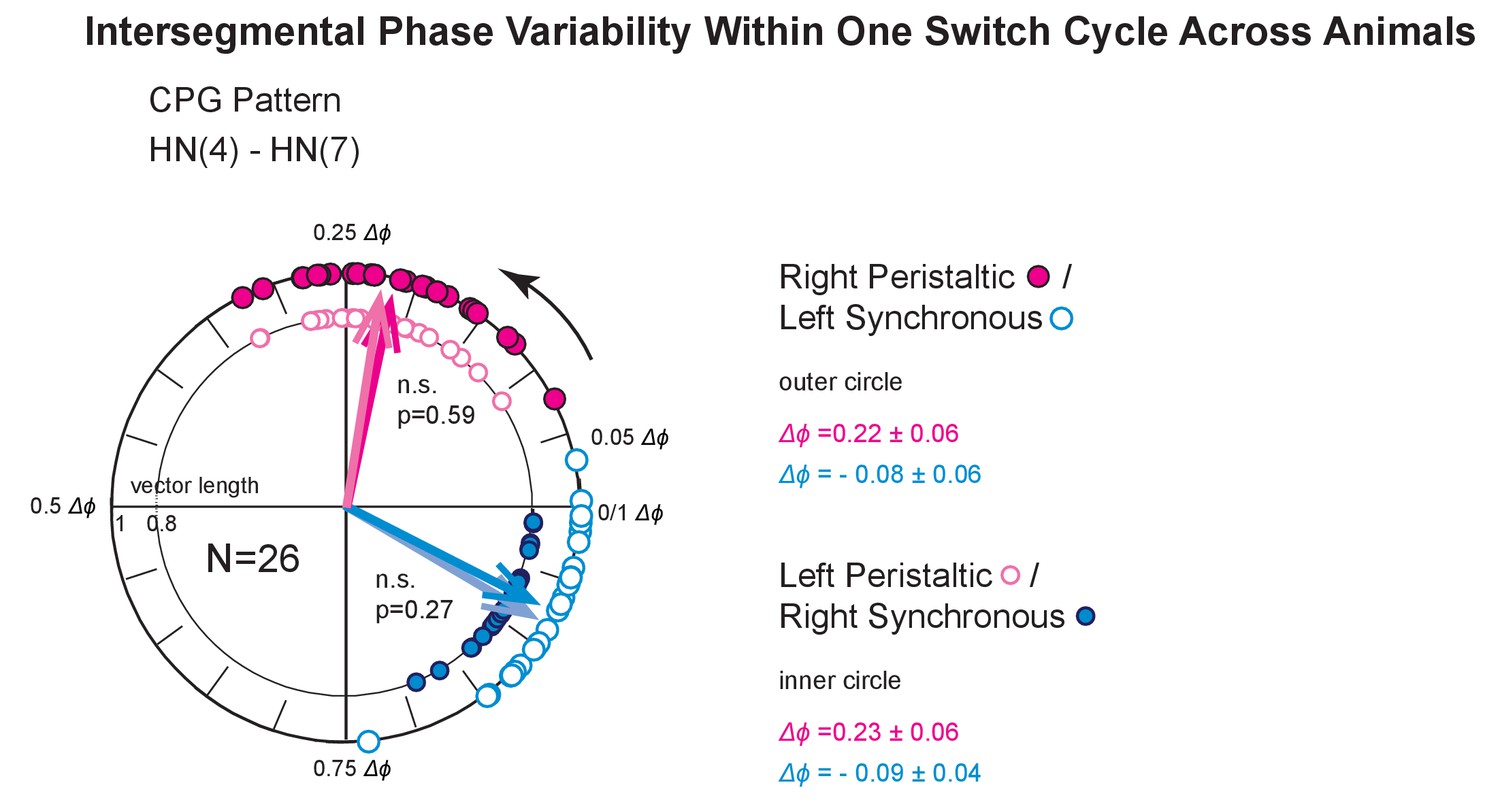
Intersegmental phase variability within one switch cycle across animals.
The two concentric circles represent the intersegmental Δϕ of the two premotor patterns of the CPG, Right Peristaltic/Left Synchronous (outer circle) and Left Peristaltic/Right Synchronous (inner circle) (Bilateral recordings, Figure 2—figure supplement 1C). Each colored circle represents a preparation (magenta: peristaltic, blue synchronous; open symbols, left side; filled symbols, right side). Each thick arrow represents the average intersegmental Δϕ across preparations and its length the variance (vector lengths scaled to largest radius on plot). Note that the average intersegmental Δϕ of the two coordinations is similar on the two sides.
Figure 8

Variability of synaptic strength across animals.
(A) Each data pair represents the right and the left synaptic strength (in nS) from premotor interneurons HN(4) (green) and HN(7) (blue) to the ipsilateral heart motor neurons HE(8) (A1), HE(10) (A2), and HE(12) (A3) in the same animal. Synaptic strength does not differ between sides (paired t-test; p values on plot). (B) Proportion of the total HN(4) + HN(7) synaptic strength due to the HN(4) interneuron on each side for each motor neuron. Note that the two sides do not differ in average proportional strength (p values: original data, and, in parenthesis, the mean p value after scrambling between left and right). Animal Group: Bilateral Recordings, ‘Synaptics’ (Figure 2—figure supplement 1C, dashed green circle).
Additional files
-
Supplementary file 1
Experimental data and analysis for all figures.
- https://doi.org/10.7554/eLife.31123.020
-
Transparent reporting form
- https://doi.org/10.7554/eLife.31123.021
Download links
A two-part list of links to download the article, or parts of the article, in various formats.
Downloads (link to download the article as PDF)
Open citations (links to open the citations from this article in various online reference manager services)
Cite this article (links to download the citations from this article in formats compatible with various reference manager tools)
Output variability across animals and levels in a motor system
eLife 7:e31123.
https://doi.org/10.7554/eLife.31123


