Inhibition of intracellular lipolysis promotes human cancer cell adaptation to hypoxia
- Mayo Clinic in Arizona, United States
- Mayo Clinic, United States
- Case Western Reserve University, United States
Figures
Figure 1
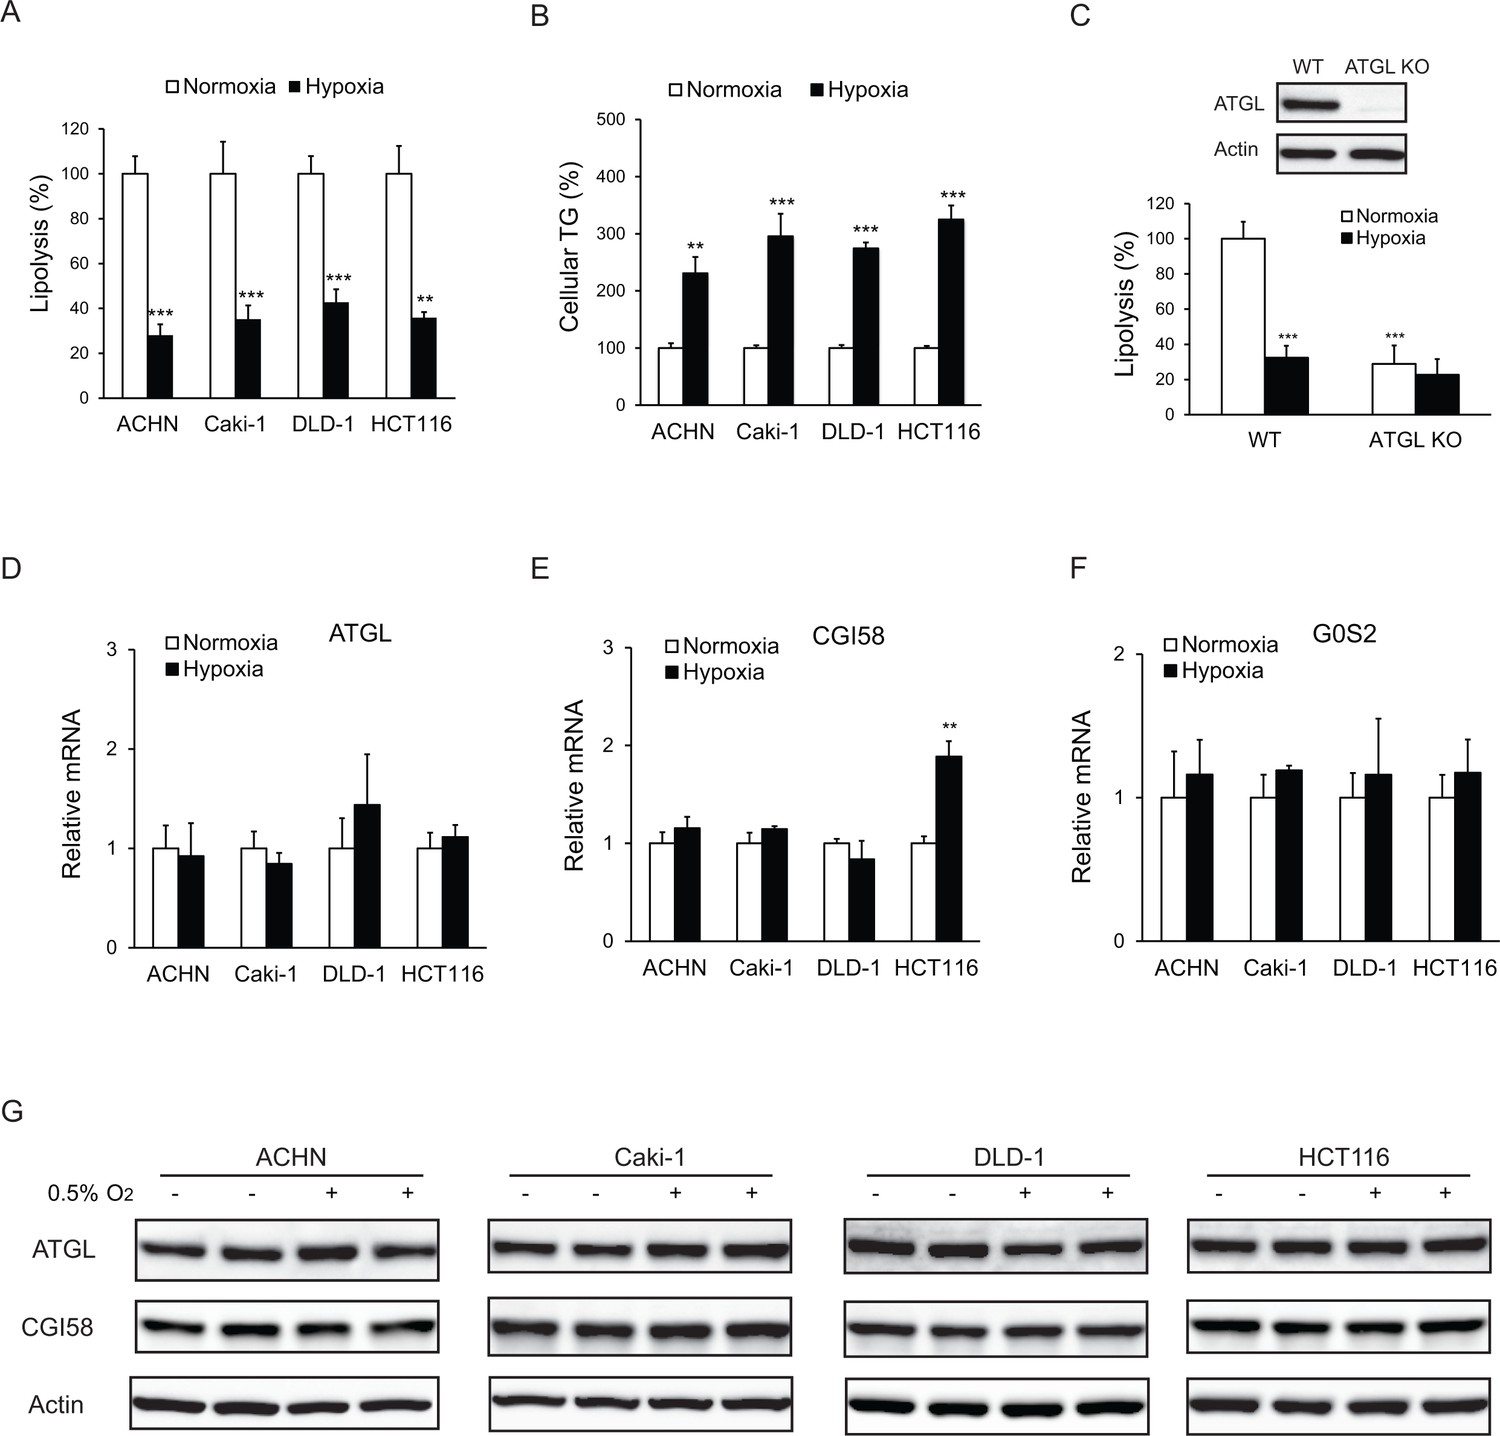
Lipolysis is reduced in cancer cells under hypoxia.
(A, B) After 24 hr of incubation under normoxia or hypoxia, lipolysis (A) and cellular TG content (B) were measured. n = 4 biologically independent experiments. **p<0.01, ***p<0.001 vs. Normoxia. (C) Lipolysis in HCT116 clone cells after 24 hr of incubation under normoxia or hypoxia. ATGL knockout (KO) cells were generated by CRSPR/Cas9 method. n = 3 biologically independent experiments. ***p<0.001 vs. Normoxia WT. (D–F) mRNA levels of genes related to lipolysis in cells after 24 hr of incubation under normoxia or hypoxia. n = 4 biologically independent experiments. **p<0.01 vs. Normoxia. (G) Protein levels of ATGL and CGI58 in cells after 24 hr of incubation under normoxia or hypoxia were determined by immunoblotting with anti-ATGL and anti-CGI58 antibodies, respectively. Graphs represent mean ±SD, and were compared by two-tailed unpaired Student t-test.
Figure 2
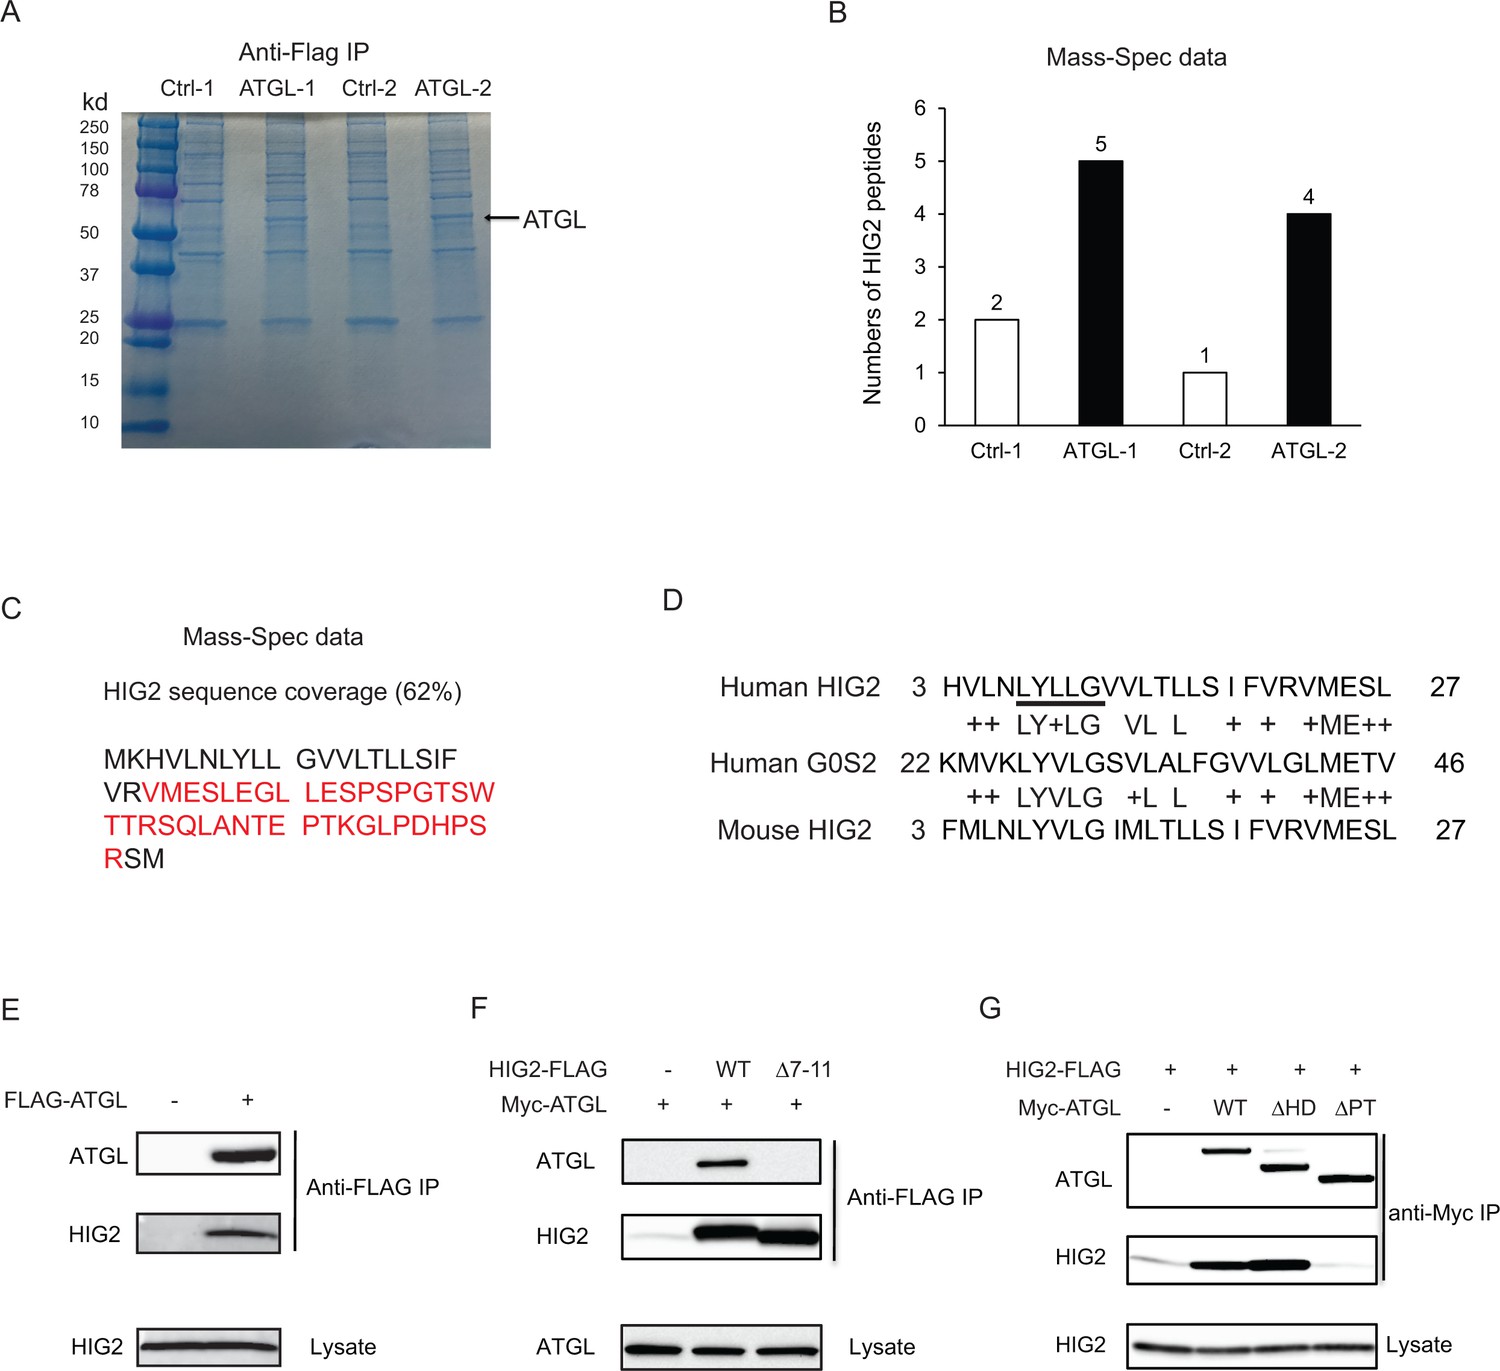
HIG2 interacts with ATGL.
(A) HCT116 cells transfected with control vector or FLAG-ATGL vector were incubated under hypoxia for 24 hr followed by immunoprecipitation with anti-FLAG gels. Then the elution was separated on the 10–20% SDS-PAGE gel and stained with Coomassie Blue. The arrow indicates FLAG-ATGL. (B) The numbers of peptides from (A) recovered by mass spectrometry. (C) Combined coverage map of HIG2 peptides from (B). Detected peptides are in red. (E) Protein sequence alignment of HIG2 and G0S2. (E) HIG2 and ATGL in samples from (A) were detected by immunoblotting with anti-HIG2 and anti-FLAG antibodies, respectively. (F) HeLa cells were co-transfected with Myc-ATGL vector (N-terminal Myc tag) along with vector alone, HIG2-FLAG WT or HIG2-FLAG ∆7–11 vector (C-terminal FLAG tag). Immunoprecipitation was performed by anti-FLAG gels. HIG2 and ATGL proteins were detected by anti-FLAG and anti-Myc antibodies, respectively. (G) HeLa cells were co-transfected with HIG2-FLAG vector along with vector alone, Myc-ATGL or mutant vectors. ATGL∆PT and ATGL∆HD are two internal deletion mutants that lack the patatin domain (residues 10–178) and the hydrophobic domain (residues 259–337), respectively. Immunoprecipitation was performed by anti-Myc gels. HIG2 and ATGL proteins were detected by anti-FLAG and anti-Myc antibodies, respectively.
Figure 3
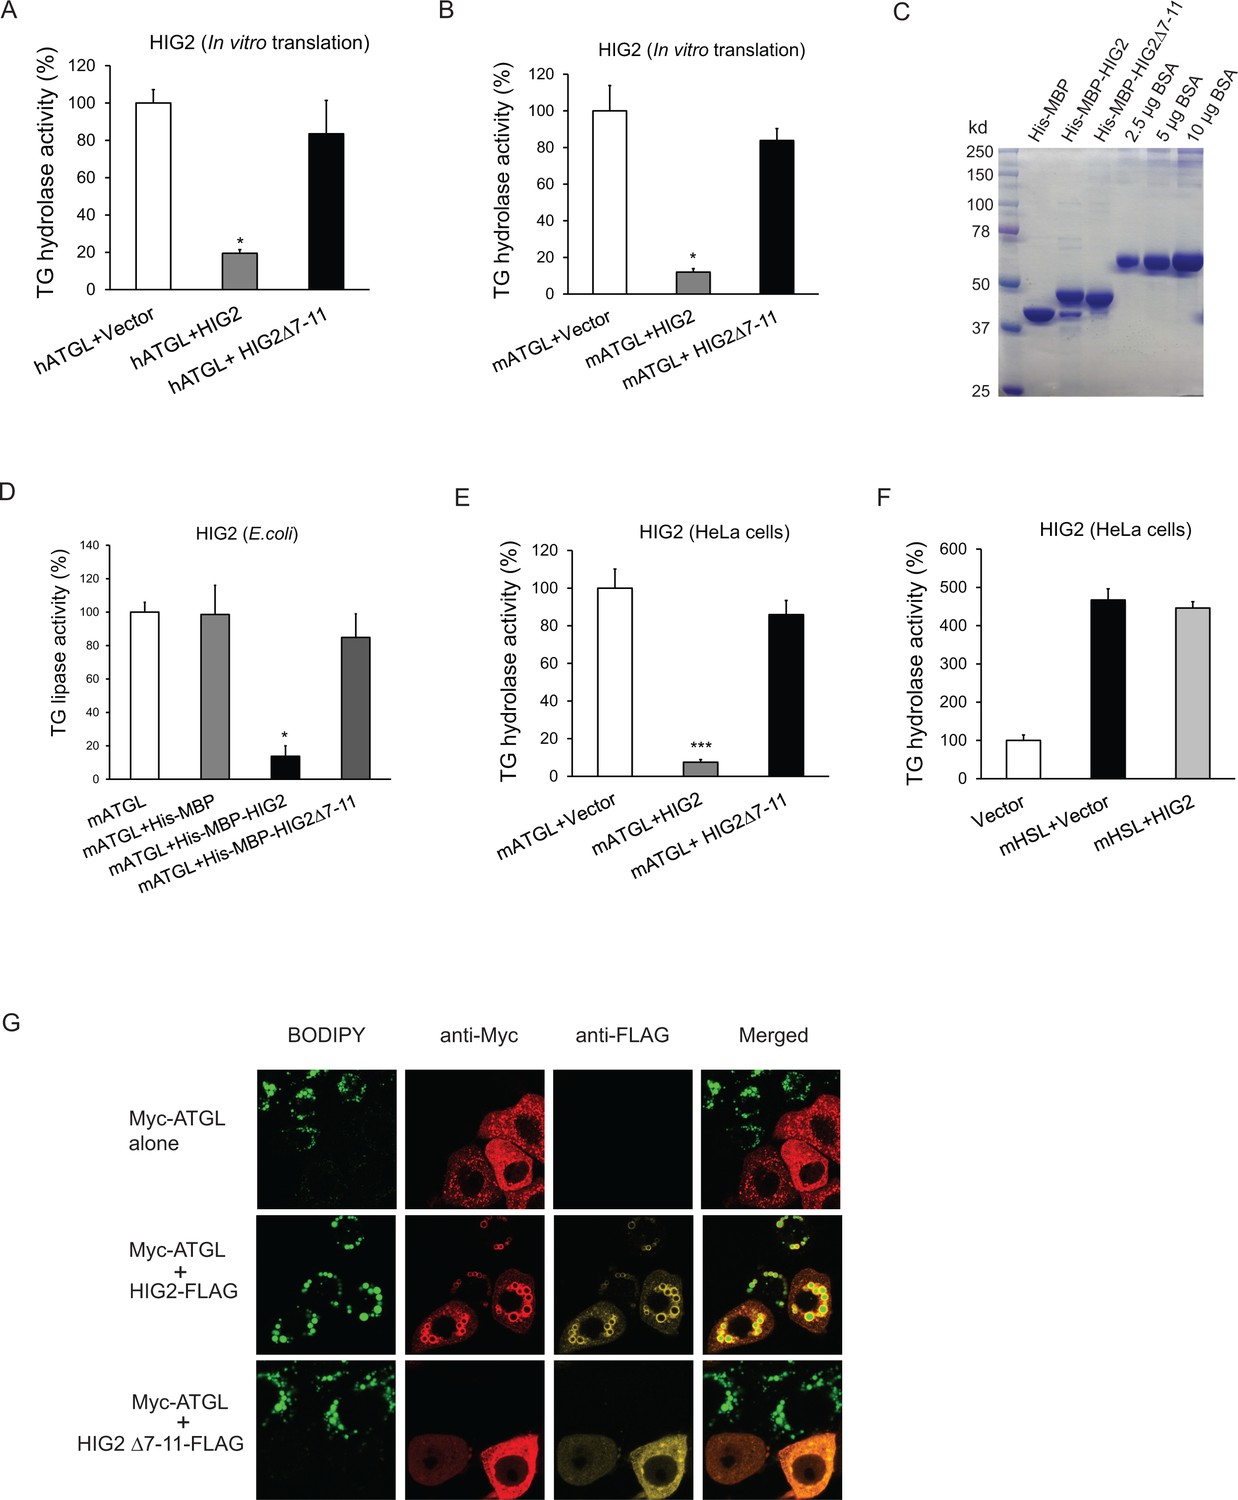
HIG2 inhibits ATGL enzymatic activity.
(A, B) HIG2 from in vitro translation was added to extracts of HeLa cells transfected with human ATGL vector (hATGL) (A) or mouse ATGL vector (mATGL) (B), and TG hydrolase activity was determined. n = 2 biologically independent experiments. *p<0.05 vs. hATGL +Vector or mATGL +Vector. (C) 10 µl of recombinant proteins purified from E. coli were separated on a 10% SDS-PAGE gel and stained with Coomassie Blue. (D) 4 µg of recombinant proteins from (c) were added to extracts of HeLa cells transfected with mouse ATGL vector, and TG hydrolase activity was determined. n = 4 biologically independent experiments. n = 2 biologically independent experiments. *p<0.05 vs. mATGL +His MBP. (E, F) Lysate from HeLa cells transfected with HIG2 vectors was added to extracts of HeLa cells expressing mATGL (E) or mHSL (F), and TG hydrolase activity was measured. n = 4 biologically independent experiments. ***p<0.001 vs. mATGL +Vector. (G) HeLa cells transfected with Myc-ATGL vector in the absence or presence of HIG2-FLAG WT or HIG2-FLAG ∆7–11 vector were incubated with 200 µM of oleate complexed to BSA overnight followed by immunofluorescence staining. Lipid droplets were stained by BODIPY 493/503 (green). Graphs represent mean ±SD, and were compared by two-tailed unpaired Student t-test.
Figure 4 with 1 supplement
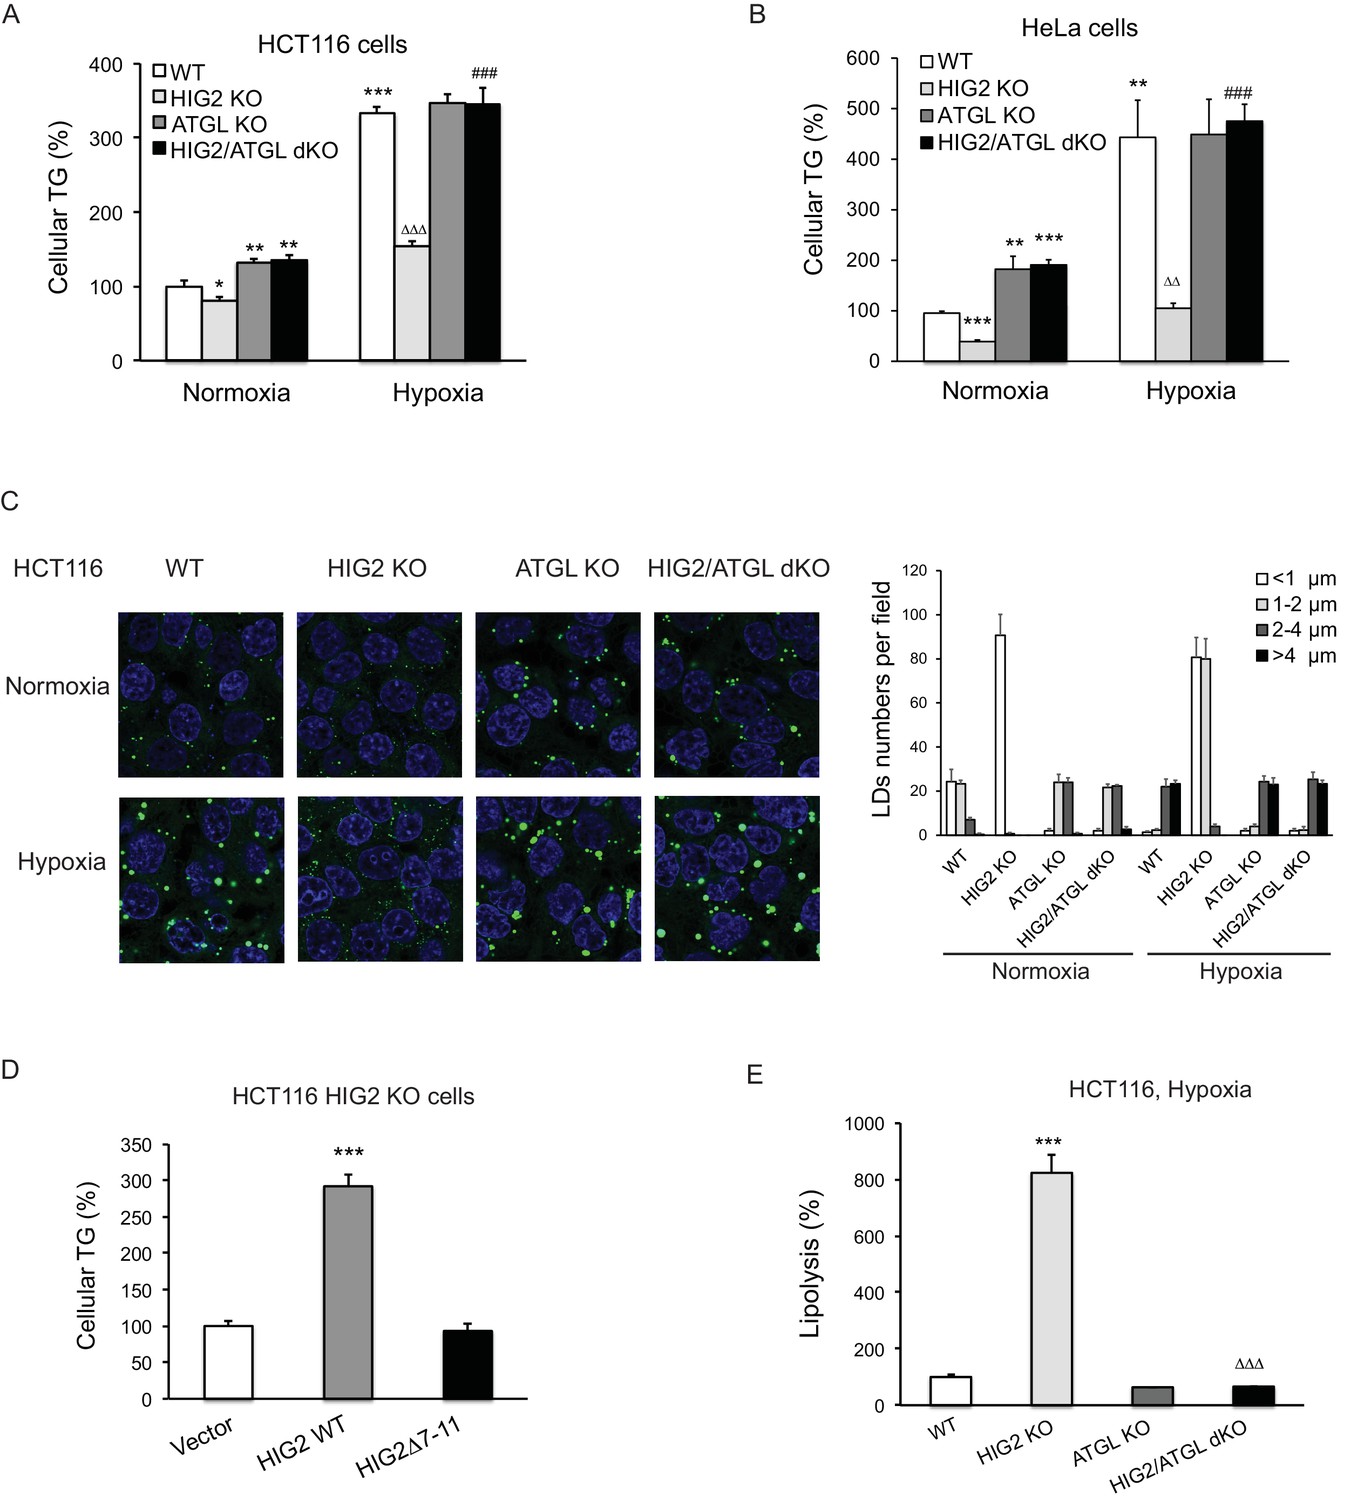
Lipolytic inhibition by HIG2 causes TG accumulation under hypoxia.
(A–C) HCT116 or HeLa KO clone cells created by CRISPR/Cas9 method were incubated under normoxia or hypoxia for 24 hr, and then cellular TG was detected by TG kits or by BODIPY 493/503 (green indicates lipids and blue indicates DAPI-stained nucleus). n = 3 biologically independent experiments for (A); n = 4 biologically independent experiments for (B).*p<0.05, **p<0.01, ***p<0.001 vs. Normoxia WT; ∆∆p<0.01, ∆∆∆p<0.001 vs. Hypoxia WT; ###p<0.001 vs. Hypoxia HIG2 KO. (D) Following an overnight transfection with DNA vectors, HCT116 cells were incubated under normoxia or hypoxia for 24 hr, and then TG was measured. n = 4 biologically independent experiments. ***p<0.001 vs. Vector. (E) Lipolysis in HCT116 clone cells after 24 hr of incubation under hypoxia. n = 4 biologically independent experiments. ***p<0.001 vs. WT; ∆∆∆p<0.001 vs. HIG2 KO. Graphs represent mean ±SD, and were compared by two-tailed unpaired Student t-test.
Figure 4—figure supplement 1

Enhancement of lipolysis reduces TG accumulation under hypoxia.
(A, B) HIG2 expression by immunoblotting after 24 hr of incubation under normoxia or hypoxia. (C–F) Two HIG2 deficient clones in four cell lines indicated were generated with two independent gRNA specific to HIG2 by CRISPY/Cas9 method. Cellular TG contents were measured after 24 hr of incubation under normoxia or hypoxia. n = 3 biologically independent experiments for (C); n = 4 biologically independent experiments for (D–F).
Figure 5 with 1 supplement
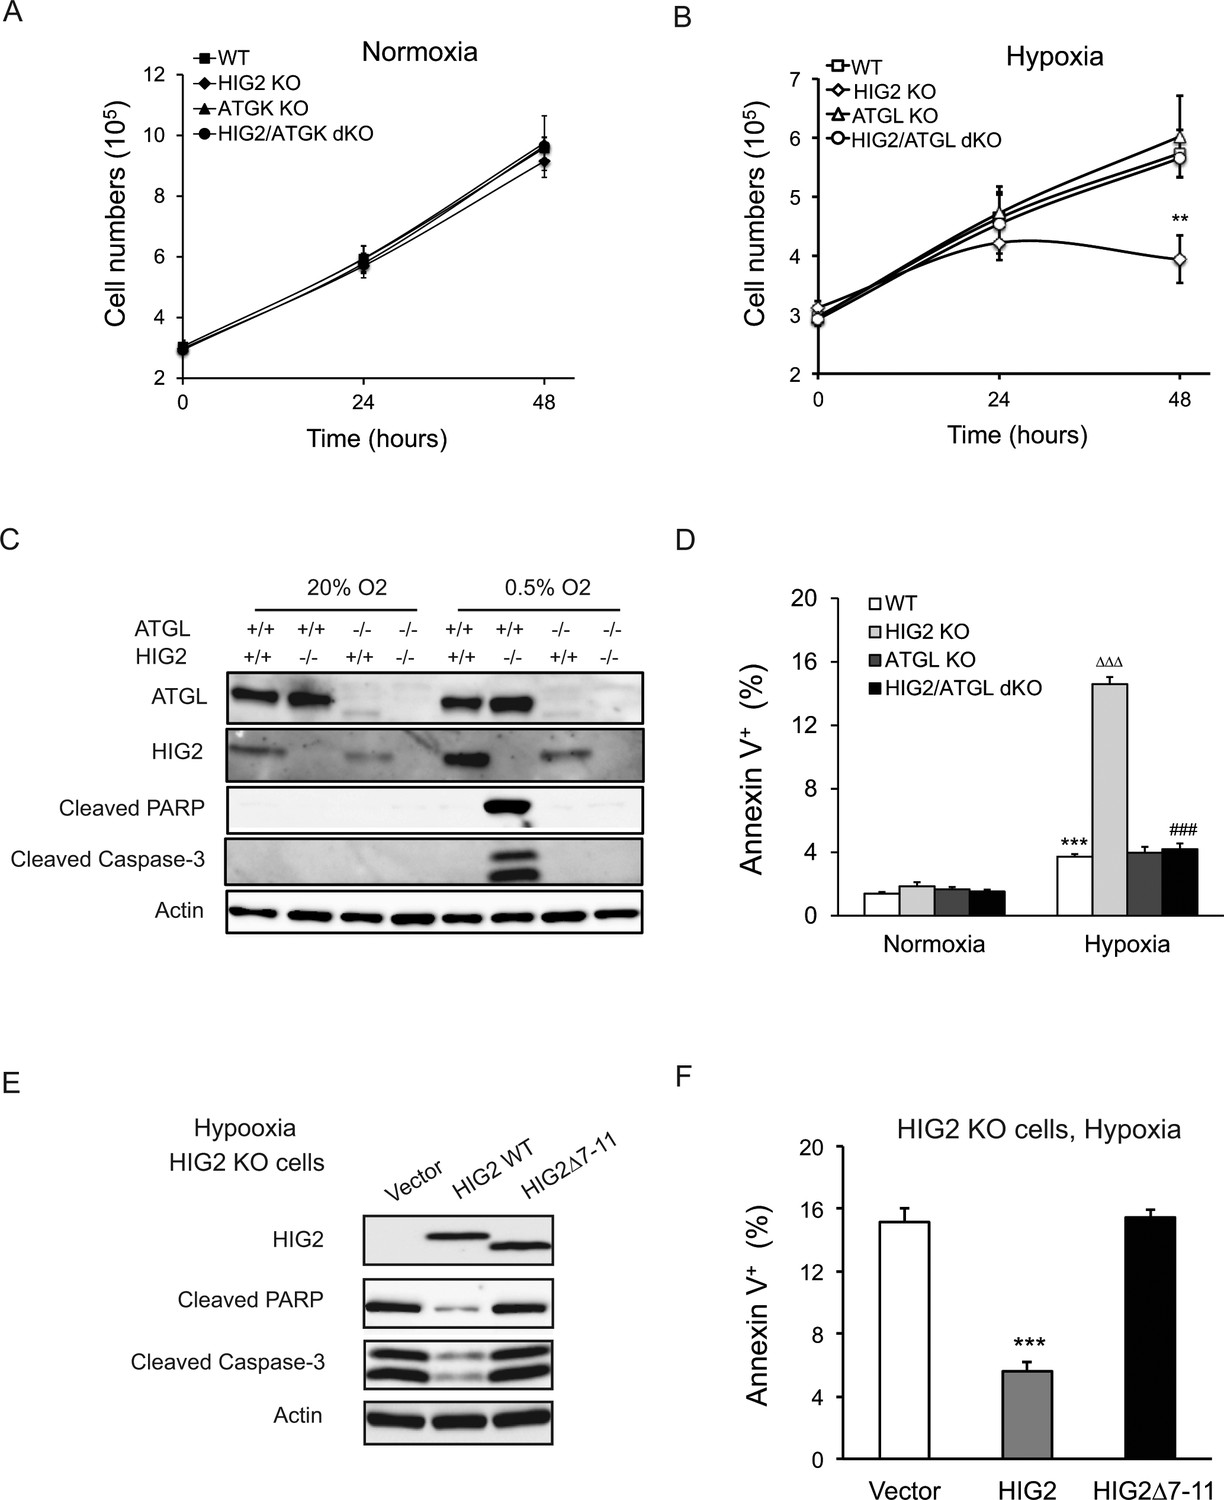
Lipolytic inhibition by HIG2 prevents cell apoptosis under hypoxia.
(A, B) Cell number was determined by counting viable cells at indicated times. n = 4 biologically independent experiments. **p<0.01 vs. Hypoxia WT. (C, D) After 48 hr of incubation under normoxia or hypoxia, apoptosis in HCT116 clone cells was assessed by immunoblotting (C) or by staining with Annexin V for Flow Cytometry (D). n = 3 biologically independent experiments. ***p<0.001 vs. Normoxia WT; ∆∆∆p<0.001 vs. Hypoxia WT; ###p<0.001 vs. Hypoxia HIG2 KO. (E, F) Following an overnight transfection with DNA vectors, HCT116 cells were cultured under normoxia or hypoxia for 48 hr. Cell apoptosis was examined under hypoxia by immunoblotting (E) or by Flow Cytometry (F). n = 2 biologically independent experiments. ***p<0.001 vs. Vector. Graphs represent mean ±SD, and were compared by two-tailed unpaired Student t-test.
Figure 5—figure supplement 1
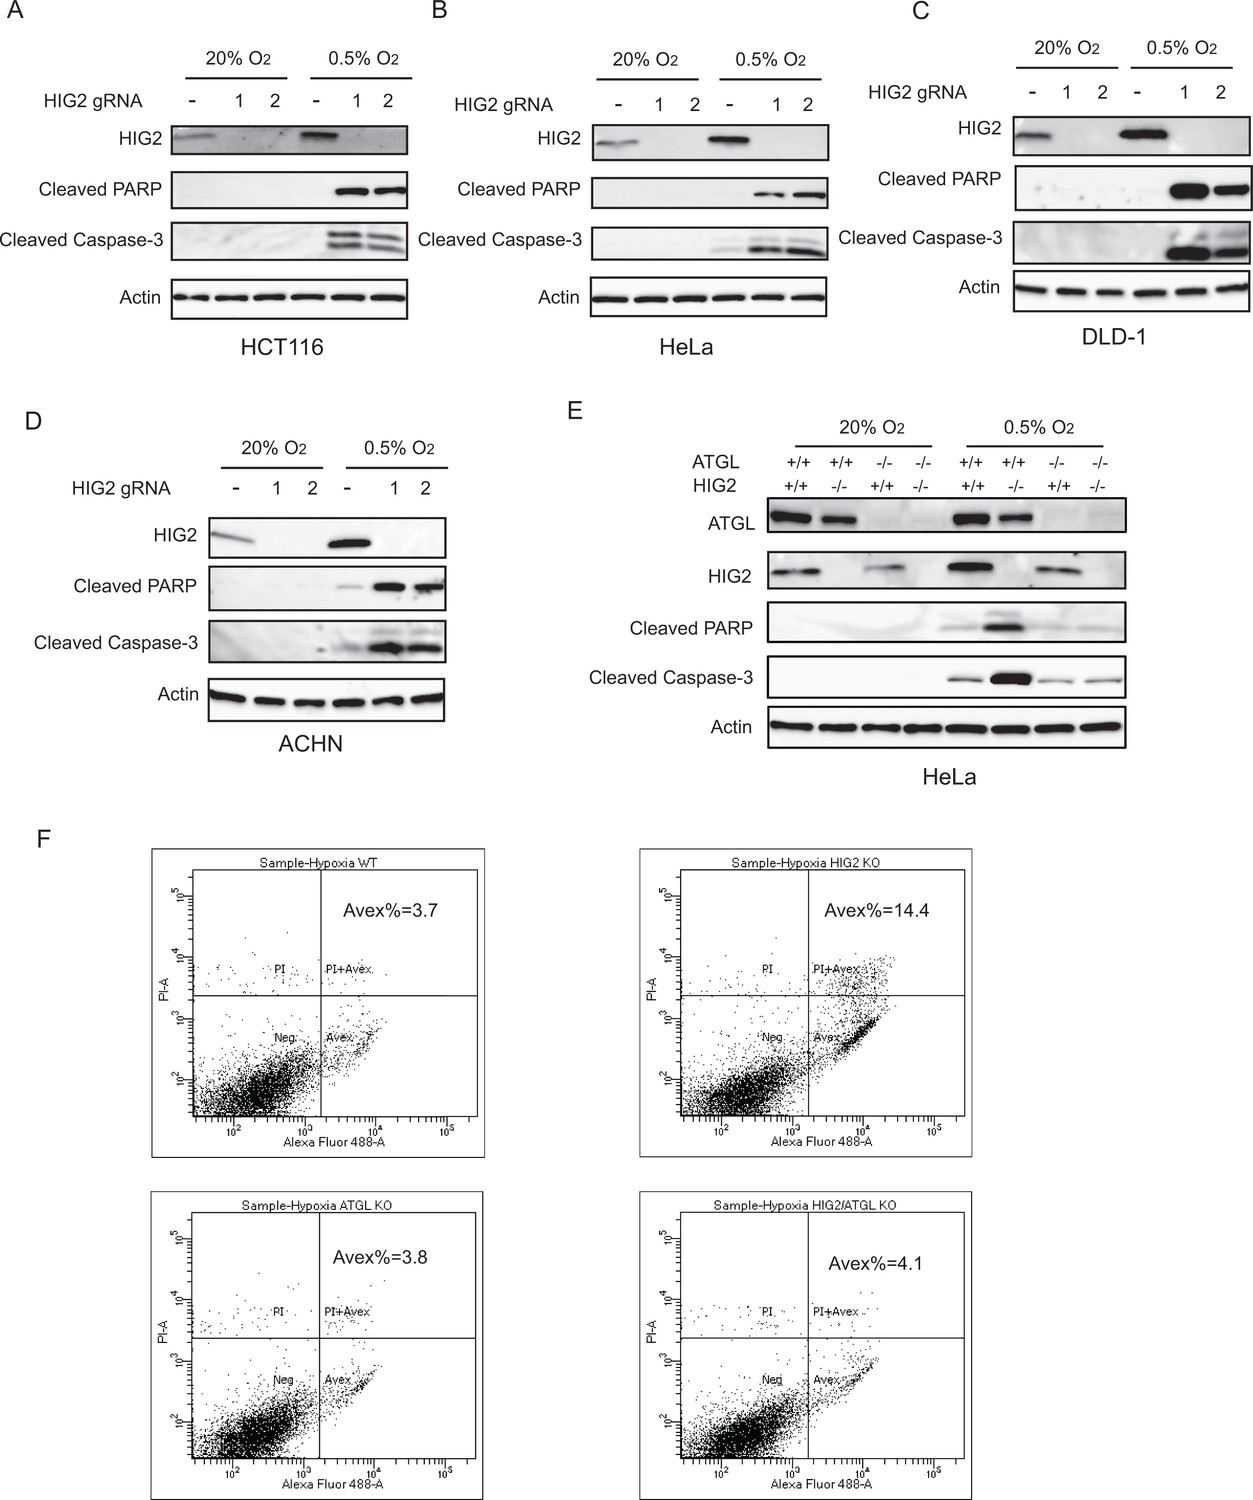
Enhancement of lipolysis induces apoptosis under hypoxia.
(A–D) WT or HIG2 deficient clones generated from two independent gRNA were cultured under normoxia or hypoxia for 48 hr (A, B) or 72 hr (C, D). Cell apoptosis was examined by immunoblotting. (E) Immunoblotting of HeLa cell lysates after 48 hr of incubation under normoxia or hypoxia. (F) Representative imaging by Flow Cytometry in Figure 4g (Hypoxia) was shown. Graphs represent mean ± SD, and were compared by two-tailed unpaired Student t-test.
Figure 6 with 4 supplements
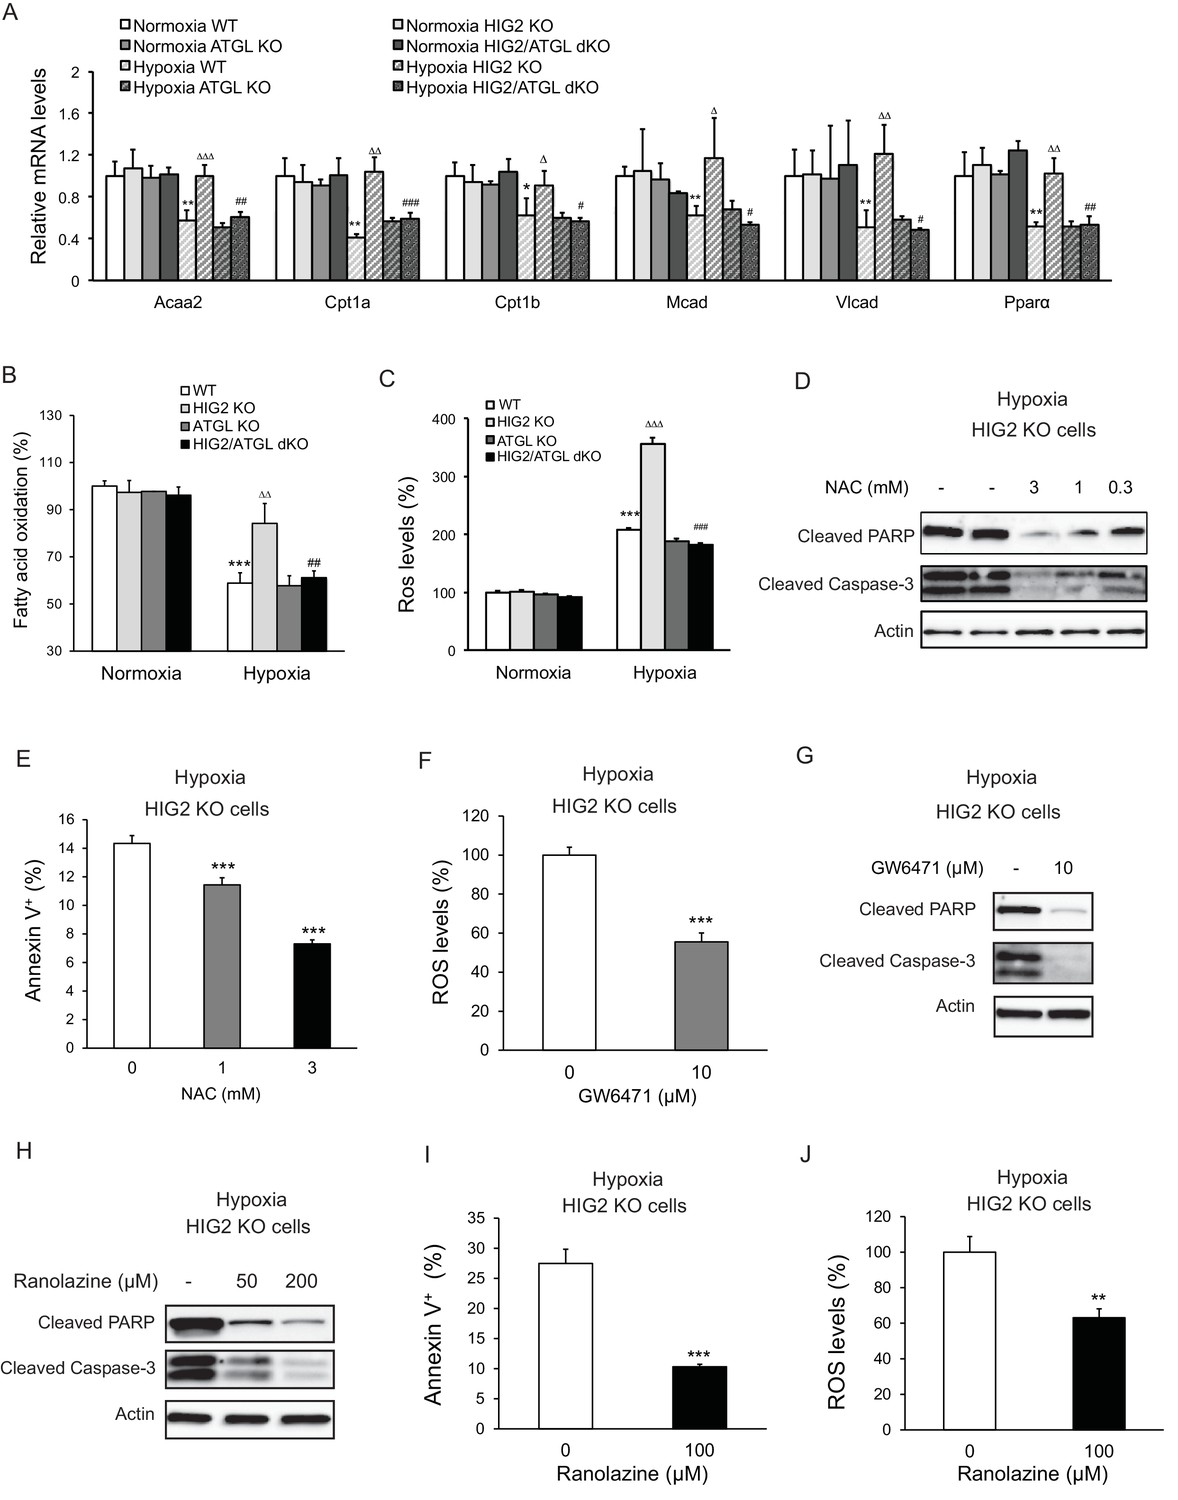
Enhancement of lipolysis in the absence of HIG2 increases PPARα activity, FAO rate and ROS production under hypoxia.
(A–C) After 36 hr of incubation under normoxia or hypoxia, mRNA levels (A), FAO (B) and ROS levels (C) were measured in HCT116 clone cells. Acaa2, acetyl-CoA acyltransferase 2; Cpt1a, carnitine palmitoyltransferase Ia; Cpt1b, carnitine palmitoyltransferase Ib; Mcad, Medium-chain acyl-CoA dehydrogenase; Vlcad, very-long-chain acyl-CoA dehydrogenase. n = 4 (WT, HIG KO) or 3 (ATGL KO, HIG2/ATGL KO) biologically independent experiments for (A); n = 5 (WT, HIG KO) or 3 (ATGL KO, HIG2/ATGL KO) biologically independent experiments for (B); n = 2 biologically independent experiments for (C). *p<0.05, **p<0.01, ***p<0.001 vs. Normoxia WT; ∆p<0.05, ∆∆p<0.01, ∆∆∆p<0.001 vs. Hypoxia WT; #p<0.05, ##p<0.01, ###p<0.001 vs. Hypoxia HIG2 KO. (D, E) HCT116 cells were cultured under hypoxia in the presence or absence of various concentrations of NAC for 48 hr. Cell apoptosis was determined by immunoblotting (D) or by staining with Annexin V for Flow Cytometry (e). n = 3 biologically independent experiments. ***p<0.001 vs. without NAC treatment. (F) ROS levels in HCT116 cells were determined by H2DCFDA after 36 hr of treatment with10 µM GW6471 under hypoxia. n = 3 biologically independent experiments. ***p<0.001 vs. without GW6471 treatment. (G) Protein levels of apoptosis markers in HCT116 cells after 48 hr of treatment with 10 µM GW6471 under hypoxia. (H–J) HCT116 cells were cultured under hypoxia in the presence or absence of ranolazine. After 48 hr of treatment, cell apoptosis was determined by immunoblotting (H) or by staining with Annexin V for Flow Cytometry (I). Intracellular ROS levels (36 hr of treatment) were determined by H2DCFDA (J). n = 3 biologically independent experiments. **p<0.01, ***p<0.001 vs. without ranolazine treatment. Graphs represent mean ±SD, and were compared by two-tailed unpaired Student t-test.
Figure 6—figure supplement 1
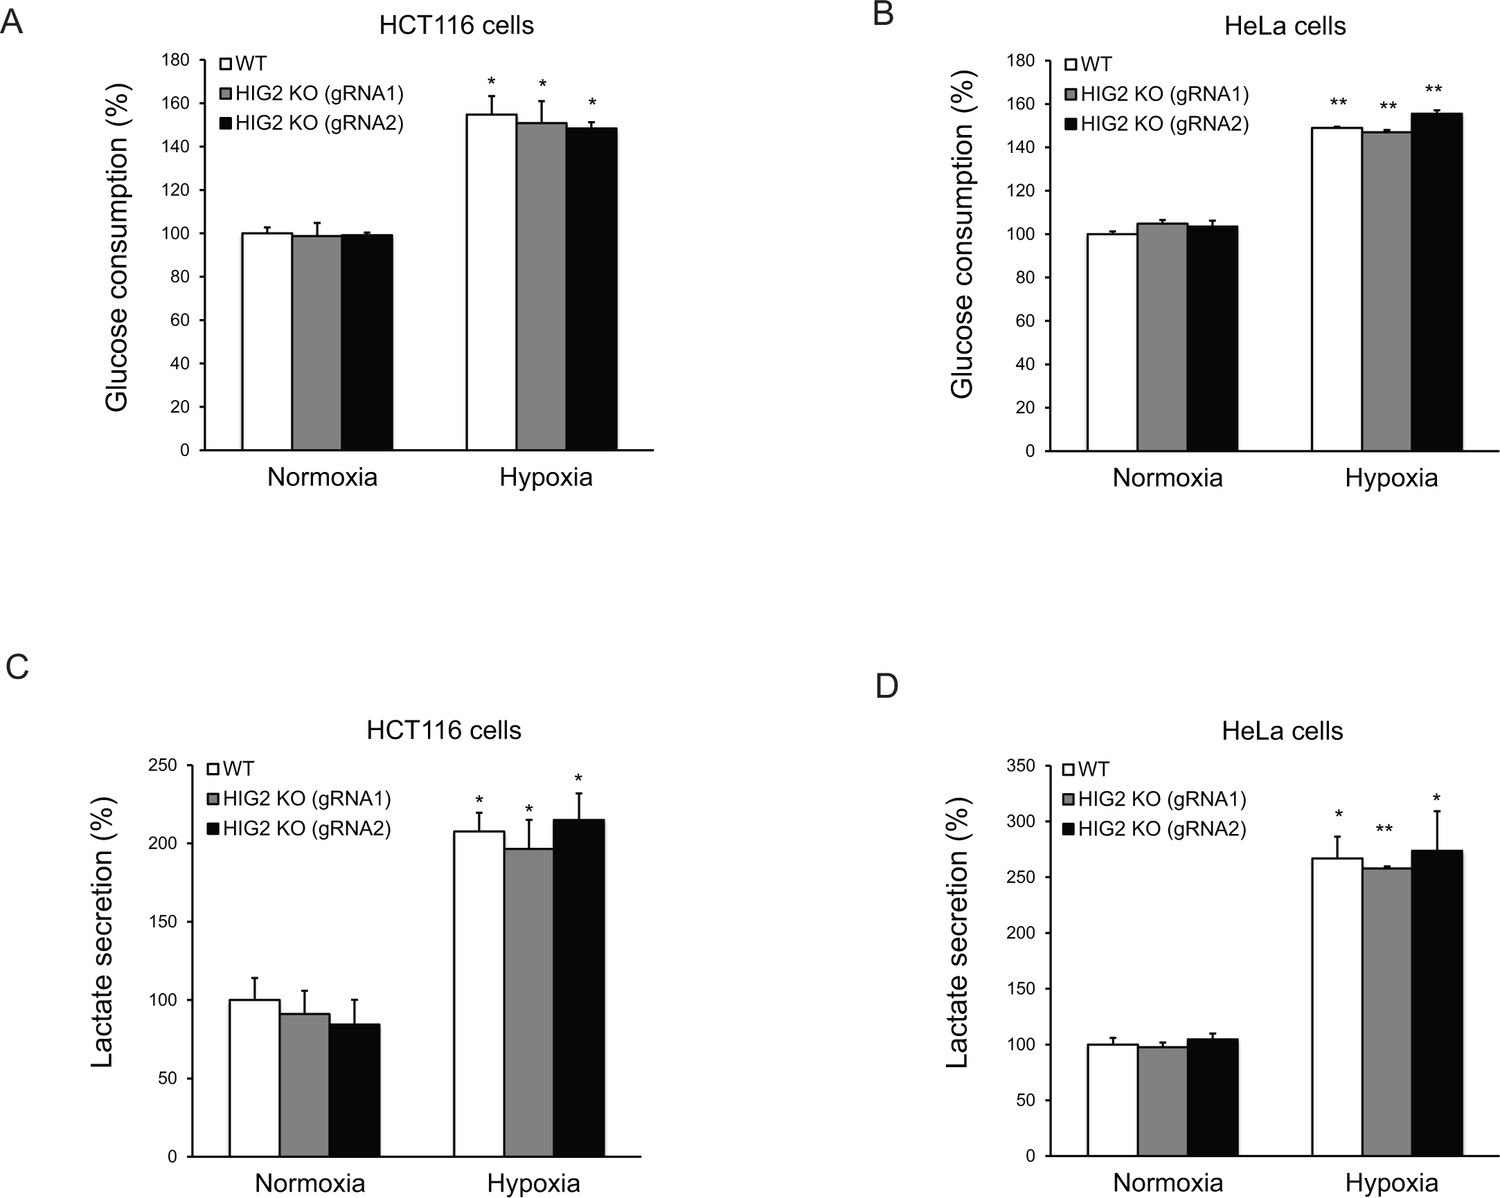
The effects of lipolysis on glucose metabolism.
HCT116 or HeLa clone cells were cultured under normoxia or hypoxia for 24 hr and then media were collected to measure glucose and lactate levels. Glucose consumption and lactate secretion were calculated based on 24 hr incubation normalized to cellular protein contents. n = 2 biologically independent experiments. *p<0.05, **p<0.01 vs. Normoxia. All data represent three independent experiments. Graphs represent mean ± SD, and were compared by two-tailed unpaired Student t-test.
Figure 6—figure supplement 2
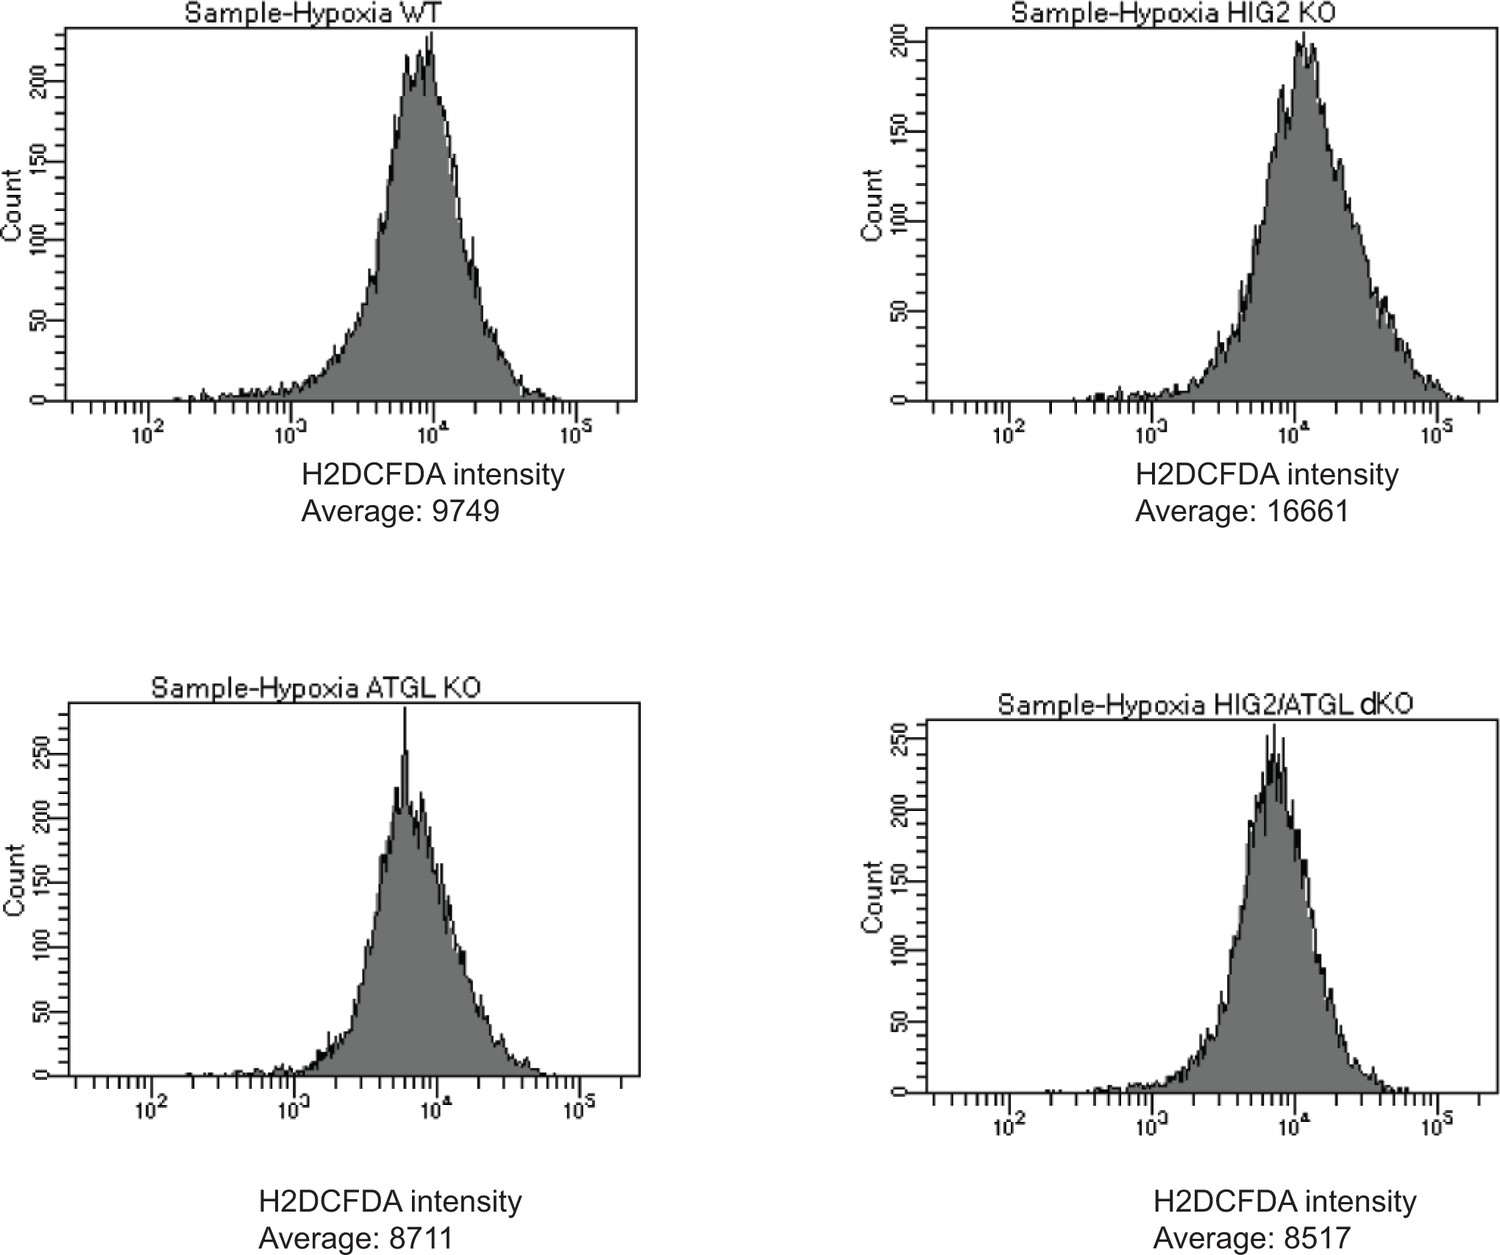
ROS levels in cells of different HCT116 CRISPR clones.
Representative imaging by Flow Cytometry in Figure 6C (Hypoxia) was shown.
Figure 6—figure supplement 3
Fatty oxidation and apoptosis in HCT116 cells.
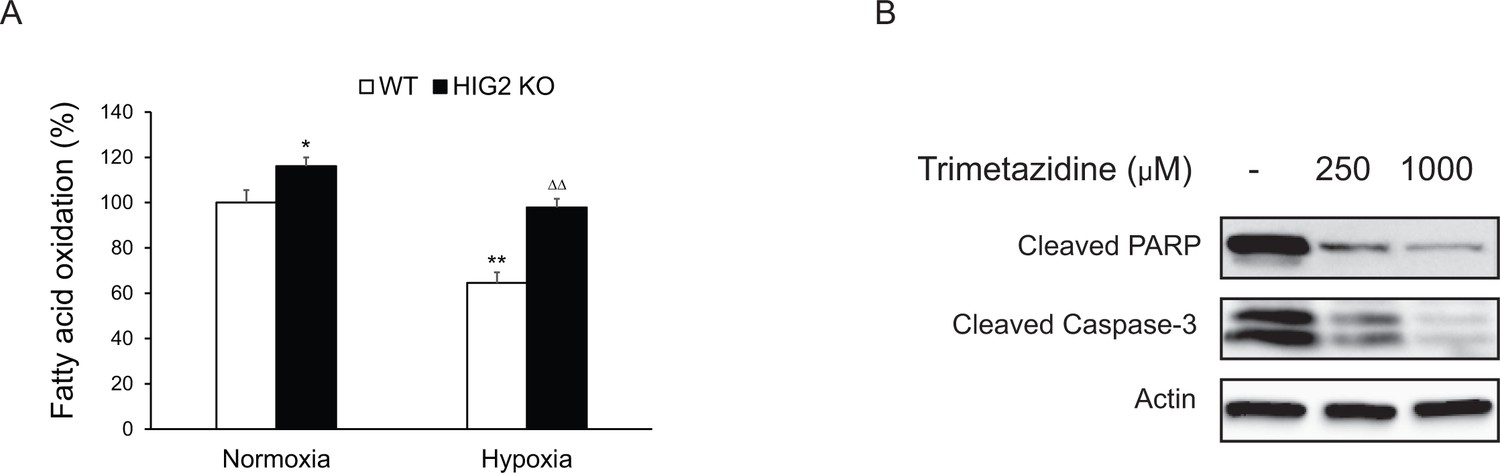
(A) Fatty acid oxidation was measured based on the 3H2O production from [9,10- 3H]-oleate. Cells were incubated with 2 ml of BSA-complexed oleate (0.2 mM unlabeled plus 2 μCi/ml of [9, 10- 3H] oleate and 0.2% BSA) in 10% FBS medium. Twenty four hours later, the medium was replaced with fresh 10% FBS medium without oleate and incubated in normoxia or hypoxia for 24 hr. Then cells were cultured in fresh serum-free medium containing 0.2% BSA for another six hours and the medium was collected for measuring 3H2O production. *p<0.05, **p<0.01, vs. Normoxia WT; ∆∆p<0.01 vs. Hypoxia WT. n = 3 biologically independent experiments. Graphs represent mean ± SD, and were compared by two-tailed unpaired Student t-test. (B) HCT116 HIG2 KO cells were cultured under hypoxia in the presence or absence of trimetazidine for 48 hr. Cell apoptosis was determined by immunoblotting.
Figure 6—figure supplement 4
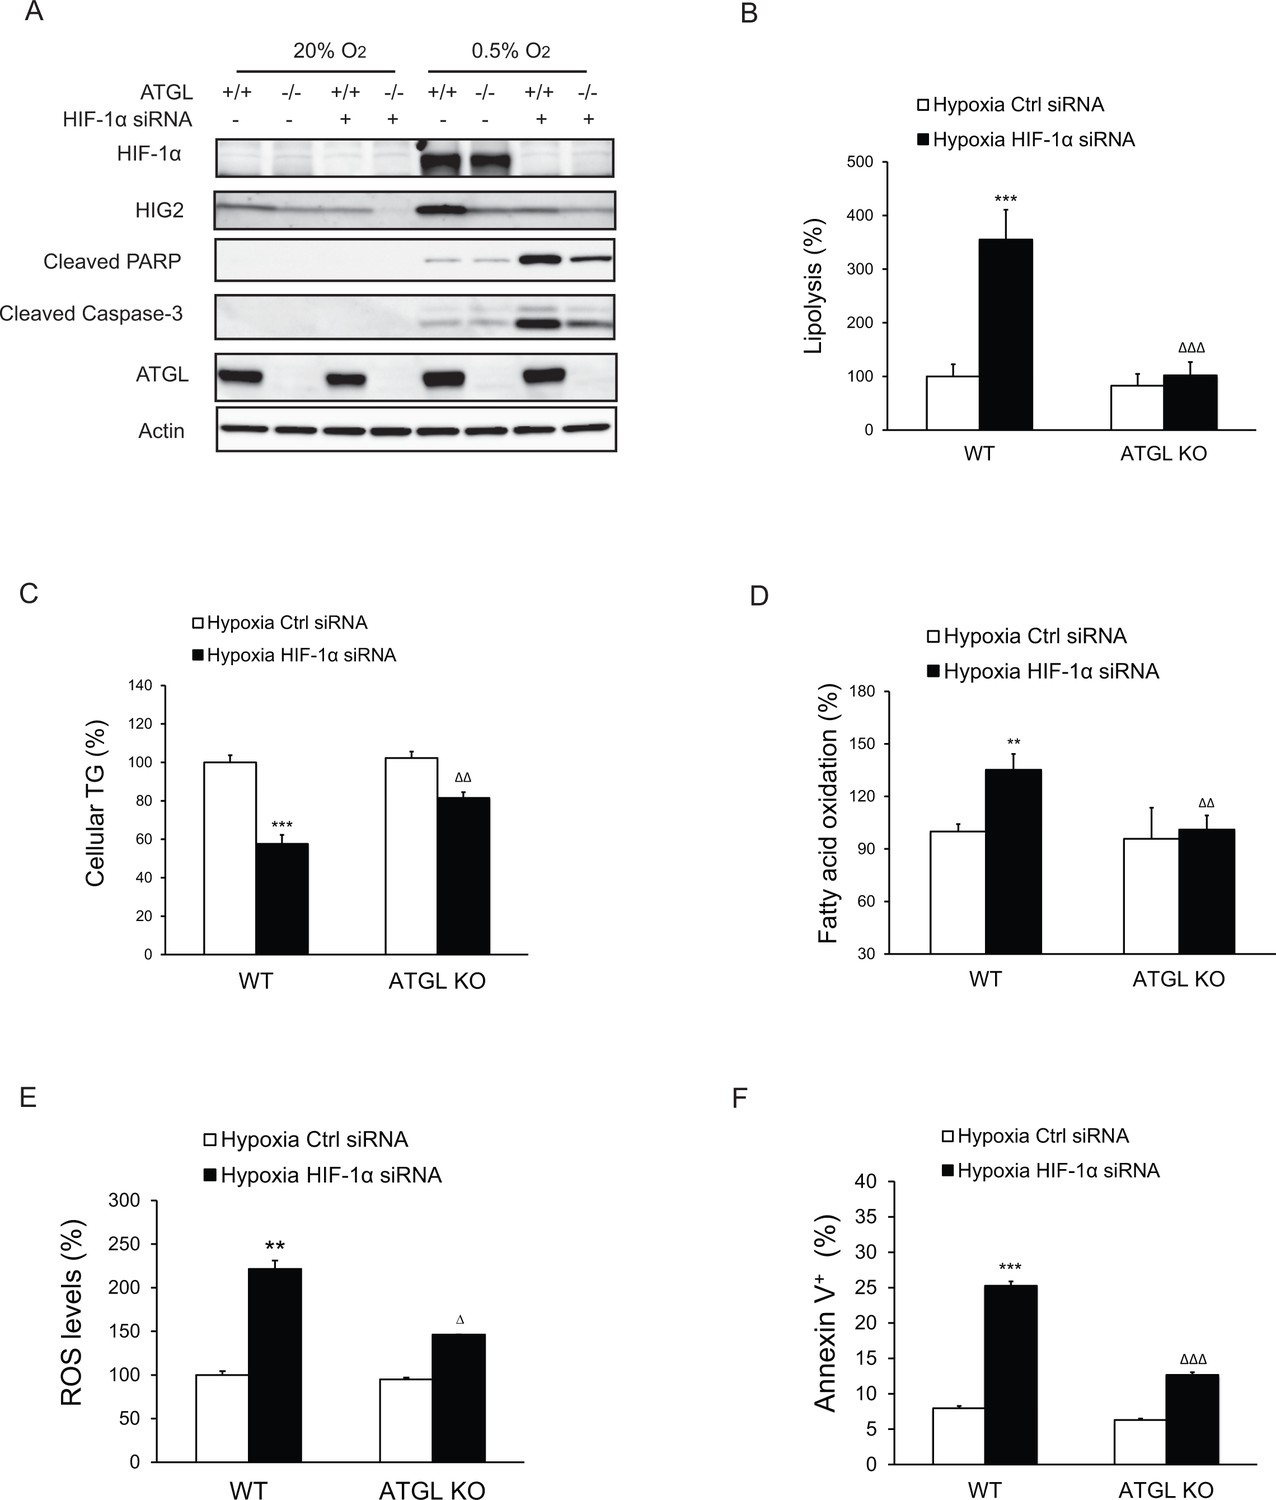
Apoptosis induced by HIF-1α knockdown is lipolysis-dependent.
HCT116 WT or ATGL KO clone cells were transfected with control siRNA or HIF-1α specific siRNA for 24 hr, followed by incubation under normoxia or hypoxia for indicated times. (A) Cell apoptosis was detected by immunoblotting after 48 hr of incubation under normoxia or hypoxia. (B, C) Lipolysis (B) or TG contents (C) in cells after 24 hr of incubation under hypoxia. (D, E) FAO (D) or ROS levels (E) in cells after 36 hr of incubation under hypoxia. (F) Cell apoptosis was detected by Flow Cytometry after 48 hr of incubation under hypoxia. All data represent three independent experiments. n = 6 biologically independent experiments for (B); n = 4 biologically independent experiments for (C); n = 4 biologically independent experiments for (D); n = 3 biologically independent experiments for (E); n = 3 biologically independent experiments for (F). **p<0.01, ***p<0.001 vs. WT Hypoxia Ctrl siRNA; ∆∆p<0.01, ∆∆∆p<0.001 vs. WT Hypoxia HIF1α siRNA. Graphs represent mean ± SD, and were compared by two-tailed unpaired Student t-test.
Figure 7 with 1 supplement

Enhancement of lipolysis delays tumor growth in vivo.
(A–D) HCT116 clone cells were injected subcutaneously into both flanks of nude mice. (A) Imaging of representative mice at the end of the experiment. (B) Tumor growth curves were measured starting from 11 days after inoculation. (C) Tumors were extracted and weighted at the end of the experiment. (D) Representative imaging of oil red O staining, cleaved caspase-3 immunostaining and 4-HNE immunostaining. Data represent mean ±SEM from independent xenografts (WT, n = 12; HIG KO, n = 16; ATGL KO, n = 10; HIG2/ATGL KO, n = 12). **p<0.01, ***p<0.001 vs. WT; ∆∆∆p<0.001 vs. HIG2 KO. (E and F) HeLa clone cells were injected subcutaneously into both flanks of nude mice. (E) Tumor growth curves were measured starting from 11 days after inoculation. (F) Tumors were weighted at the end of the experiment. Data represent mean ±SEM from independent xenografts (WT, n = 12; HIG KO, n = 10; ATGL KO, n = 12; HIG2/ATGL KO, n = 8). *p<0.05, **p<0.01 vs. WT; ∆p<0.05 vs. HIG2 KO.
Figure 7—figure supplement 1
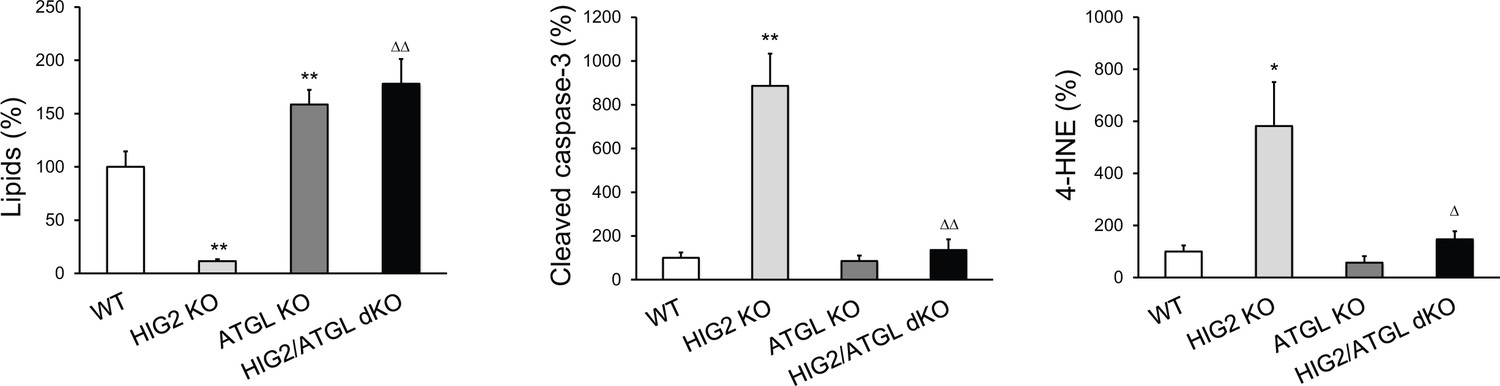
Quantification of oil red O staining, cleaved caspase-3 immunostaining and 4-HNE immunostaining in tumor xenografts.
The intensity of tissue staining presented in Figure 7D was quantified by using the ImageJ software. *p<0.05, **p<0.01 vs. WT; ∆p<0.05, ∆∆p<0.01 vs. HIG2 KO. Data represent mean ± SD from independent xenografts (n = 3).
Figure 8 with 2 supplements
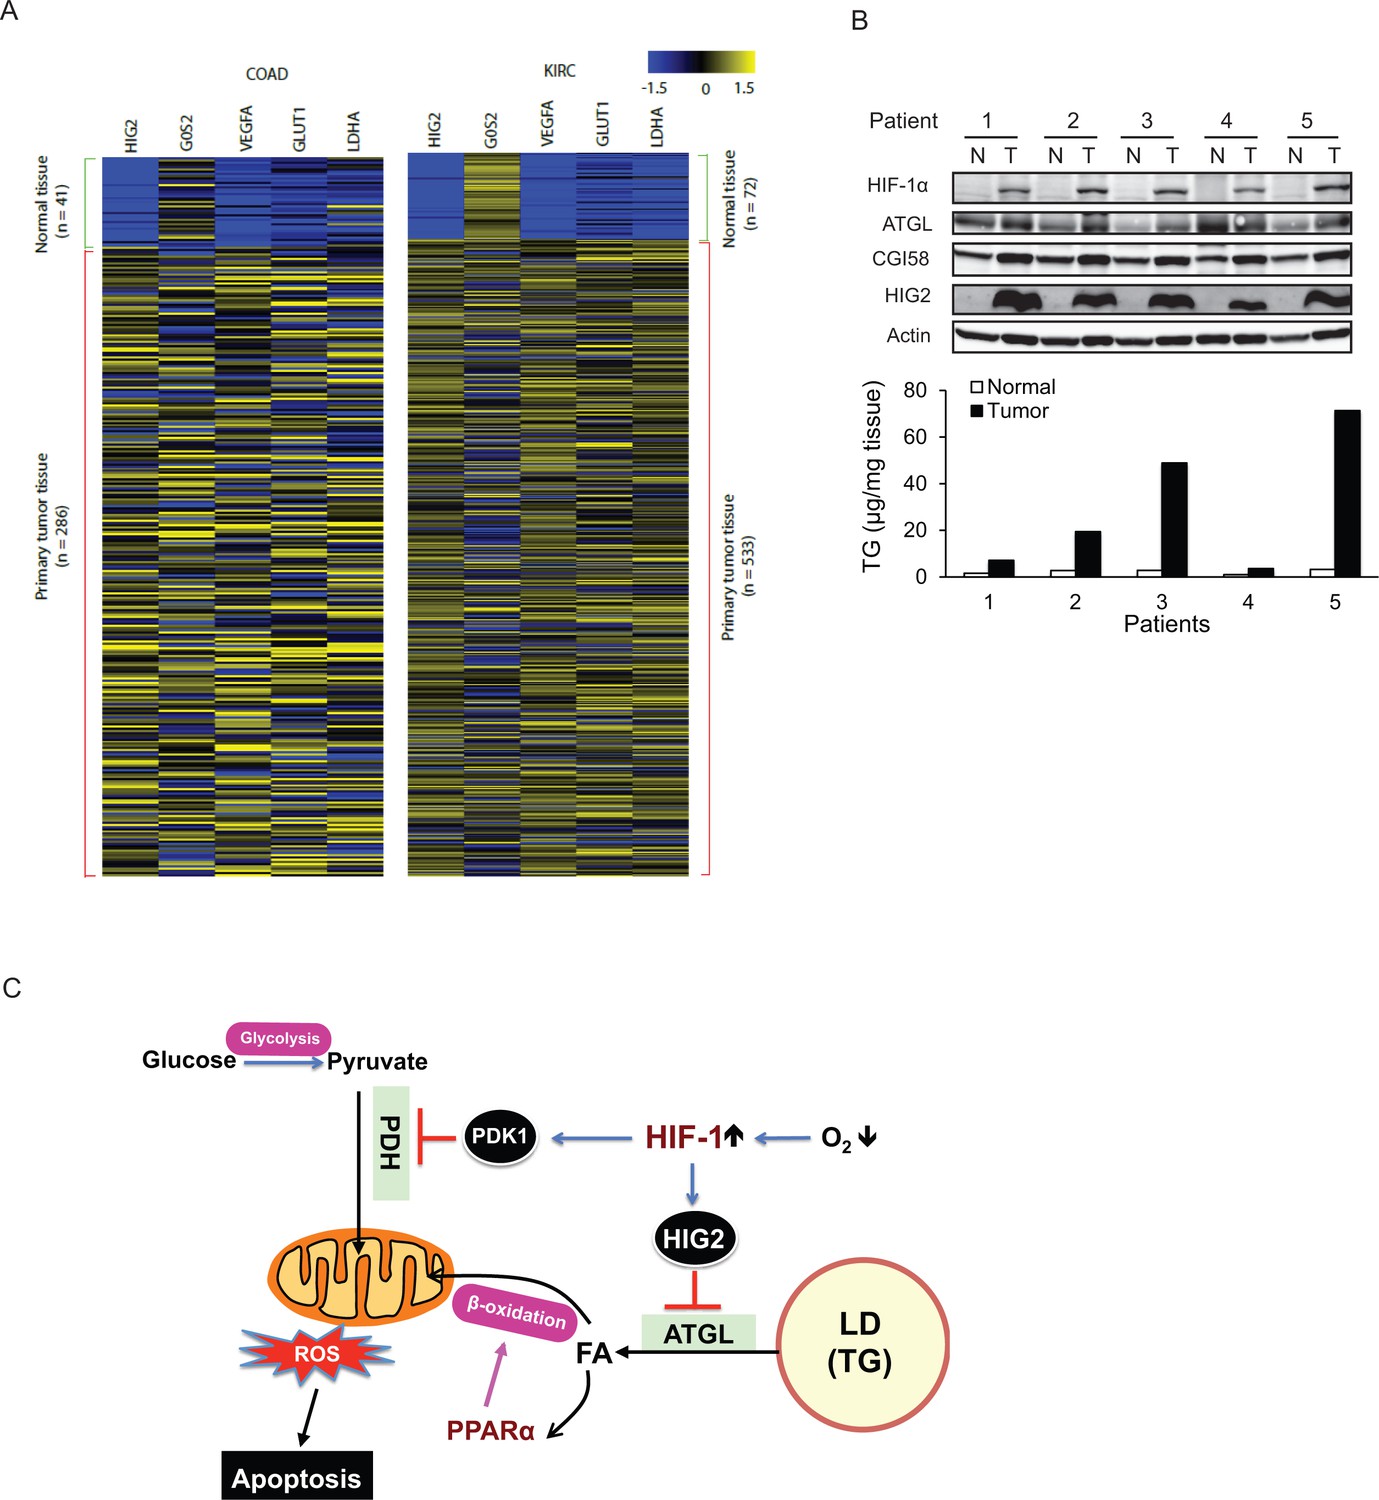
The antilipolytic signal is upregulated in human cancers.
(A) Heat map of gene expression in colon adenocarcinoma (COAD) and kidney renal clear cell carcinoma (KIRC). Pan-cancer normalized expression scores were further Z-score normalized, and fold changes of expression were reported as Log2. Vegfa, vascular endothelial growth factor A; Glut1, glucose transporter 1; Ldha, lactate dehydrogenase A. (B) Protein expression and TG content were examined in kidney tissues from human with renal cell cancer. T = kidney tumor, N = adjacent normal kidney tissue. (C) The proposed model illustrating the protective role of HIF-1-dependent HIG2 expression and lipid storage against oxidative stress under hypoxia.
Figure 8—figure supplement 1

Differential expression of HIG2 mRNA in tumor specimens and adjacent normal tissues.
Compare HIG2 expression between tumor and matched normal tissue in 20 TCGA cancer types. The expression values of HIG2 were downloaded from the UCSC (University of California, Santa Cruz) cancer browser (https://genome-cancer.ucsc.edu/). Gene expression was reported as Log2. P values were calculated using two-tailed unpaired Student t-test. Number in round brackets indicates ‘number of patients’. NT = matched normal tissue; TP = primary tumor tissue. BLCA, bladder urothelial carcinoma; BRCA, breast invasive carcinoma; CESC, cervical squamous cell carcinoma and endocervical adenocarcinoma; CHOL, cholangiocarcinoma; LUSC, lung squamous cell carcinoma; PAAD, pancreatic adenocarcinoma; PCPG, pheochromocytoma and paraganglioma; PRAD, prostate adenocarcinoma; COAD/READ, colon/rectum adenocarcinoma; GBM, glioblastoma multiforme; HNSC, head and neck squamous cell carcinoma; KICH, kidney chromophobe; SARC, sarcoma; THCA, thyroid carcinoma; UCEC, uterine corpus endometrial carcinoma; KIRC, kidney renal clear cell carcinoma; KIRP, kidney renal papillary cell carcinoma; LIHC, liver hepatocellular carcinoma; LUAD, lung adenocarcinoma.
Figure 8—figure supplement 2
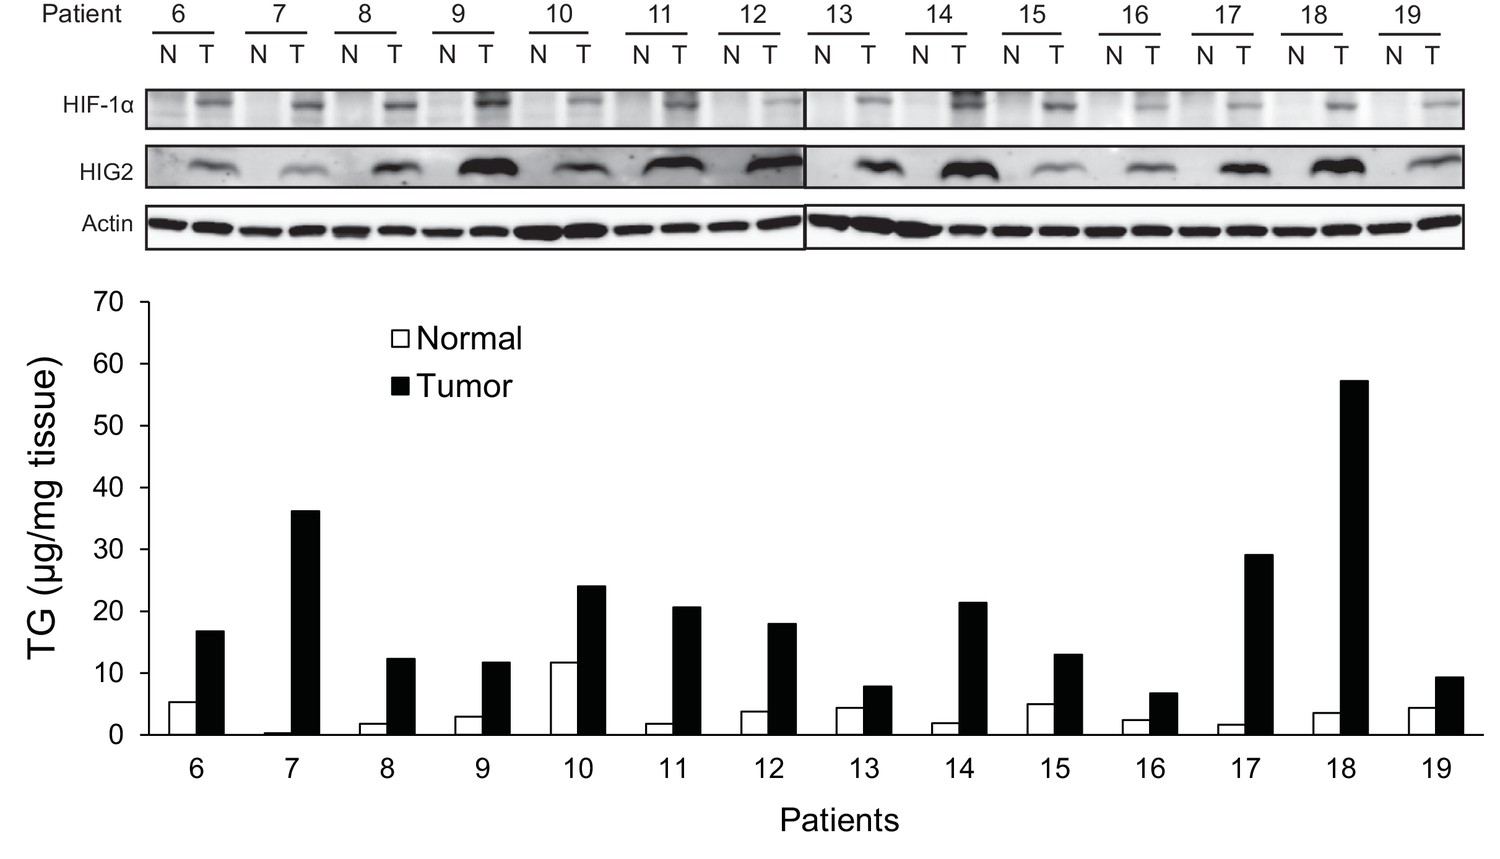
HIG2 expression is upregulated in human renal cell cancer tissues.
Protein expression and TG content were examined in kidney tissues from human with renal cell cancer. T = kidney tumor, N = adjacent normal kidney tissue.
Additional files
-
Transparent reporting form
- https://doi.org/10.7554/eLife.31132.019
Download links
A two-part list of links to download the article, or parts of the article, in various formats.
Downloads (link to download the article as PDF)
Open citations (links to open the citations from this article in various online reference manager services)
Cite this article (links to download the citations from this article in formats compatible with various reference manager tools)
Inhibition of intracellular lipolysis promotes human cancer cell adaptation to hypoxia
eLife 6:e31132.
https://doi.org/10.7554/eLife.31132


