Autocatalytic microtubule nucleation determines the size and mass of Xenopus laevis egg extract spindles
- Max Planck Institute of Molecular Cell Biology and Genetics, Germany
- Center for Systems Biology Dresden, Germany
- Max Planck Institute for the Physics of Complex Systems, Germany
Figures
Figure 1 with 3 supplements
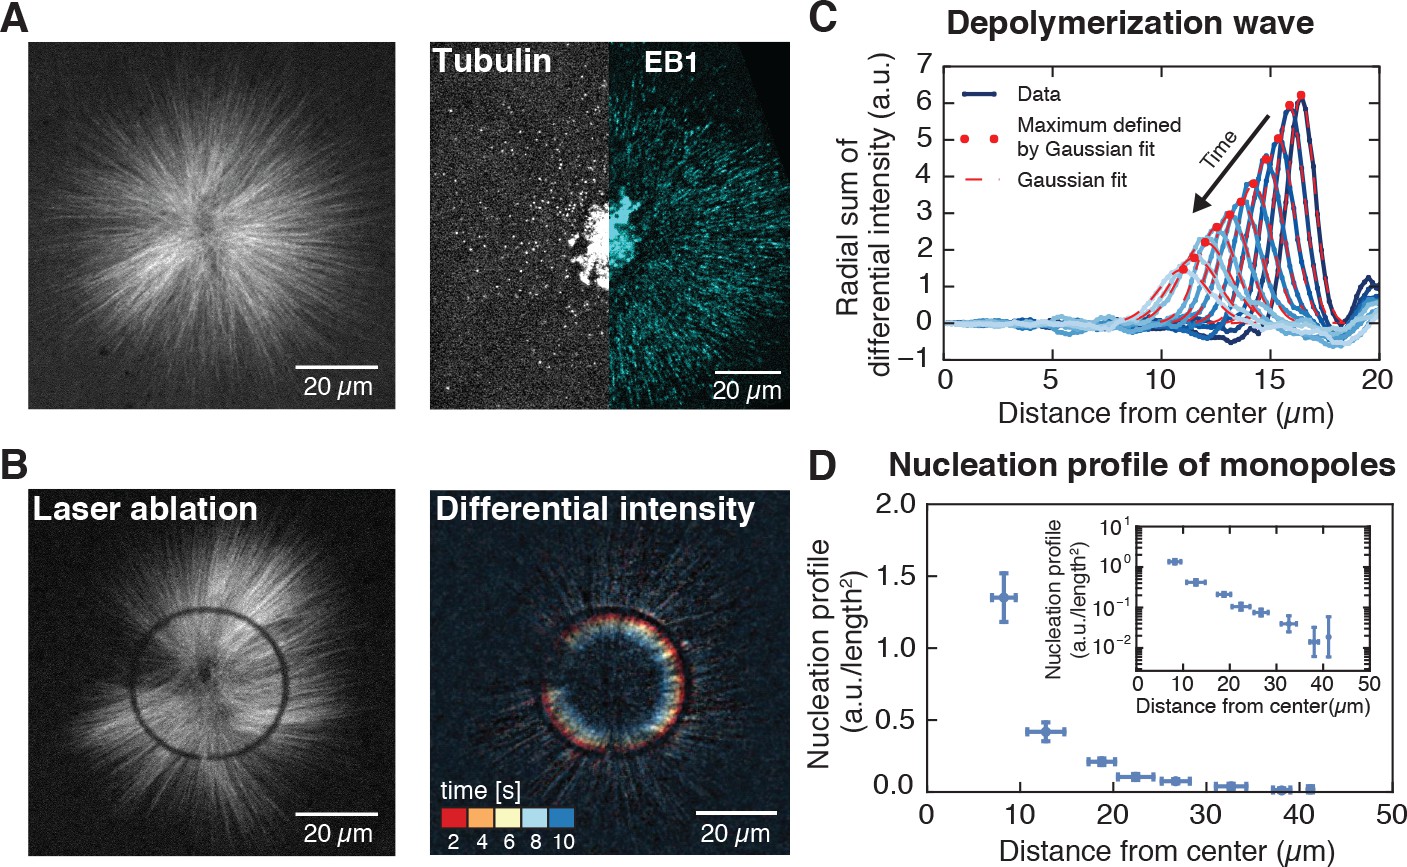
Microtubule nucleation in monopolar spindles is spatially regulated.
(A) Fluorescence image of a monopolar spindle (left), and single-molecule fluorescent tubulin and EB1-GFP (right). (B) Circular laser cut and corresponding differential intensity depolymerization front at different times. (C) Radial sum of differential intensities at different time points (from dark to light blue) of one cut at a radius of 19 μm from the center. The area under each curve equals the mass of microtubules depolymerized per time interval of 2 s. (D) Nucleation profile of monopolar spindles (N = 117 cuts, mean SD).
Figure 1—figure supplement 1
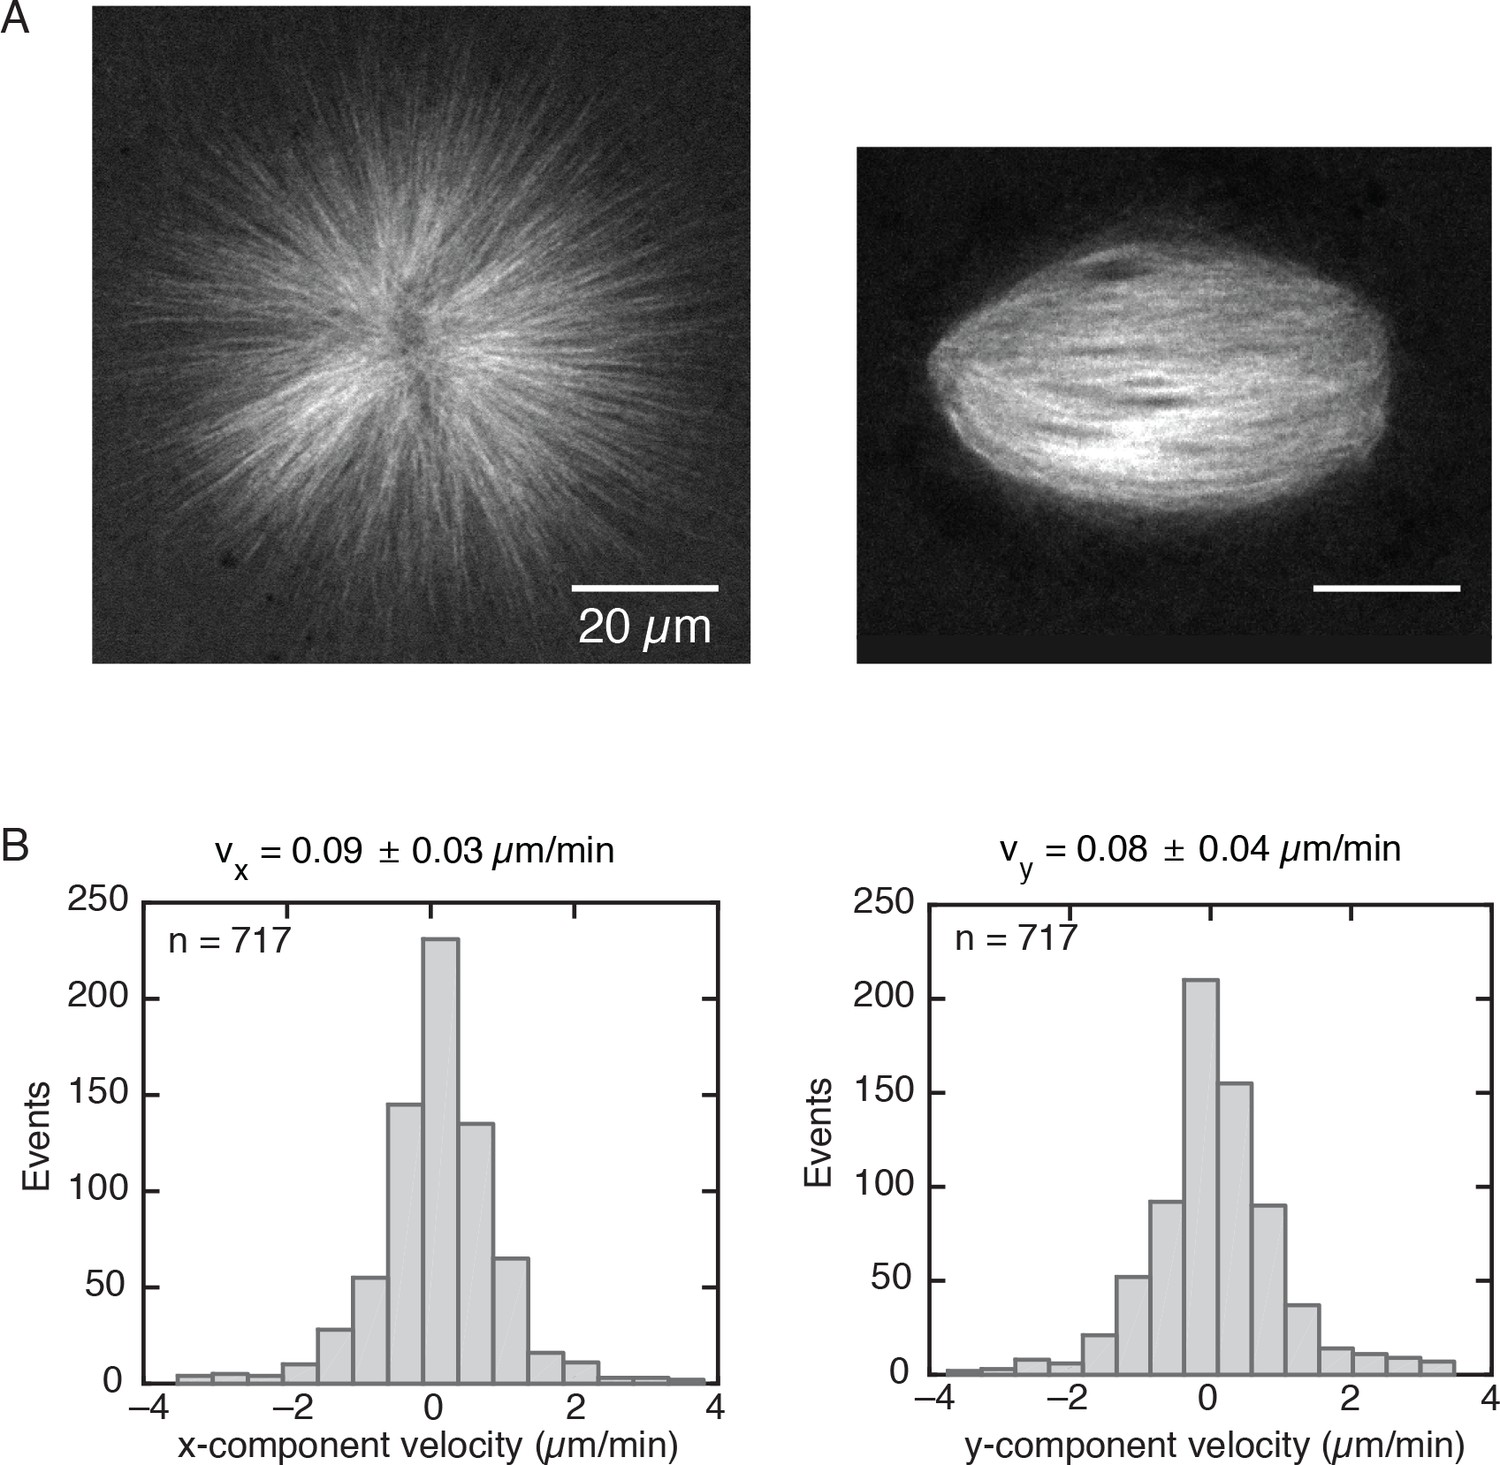
Monopolar spindles have a similar size as regular spindles.
(A) Left, monopolar spindle assembled with 200 µM STLC and labeled with 150 nM atto-565 tubulin. Right, regular spindle. (B) Velocity distributions of speckles in a monopole obtained by analyzing three different regions from Video 2 (n = 717 speckles total). The velocity distributions correspond to the x and y-components given a cartesian reference frame. The and velocity components of a speckle trajectory were computed as the difference between the final and initial position of the speckle along a given component, divided by the total speckle lifetime. The mean speckle velocities along each component are = 0.09 0.03 µm/min and = 0.08 0.04 µm/min (mean SDM). The average modulus of the speckle velocity is = 0.12 ± 0.07 µm/min.
Figure 1—figure supplement 2
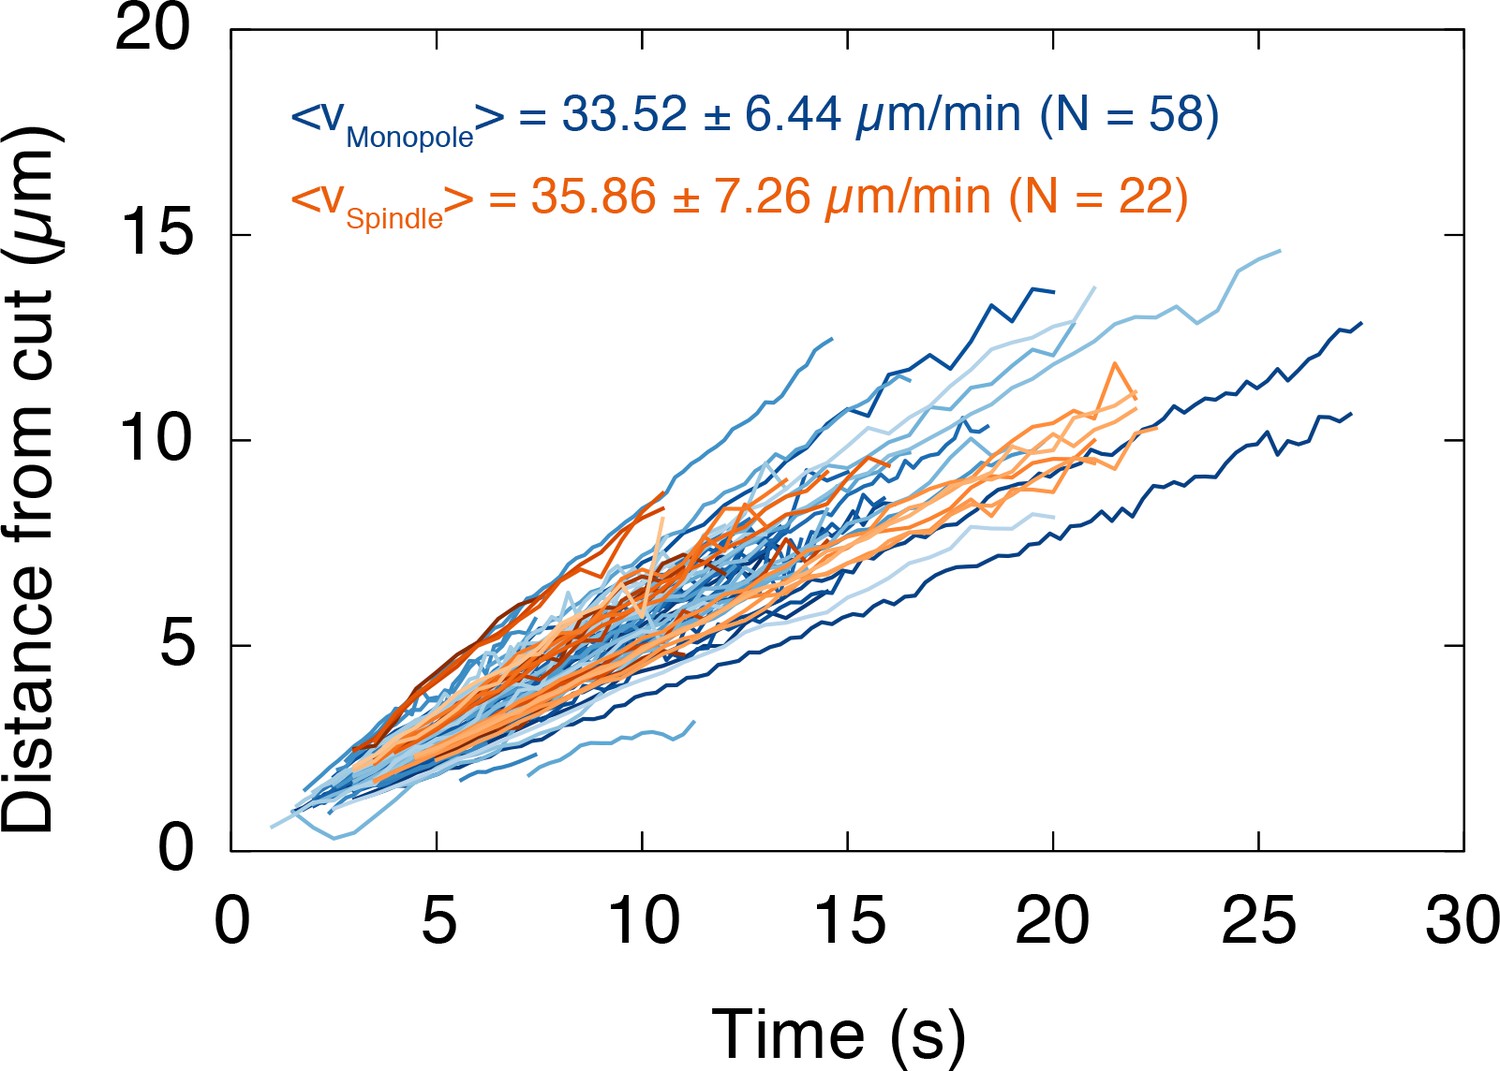
The depolymerization velocity of microtubules in monopolar spindles is indistinguishable from the one in spindles.
We plotted the position of the depolymerization wave after a cut, which was determined by the maximum of the fitted Gaussians, over time. Each line corresponds to one wave (i.e. one cut). Data for monopoles and spindles are shown in blue and orange, respectively. The slope of each dataset corresponds to the depolymerization velocity of the cut microtubules (mean depolymerization velocity ± SD, Nmonopole = 58, Nspindle = 22).
Figure 1—figure supplement 3
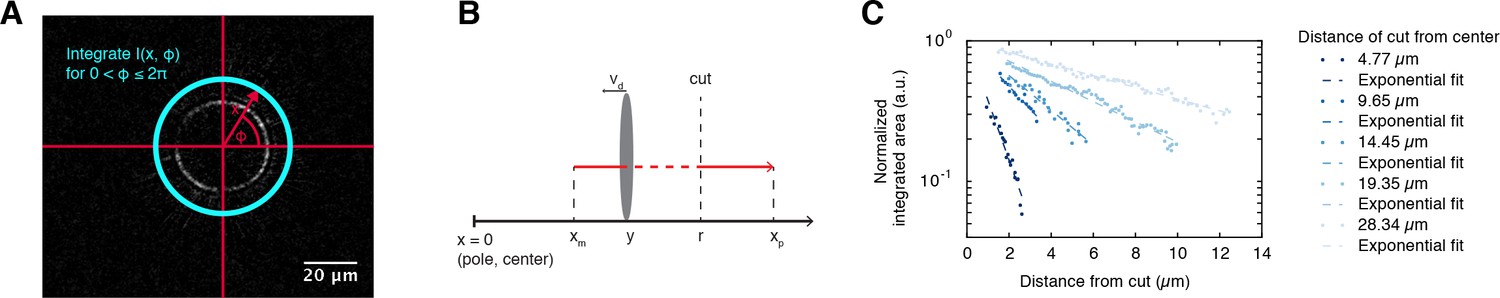
Depolymerization wave of microtubules cut by laser ablation.
(A) Coordinate system for plotting differential intensities. Differential intensities , where is the distance from the center of the monopole and is the angular coordinate, were integrated over for each value of . The origin of the polar coordinate system was always set to be in the center of the monopolar spindle. Next, we plotted the integrated differential intensities as a function of for each time point of the differential intensity movie (see Figure 1C). (B) Definitions of the variables used in the cutting method: , are the locations of minus/plus-ends with respect to the center of the monopole, is the radius of the cut, is the depolymerization velocity, and is the position of the depolymerization front with respect to the center of the monopole. (C) The log-linear plot shows the normalized integrated areas of the Gaussian fits (Figure 1C) as a function of the distance that the wave travels away from the cut, given cuts performed at different locations (the lighter the color the further was the cut from the monopole center). Dashed lines represent linear fits to the log-linear data normalized such that the interception with the y-axis equals unity.
Figure 2 with 1 supplement
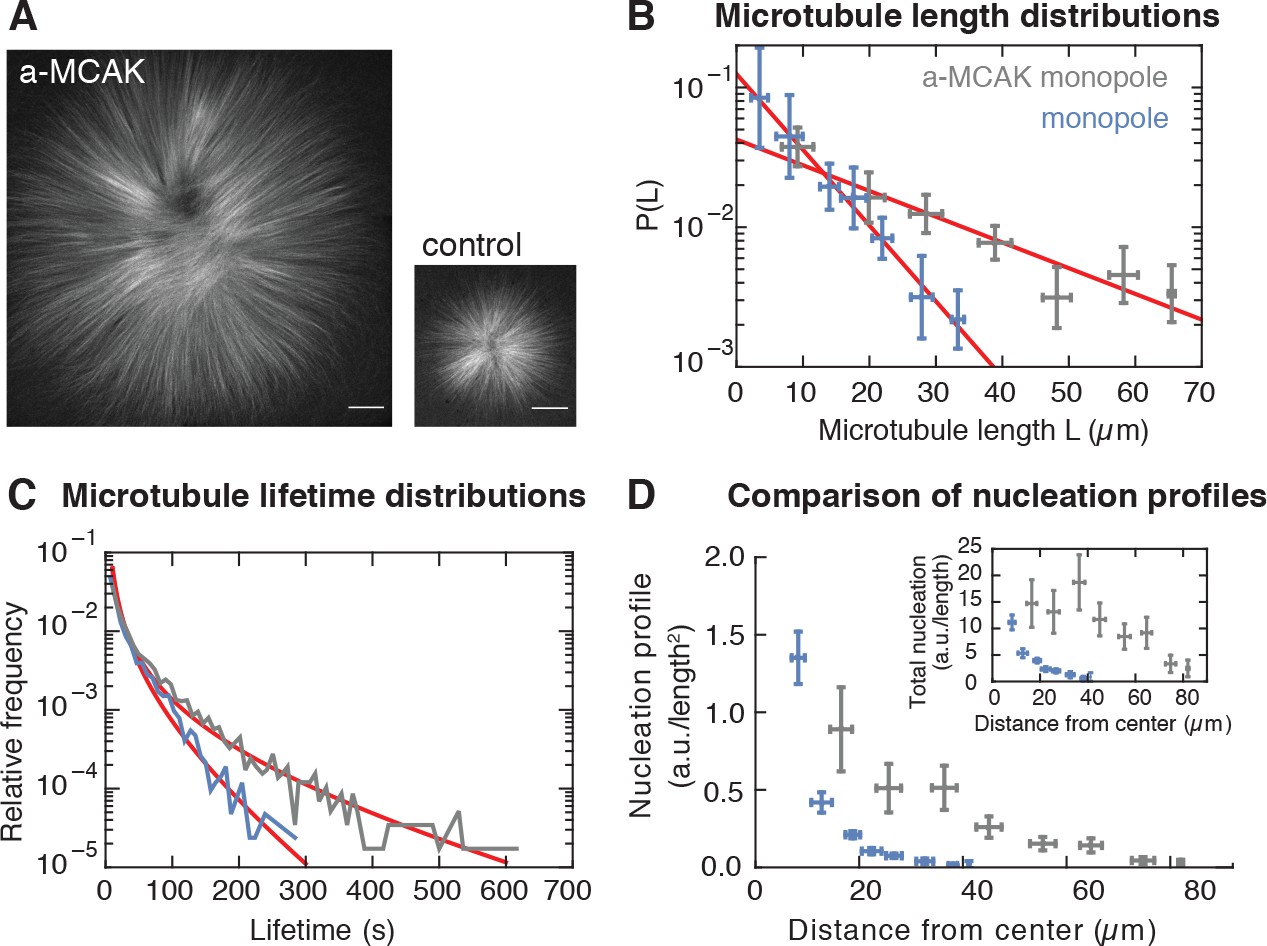
Microtubule nucleation depends on the stability of microtubules.
(A) Inhibition of MCAK leads to larger steady-state monopoles. Scale bar = 20 µm (B) Microtubule length distributions measured from laser ablation and fitted to an exponential (mean SD). (C) Normalized histograms of microtubule lifetimes of control (N = 5331 speckles, five structures) and MCAK-inhibited monopoles (N = 7289 speckles, three structures), and corresponding first-passage time fits (see Methods and materials). (D) Nucleation profile of control (N = 117 cuts) and MCAK-inhibited monopoles (N = 74 cuts) in arbitrary units that are consistent in both structures (mean SD). The inset shows both nucleation profiles multiplied by the circumference length at each radius, which corresponds to the total microtubule nucleation at that distance from the center of the monopole.
Figure 2—figure supplement 1
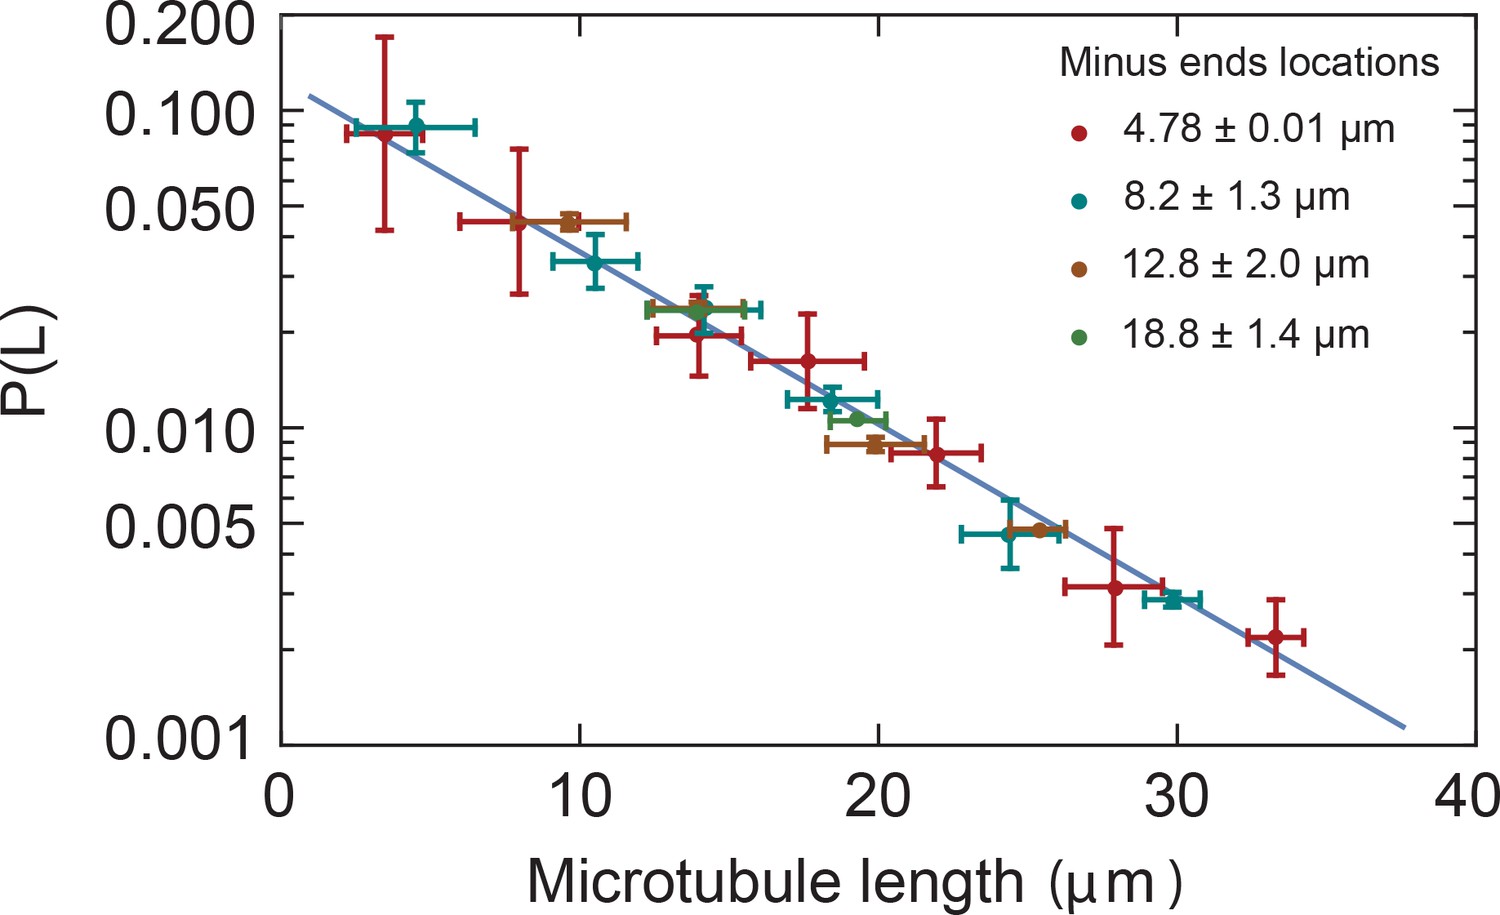
Microtubule length distributions are independent of the position in monopoles.
Microtubule length distributions measured from minus ends at locations 4.78 0.01 µm, 8.2 1.3 µm, 12.8 2.0 µm, and 18.8 1.4 µm from the center of the monopole (mean SD). The solid line corresponds to the exponential fit to the monopole data from Figure 2B.
Figure 3 with 2 supplements
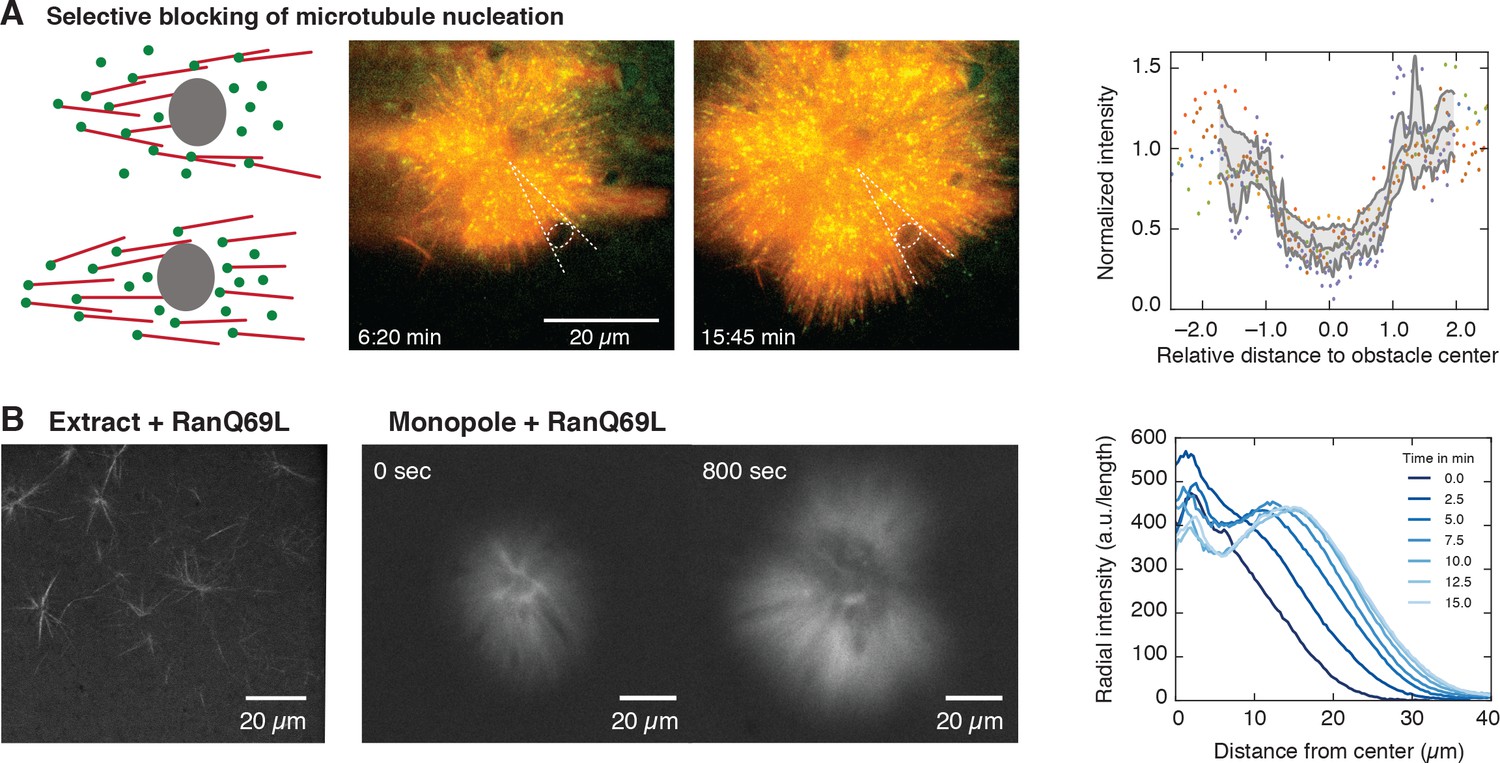
Microtubule nucleation requires physical proximity to pre-existing microtubules.
(A) Inert obstacles (fluorocarbon oil microdroplets or polystyrene beads) immobilized to coverslips selectively block microtubule nucleation. Left: Schematic outcomes depending on whether new microtubules are nucleated in physical proximity from pre-existing microtubules (top) or not (bottom). Middle: Two time points of a microtubule structure with labeled tubulin (red) and EB1-GFP (green) growing around immobilized frog sperm chromosomes. The oil microdroplet is highlighted with a dashed ellipse. Right: Normalized line profiles of shadow regions behind six different obstacles (colored dots). The intensity profiles were normalized to the average intensity outside the obstacles and rescaled to the radius of the obstacle. Gray lines show mean SD. (B) Left: Addition of RanQ69L to extract homogeneously activates nucleation and creates mini asters after 20 min (22). Middle: Addition of RanQ69L to monopoles leads to immediate growth of new microtubules from the pre-existing monopoles. Right: Quantification of radial fluorescence intensity profiles at different time points of the growing monopole shown in the middle.
Figure 3—figure supplement 1
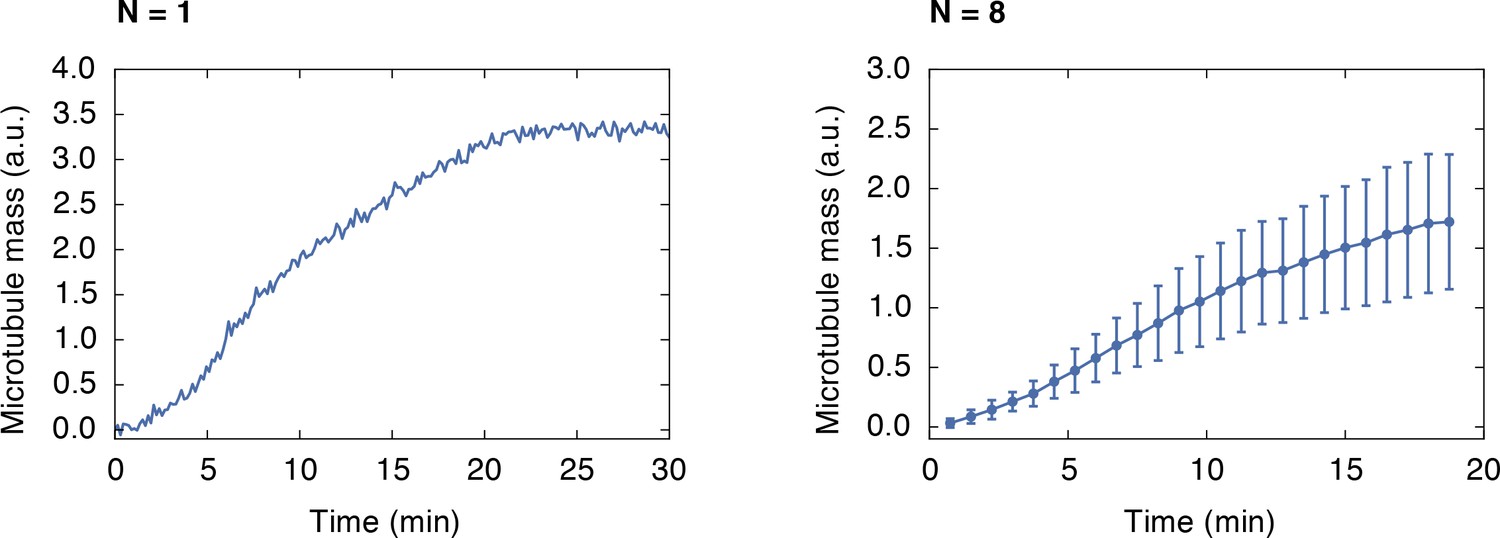
Growth of a monopolar spindle.
Integrated fluorescence intensity of z-stacks of a microtubule structure labeled with 150 nM Atto565-tubulin growing around frog sperm over time (left). The right side shows the average of 8 structures (mean SD).
Figure 3—figure supplement 2
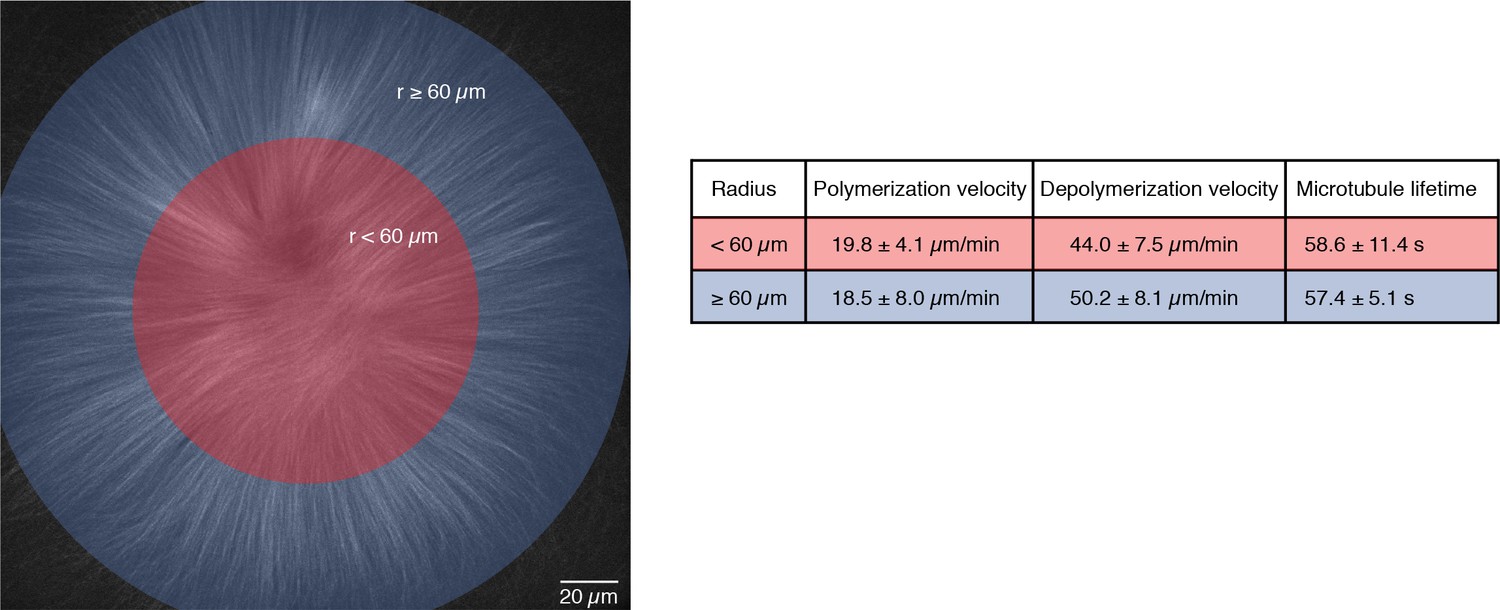
Microtubule dynamics are the same within the entire MCAK-inhibited monopolar spindle.
We compared microtubule dynamics in the inner (radius < 60 m) and outer regions (radius ≥ 60 m) of MCAK-inhibited monopolar spindles. Polymerization velocities were measured by analyzing the speed of EB1-GFP comets in each region (N = 14 for each region, in three different structures from different reactions on the same extract day). Depolymerization velocities were calculated from laser ablation experiments on many different days (N = 55 cuts for the inner region and N = 13 cuts for the outer region). We used single tubulin speckle microscopy to measure the average lifetimes of microtubules (1455 speckles for the inner region and 3418 speckles for the outer region in the same structure). All values are given as mean SD.
Figure 4 with 1 supplement
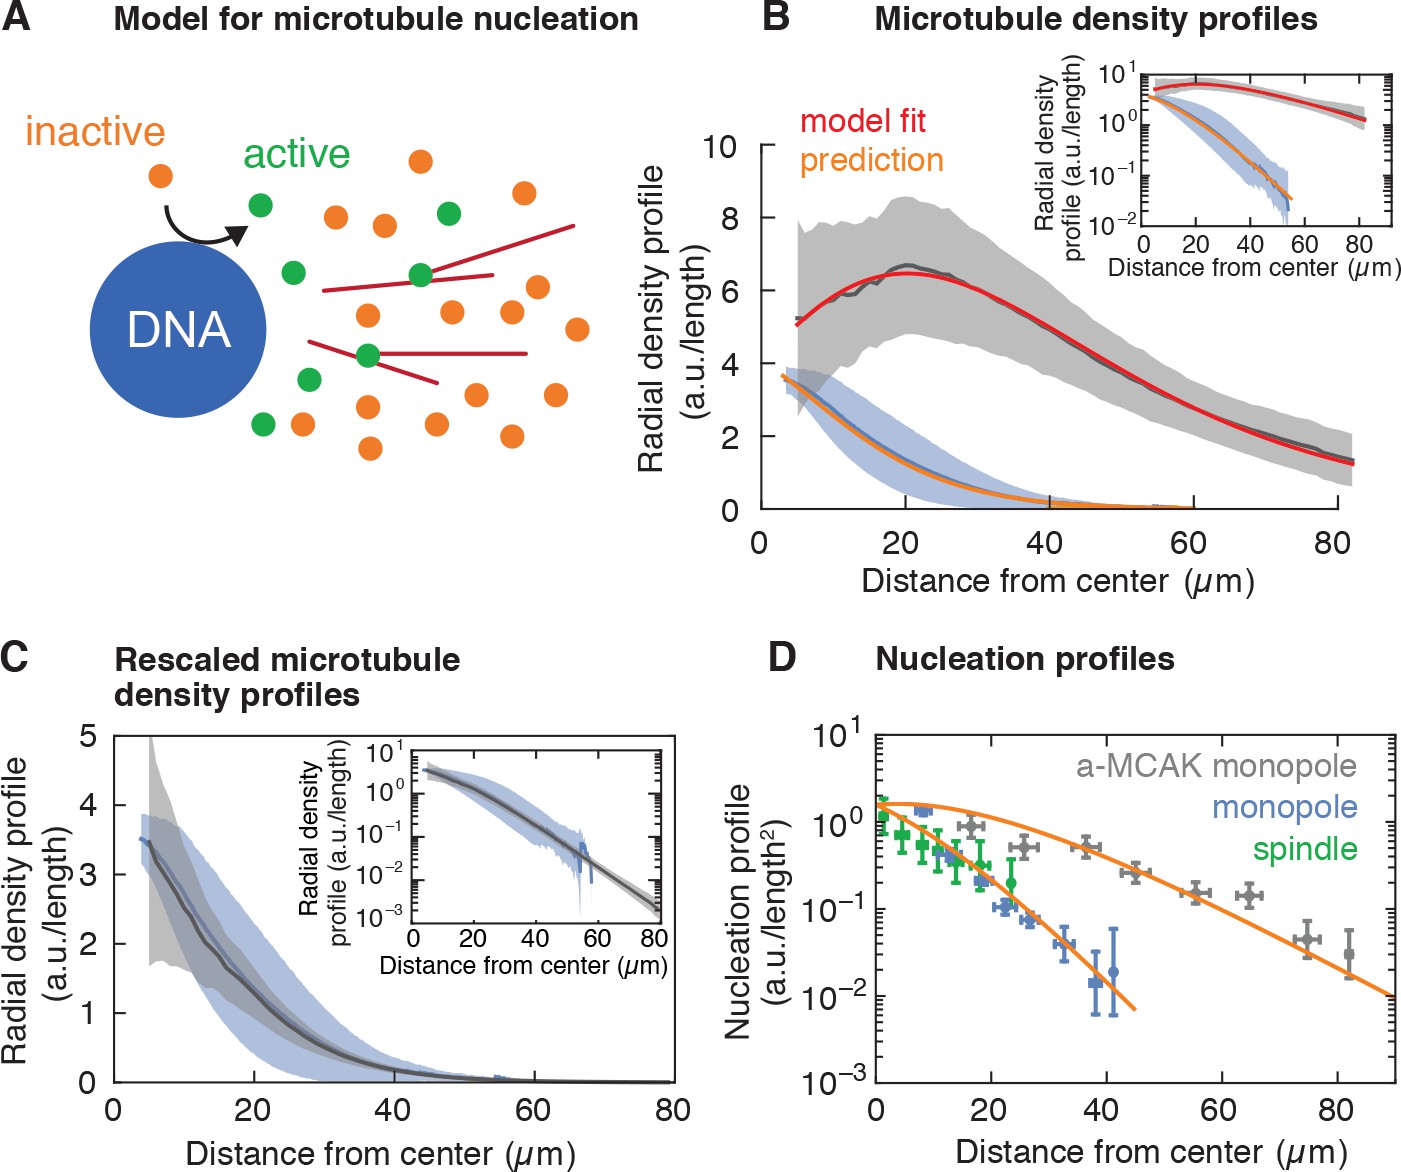
Model for microtubule-stimulated nucleation.
(A) Inactive nucleators (orange circles) are activated around DNA. As active nucleators diffuse (green circles), they can bind and unbind microtubules (red lines). Once bound, they can nucleate a new microtubule with a certain probability. Active nucleators become inactive at a constant rate. (B) Radial microtubule density profiles measured from fluorescent images (mean SD, Nmonopoles = 40 (blue), Na-MCAK = 18 (gray)) and corresponding model fit to the MCAK-inhibited and prediction to control monopoles (see Appendix 1). The ratio of the microtubule densities for control and MCAK-inhibited monopoles was determined using structures from the same extract reaction. (C) Parameter-free rescaling of the microtubule density profiles predicted by the model: , where , and , are the density and length of microtubules for the control and MCAK-inhibited structures, respectively, and is the distance from the center of the structure. In the graph, blue corresponds to the density profile of control monopoles and gray to the rescaled density profile of MCAK-inhibited monopoles. (D) Data and predictions (orange) for the nucleation profiles of control (blue) and MCAK-inhibited monopoles (gray) up to a global nucleation amplitude, and flux-corrected regular spindles (green) (mean SD, Ncontrol = 117 , Na-MCAK = 74, Nspindle = 36 cuts).
Figure 4—figure supplement 1
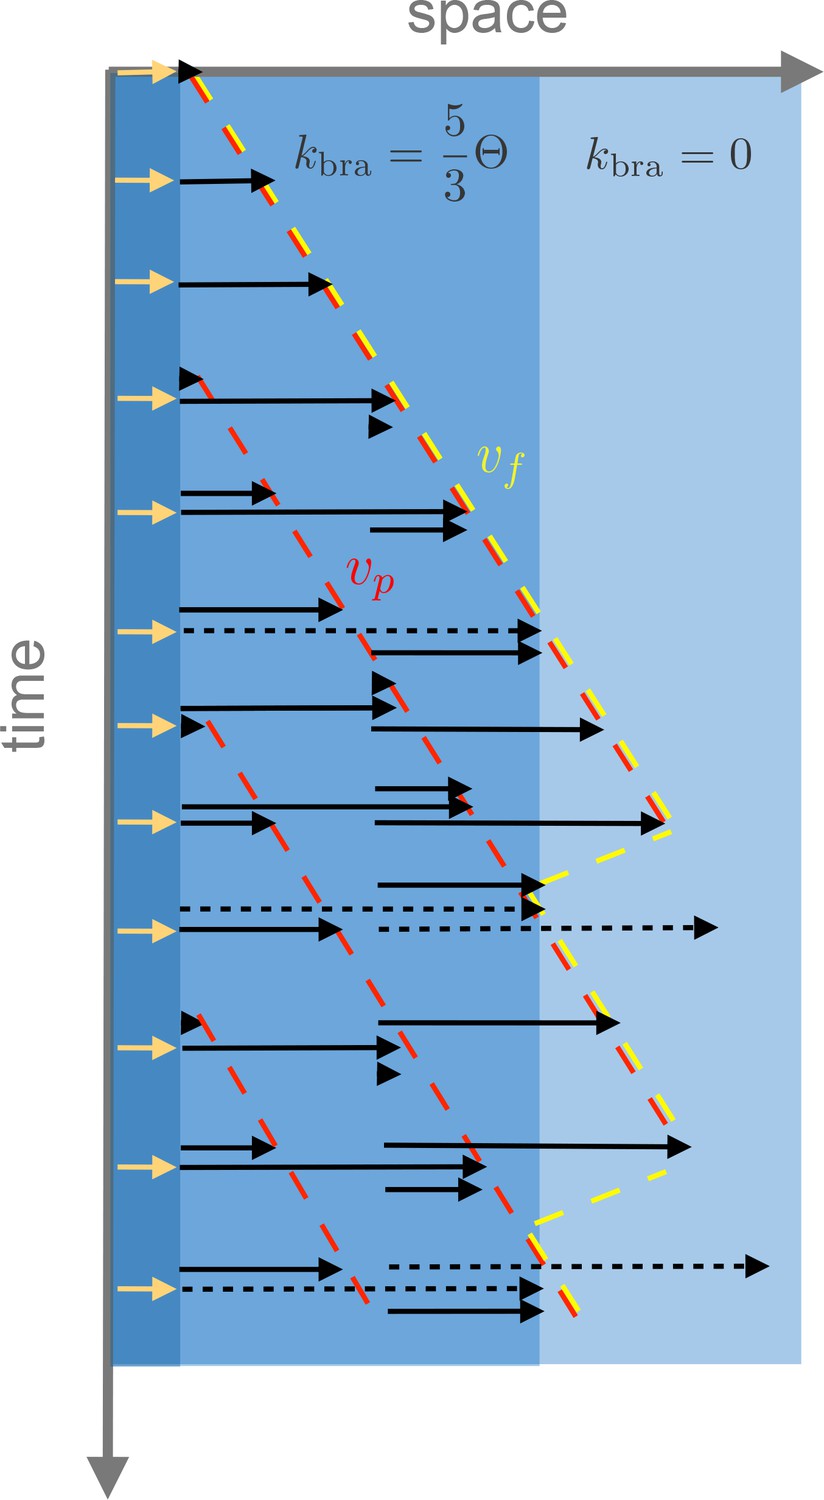
Example of the spatio-temporal evolution of autocatalytic microtubule nucleation with spatially varying branching nucleation rate , polymerization velocity and turnover rate .
The yellow arrows at the origin denote initial microtubule seeds. In the example, a region has a branching rate of and another region has vanishing branching rate. Microtubule turnover is shown as a transition from black to dashed black arrows and disappearance. The front velocity is denoted in yellow while the plus-end microtubule velocity is denoted in red. As shown in the figure, before the front reaches the boundary where branching is allowed, ; however, further away .
Videos
Video 1
EB1-GFP comets in monopolar spindles.
Pre-assembled monopolar spindles (200 μM STLC) were imaged after adding 0.2 µg/ml EB1-GFP. Individual frames were recorded every second with subsequent averaging of 3 frames.
Video 2
Tubulin speckles in a monopolar spindle.
Pre-assembled monopolar spindles (200 µM STLC) were visualized by adding 1 nM purified Atto565 frog tubulin. Images were taken every second with subsequent averaging of 4 frames.
Video 3
Depolymerization wave after a cut in a fluorescently labeled monopole.
200 µM STLC, 150 nM Atto565-tubulin. Images were acquired every 500 ms.
Video 4
Fluorescence intensity loss after a cut in a fluorescently labeled monopole as the depolymerization wave propagates.
200 µM STLC, 150 nM Atto565-tubulin. We calculated the differential intensities for a time interval of 2 s. For purposes of visualization, negative intensity values were set to zero.
Video 5
Tubulin speckles in a monopolar spindle (200 µM STLC) treated with 30 µg/mg anti-MCAK antibodies.
The field of view only shows a quarter of the entire structure. Speckles were created by adding 1 nM purified Atto565 frog tubulin to pre-assembled structures. In every movie, four frames were averaged during the acquisition.
Video 6
EB1-GFP comets in MCAK-inhibited monopoles.
Pre-assembled monopolar spindles (200 µM STLC) were treated with 30 µg/mg anti-MCAK antibodies and imaged after adding 0.2 µg/ml EB1-GFP.
Video 7
Monopole growing against an obstacle.
The microtubule structure is labeled with tubulin Atto565 (red) and EB1-GFP (green) and grows around immobilized frog sperm chromosomes. The bead is attached to the surface and highlighted with an arrow.
Video 8
Ran asters after addition of 30 µM RanQ69L to extract.
Microtubules were labeled with 150 nM Atto565-tubulin. Movie starts 20 min after adding RanQ69L.
Video 9
Growth of pre-existing monopoles after addition of 10 µM RanQ69L.
Monopolar spindles (200 µM STLC, labeled with 150 nM Atto565-tubulin) were imaged on a PLL-g-PEG passivated slide immediately after adding RanQ69L. Scale bar = 20 µm.
Video 10
Depolymerization waves after a cut in a fluorescently labeled spindle.
150 nM Atto565-tubulin. Images were acquired every 500 ms.
Video 11
Fluorescence intensity loss after a cut in a fluorescently labeled spindle as the depolymerization waves propagate.
150 nM Atto565-tubulin. We calculated the differential intensities for a time interval of 2 s. For visualization purposes, negative intensity values were set to zero.
Tables
Table 1
Measurements of microtubule dynamics in spindles and monopoles.
https://doi.org/10.7554/eLife.31149.023| Microtubule dynamics | Spindle | Monopole | MCAK-inhibited monopole |
|---|---|---|---|
| Lifetime (s) | 16 | 20 2 | 60 4 |
| Polymerization velocity (μm/min) | 23 8 | 21 5 | 19 5 |
| Depolymerization velocity (μm/min) | 36 7 | 33 6 | 46 8 |
-
Reference Needleman et al., 2010.
Table 2
Parameters used in the model of autocatalytic microtubule nucleation.
https://doi.org/10.7554/eLife.31149.024| Parameter | Symbol | Value | Procedure |
|---|---|---|---|
| Microtubule turnover rate control monopole () | 0.05 0.01 | Single molecule microscopy | |
| Microtubule turnover rate MCAK-inhibited monopole () | 0.016 0.001 | Single molecule microscopy | |
| Microtubule length control monopole (m) | 8.0 0.3 | Laser ablation | |
| Microtubule length MCAK-inhibited monopole (m) | 24 4 | Laser ablation | |
| Length scale gradient unbound nucleators (m) | 24.9 0.5 | Fit to the model | |
| Branching parameter (dimensionless) | 2.38 0.01 | Fit to the model | |
| Microtubule density at the center of the monopole (a.u.) | 4058 64 | Fit to the model |
Additional files
-
Transparent reporting form
- https://doi.org/10.7554/eLife.31149.027
Download links
A two-part list of links to download the article, or parts of the article, in various formats.
Downloads (link to download the article as PDF)
Open citations (links to open the citations from this article in various online reference manager services)
Cite this article (links to download the citations from this article in formats compatible with various reference manager tools)
Autocatalytic microtubule nucleation determines the size and mass of Xenopus laevis egg extract spindles
eLife 7:e31149.
https://doi.org/10.7554/eLife.31149


