ERα promotes murine hematopoietic regeneration through the Ire1α-mediated unfolded protein response
- Baylor College of Medicine, United States
- University of Michigan, United States
- Kanazawa Medical University, Japan
Figures
Figure 1 with 1 supplement

Estrogen Enhances the Myeloid Potential of HSCs.
(A) Colony formation by single HSCs from control or E2 treated Esr1fl/fl (WT) and Mx1-Cre; Esr1fl/fl (Esr1Δ/Δ) mice (96 wells per animal, n = 4 assays/group). Colonies were collected, cytospun, and scored after Wright Giemsa staining. gemM: granulocyte, erythroid, monocyte, megakaryocyte; gmM: granulocyte monocyte megakaryocyte; gme: granulocyte, monocyte, erythroid; gm: granulocyte, monocyte; M: megakaryocyte; m: monocyte; e: erythroid. Red and green lines indicate significant interaction of treatment and genotype of gemM and gm, respectively (***p<0.001, ANOVA) (B) Megakaryocyte differentiation potential in collagen-based MegaCult assays (n = 6, three independent experiments, two technical replicates per experiment). Meg, colonies containing exclusively megakaryocytes as indicated by cholinesterase staining; Mixed, colonies containing both megakaryocytes and other myeloid cells; Non, colony with no megakaryocytes. *p<0.05, ANOVA. (C) Numbers of CD41+ megakaryocytes as indicated by immunofluorescent staining of bone marrow sections (n = 10, 5 fields of view per section). (D) Representative images of CD41 stained bone marrow sections from oil- and E2-treated mice. Scale bar represents 50 μm. (E–J) Levels of donor (GFP+) engraftment in recipient mice that were transplanted with 100 GFP+ HSCs (oil- or E2-treated Ubc-GFP; Esr1fl/fl (n = 4 donors each, 24 and 26 recipients respectively) or Ubc-GFP; Mx1-Cre; Esr1fl/fl (n = 3 donors each, 14 and 23 recipients respectively) and 2 × 10⁵ competitor GFP- cells. Each panel represents donor chimerisms in (E) overall mononuclear cells, (F) Mac-1/Gr-1+ myeloid cells, (G) CD41+ FSC/SSClow platelets, (H) Ter119+ FSC/SSClow red blood cells, (I) B220+ B-cells, and (J) CD3+ T-cells. All data represent mean ±standard deviation; *p<0.05; **p<0.01; and ***p<0.001 by Student’s t-test unless otherwise noted.
Figure 1—figure supplement 1

(A) Gating strategy for the identification of HSCs and MPPs in both oil- and E2-treated mice.
(B) Gating strategy for detection of platelets and red blood cells in peripheral blood. Whole blood was stained with CD41 and Ter119 antibodies. (C) Gating strategy for detection of myeloid and lymphoid cells in peripheral blood. Whole blood was treated with ACK buffer, and then stained with the lineage antibody cocktail shown. (D) Secondary transplantation of vehicle and E2 treated HSCs. 2 × 10⁶ WBM cells from primary recipients of oil- and E2-treated HSC were transplanted into lethally irradiated recipients. Reconstitution was monitored by collecting peripheral blood every 4 weeks. Data represent mean ±standard deviation; *p<0.05; **p<0.01; by Student’s t-test.
Figure 2 with 1 supplement
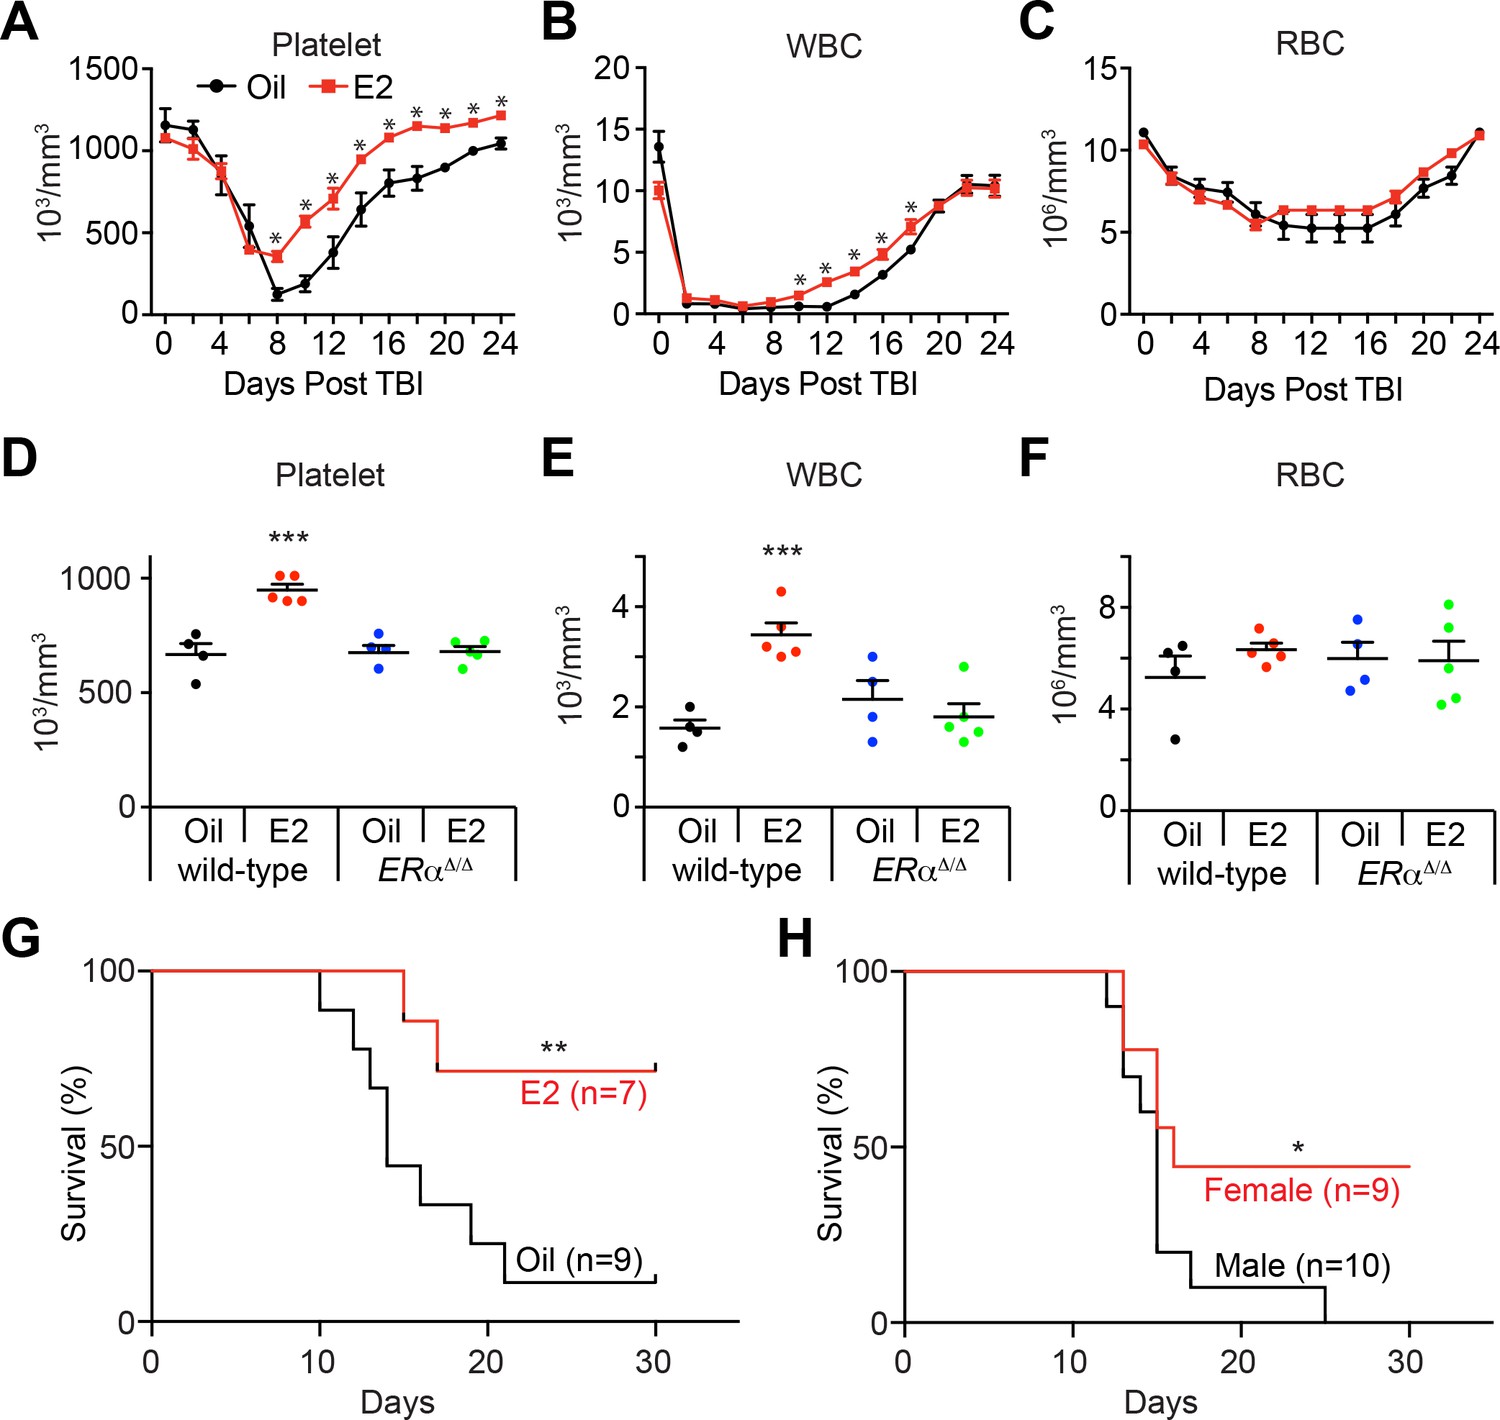
Estrogen Promotes Hematopoietic Recovery After Irradiation.
(A–C) Mean PB counts of (A) platelets, (B) white blood cells, and (C) red blood cells of oil- and E2-treated mice (black and red lines, respectively. n = 4 Oil, n = 5 E2, two independent experiments). *p<0.05 by Student’s t-test. (D–F) Mean PB counts of (D) platelets, (E) white blood cells, and (F) red blood cells of control or ERα-deficient mice, treated with either oil or E2. Data were collected 14 days after TBI. ***p<0.001, ANOVA. (G) Survival curves of C57BL/6 male mice treated with oil or E2 for 1 week followed by 800cGy TBI. **p<0.01 by a log-rank test. (H) Survival curves of C57BL/6 male and female mice following 800cGy TBI. *p<0.05 by a log-rank test. All data represent mean ±standard deviation.
Figure 2—figure supplement 1
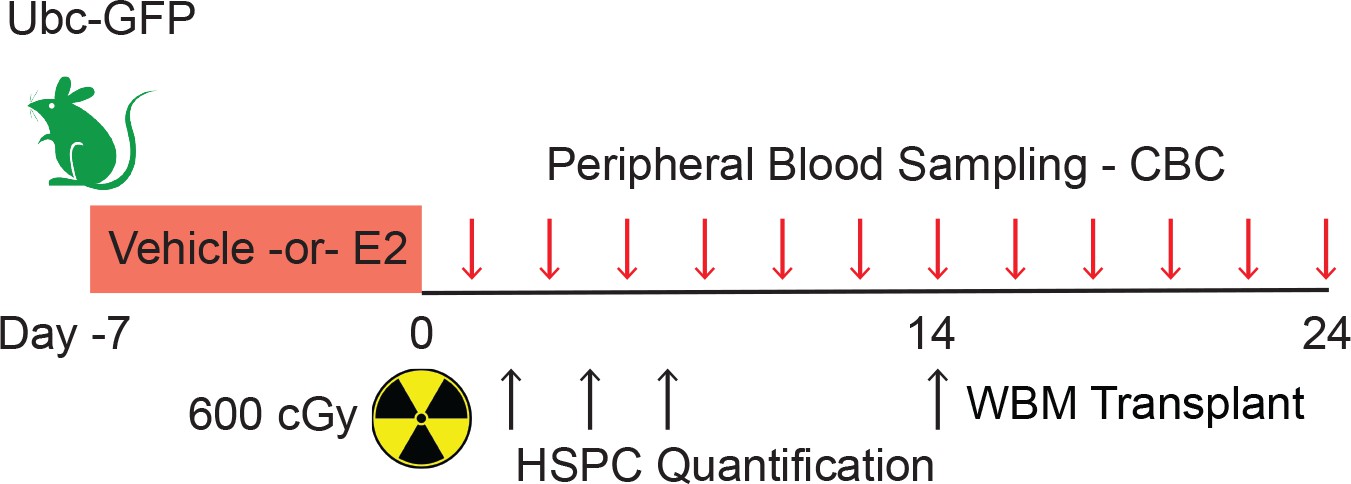
Experimental design of hematopoietic regeneration following TBI.
Male mice were treated with E2 for 7 days before undergoing TBI at day 0. Peripheral blood samples were collected every other day. HSPCs were quantified at days 3, 5, 7, and 14. WBM transplantation was performed with cells isolated at day 14.
Figure 3 with 1 supplement
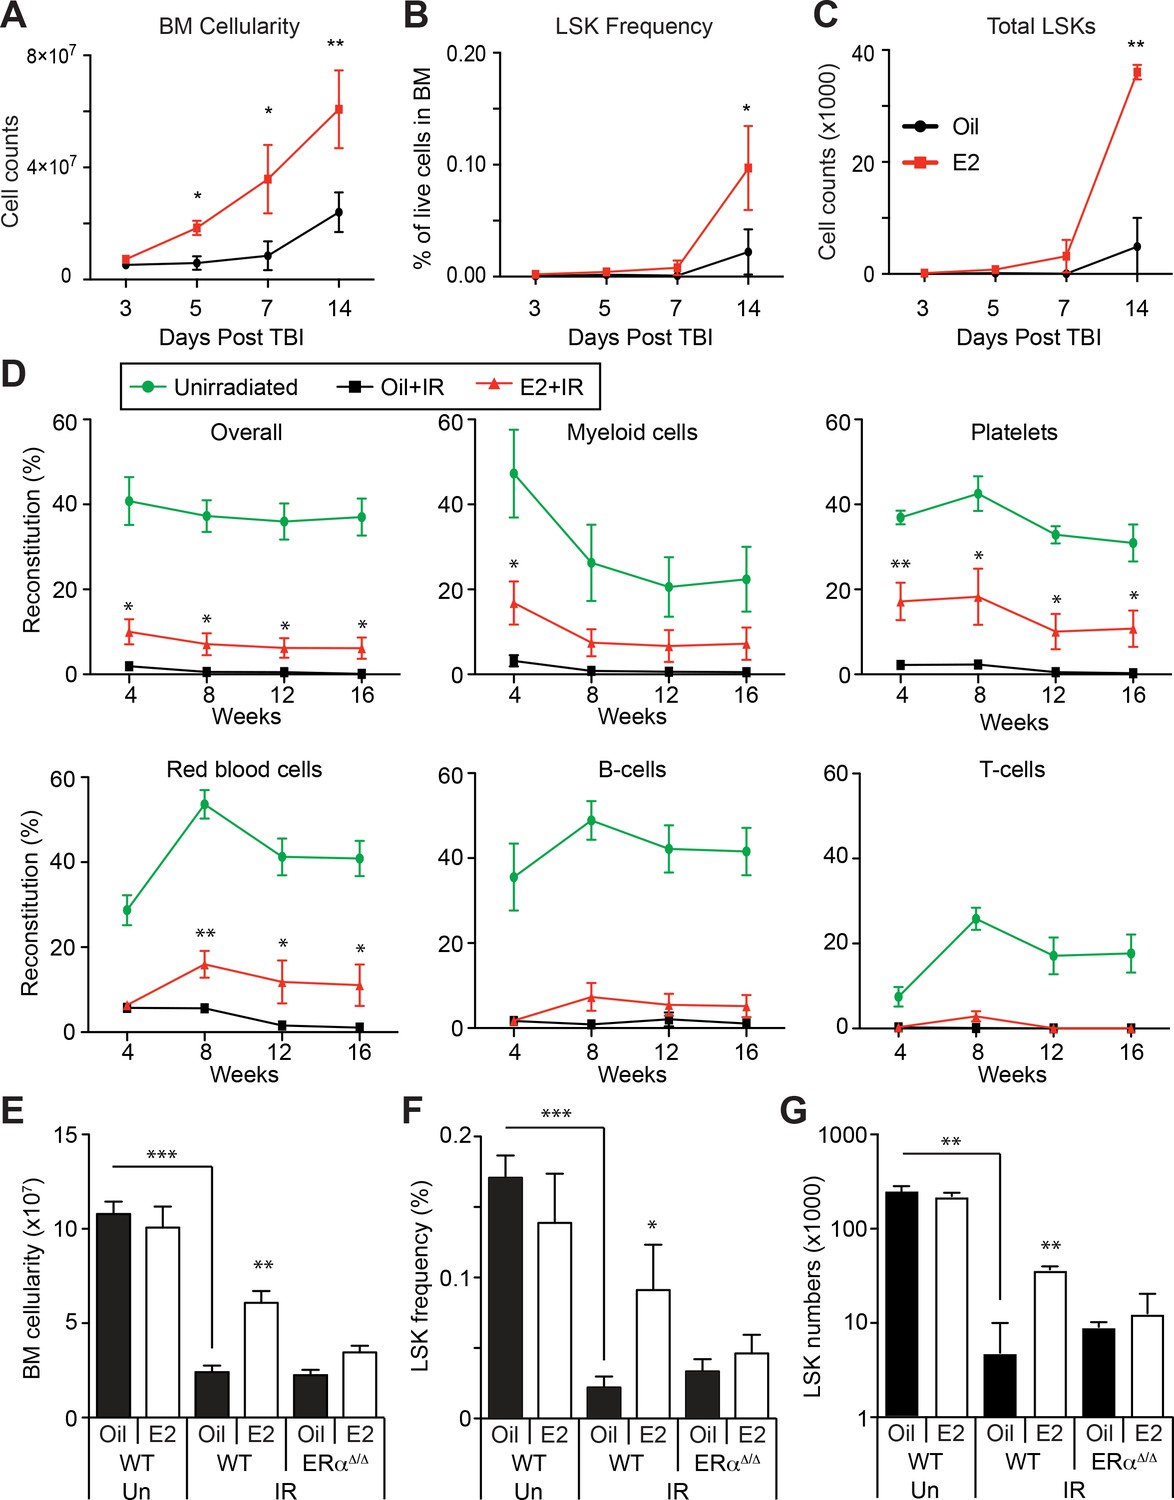
Estrogen Promotes HSPC Regeneration After Irradiation.
(A) Bone marrow cellularity (A), LSK frequencies (B), and total numbers of LSK cells (C) were analyzed at 3, 5, 7, and 14 days after 600cGy of TBI. E2 treatment significantly accelerated the recovery of bone marrow cellularity, and the frequencies and the total numbers of LSK cells. (B–C) Frequencies (B) and total numbers (C) of LSK cells in the bone marrow drop significantly 14 days after 600cGy of irradiation; this affect is rescued by E2 treatment in wild-type mice but not in ERα-deficient mice (n = 7 over four independent experiments). (D) Competitive transplantation assays using 5 × 10⁵ WBM cells from Ubc-GFP+ unirradiated mice (green lines) or sublethally irradiated, oil-treated mice (black lines) or sublethally irradiated E2-treated mice (red lines) along with competitor cells (n = 8, two donors, four recipients per donor). E2 pretreatment significantly rescued the ability of WBM cells to reconstitute the myeloid cells, platelets, and red blood cells after irradiation. (E–G) Bone marrow cellularity (E), LSK frequencies (F), and total numbers of LSK cells (G) in the bone marrow are significantly lower 14 days after 600cGy of irradiation (IR) compared to unirradiated mice (Un). This effect is rescued by E2 treatment in wild-type mice but not in ERα-deficient mice (n = 7, four independent experiments). All data represent mean ±standard deviation; *p<0.05; **p<0.01; and ***p<0.001 by Student’s t-test in (A–D), and by ANOVA in (E–G).
Figure 3—figure supplement 1
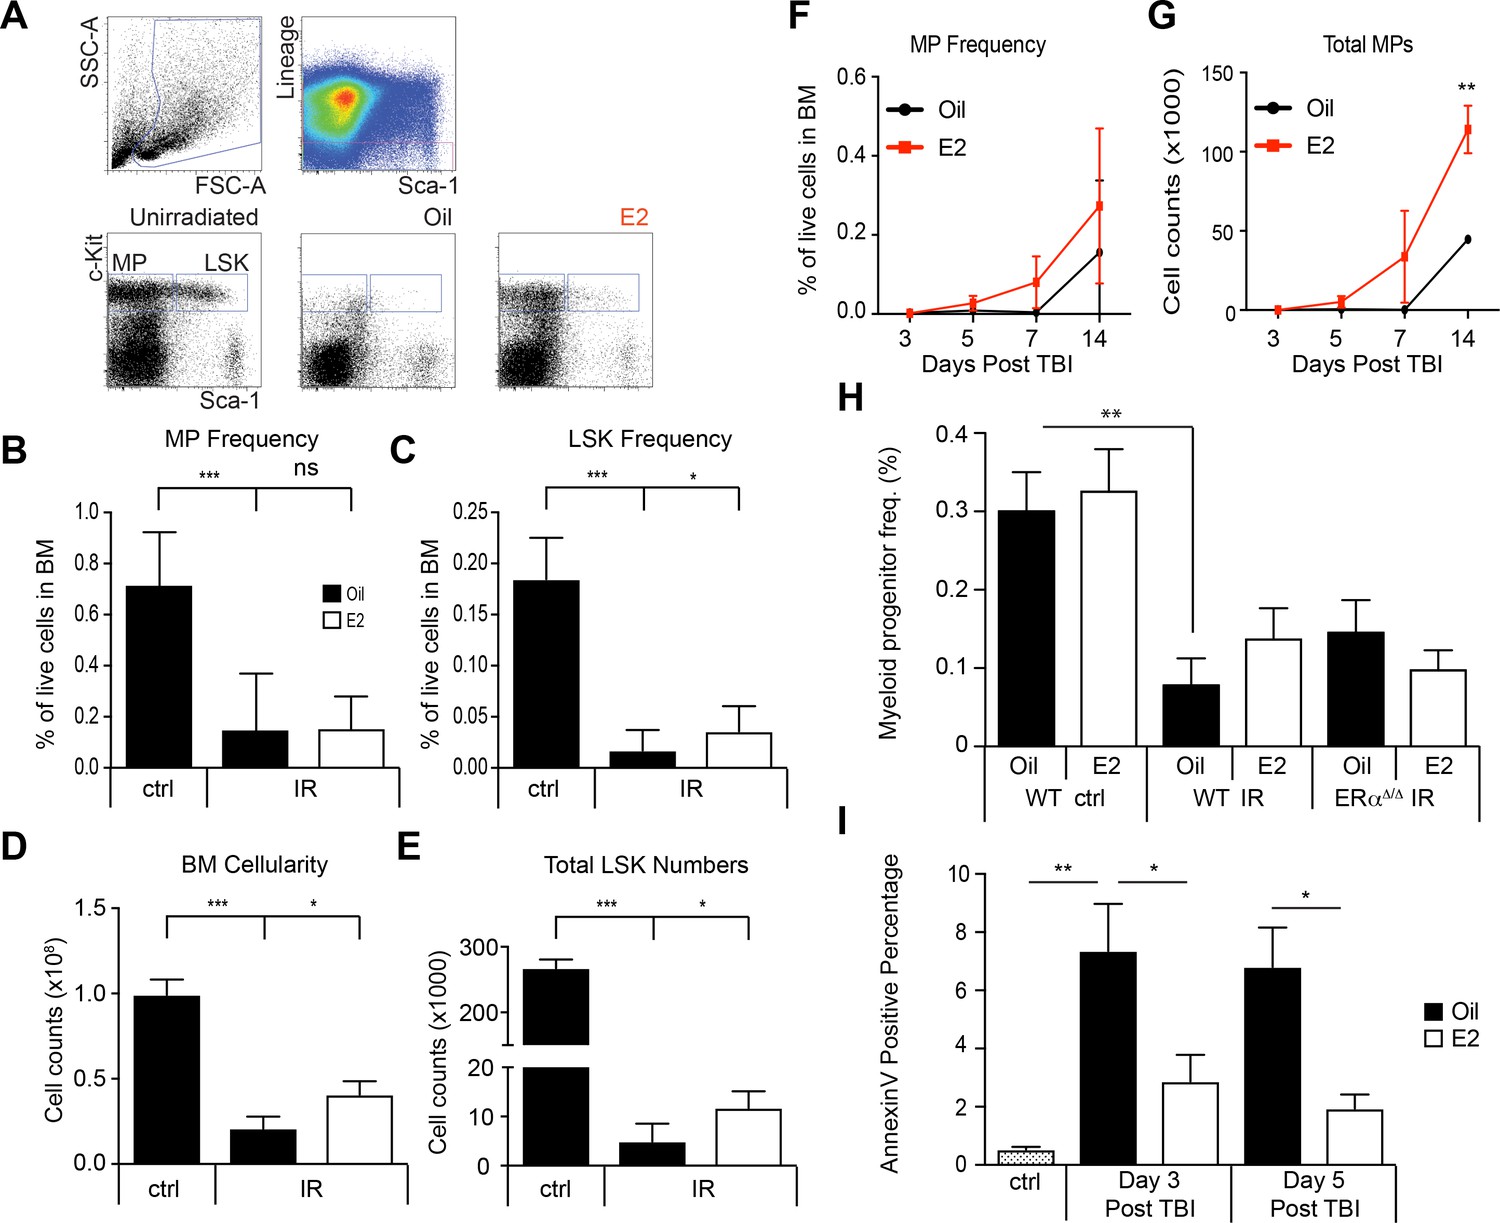
Regeneration of HSPCs after irradiation by E2 stimulation.
(A) Gating schemes to identify LSK cells and lineage-Sca-1-c-kit+myeloid progenitor (MP) cells in unirradiated mice and irradiated mice treated with oil or E2. (B) Frequencies of MP cells and (C) LSK cells in unirradiated and irradiated animals, with or without E2 treatment. 3 month old male mice were sublethally irradiated (600cGy) followed by oil or E2 administration every other day. Both MP and LSK frequency are severely reduced following irradiation. Whereas MP frequency is unaffected by E2 treatment, LSK frequency is significantly increased. (D) Depletion of bone marrow cellularity after irradiation was significantly rescued by E2. (E) Total numbers of LSK cells found in the long bones of sublethally irradiated mice given E2 after irradiation. All data represent mean ±standard deviation; *p<0.05; ***p<0.001, two-way ANOVA. MP frequency (F) and MP numbers (G) were assessed following sublethal TBI. Although MP frequency is unchanged, the total numbers of MPs are increased by E2 treatment at day 14. **p<0.01, Student’s t test. (H) MP frequency at day 14 post-TBI in Oil and E2 treated WT and ERα-deficient mice. **p<0.01, two-way ANOVA. (I) Apoptosis rates were analyzed after sublethal TBI in lineage- BM cells in Oil and E2 treated WT males. *p<0.05; **p<0.01, two-way ANOVA.
Figure 4 with 2 supplements
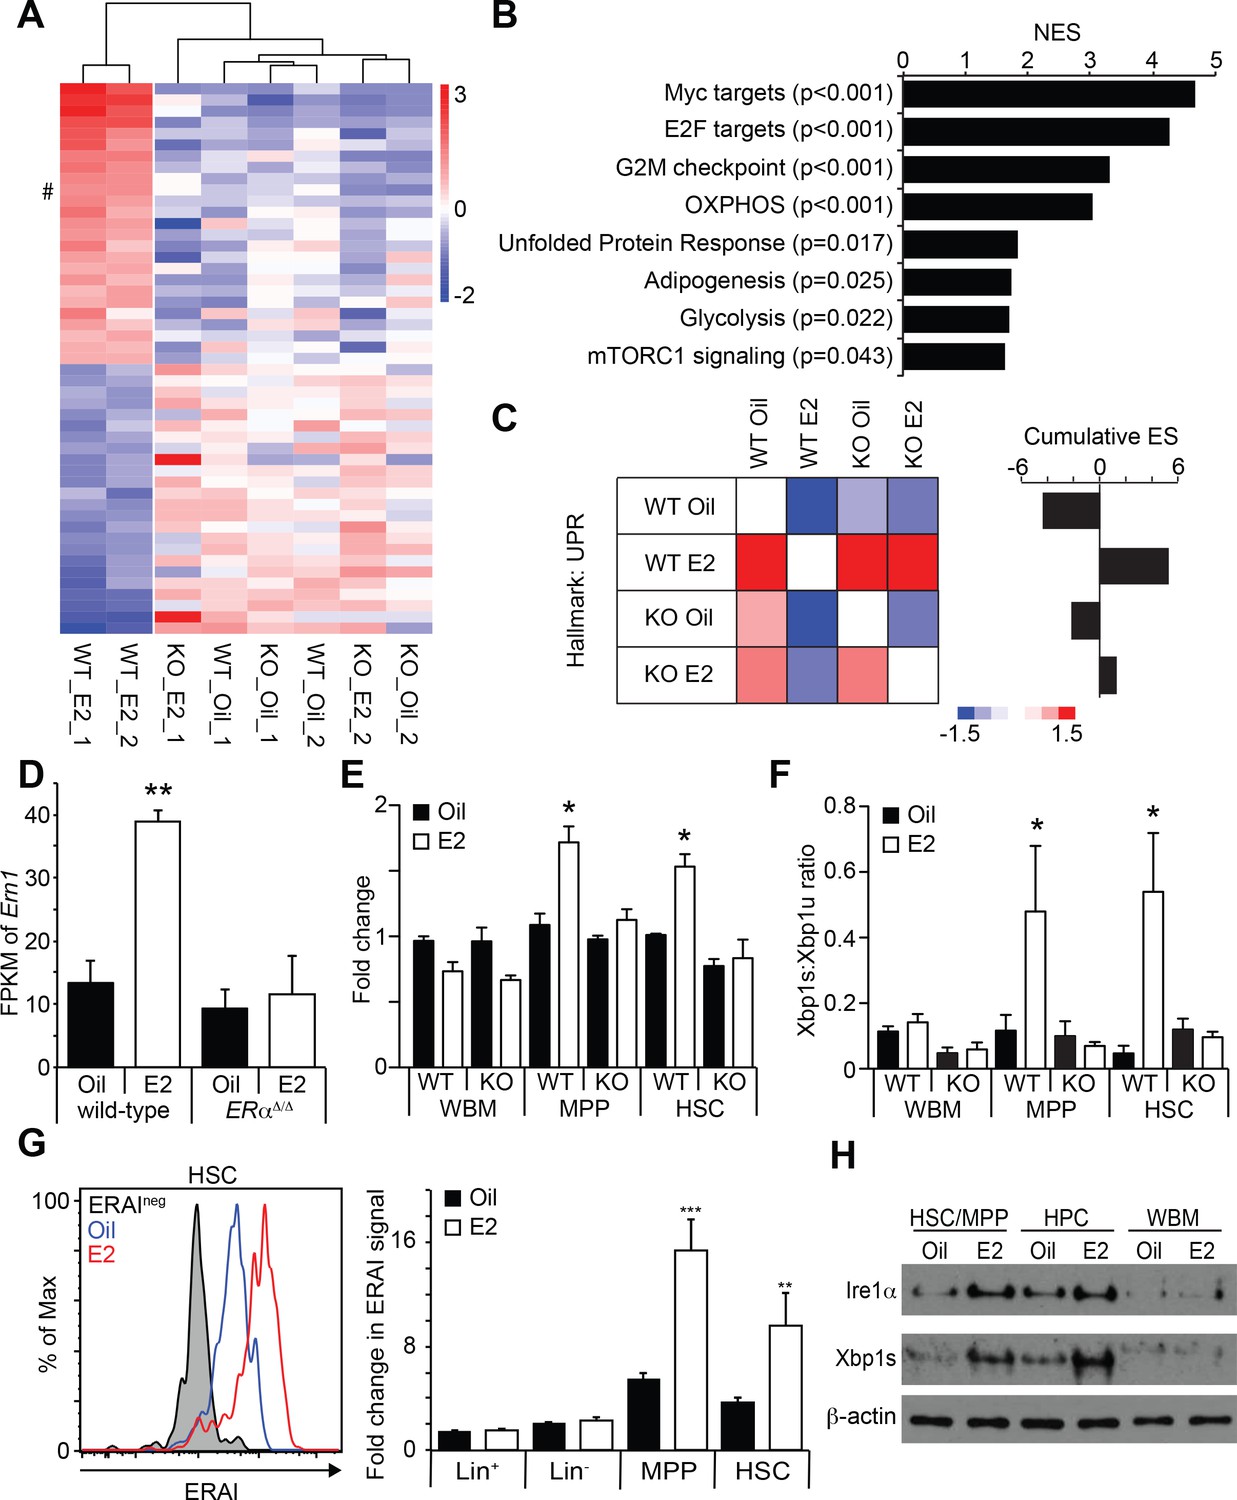
Estrogen Activates the Ire1α-Xbp1 Branch of the UPR.
(A) Unsupervised hierarchical clustering of genes with log2 fold change larger than one identified by RNA-seq. Top 25 genes for each cluster are shown. # indicates Ern1, which encodes Ire1α. (B) GSEA was performed between oil- and E2-treated HSCs. Gene sets significantly enriched in E2-treated HSCs are shown. (C) Pair wise GSEA was performed to test the enrichment of UPR-related genes in wild-type or ERα-deficient HSCs after either oil- or E2-treatment (left). E2-treated wild-type HSCs had enrichment of UPR genes, as indicated by the cumulative enrichment score (right). (D) Fragments per kilobase of exon per million fragments mapped (FPKM) of Ern1 transcript was increased in HSCs upon E2 treatment, and this increase was dependent on ERα. **p<0.01 by two-way ANOVA. (E) Quantitative PCR assays confirmed that the induction of Ire1α in HSCs, as well as in MPPs, upon E2 treatment was dependent on ERα (n = 3, two independent experiments). *p<0.05 by two-way ANOVA. (F) Xbp1 splicing was determined by a two-color Taqman assay. Xbp1 splicing was induced in HSCs and MPPs upon E2 treatment in an ERα-dependent manner. The ratio between spliced (Xbp1s) to unspliced (Xbp1u) Xbp1 transcript is shown (n = 4, two independent experiments). *p<0.05 by two-way ANOVA. (G) Xbp1 splicing was also determined by flow cytometry using the ERAI strain. Grey histogram represents the background signal from ERAI- HSCs. **p<0.01; and ***p<0.001 by Student’s t-test. (H) Immunoblotting was performed using HSC/MPP (CD48-/lowLSK), progenitor cells (CD48+LSK), and WBM cells. Both Ire1α and Xbp1s protein levels were increased by E2 treatment in immature cells. All data represent mean ±standard deviation.
Figure 4—figure supplement 1

E2 treatment increases the expression of megakaryocyte-related genes and chaperones in HSCs.
(A) Ire1α mRNA expression levels were quantified in LSK cells cultured in vitro with vehicle or varying concentrations of E2. (B–D) We CRISPR-edited LSK cells for Ire1α or control Rosa26, and assessed the relationships between Ire1α and Myc targets genes identified in the GSEA (Figure 4B), using the condition described in (A). Myc targets Tipin (B), Tyms (C), and Ccna2 (D) were induced by E2 dependently on Ire1α. Pole3 (E), Hmga1 (F), Aimp2 (G), and Cdkn2c (H) were induced in E2 treated cells, but deletion of Ire1α did not significantly affect the expression. *p<0.05, two-way ANOVA. (I) FPKMs for megakaryocyte-related genes in Oil and E2 treated WT and ERα-deficient HSCs. *p<0.05; **p<0.01; ***p<0.001 by two-way ANOVA. (J) Heatmap of RPKMs from RNA Seq data. Genes represented in the heatmap were genes discovered to be enriched in the GSEA Hallmark UPR geneset. Data represents fold change from Oil treated HSCs. (K) Average expression values of genes encoding chaperones or foldases as determined by qPCR. Data represents fold change from Oil treated HSCs.
Figure 4—figure supplement 2
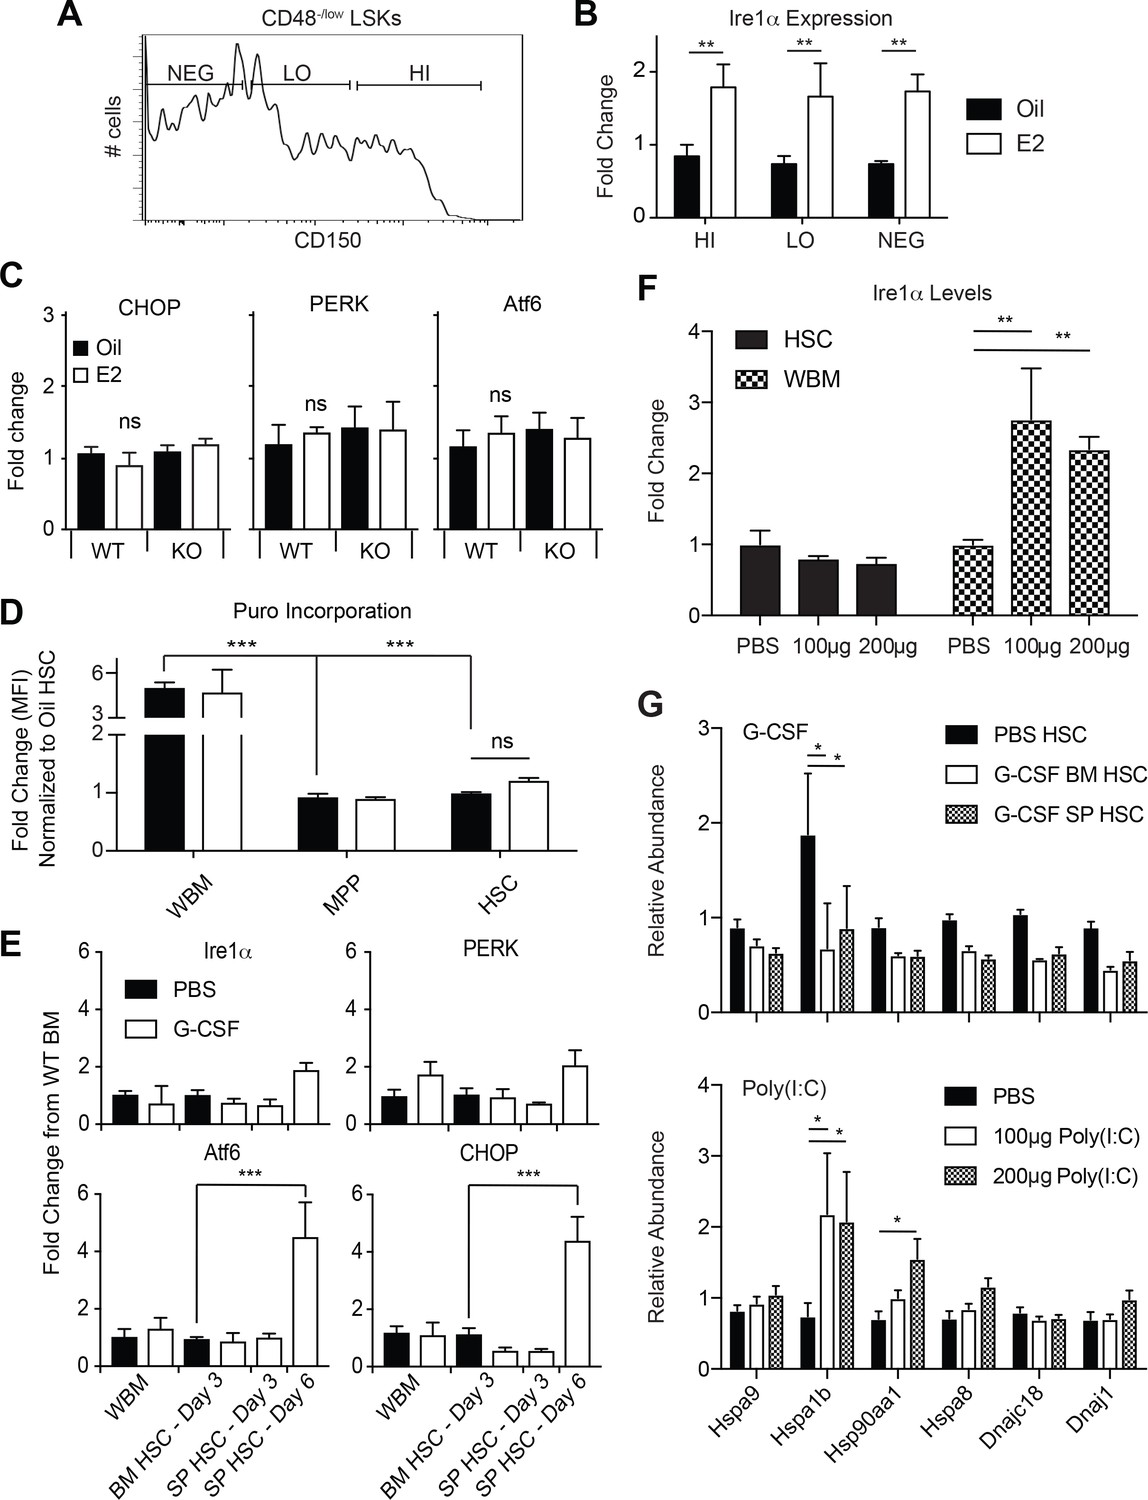
Ire1α induction in HSCs is not a function of increased HSC proliferation.
(A) Representative plot used to fractionate CD48-/low LSKs based on CD150 levels. (B) Ire1α mRNA levels were quantified in CD150HI, LO, and NEG CD48-/low LSKs. Ire1α was potently induced equally amongst all three populations. (C) Expression levels of the UPR constituents CHOP, PERK, and Atf6 were assessed in Oil and E2 treated WT and ERα-deficient HSCs by qPCR. Neither treatment caused significant changes in the expression of CHOP, PERK, and Atf6 (accessed by ANOVA). (D) Puromycin incorporation assay. Male mice were treated with oil or E2 for one week. One hour prior to collection, mice were injected with puromycin and puromycin incorporation into each population was analyzed by flow cytometry. (E) Expression levels of Ire1α, PERK, Atf6, and CHOP in G-CSF treated animals were analyzed by qPCR. Male C57BL/6 mice were injected with 4 mg of cyclophosphamide and then with G-CSF (5 μg/day) for 3 or 6 days, and analyzed the following day (n = 3). Control mice were injected with PBS. Since the numbers of HSCs in the spleen of control PBS-injected mice are low, gene expression changes in spleen HSCs were compared to bone marrow HSCs of PBS-injected mice. Although the expression levels of Atf6 and CHOP were increased in mobilized spleen HSCs at day 6, expression levels of Ire1α did not change. (F) Ire1α expression levels in HSCs and WBM from mice treated with varying doses of poly I:C. Although poly I:C increased Ire1α expression in WBM cells, it did not significantly changes the expression in HSCs (G) Expression levels of chaperones was assessed in activated HSCs. HSCs were collected from G-CSF treated mice (upper panel) and poly I:C treated mice (lower panel) and chaperone mRNA levels were measured via qPCR. Whereas a few chaperones were induced, the global UPR network was not increased as extensively as E2 treatment. *p<0.05, Students t test.
Figure 5 with 1 supplement
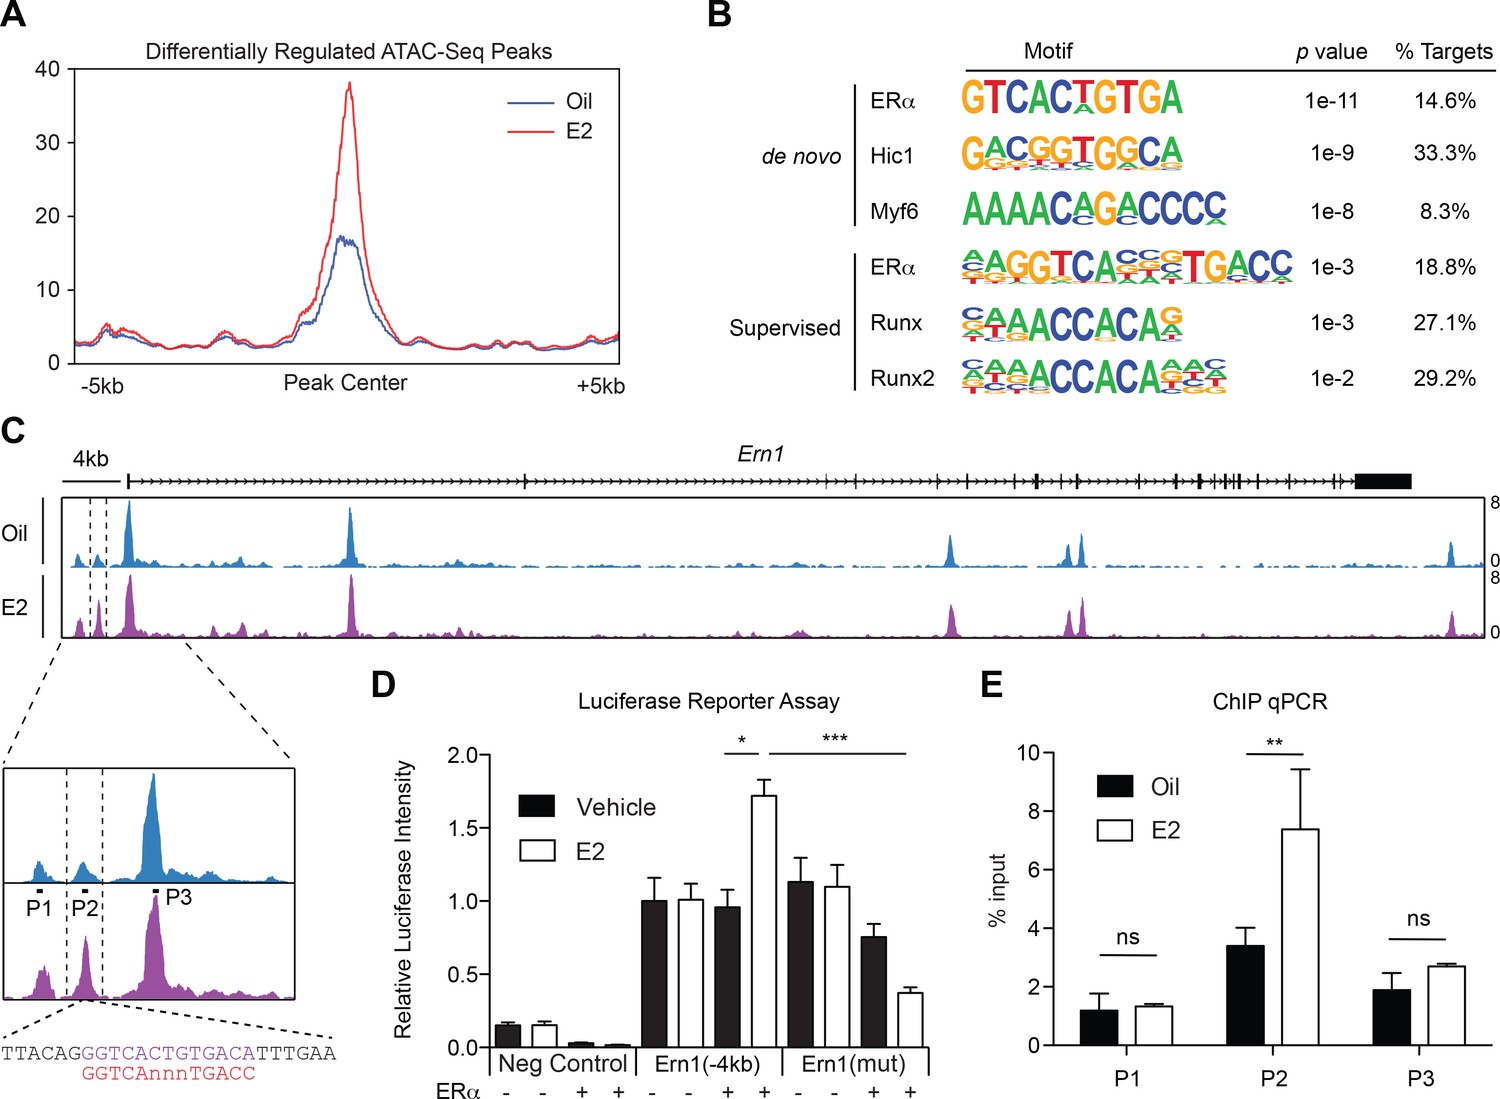
ERα Associates with the Ire1α Upstream Locus in HSPCs (A) Metagene analysis indentifying differentially expressed peaks in E2 treated HSPCs.
(B) Homer motif analysis. Both de novo (unsupervised) and supervised motif-identifying algorithms classified EREs as the most enriched motif in E2-treated HSPCs. (C) Representative gene track of Ire1α with peaks identified from ATAC-Seq. Three peaks were identified upstream of the Ire1α promoter (denoted Peak 1, 2, and 3). Peak two was identified as differentially upregulated in E2 treated cells, and contains a ERE motif (lower panel, purple) with one nucleotide mismatch with the consensus ERE (shown in red). Primers were designed for each peak and are denoted P1, P2, and P3. (D) Luciferase reporter assay. A 4 kb genomic sequence of Ire1α regulatory elements containing peaks 1–3 was cloned into pGL2 Basic plasmid. 293 T cells were transfected with the reporter plasmids, ERα expressing or an empty vector, and a control renilla luciferase plasmid. Cells were treated with E2 for 20 hr and luciferase activity measured. A significant increase in the luciferase activity was observed with the Ire1α construct in an E2- and ERα-dependent manner, and this response was abolished by mutating the ERE. (n = 4 independent experiments, two technical replicates per condition) ***p<0.001; *p<0.05, ANOVA (E) ChIP qPCR was conducted for the three peaks identified by ATAC-Seq using primers shown in (C). y-axis represents the relative value to percent input in Oil or E2 treated cells. (n = 4; two independent experiments, two biological replicate) **p<0.01; Student’s t-test.
Figure 5—figure supplement 1
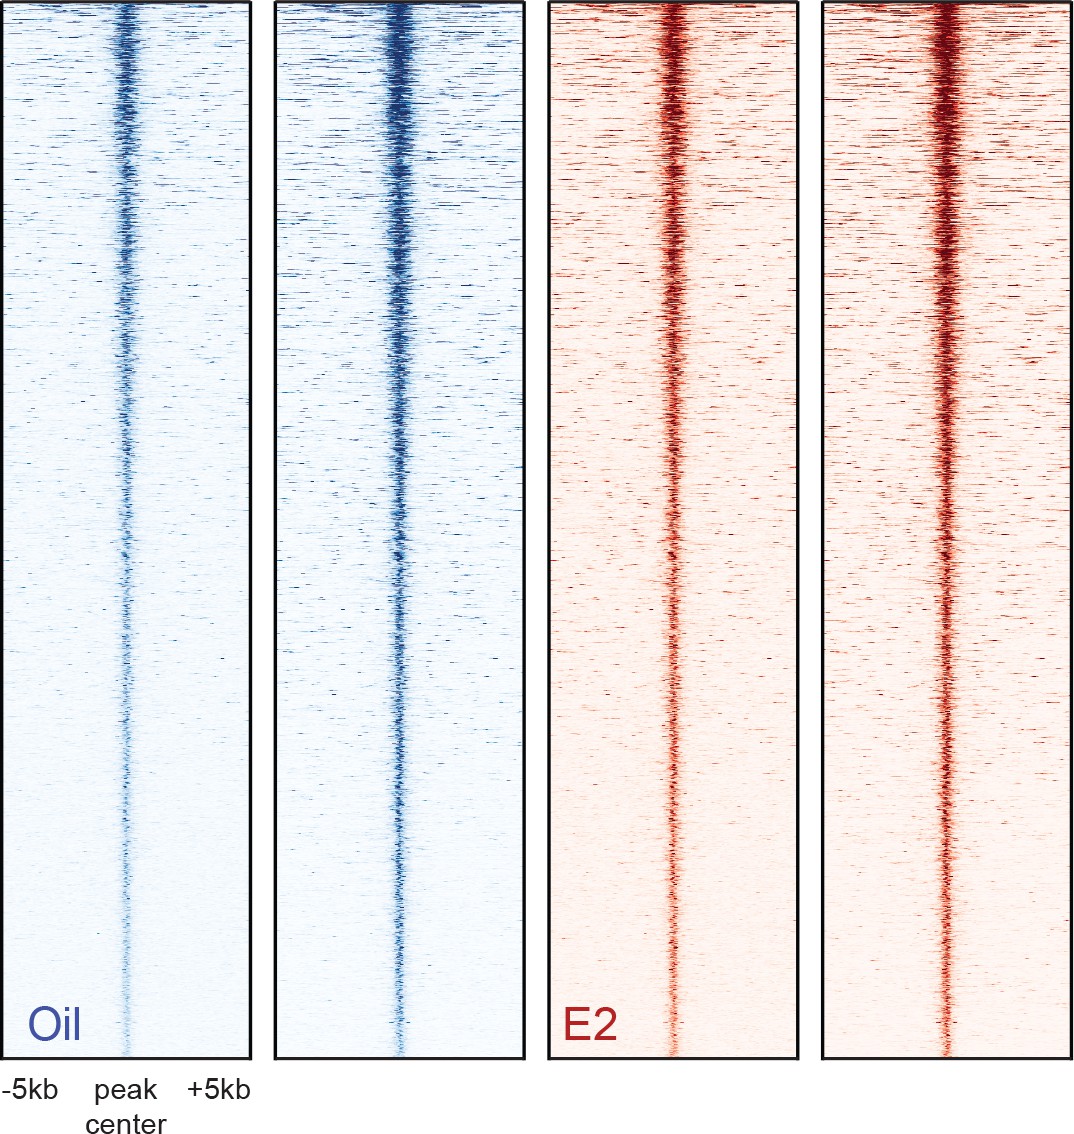
Heatmaps of ATAC-seq peaks discovered in two biological replicates of HSC samples isolated from oil- and E2-treated mice.
https://doi.org/10.7554/eLife.31159.012
Figure 6 with 1 supplement
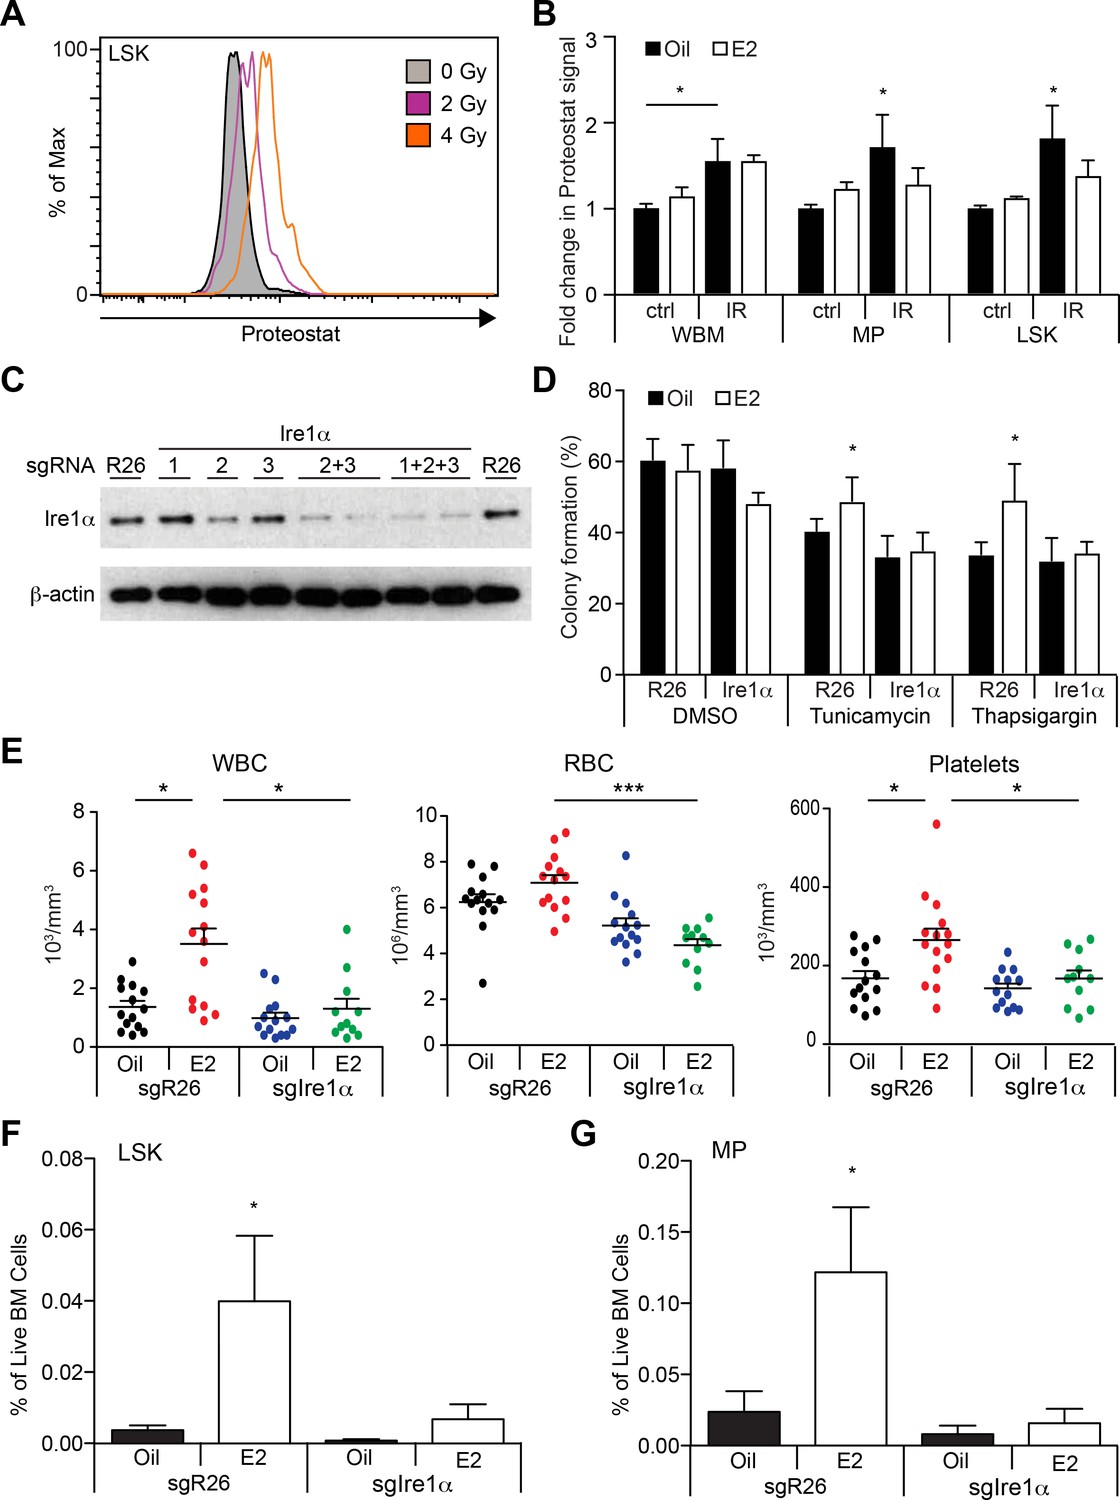
Estrogen Mitigates Proteotoxic Stress in HSPCs (A) Representative FACS plots of Proteostat staining in LSK cells from mice subjected to various doses of radiation.
(B) Proteostat staining revealed that irradiation induces protein aggregation in all hematopoietic cell types, and E2 reduces aggregation in immature progenitor cells. Mice were treated with oil or E2 for 1 week followed by a single dose of radiation (IR: 400cGy) or unirradiated (ctrl), and analyzed 16 hr later by flow cytometry (n = 5, three independent experiments). *p<0.05, two-way ANOVA (C) c-kit+ progenitor cells were electroporated with Cas9 protein with sgRNAs against either Rosa26 (R26) or three different sgRNAs against Ire1α. Cells were collected after 48 hr and analyzed by immunoblotting. (D) Deletion of Ire1α by the CRISPR/Cas9 system sensitized LSK cells to ER stressors. LSK cells from oil- or E2-treated mice were gene edited as in (C), incubated overnight with ER stressors, and plated on semi-solid media for colony formation. (n = 3 independent experiments) *p<0.05, two-way ANOVA (E) 2000 gene-edited LSK cells (Rosa26 (n = 14, Oil; n = 14, (E2) or Ire1α (n = 14, Oil; n = 11, E2; four independent experiments) were transplanted into lethally irradiated recipients, followed by oil or E2 administration every other day. Shown are blood counts 14 days after transplantation. *p<0.05; ***p<0.001; Kruskal Willis with Dunn’s multiple comparisons test. (F) LSK and (G) myeloid progenitor (MP) frequencies were measured in recipients of gene-edited LSKs. (n = 5, two independent experiments) *p<0.05, two-way ANOVA. In (E–G), Ire1α sgRNA 2 + 3 or 1 + 2 + 3 was used with similar results. All data represent mean ±standard deviation.
Figure 6—figure supplement 1
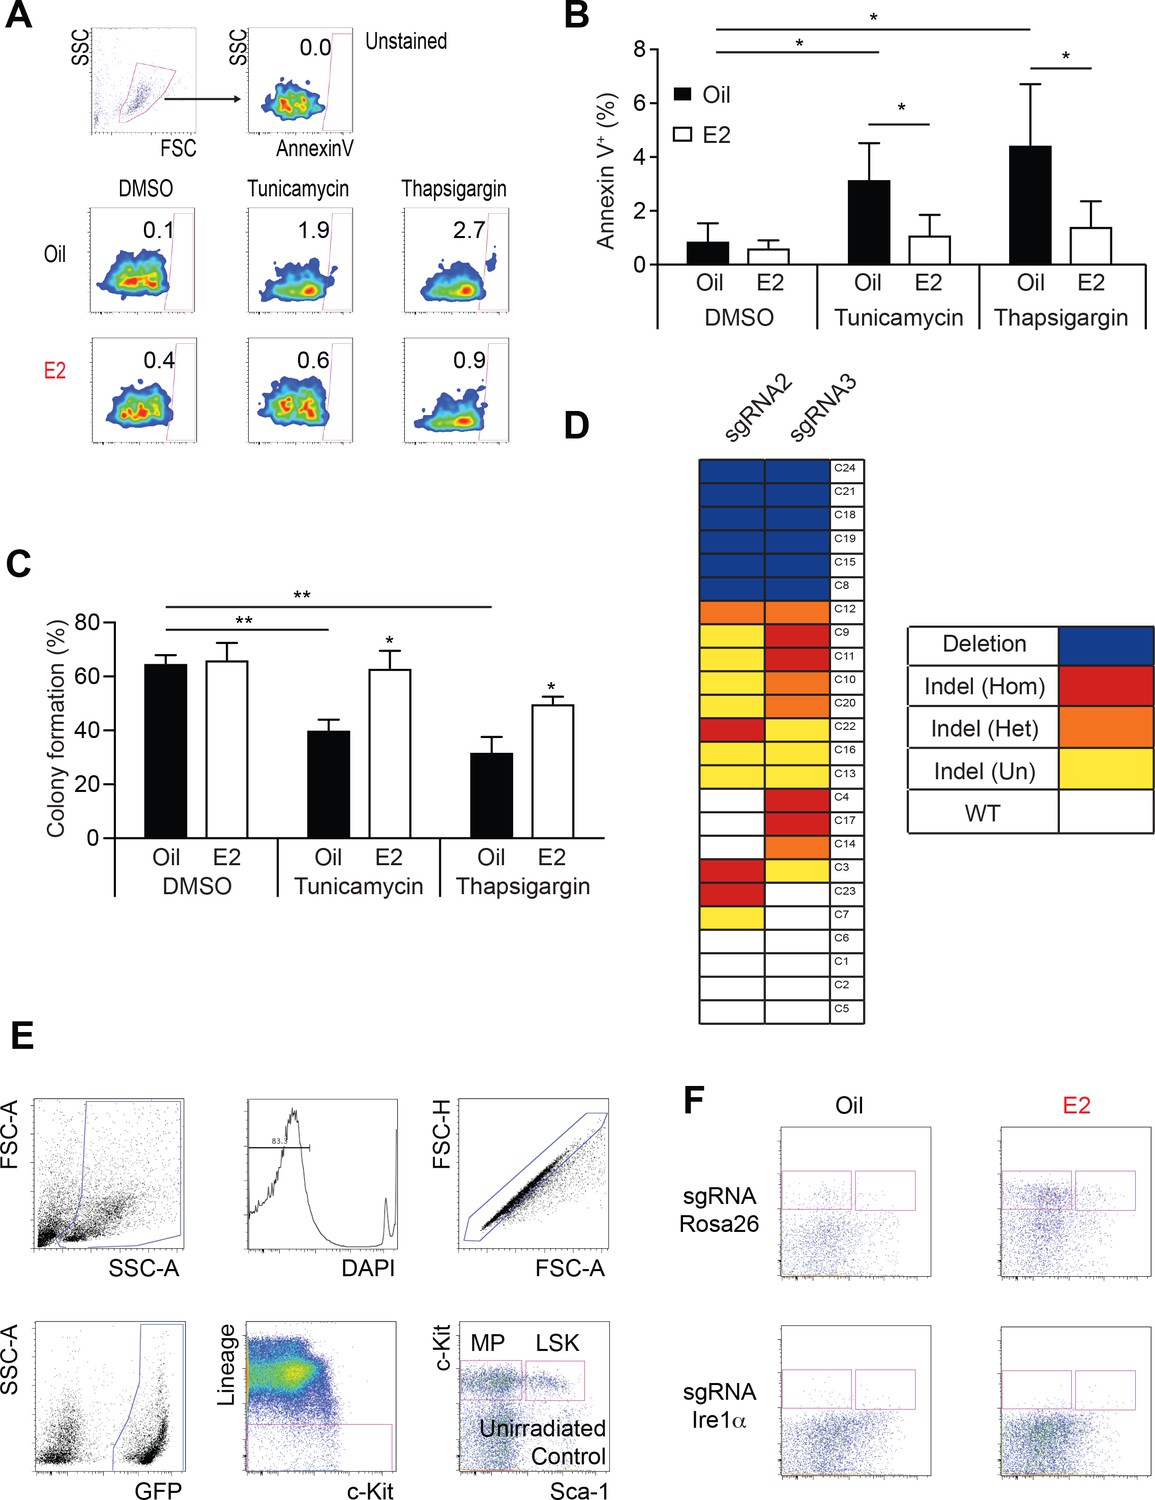
Ire1α is Necessary for Hematopoietic Regeneration in E2 Treated Mice.
(A) Representative Annexin V plots to identify apoptotic cells after exposure to proteotoxic stressors. (B) Annexin V staining of LSK cells subjected to various ER stressors. LSK cells from oil- or E2-treated mice were incubated overnight with either tunicamycin or thapsigargin. Cells were collected and stained with Annexin V (n = 5, three independent experiments). Both tunicamycin and thapsigargin induced Annexin V, which was suppressed in E2-treated LSK cells. *p<0.05, Student’s t-Test (C) Colony assays of LSK cells isolated from oil or E2-treated mice. 10,000 LSK cells were incubated overnight with ER stressors before individually plated in 96-well plates. Fraction of cells that formed colonies 12 days later is shown (n = 6, Oil; n = 5, E2, four independent experiments). ER stressors reduced clonogenicity, which was mitigated in E2 treated cells. *p<0.05; **p<0.01; Mann Whitney U test. (D) Clonal analysis of CRISPR editing efficiency. LSK cells were edited with dual sgRNAs for Ire1α, and single cells were grown in methylcellulose medium. PCR amplicons from each clone were sequenced by Sanger sequencing and traces were analyzed with the TIDE algorithm. Clones were identified as either possessing deletion of genomic DNA between the predicted cutsites (blue), indels (red = homozygous, orange = heterozygous, yellow = undetermined), or WT alleles (white). (E) Gating strategy to analyze hematopoietic content in recipients of Rosa26- or Ire1α-edited LSKs. (F) Representative FACS plots of Oil or E2 treated recipients of gene-edited LSKs. All data represent mean ±standard deviation.
Additional files
-
Supplementary file 1
List of primers used for quantitative real-time PCR, ChIP-seq, and sgRNA systhesis.
All primers are listed in the 5’ to 3’ direction.
- https://doi.org/10.7554/eLife.31159.015
-
Transparent reporting form
- https://doi.org/10.7554/eLife.31159.016
Download links
A two-part list of links to download the article, or parts of the article, in various formats.
Downloads (link to download the article as PDF)
Open citations (links to open the citations from this article in various online reference manager services)
Cite this article (links to download the citations from this article in formats compatible with various reference manager tools)
ERα promotes murine hematopoietic regeneration through the Ire1α-mediated unfolded protein response
eLife 7:e31159.
https://doi.org/10.7554/eLife.31159


