Fast and accurate edge orientation processing during object manipulation
- Western University, Canada
- Umea University, Sweden
- Queen’s University, Canada
- Queen's University, Canada
Figures
Figure 1 with 1 supplement
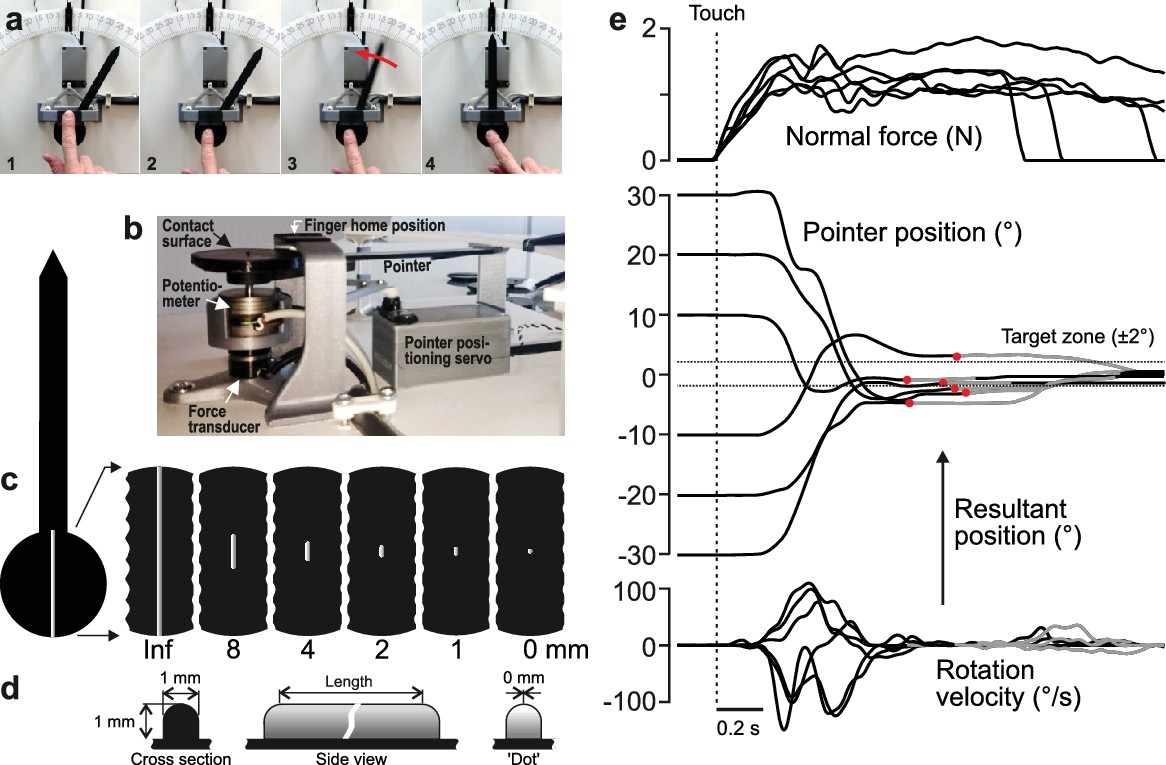
Experimental approach.
(a) Four principle phases of the pointer-alignment trials. (b) Photograph of the apparatus. (c) The left panel shows a top-down schematic view of the dial and pointer along with an exemplar fingerprint superimposed on the contact surface for scale purposes. The six panels on the right show the six edge lengths. The edge that spanned the entire area contacted by fingertip was termed the infinite edge and the 0 mm edge refers to raised dot stimulus. (d) Cross-sectional and side views of the edges. (e) Normal force, pointer position and rotation velocity shown for six superimposed exemplar trials with the six initial dial orientations. Data aligned on initial touch (vertical line). Dashed horizontal lines represents the target ±2° zone. The resultant pointer position was measured when the rotation velocity fell below 10°/s (red dots). Gray segments of the traces represent final adjustments of the orientation with the shutter glasses opened to allow visual guidance of the movement during the final adjustment of the pointer into the target zone when required.
Figure 1—figure supplement 1

Participants quickly learned the tactile pointer-alignment task.
The horizontal axis shows the actual sequence of tactile pointer-alignment trials performed by each participant, starting with the infinite edge practice block (Pr), followed by three experimental blocks for each of the infinite, 8, 4, and 2 mm edge length. Note that data from the 1 mm edge length and the raised dot are not shown for clarity. The vertical axis represents the absolute alignment error. The black line was obtained by averaging the absolute alignment error trial by trial across participants after first filtering each participant’s data with a symmetrical moving median filter comprising three consecutive trials. The shaded area represents the standard error of the mean. Most of the performance improvement took place in the first 10 trials of the practice block. A repeated measures ANOVA restricted to the infinite edge length, including the practice and three experimental blocks shows a significant effect of block on absolute alignment accuracy (F3.27 = 3.14, p=0.04). Post hoc examinations indicated that the alignment accuracy during the practice block differed from the three test blocks (p<0.002 for all three comparisons; Tukey HSD test) but that there were no significant differences between the test-blocks (p>0.75 for all three comparisons). A repeated measures ANOVA with edge length (0 – Infinite) and experimental block (1, 2, 3) as factors failed to indicate an effect of block on the absolute alignment accuracy (median value during the block) and there was no significant interaction between block and edge length.
Figure 2
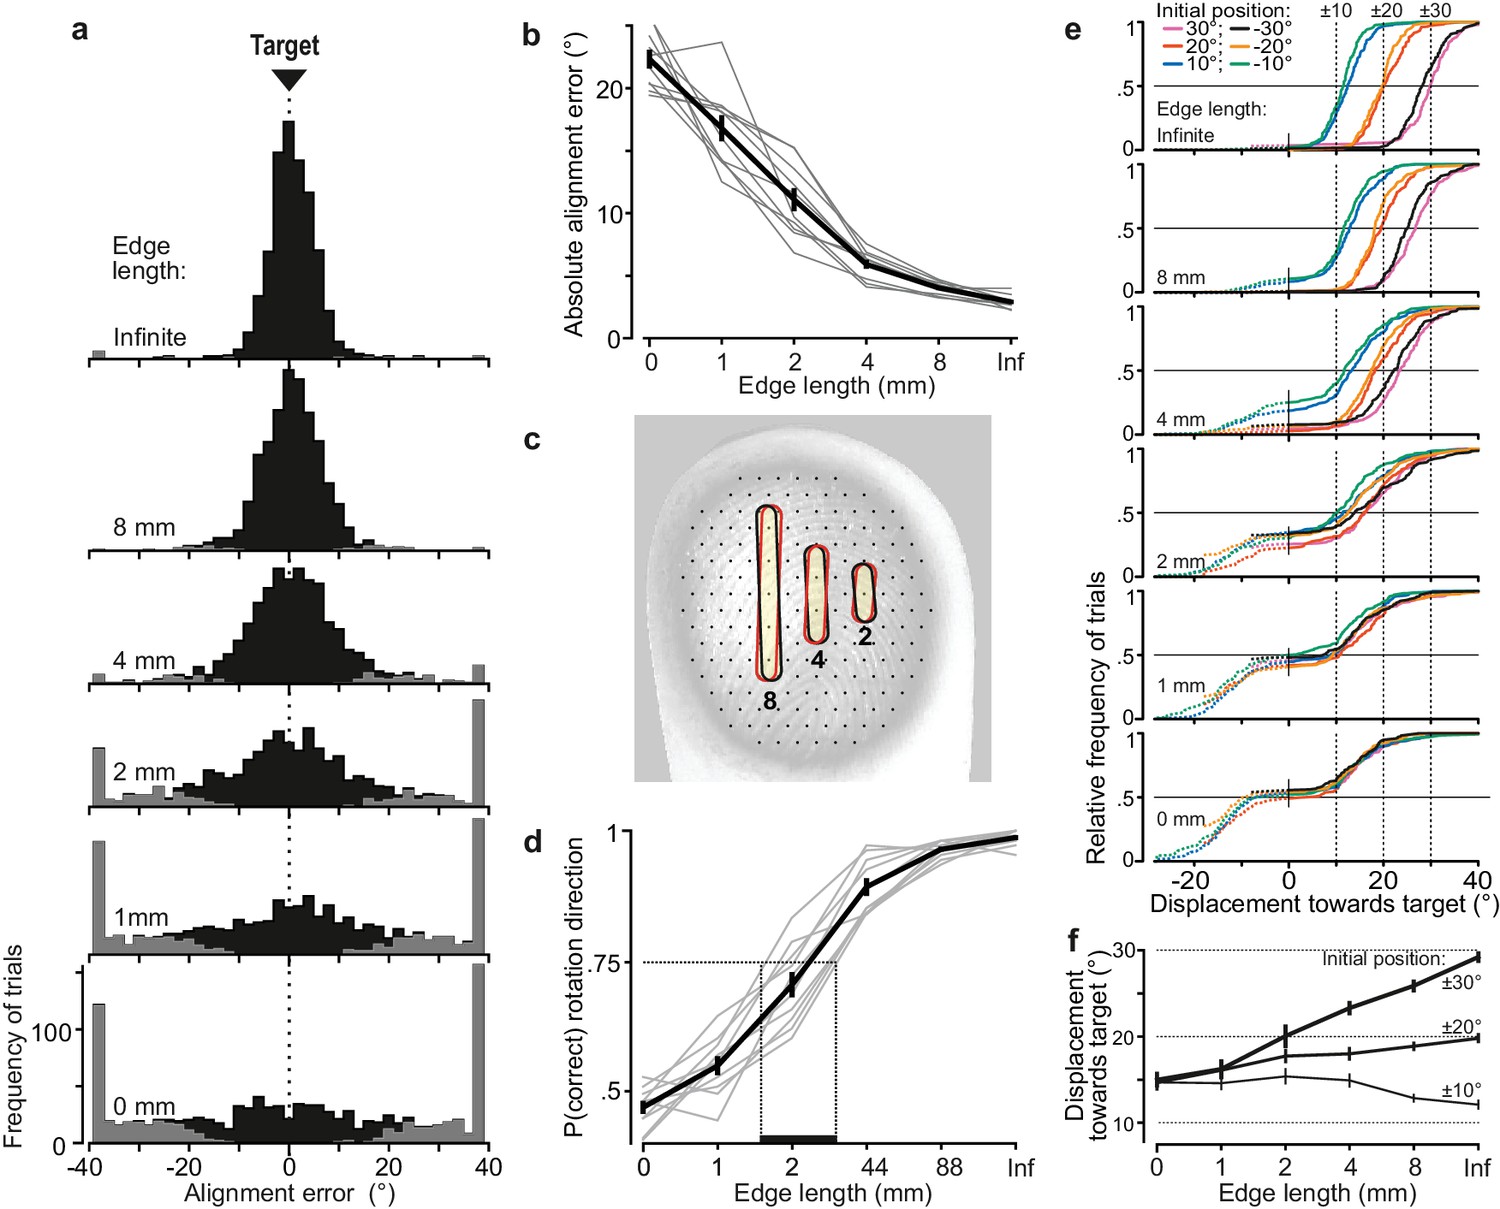
Alignment accuracy during tactile pointer-alignment trials.
(a) Distribution of the alignment error for the various edge lengths for all trials by all ten participants (108 trials/participant and edge length). Gray segments of the distributions refer to trials with rotation in the wrong direction. The accumulation of data at the ±38° represents trials in which the pointer reached the end of its movement range (see Materials and methods). (b) Absolute alignment error (deviation from the 0° target position) as a function of edge length based on median values for individual subjects (gray lines) and the corresponding data averaged across participants (black line; means ±1 sem). (c) Contours superimposed on a fingerprint – photographed through a flat glass plate – show the 8, 4 and 2 mm edges twice with an orientation difference that corresponds to the average alignment errors with these edges. For reference, superimpose of the fingertip is an array of black dots, laid out in a hexagonal array with a center-to center spacing of 1 mm, which approximately correspond to the spacing of receptive field centers of relevant tactile neurons if uniformly spaced across the fingertip. (d) Proportion of trials with rotations in the correct direction as function of edge length for each participant for all initial dial orientations pooled (gray lines) and the corresponding data averaged across participants (black line). Under the criterion that 75% correct responses define the threshold level, the vertical dashed lines indicates an estimation of the range across participants of threshold of edge length for correct rotation direction. (e) Cumulative frequency distribution of the pointer displacement referenced to movement in the direction of the target for trials performed by all participants with each edge length and initial dial orientation. The vertical dashed lines indicate the displacement required to reach the target position. The dashed segments of the distributions refer to trials with rotation in incorrect direction (i.e., negative displacement values) and are curtailed by the pointer reaching the end of its movement range. (f) Pointer displacement in the correct direction as a function of initial dial orientation and edge length shown as mean values across subjects (±1 sem; N = 10) based on participants’ medians. The dashed horizontal lines indicate the displacement required reaching the target for the 10, 20 and ±30° initial dial orientations. Data are pooled across the 10, 20 and ±30° orientations since there was no significant effect of sign of the orientation on the pointer displacements these initial orientations.
-
Figure 2—source data 1
Underlying data points for Figure 2b, d and f.
- https://doi.org/10.7554/eLife.31200.006
Figure 3 with 1 supplement
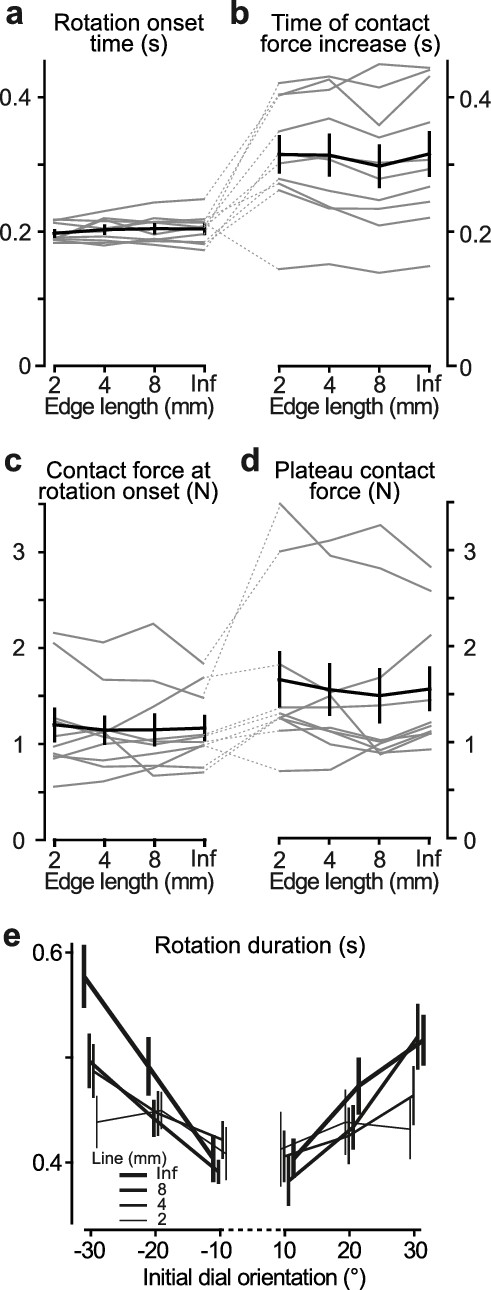
Contact behavior and temporal parameters in tactile pointer-alignment trials.
(a,b) Time of onset of the orienting of the dial (‘Rotation onset time’) and the time when the contact force reached its plateau-like state (‘Time of contact force increase’) as a function of edge length referenced to the time of initial touch of dial. (c,d) Contact force at the time of the start of dial rotation and during the plateau-like state of the force, respectively. (a–d) Gray lines indicate median values for individual subjects and black line represents their mean values averaged across participants. Error bars indicate the standard error of the mean. (e) The duration of the dial rotation as a function of the dial’s initial orientation for each of the edges that were 2 mm and longer. Lines indicate means across participants’ medians. Error bars indicate the standard error of the mean.
-
Figure 3—source data 1
Underlying data points for Figure 3a–e.
- https://doi.org/10.7554/eLife.31200.009
Figure 3—figure supplement 1

Presence of sub-movements did not influence alignment accuracy or direction errors in the tactile pointer-alignment task.
(a) Identification of movement components in the dial rotation. Top panel: Pointer position and dial rotation velocity shown for an exemplar trial (30° initial dial orientation) that we found to contain two movement components. Middle panel: We identified a movement component by a reliable peak (positive and negative) in the velocity profile defined as a zero-crossing with negative slope of a low-pass filtered version of the first time derivative of rotation speed computed as the absolute value of the rotation velocity. Bottom panel: We defined the beginning and end of identified movement components by identifying minima in a high-pass filtered version of the pointer speed signal. Vertical dashed line indicates time of initial contact with the dial. For further details, see Materials and methods. (b) Pointer position and rotation velocity shown for exemplar trials with the six initial dial orientations conducted by one of the participants with the 4 mm long edge. Left, middle and right panels show trials with one major movement, and with two and with three or four movement components, respectively. Data aligned on initial touch (vertical dashed line). (c) Frequency of trials with 1, 2, 3 and 4 movement components as a function of edge length. Note that the frequency distribution of trials with and without sub-movements was similar for all edge lengths. (d) Frequency distribution of number of movement components for each participant for all trials with all edge-lengths > 1 mm and all initial dial orientations (gray lines), and the corresponding data averaged across participants (black line). (e–f) Absolute alignment error and proportion of rotations in the correct direction for trials with (solid lines) and without (dashed lines) sub-movements as a function of edge length. Data pooled across all initial dial orientations and edge-lengths of 2 mm and longer. (c, e, f) Lines indicate means across participants’ medians (N = 10). Error bars indicate the standard error of the mean.
Figure 4 with 1 supplement
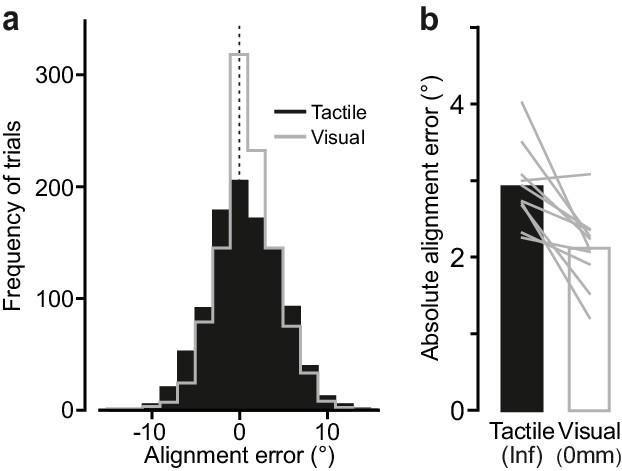
Comparing performance in the visual and the tactile pointer-alignment tasks.
(a) Distribution of the alignment error during the visual (gray) and tactile (black) pointer-alignment tasks for all trials by all ten participants (108 trials/participant and task). (b) Absolute alignment error in the two tasks. Height of black and white bars indicates mean values across participants’ medians in the tactile and visual condition, respectively, and gray lines indicate median values for each participant and condition.
-
Figure 4—source data 1
Underlying data points for Figure 4b.
- https://doi.org/10.7554/eLife.31200.012
Figure 4—figure supplement 1

Comparing performance in the visual and tactile pointer-alignment tasks.
(a) Absolute alignment error as a function of initial dial orientation in the tactile (black) and visual (gray) pointer-alignment task, which involved the infinite edge and raised dot, respectively. Lines indicate means across participants’ medians (N = 10). Error bars indicate the standard error of the mean. The greater average alignment error in the tactile than in the visual condition (F1,9 = 12.9, p=0.006) mainly stemmed from smaller errors in the visual trials with initial dial orientations closest to the 0˚ target. That is, there was a significant interaction effect of the initial orientation and sensory condition on the alignment error (F5,45 = 6.5; p=0.0001) besides a main effect of initial orientation (F5,45 = 10.6; p<10−6). A post-hoc examination revealed that the initial orientation did not significantly influence the performance in the tactile condition but that it did significantly influence performance in the visual condition. It also revealed that alignment error was significantly different only for the −20, −10 and 10° initial orientations between the tactile and visual conditions (p<0.01 for all comparisons). (b–e) Time from initial touch to rotation onset, time from initial touch until contact force reached its plateau-like stage, contact force at rotation onset, and plateau contact force during the tactile and visual pointer-alignment tasks. Height of black and white bars indicates mean values across participants’ medians in the tactile and visual condition, respectively, and gray lines indicate median values for each participant and condition. (f) Rotation duration as a function of initial dial orientation for both visual and tactile conditions. Lines indicate means across participants’ medians and error bars indicate the standard error of the mean. (g–h) Frequency distribution of number of movement components and mean number of movement components as a function of initial orientation. Lines indicate means across participants’ means and error bars indicate the standard error of the group mean.
Figure 5 with 1 supplement

Neural mechanisms for edge orientation processing.
(a) Schematic of a 5 × 5 mm square area on the skin surface. The gray lines and circles represent papillary ridges and mechanoreceptive end organs, respectively. Three colors of filled dots represent the mechanoreceptors (e.g. Meissner corpuscles) innervated by one of three first-order tactile neurons, the shaded area behind subsets of these mechanoreceptors represent subfields and the color-matched contour represents that neuron’s receptive field boundary. (b) Top: Same format as (a) but showing color-coded subfields for 10 first-order tactile neurons. Note the high amount of receptive field overlap and subfield intermingling and that, in practice, even this representation is simplified as any point on the fingertip skin would activate ~36 of the relevant first-order tactile neurons (Vallbo and Johansson, 1984) (20 fast-adapting type 1: FA-1; 16 slow-adapting type 1: SA-1). The two edges (2 mm long) are superimposed on the layout are centered at the same location but differ in orientation by 20˚. Bottom: Activation pattern of the population of neurons in the cartoon above. Neurons are filled if the edge touches any of its subfields and unfilled otherwise. Arrows point to two neurons that change their state for the two edge orientations. (c) Output of our model, relating subfields to the neuronal populations’ ability to signal edge orientation (ordinate) as a function of edge length (abscissa). Here we directly contrast two synthetic populations where: (1) each unit has a uniform receptive field by virtue of being connected to one receptive element the same size as its receptive field and (2) each unit has subfields by virtue of being connected to a random number (2–64) of receptor elements (each 250 μm in diameter). Each simulation was repeated 100 times for each edge length. The lines indicate the mean and the shaded areas represent the 95% confidence interval.
-
Figure 5—source data 1
Underlying data points for Figure 5c.
- https://doi.org/10.7554/eLife.31200.016
Figure 5—figure supplement 1
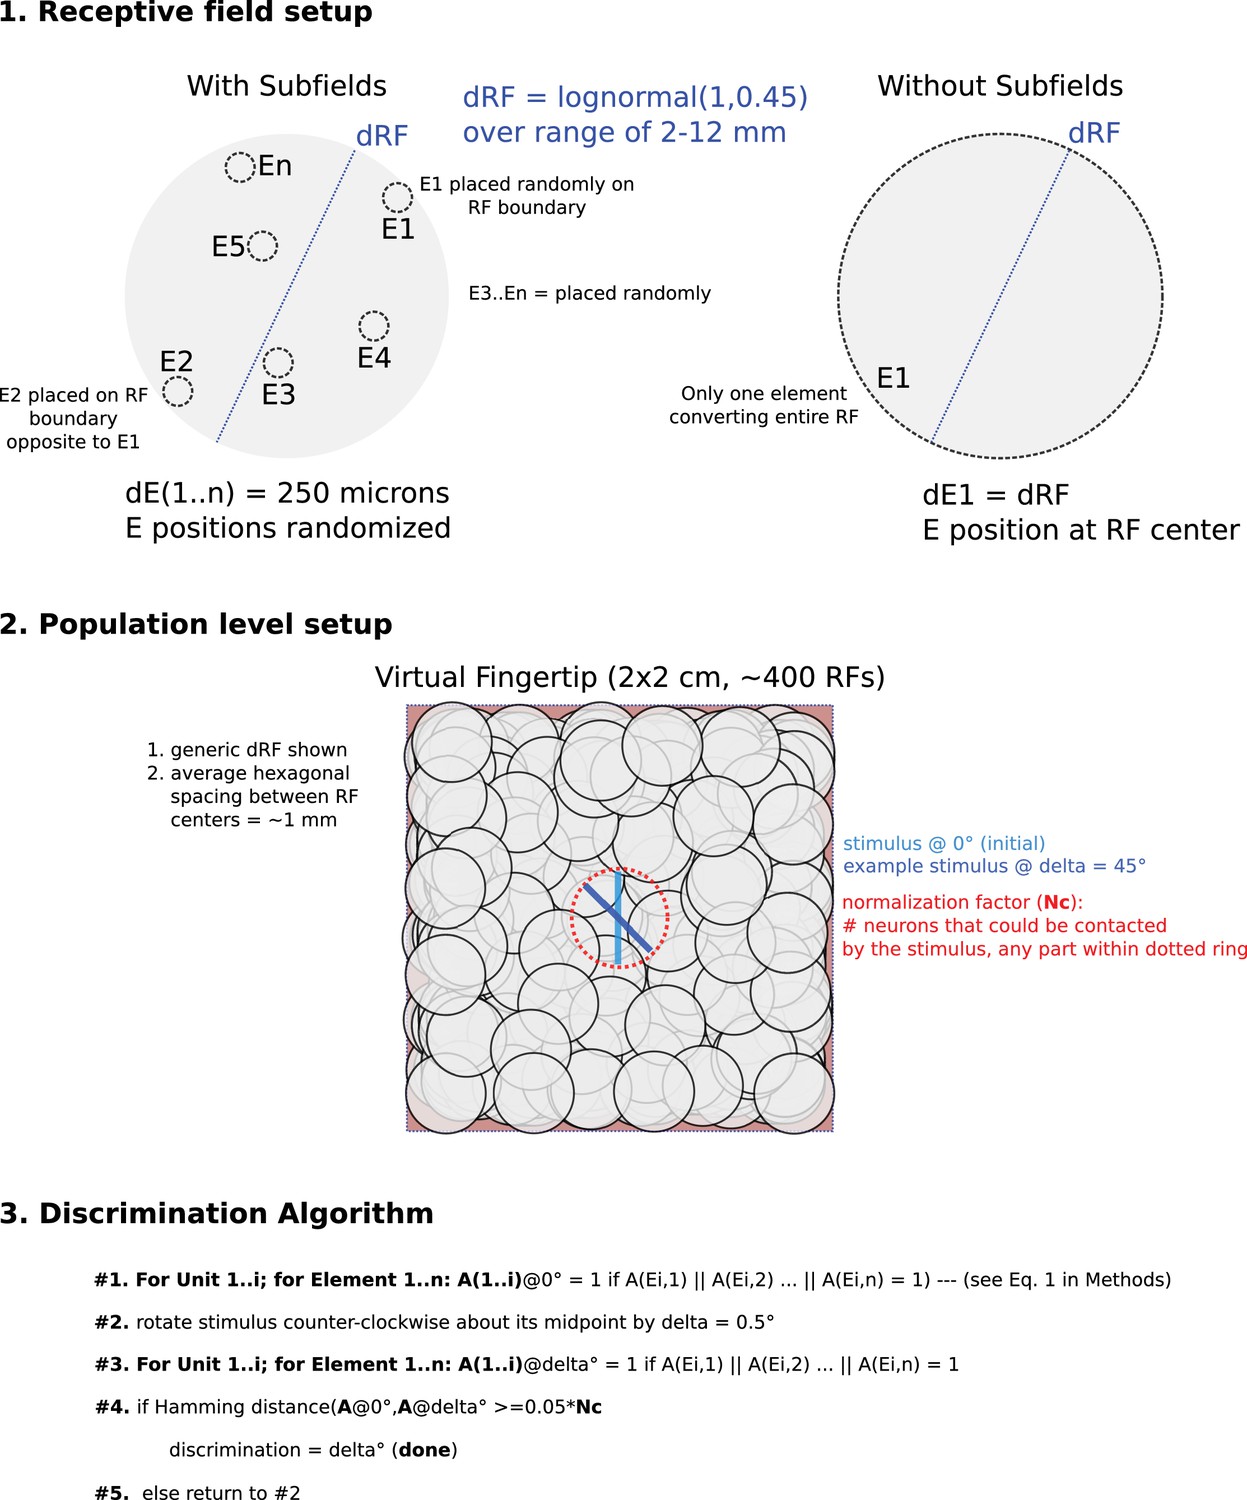
Schematic and flow chart of discrimination model.
The top panel shows how the receptive field maps were constructed. For both model types, the receptive field diameters (dRF) were chosen from the same lognormal distribution (see Materials and methods). The model with subfields it was populated by receptive elements (E) each with a diameter of 250 microns. The first receptive element was placed randomly on the boundary of the receptive field and the second receptive element was placed opposite the first element, also on the receptive field boundary. The rest of the receptive elements (total number of receptive elements was random between 2 and 64) were placed randomly in the receptive field and could overlap. The model without subfields had only one receptive element co-aligned perfectly with the receptive field. The middle panel shows how the population was constructed. For both models, receptive fields were randomly placed over a virtual patch of skin such that the average hexagonal distance between receptive fields was ~1 mm. Blue lines show example stimuli both initial and rotated. The red ring illustrates how we quantified the normalization factor (Nc), essentially the sum of all receptive fields within the potential reach of the given stimulus. The bottom panel presents a flow chart of the discrimination algorithm, see Equations 1–3 in Materials and methods for further details.
Videos
Video 1
Our apparatus and a few sample trials.
https://doi.org/10.7554/eLife.31200.013Additional files
-
Transparent reporting form
- https://doi.org/10.7554/eLife.31200.017
Download links
A two-part list of links to download the article, or parts of the article, in various formats.
Downloads (link to download the article as PDF)
Open citations (links to open the citations from this article in various online reference manager services)
Cite this article (links to download the citations from this article in formats compatible with various reference manager tools)
Fast and accurate edge orientation processing during object manipulation
eLife 7:e31200.
https://doi.org/10.7554/eLife.31200


