MERS-CoV spillover at the camel-human interface
- Fred Hutchinson Cancer Research Center, United States
- University of Edinburgh, United Kingdom
- National Institutes of Health, United States
Figures
Figure 1 with 5 supplements
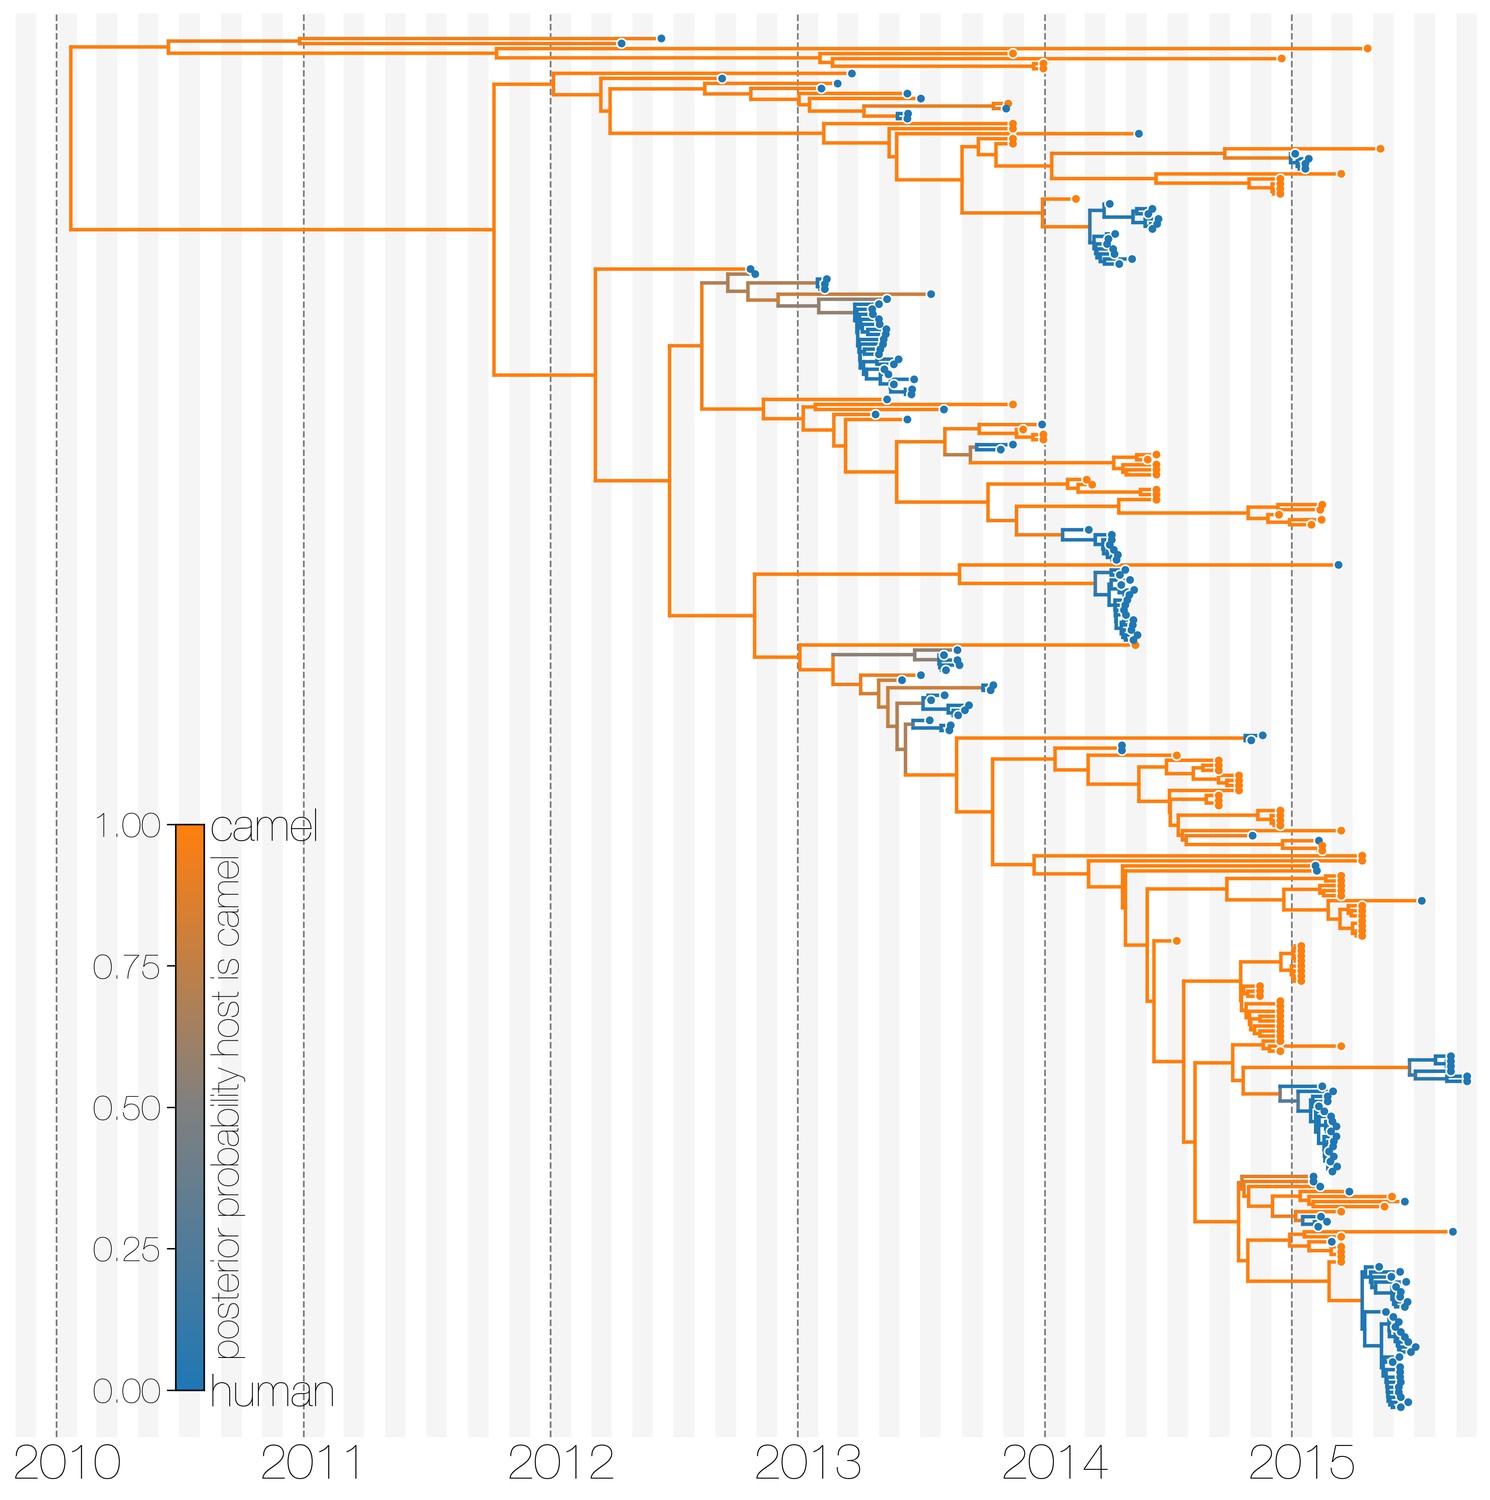
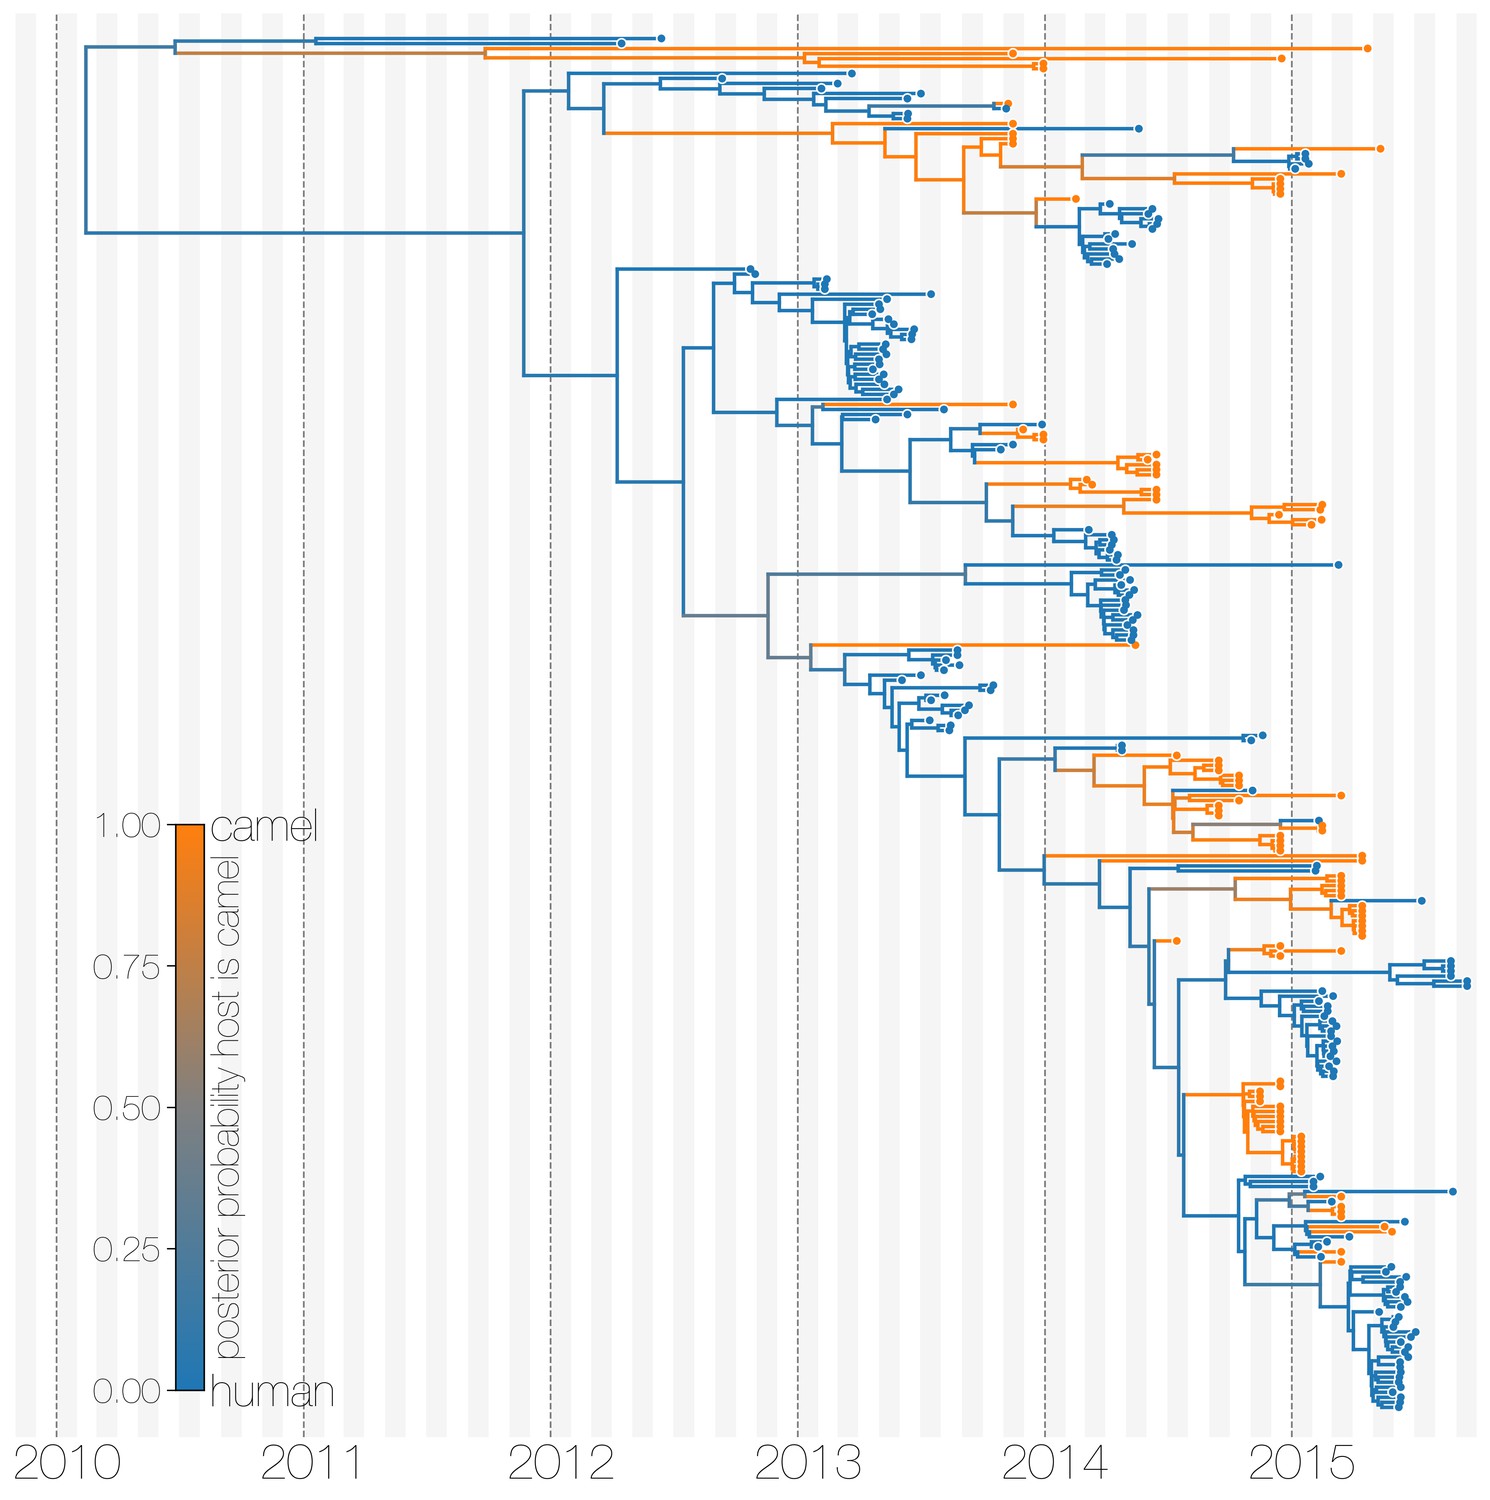
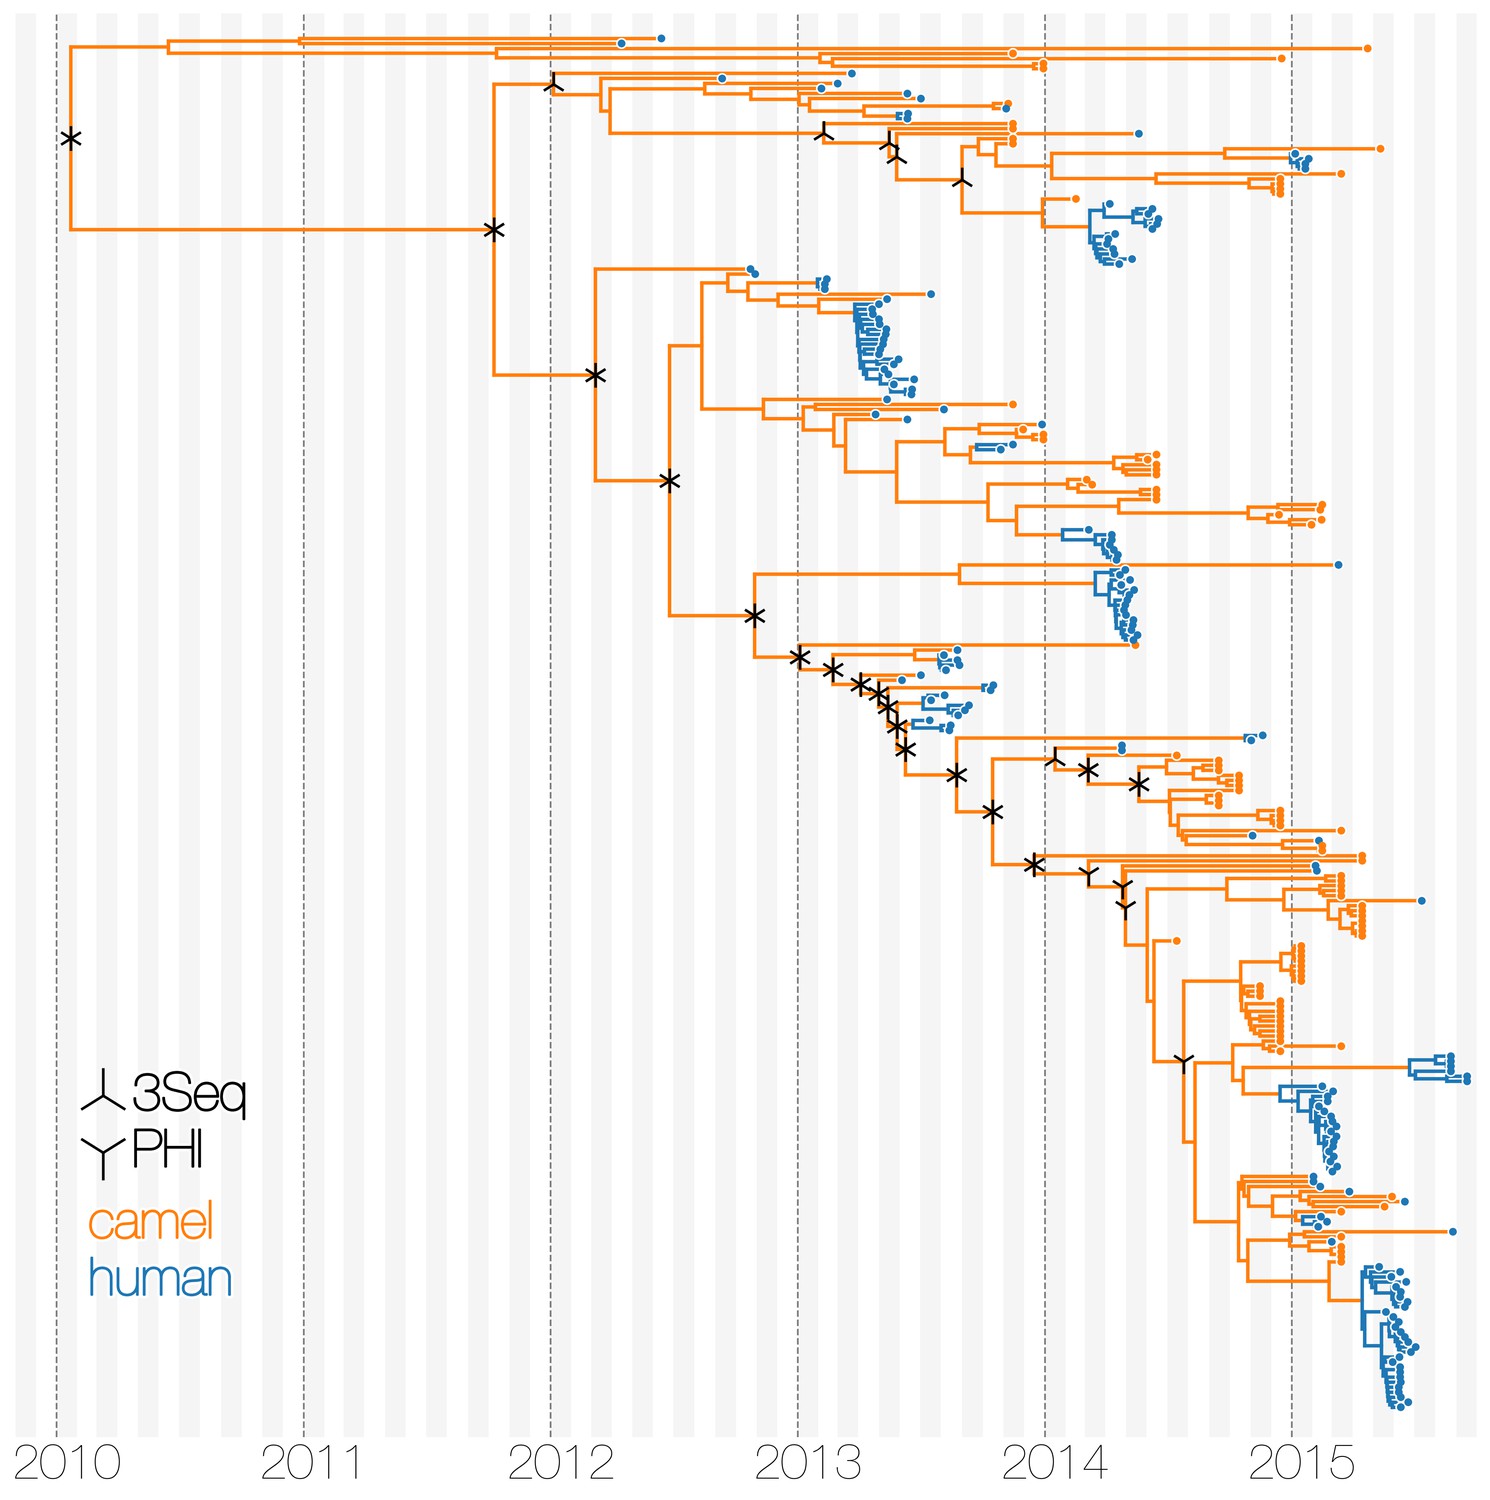
Typed maximum clade credibility tree of MERS-CoV genomes from 174 human viruses and 100 camel viruses.
Maximum clade credibility (MCC) tree showing inferred ancestral hosts for MERS-CoV recovered with the structured coalescent. The vast majority of MERS-CoV evolution is inferred to occur in camels (orange) with human outbreaks (blue) representing evolutionary dead-ends for the virus. Confidence in host assignment is depicted as a colour gradient, with increased uncertainty in host assignment (posterior probabilities close to 0.5) shown as grey. While large clusters of human cases are apparent in the tree, significant contributions to human outbreaks are made by singleton sequences, likely representing recent cross-species transmissions that were caught early.
-
Figure 1—source data 1
XML to run structured coalescent analysis and output files.
- https://doi.org/10.7554/eLife.31257.009
-
Figure 1—source data 2
XML to run structured coalescent analysis with a relaxed prior and output file.
- https://doi.org/10.7554/eLife.31257.010
-
Figure 1—source data 3
XML to run discrete trait analysis (DTA) and output files.
- https://doi.org/10.7554/eLife.31257.011
-
Figure 1—source data 4
XML to run structured coalescent analysis with equal deme sizes between humans and camels and output files.
- https://doi.org/10.7554/eLife.31257.012
-
Figure 1—source data 5
Maximum likelihood phylogeny.
- https://doi.org/10.7554/eLife.31257.013
Figure 1—figure supplement 1
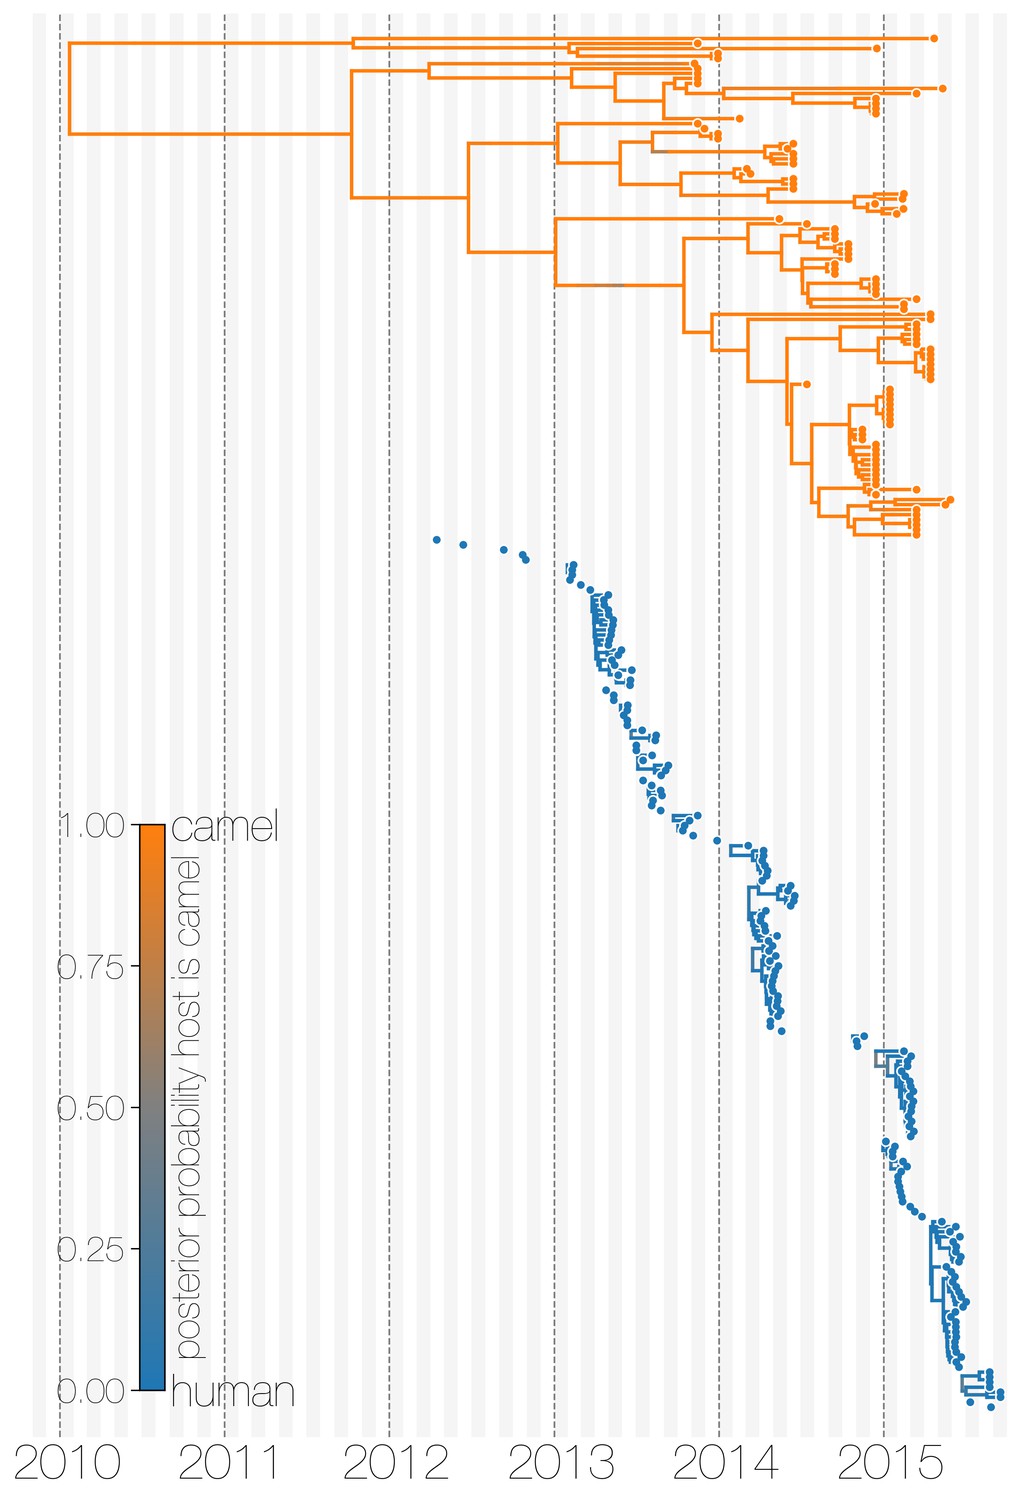
Evolutionary history of MERS-CoV partitioned between camels and humans.
This is the same tree as shown in Figure 1, but with contiguous stretches of MERS-CoV evolutionary history split by inferred host: camels (top in orange) and humans (bottom in blue). This visualisation highlights the ephemeral nature of MERS-CoV outbreaks in humans, compared to continuous circulation of the virus in camels.
Figure 1—figure supplement 2
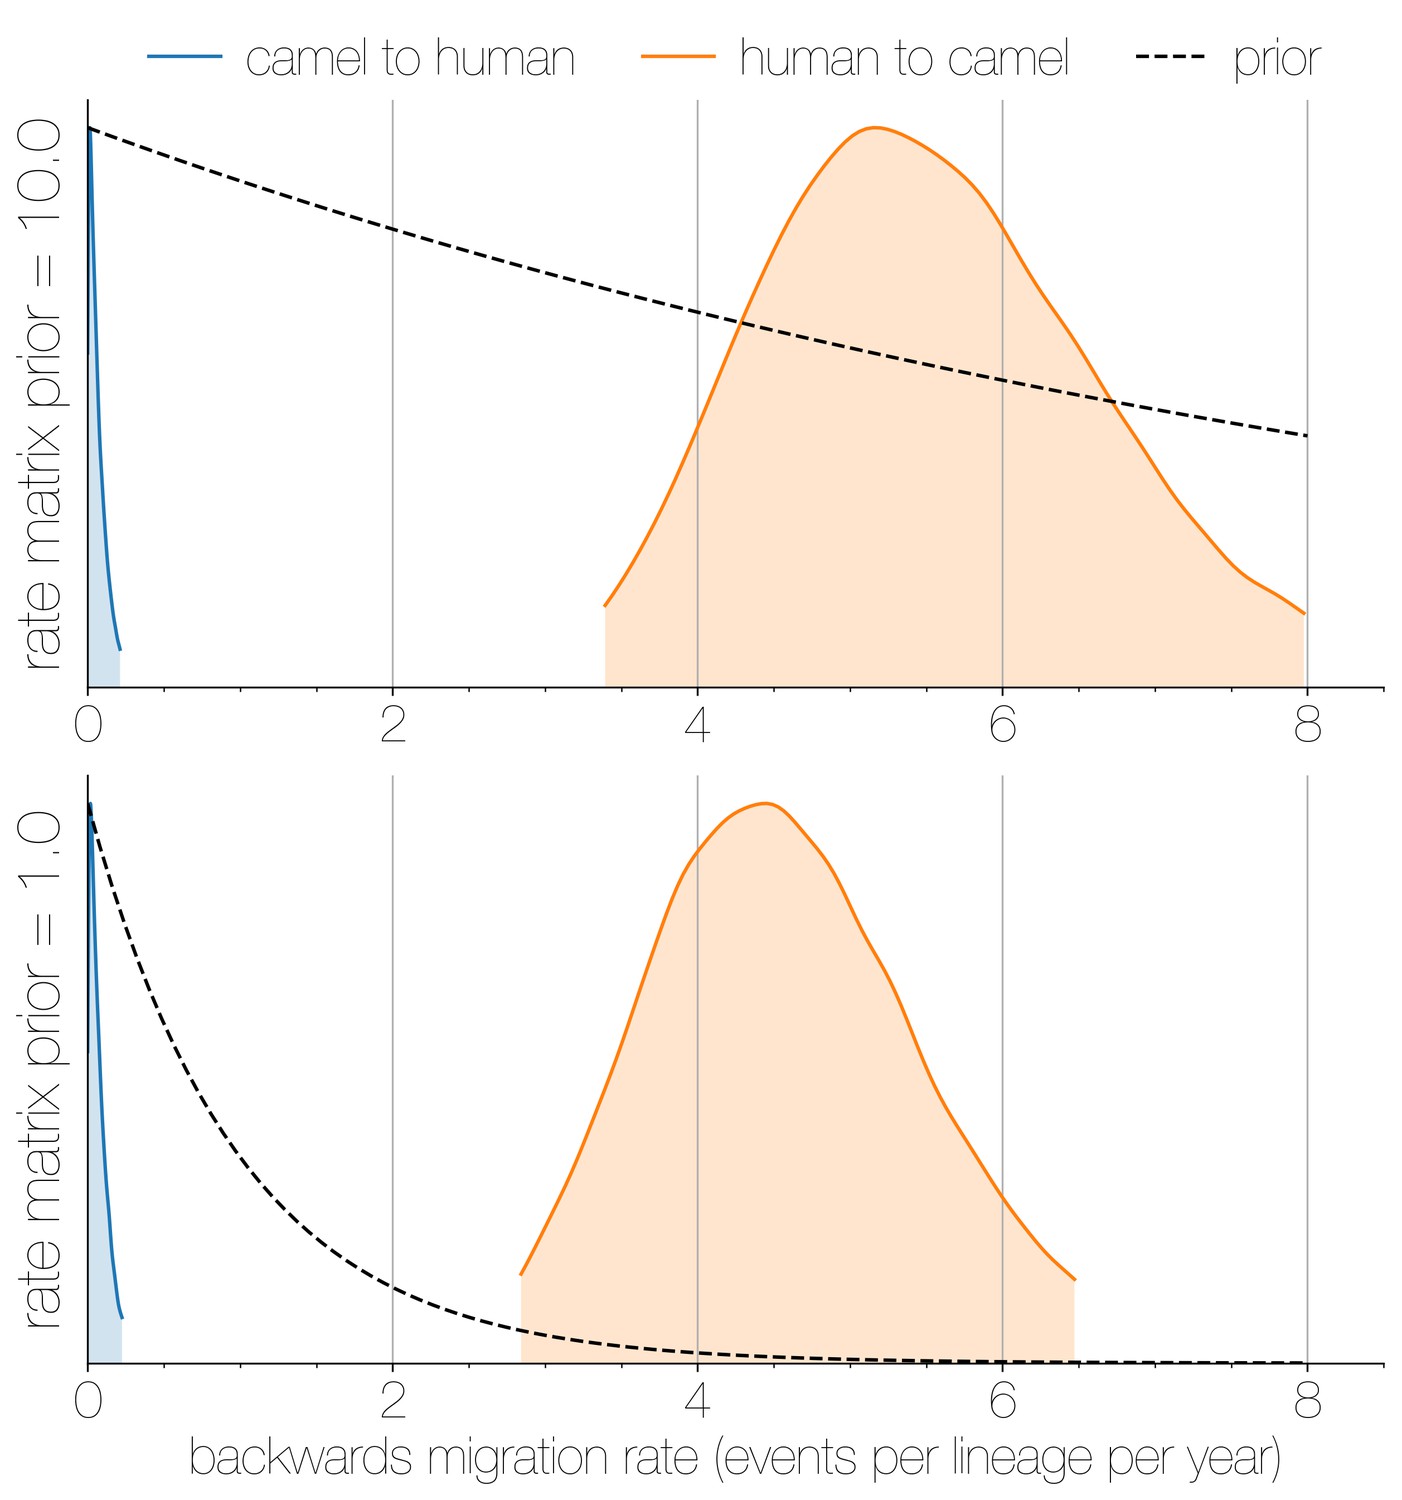
Posterior backwards migration rate estimates for two choices of prior.
Negligible flow of MERS-CoV lineages from humans into camels is recovered regardless of prior choice (note that rates are backwards in time). Plots show the 95% highest posterior density for the estimated migration rate from the human deme into the camel deme looking backwards in time (orange) and vice versa (blue). Dotted lines indicate exponential priors specified for migration rates, with mean 1.0 (bottom) or 10.0 (top).
Figure 1—figure supplement 3
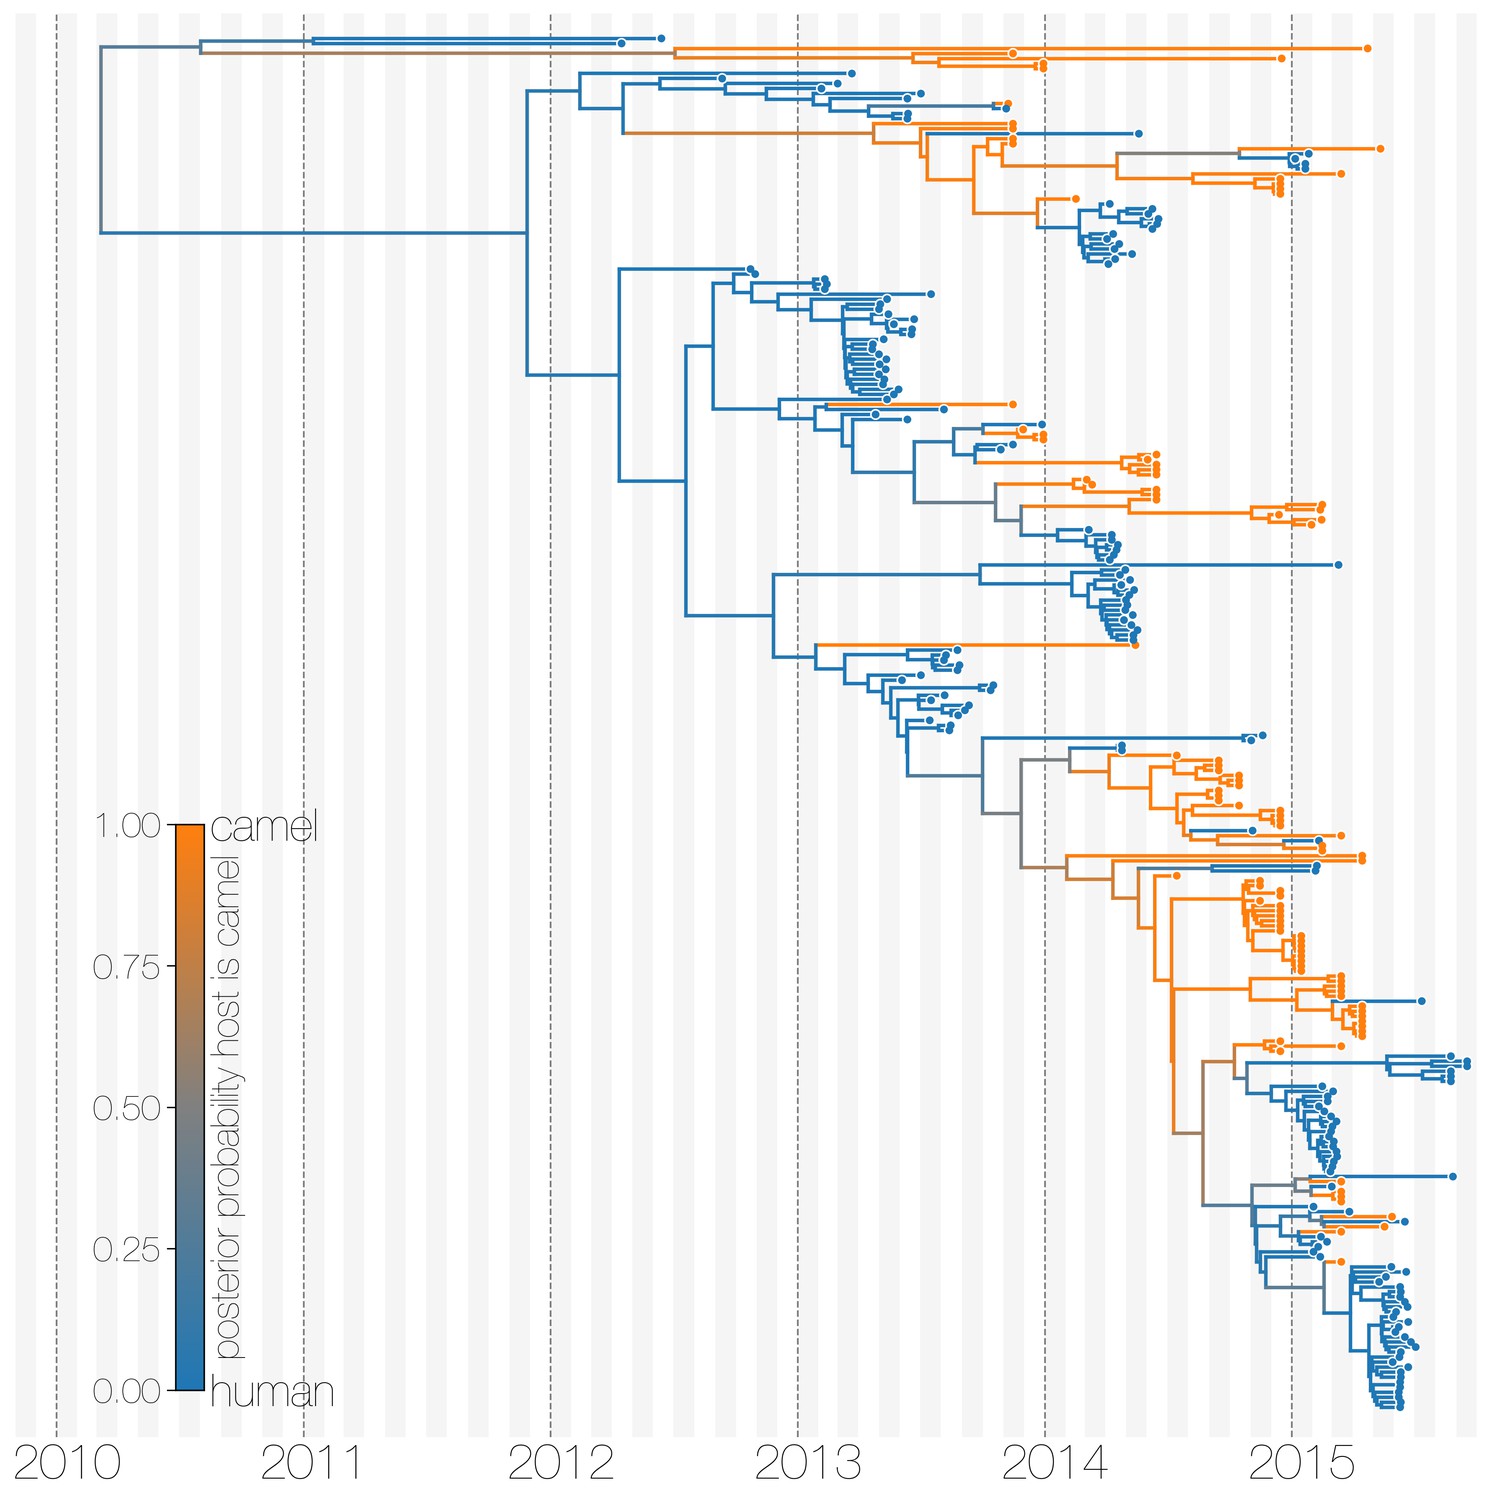
Maximum clade credibility (MCC) tree with ancestral state reconstruction according to a discrete trait model.
MCC tree is presented the same as Figure 1 and Figure 1—figure supplement 4, with colours indicating the most probable state reconstruction at internal nodes. Unlike the structured coalescent summary shown in Figure 1 where camels are reconstructed as the main host where MERS-CoV persists, the discrete trait approach identifies both camels and humans as major hosts with humans being the source of MERS-CoV infection in camels.
Figure 1—figure supplement 4
Maximum clade credibility (MCC) tree of structured coalescent model with enforced equal coalescence rates.
MCC tree is presented the same as Figure 1 and Figure 1—figure supplement 3, with colours indicating the most probable state reconstruction at internal nodes. Similar to Figure 1—figure supplement 3 enforcing equal coalescence rates between demes in a structured coalescent model identifies humans as a major MERS-CoV host and the source of viruses in camels.
Figure 1—figure supplement 5
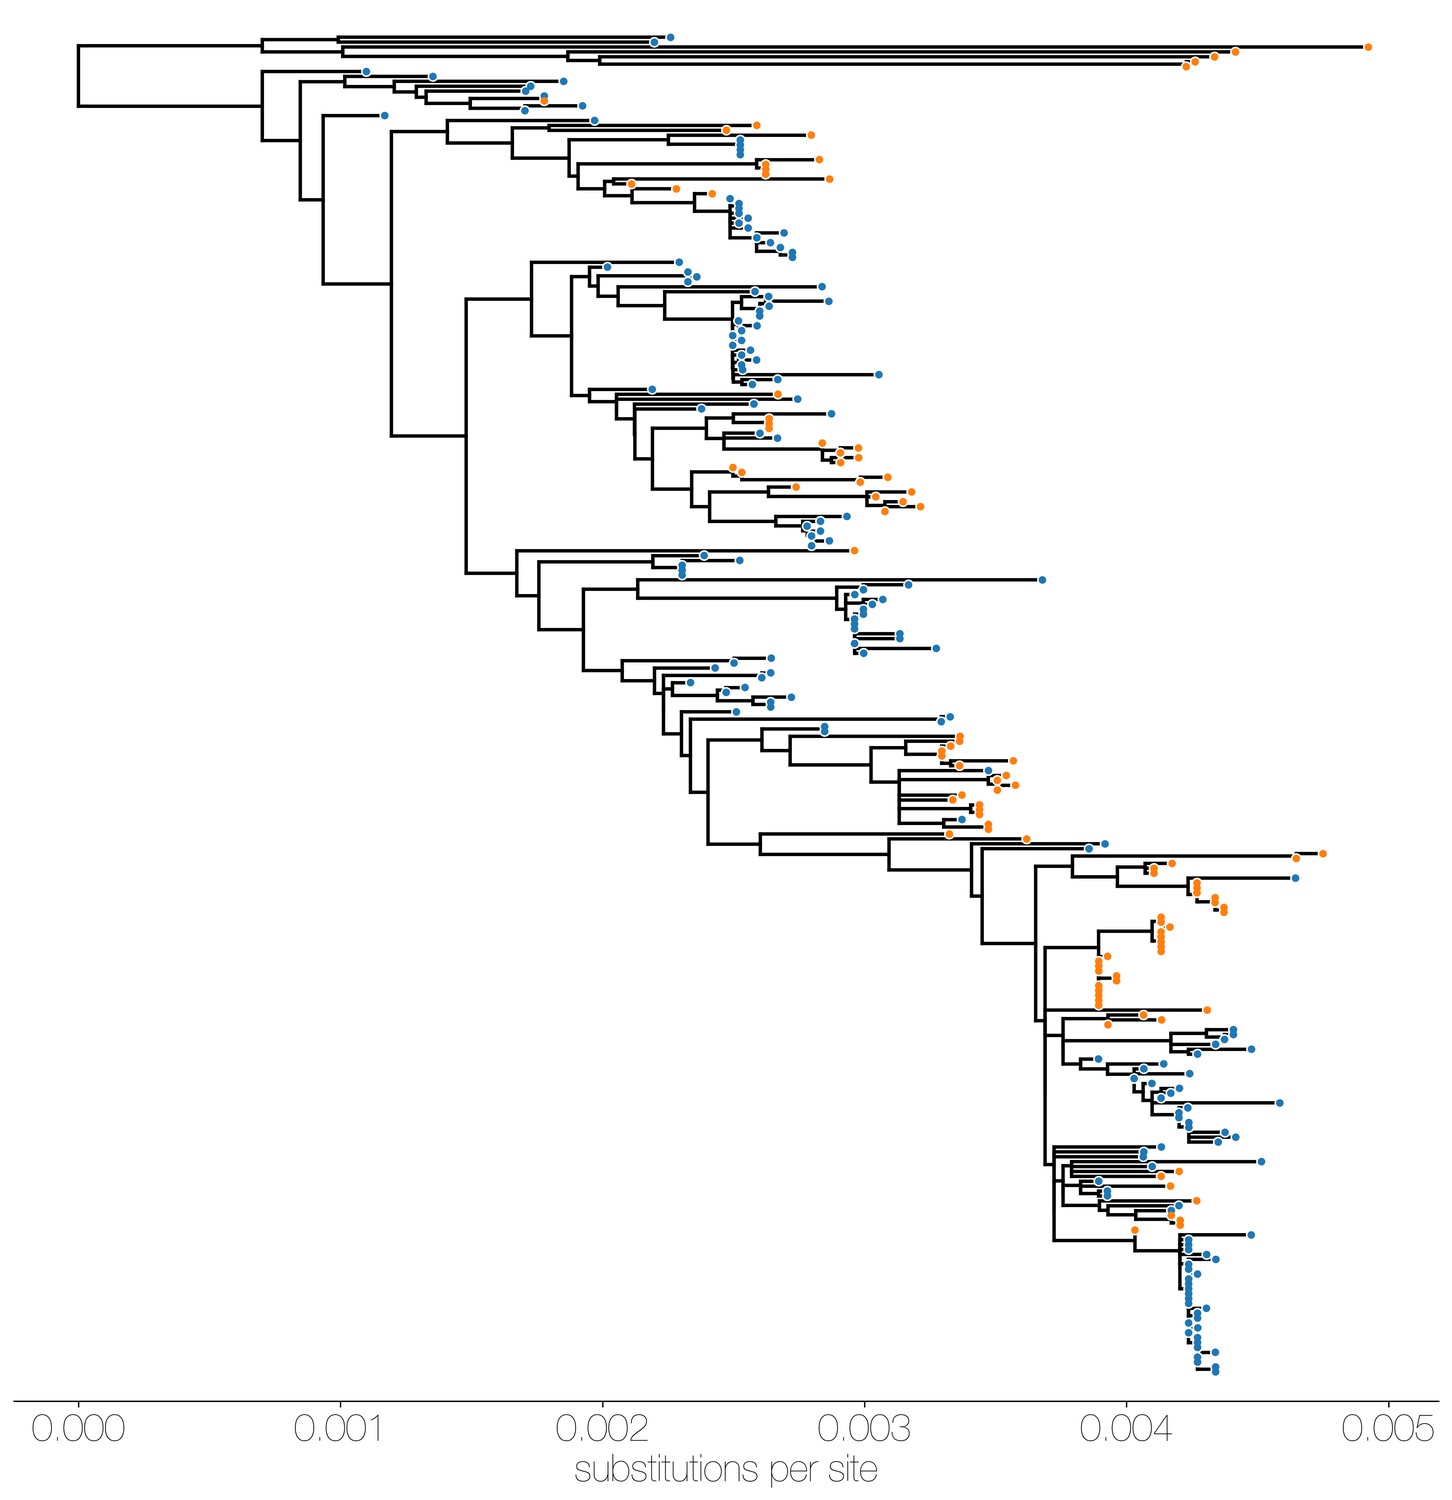
Maximum likelihood (ML) tree of MERS-CoV genomes coloured by origin of sequence.
Maximum likelihood tree shows genetic divergence between MERS-CoV genomes collected from camels (orange tips) and humans (blue tips).
Figure 2
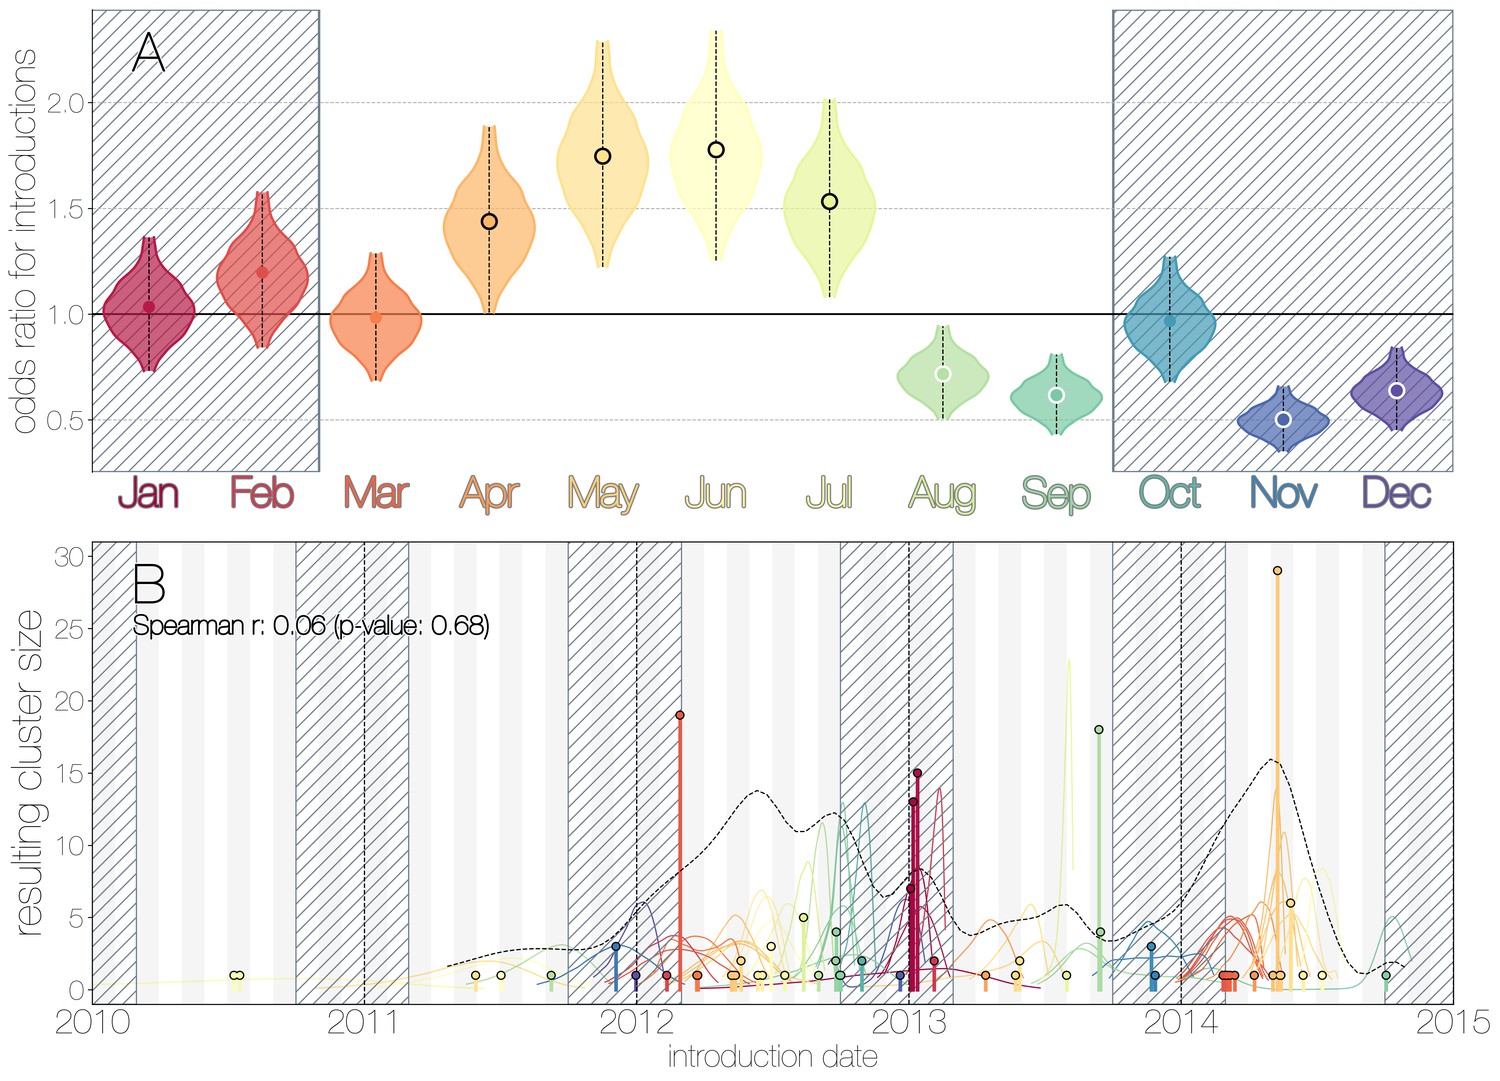
Seasonality of MERS-CoV introduction events.
(A) Posterior density estimates partitioned by month showing the 95% highest posterior density interval for relative odds ratios of MERS-CoV introductions into humans. Posterior means are indicated with circles. Evidence for increased or decreased risk (95% HPD excludes 1.0) for introductions are indicated by black or white circles, respectively. Hatched area spanning October to February indicates the camel calving season. (B) Sequence cluster sizes and inferred dates of introduction events. Each introduction event is shown as a vertical line positioned based on the median introduction time, as recovered by structured coalescent analyses and coloured by time of year with height indicating number of descendant sequences recovered from human cases. 95% highest posterior density intervals for introductions of MERS-CoV into humans are indicated with coloured lines, coloured by median estimated introduction time. The black dotted line indicates the joint probability density for introductions. We find little correlation between date and size of introduction (Spearman , ).
-
Figure 2—source data 1
MCMC samples from seasonality inference analysis.
- https://doi.org/10.7554/eLife.31257.015
Figure 3 with 6 supplements
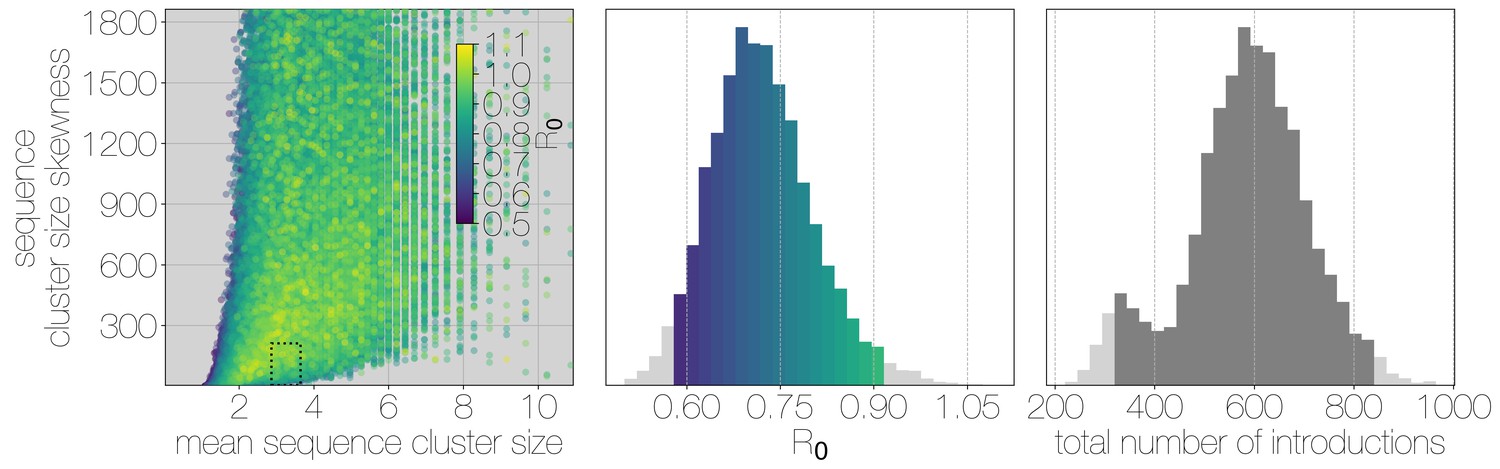
Monte Carlo simulations of human transmission clusters.
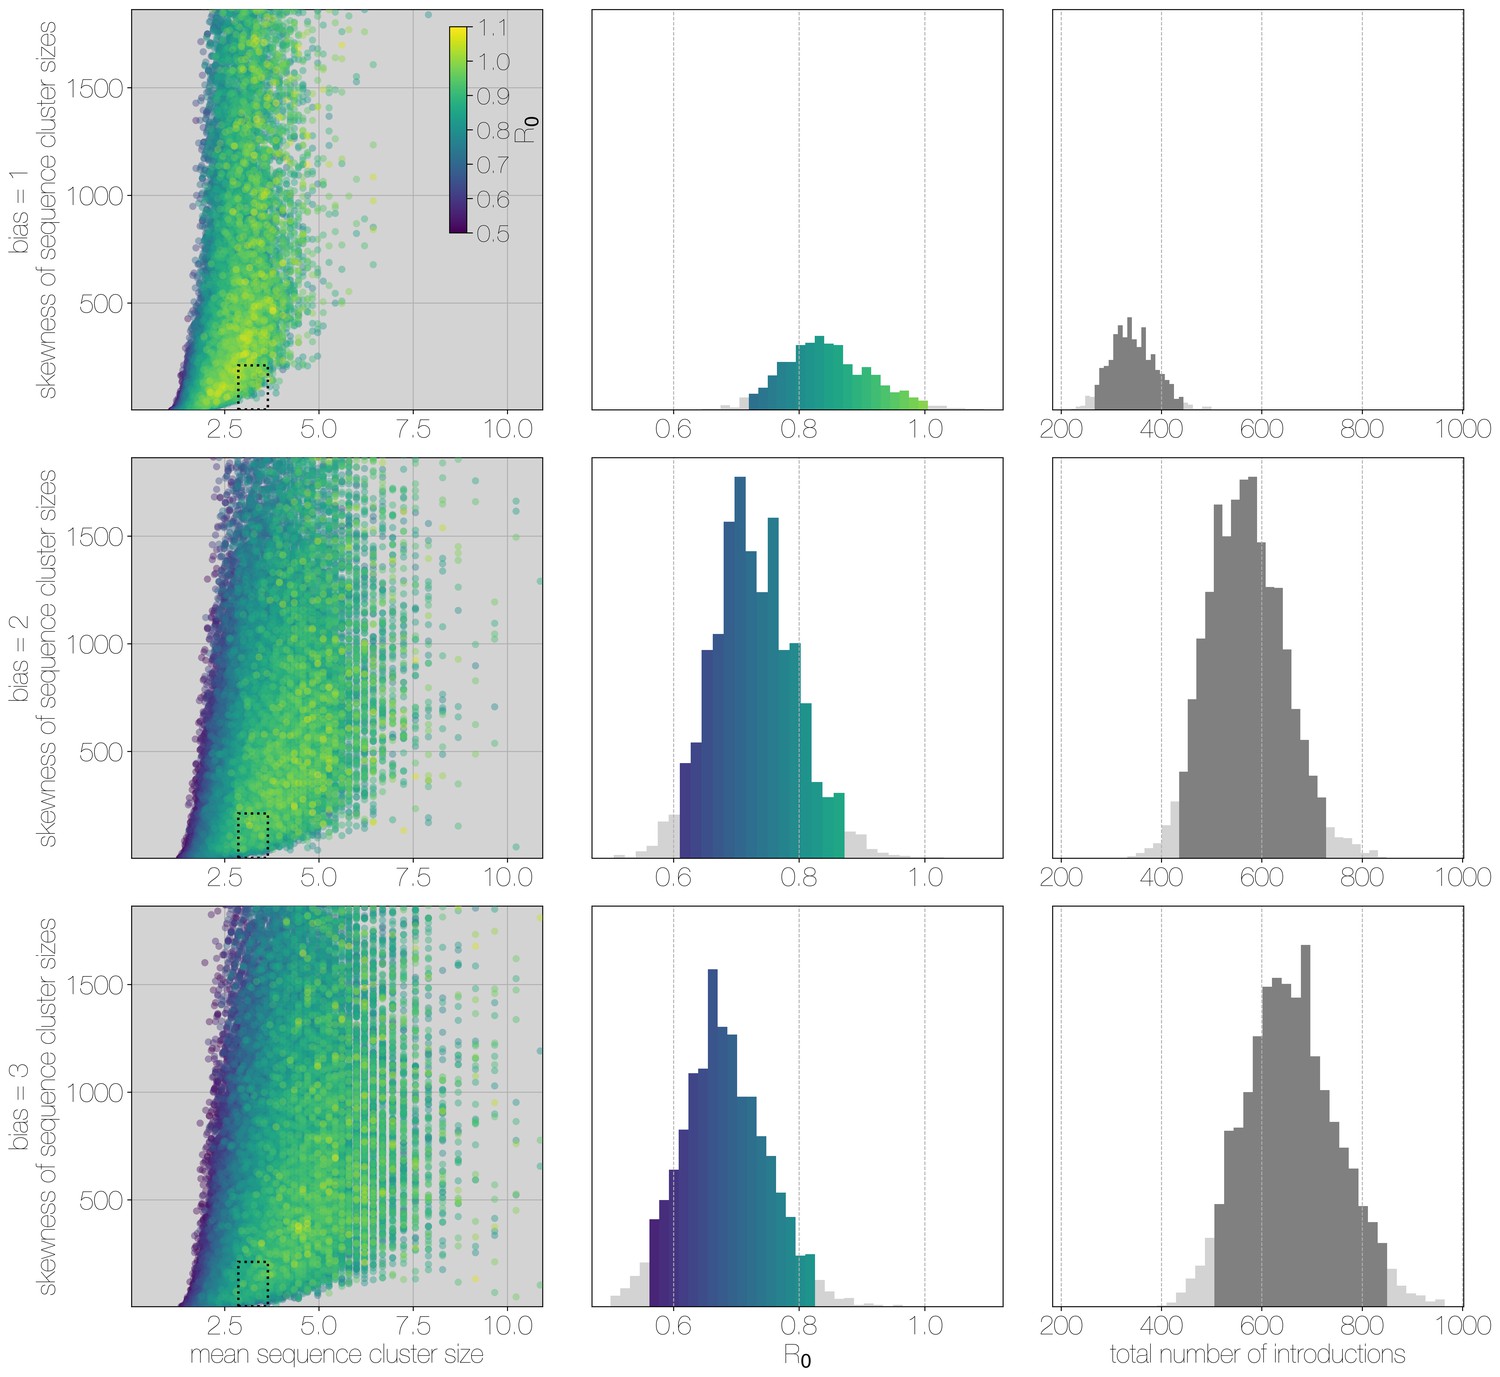
Leftmost scatter plot shows the distribution of individual Monte Carlo simulation sequence cluster size statistics (mean and skewness) coloured by the value used for the simulation. The dotted rectangle identifies the 95% highest posterior density bounds for sequence cluster size mean and skewness observed for empirical MERS-CoV data. The distribution of values that fall within 95% HPDs for sequence cluster size mean, standard deviation, skewness and number of introductions, is shown in the middle, on the same -axis. Bins falling inside the 95% percentiles are coloured by , as in the leftmost scatter plot. The distribution of total number of introductions associated with simulations matching MERS-CoV sequence clusters is shown on the right. Darker shade of grey indicates bins falling within the 95% percentiles. Monte Carlo simulations indicate for MERS-CoV in humans is likely to be below 1.0, with numbers of zoonotic transmissions numbering in the hundreds.
Figure 3—figure supplement 1
Monte Carlo simulations of human transmission clusters.
From top to bottom each row corresponds to departures from completely random sequencing efforts with respect to case cluster size (bias parameter = 1.0) to sequencing increasingly biased towards capturing large case clusters (bias = 2.0, bias = 3.0). Leftmost scatter plots show the distribution of individual Monte Carlo simulation sequence cluster size statistics (mean and skewness) coloured by the value used for the simulation. The dotted rectangle identifies the 95% highest posterior density bounds for sequence cluster size mean and skewness observed for empirical MERS-CoV data. The distribution of values matching empirical data are shown in the middle, on the same -axis across all levels of the bias parameter. Under unbiased sequencing (bias = 1.0) only 0.45% of simulations fit our phylogenetic observations, while 1.79% and 1.67% of simulations fit for bias levels of 2.0 and 3.0, respectively. Correspondingly, we estimate 11.6% support for a model with bias level 1.0, 45.7% support for a model with bias level 2.0, and 42.7% support for a model with bias level 3.0. Bins falling inside the 95% percentiles are coloured by , as in the leftmost scatter plot. While the 95% percentiles for values are close to 1.0 (0.71–0.98) for the unbiased sequencing simulation (i.e. uniform sequencing efforts, in which every case is equally likely to be sequenced), we also note that increasing levels of bias are considerably more to likely to generate MERS-CoV-like sequence clusters. The distribution of total number of introductions associated with simulations matching MERS-CoV sequence clusters is shown in the plots on the right, on the same -axis across all levels of bias. Darker shade of grey indicates bins falling within the 95% percentiles. The median number of cross-species introductions observed in simulations matching empirical data without bias are 346 (95% percentiles 262–439). These numbers jump up to 568 (95% percentiles 430–727) for bias = 2.0 and 656 (95% percentiles 488–853) for bias = 3.0 simulations. Model averaging would suggest plausible numbers of introductions between 311 and 811.
Figure 3—figure supplement 2
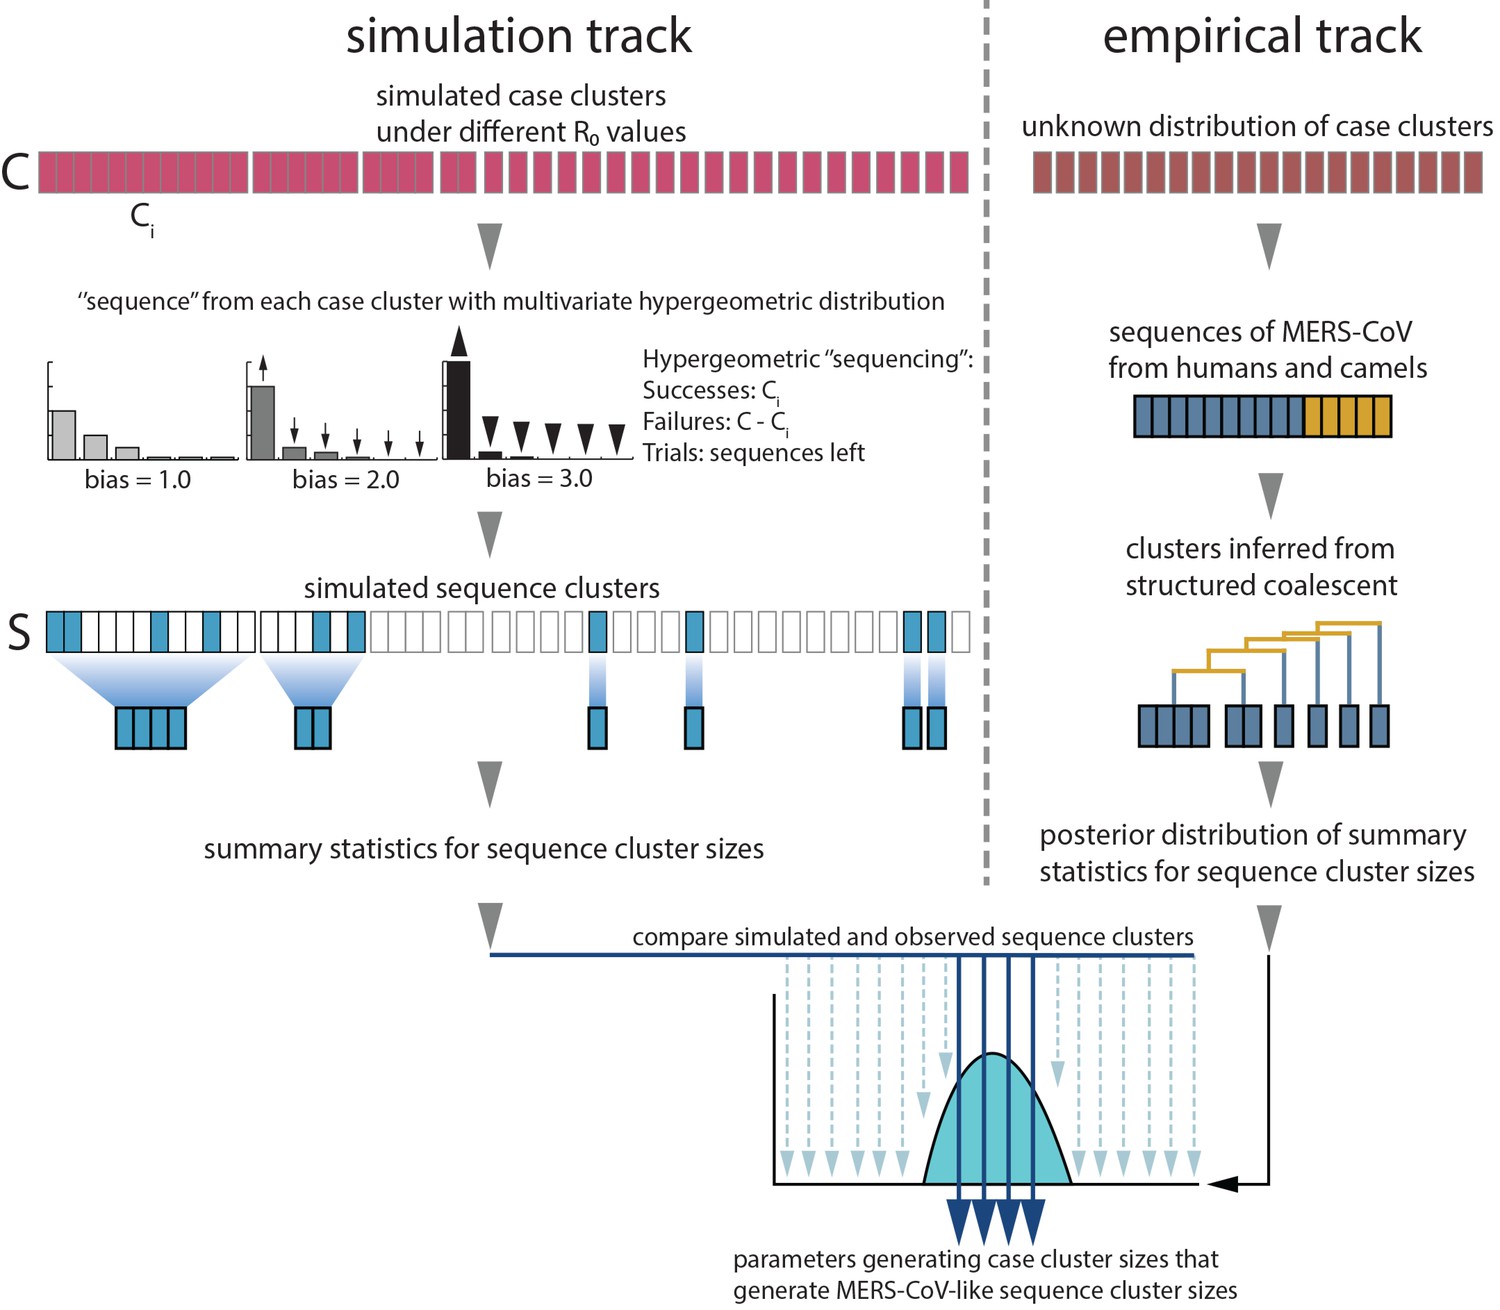
Monte Carlo simulation schematic.
Case clusters are simulated according to Equation 1 until an outbreak size of 2000 cases is reached. We sample 174 cases from each simulation to represent sequencing of human MERS cases. ‘Sequencing’ is carried out by using multivariate hypergeometric sampling, representing sampling cases without replacement to be sequenced. Sequencing simulations take place at three levels of bias: 1.0, where every case is equally likely to be sequenced, and 2.0 and 3.0, where cases from larger clusters are increasingly more likely to be sequenced. The distribution of simulated sequence clusters is summarised by its mean, median and standard deviation. A simulation is considered to match if the mean, median and standard deviation of its sequence cluster sizes falls within the 95% highest posterior density interval of observed MERS-CoV sequence clusters. values that ultimately generate data matching empirical observations, as well as associated numbers of ‘introductions’ are retained as estimates. These estimates are summarised in Figure 3.
Figure 3—figure supplement 3
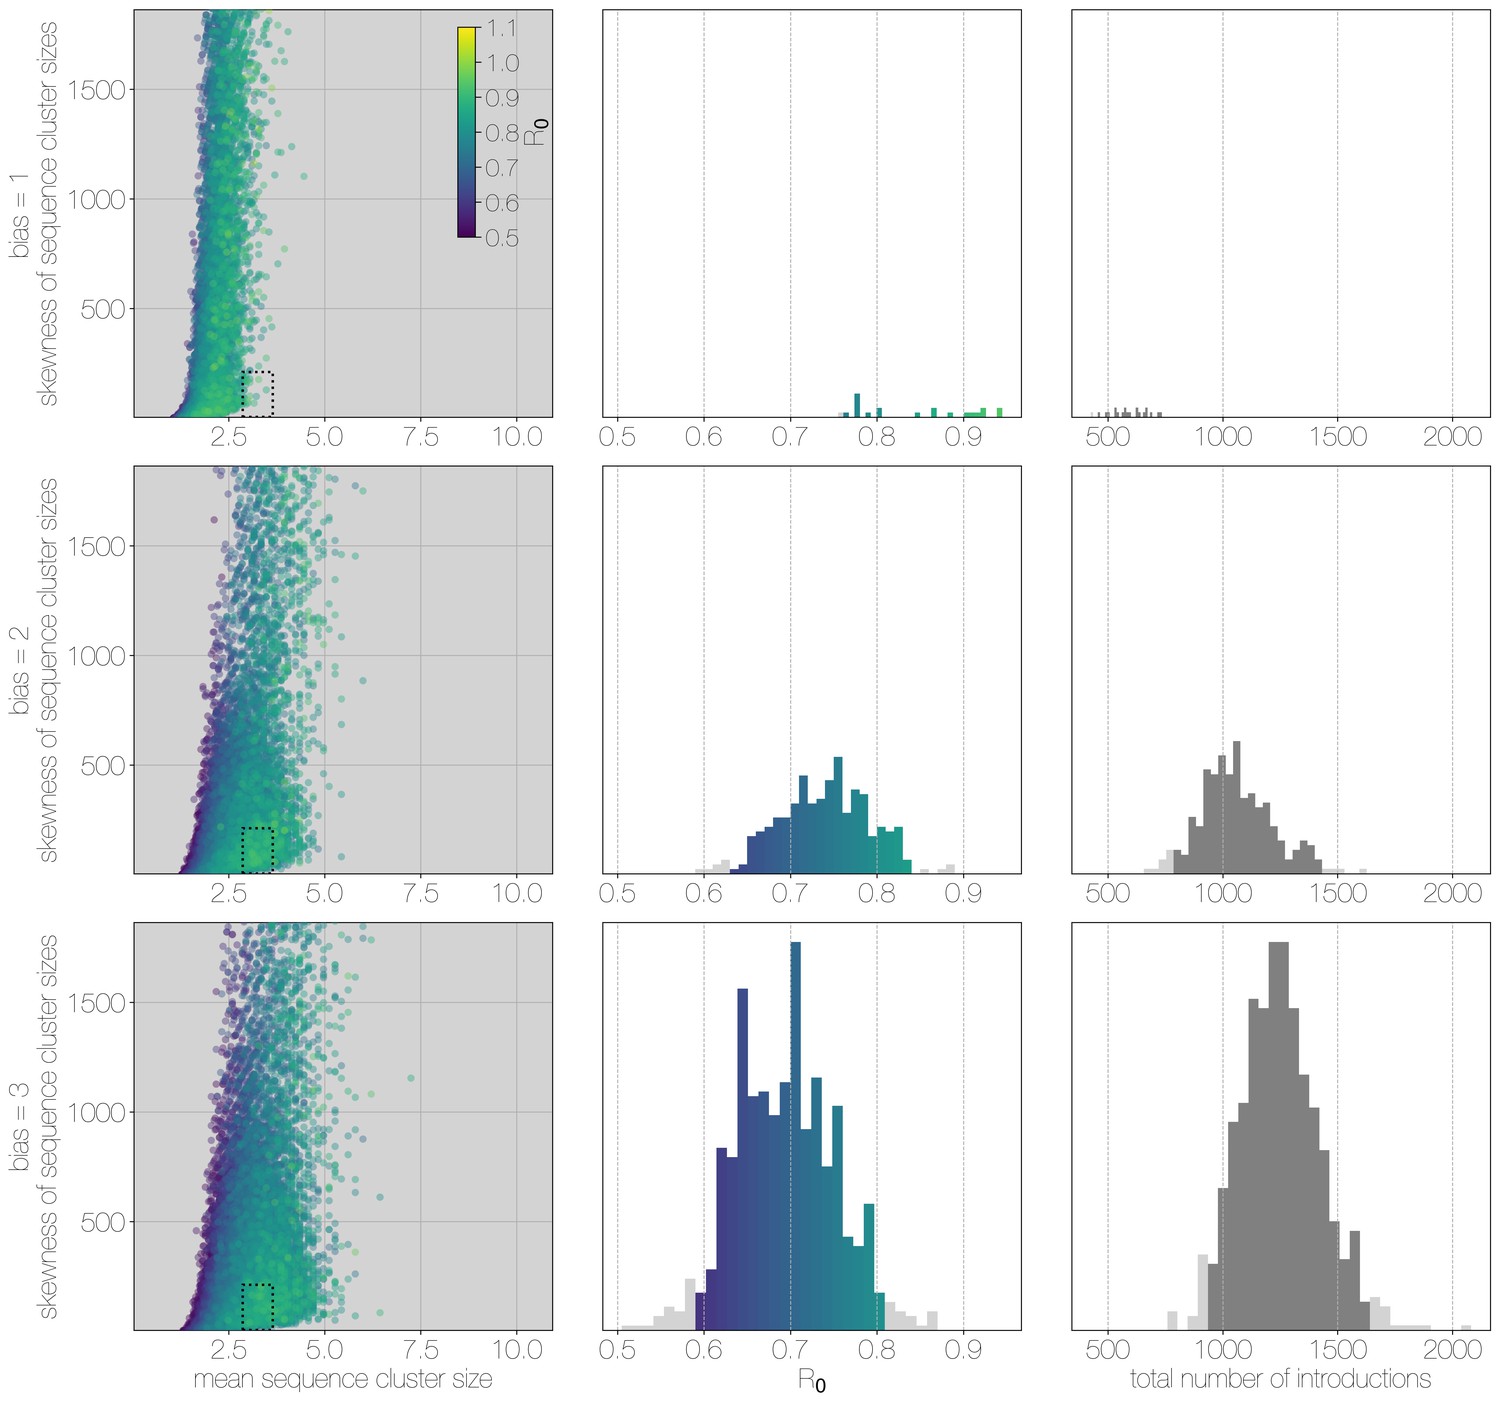
Results of Monte Carlo simulations with vast underestimation of cases.
The plot is identical to Figure 3—figure supplement 1, but instead of 2000 cases, simulations were run with 4000 cases. With more unobserved cases the R values matching observed MERS-CoV sequence clusters can only be smaller, with a corresponding increase in numbers of zoonotic transmissions. However, the numbers of simulations that match MERS-CoV data go down as well.
Figure 3—figure supplement 4
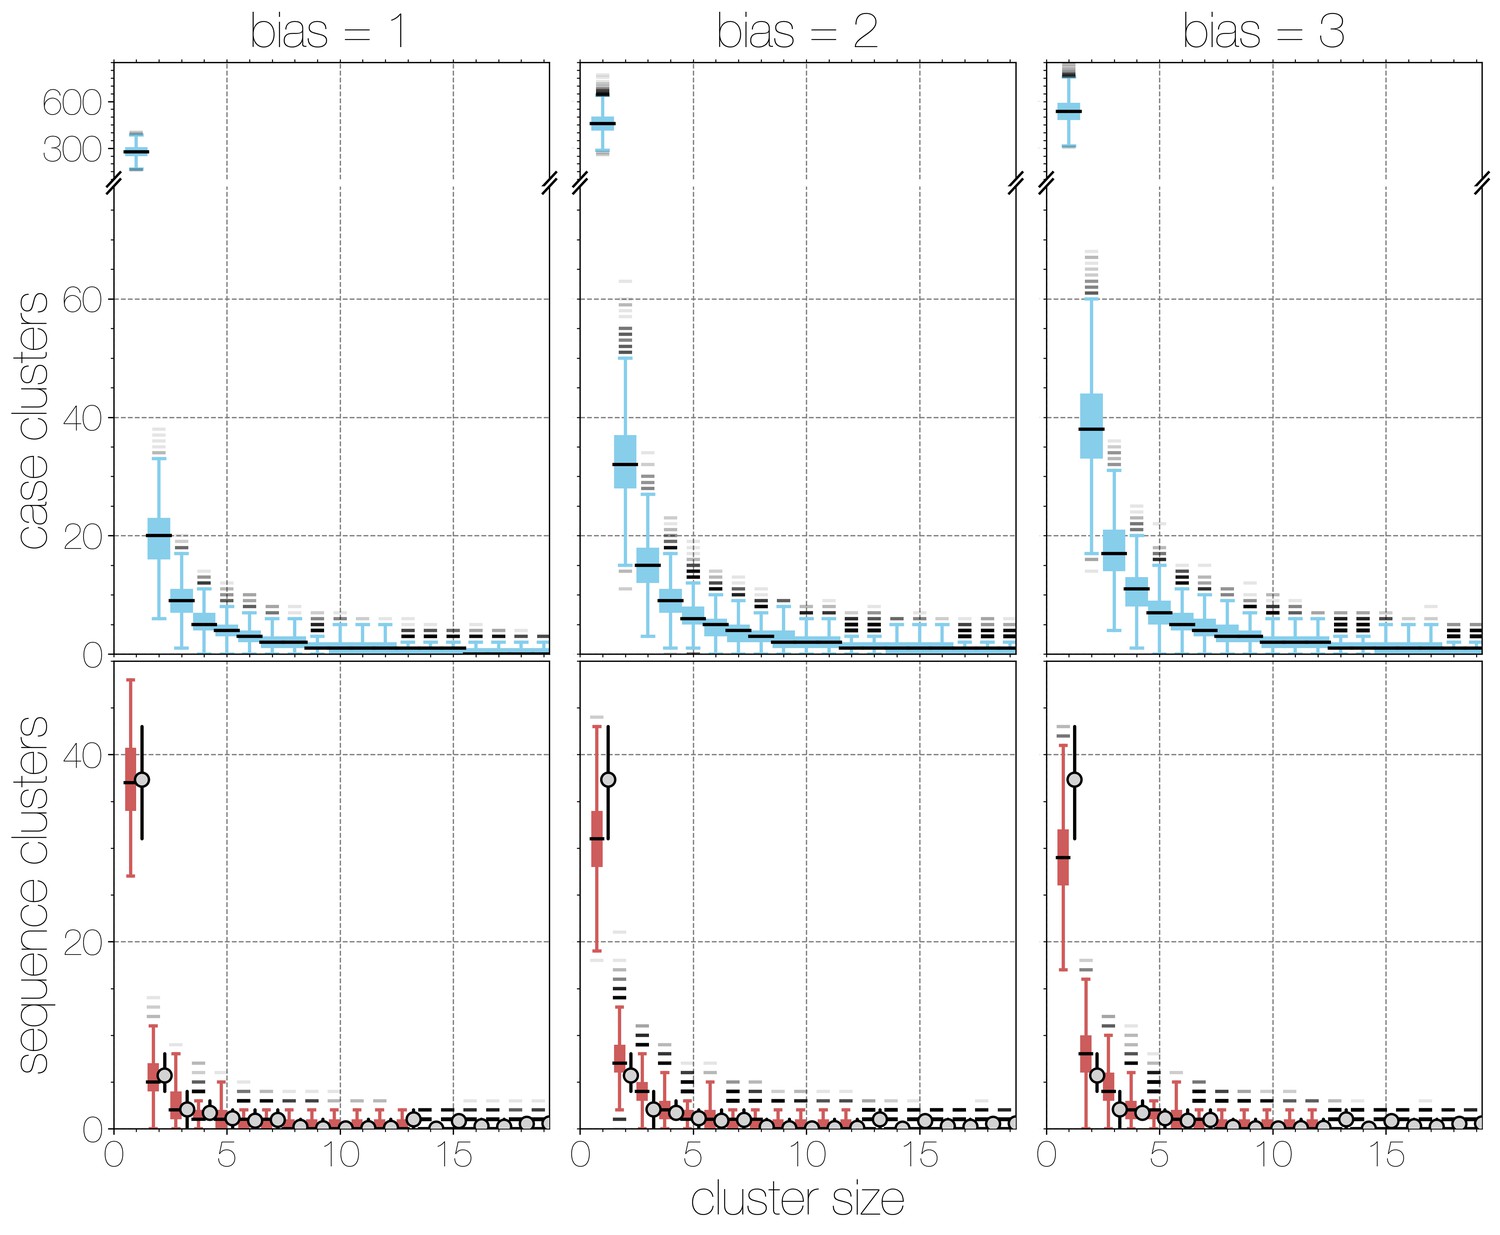
Boxplots of matching simulated case and sequence cluster distributions.
Boxplots indicate frequency of case (blue, top) and sequence (red, bottom) cluster sizes across simulations at different bias levels, marginalised across values. Outliers are shown with transparency, medians are indicated with thick black lines. Case clusters exhibit a strong skew with large numbers of singleton introductions and a substantial tail at higher levels of bias.
Figure 3—figure supplement 5
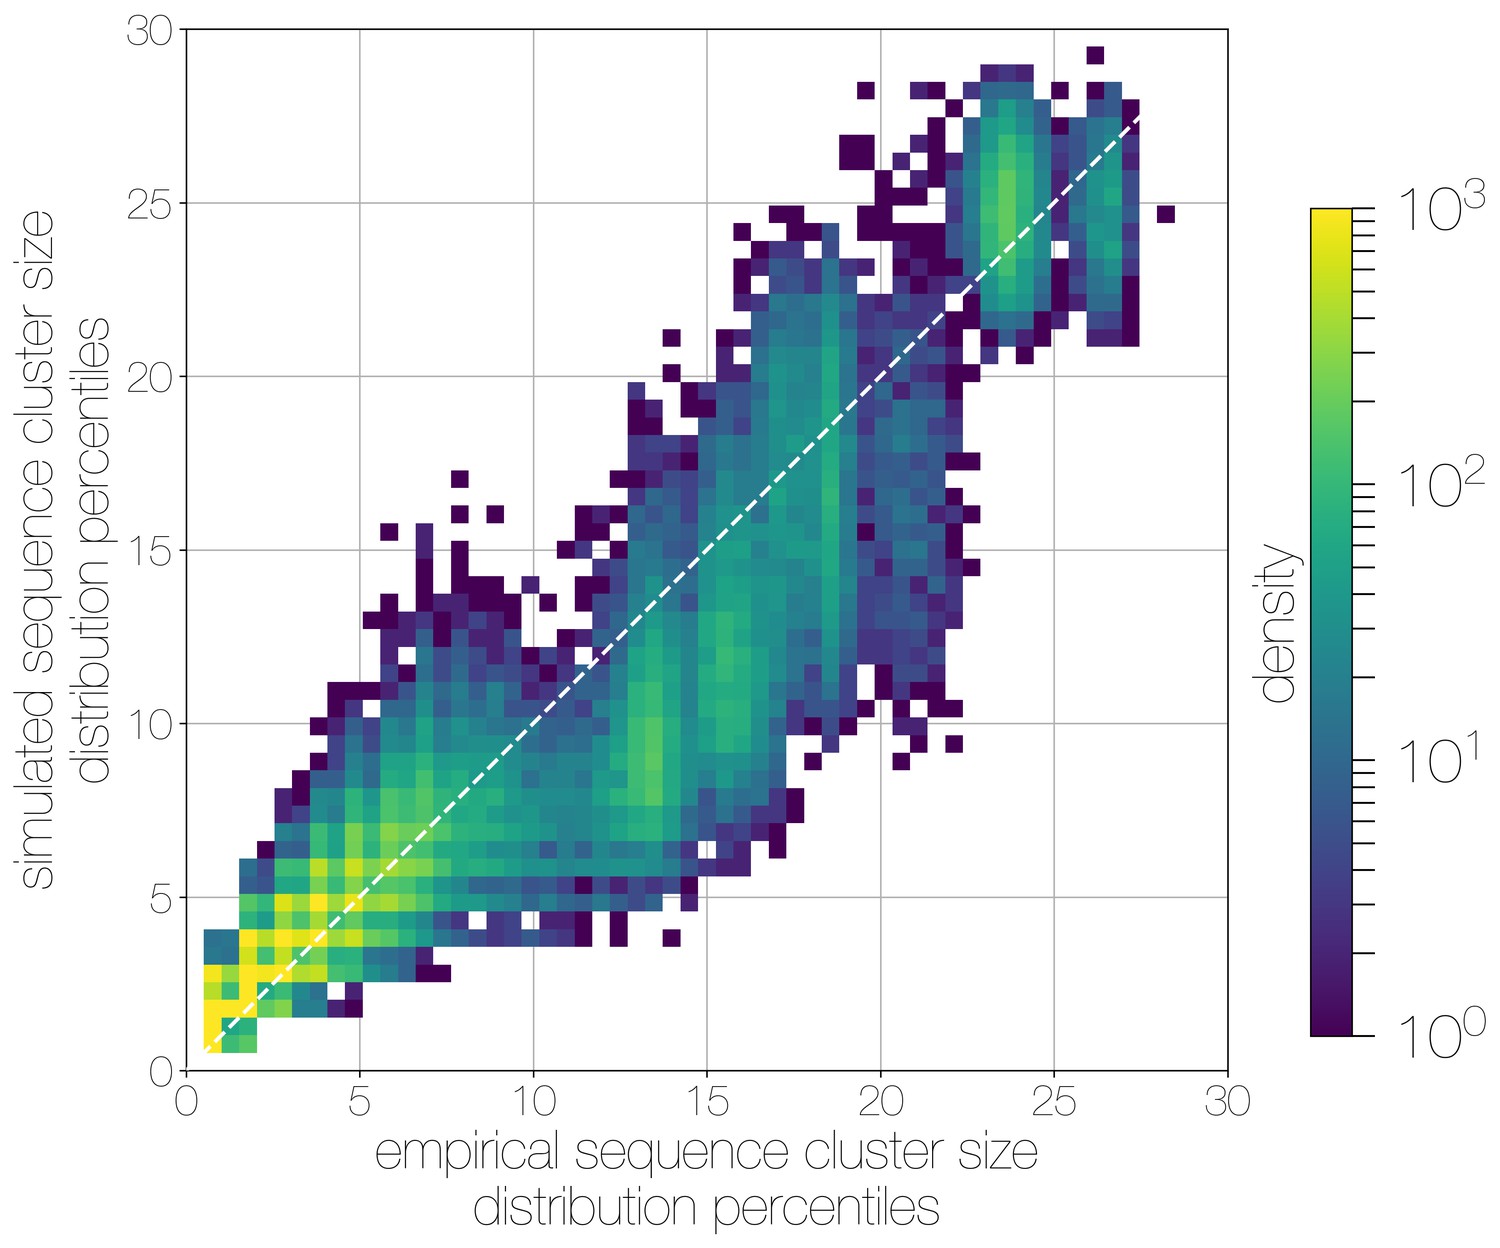
Quantile-quantile (Q-Q) plot of empirical and simulated sequence cluster sizes.
Density of sequence cluster size percentiles (1 st–99th, calculated across a grid of 50 values) calculated for random states from the posterior distribution (-axis) and matching simulations (-axis). Most values fall on the one-to-one line, with a heavier tail in mid-sized sequence clusters in empirical data, manifesting as a greater density of points below the one-to-one line in the middle.
Figure 3—figure supplement 6
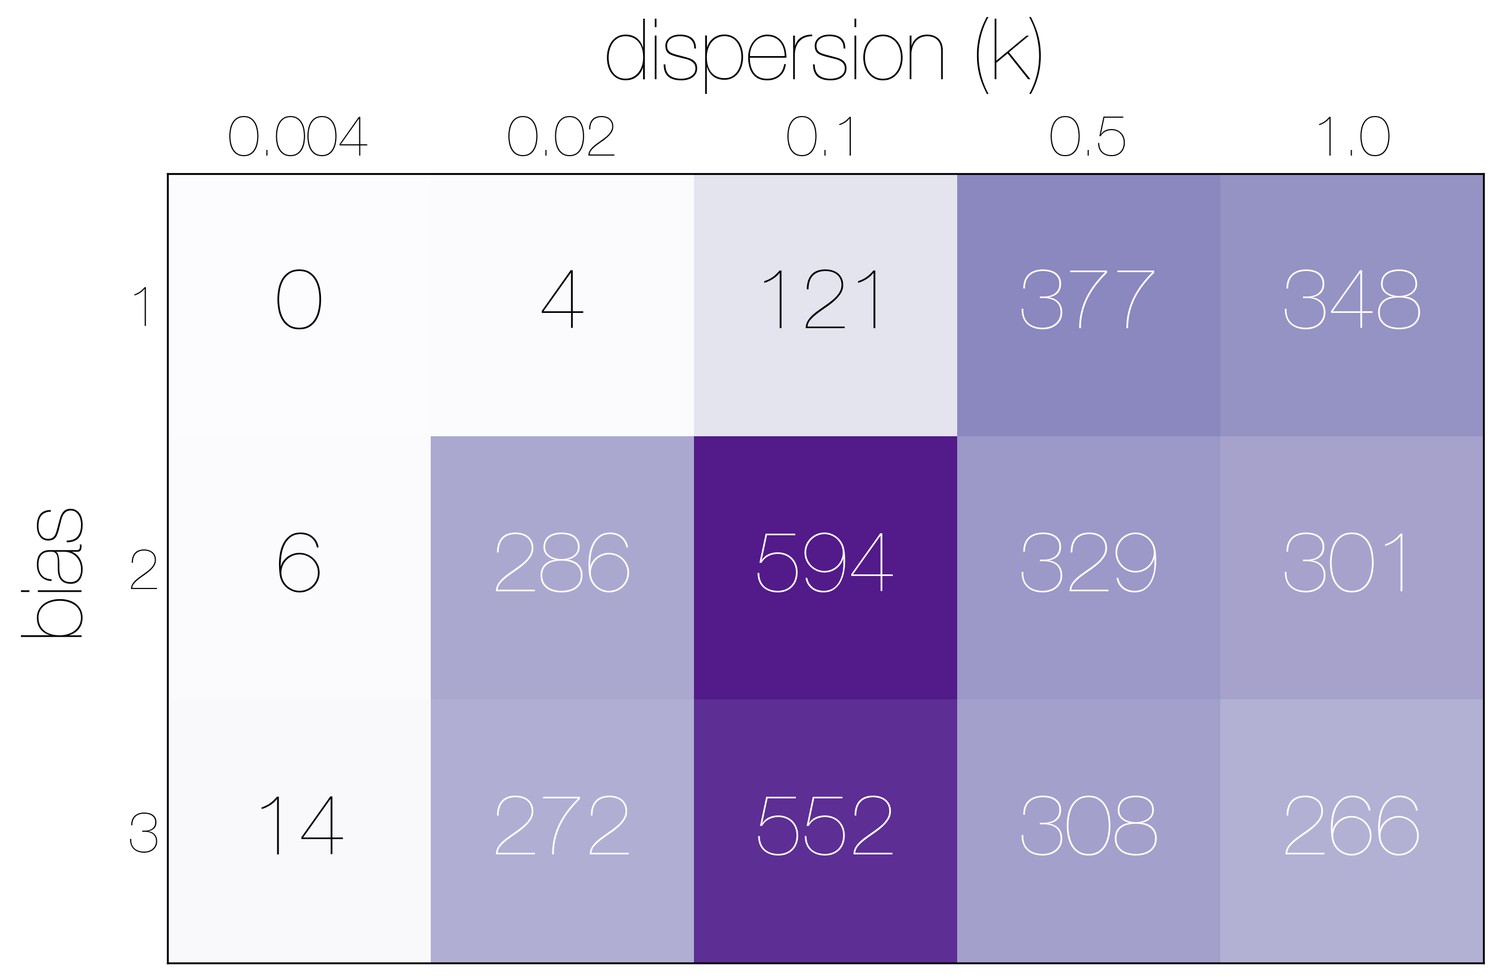
Numbers of epidemiological simulations conforming to empirical observations.
Numbers indicate the total number of epidemiological simulations under each combination of bias and dispersion parameter that result in MERS-CoV-like sequence cluster sizes. More simulations match observations with bias and .
Figure 4 with 3 supplements
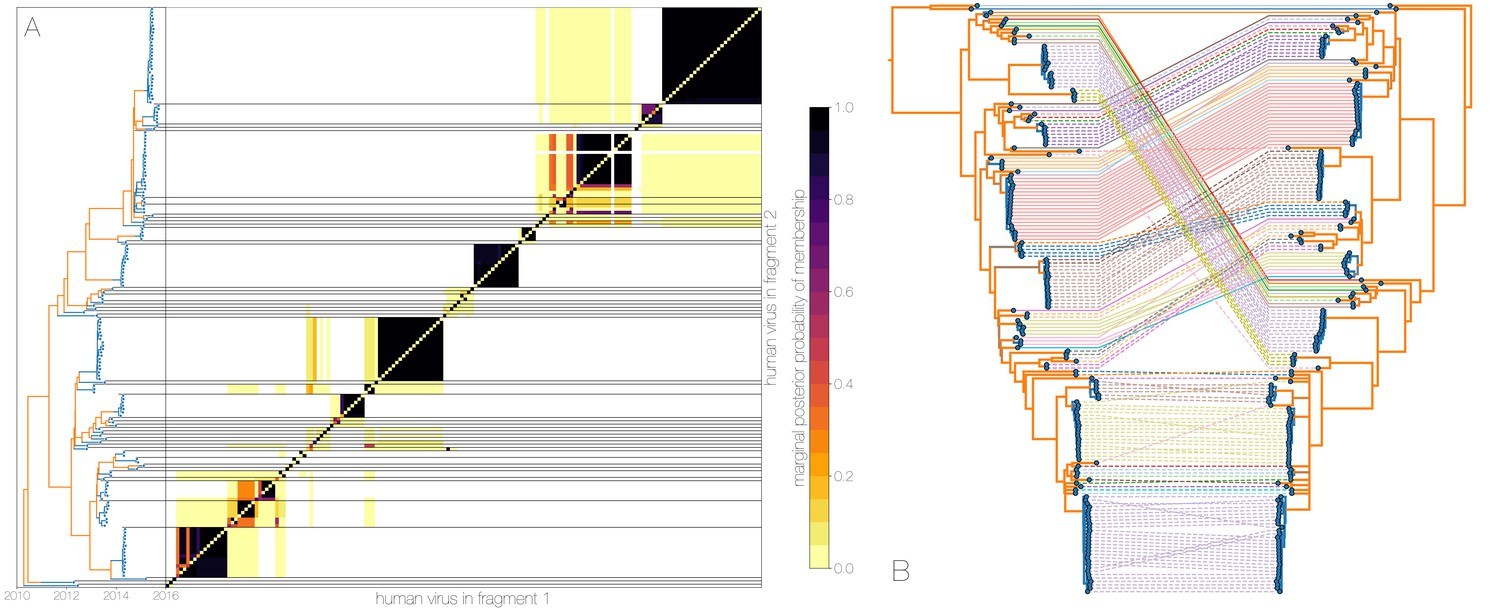
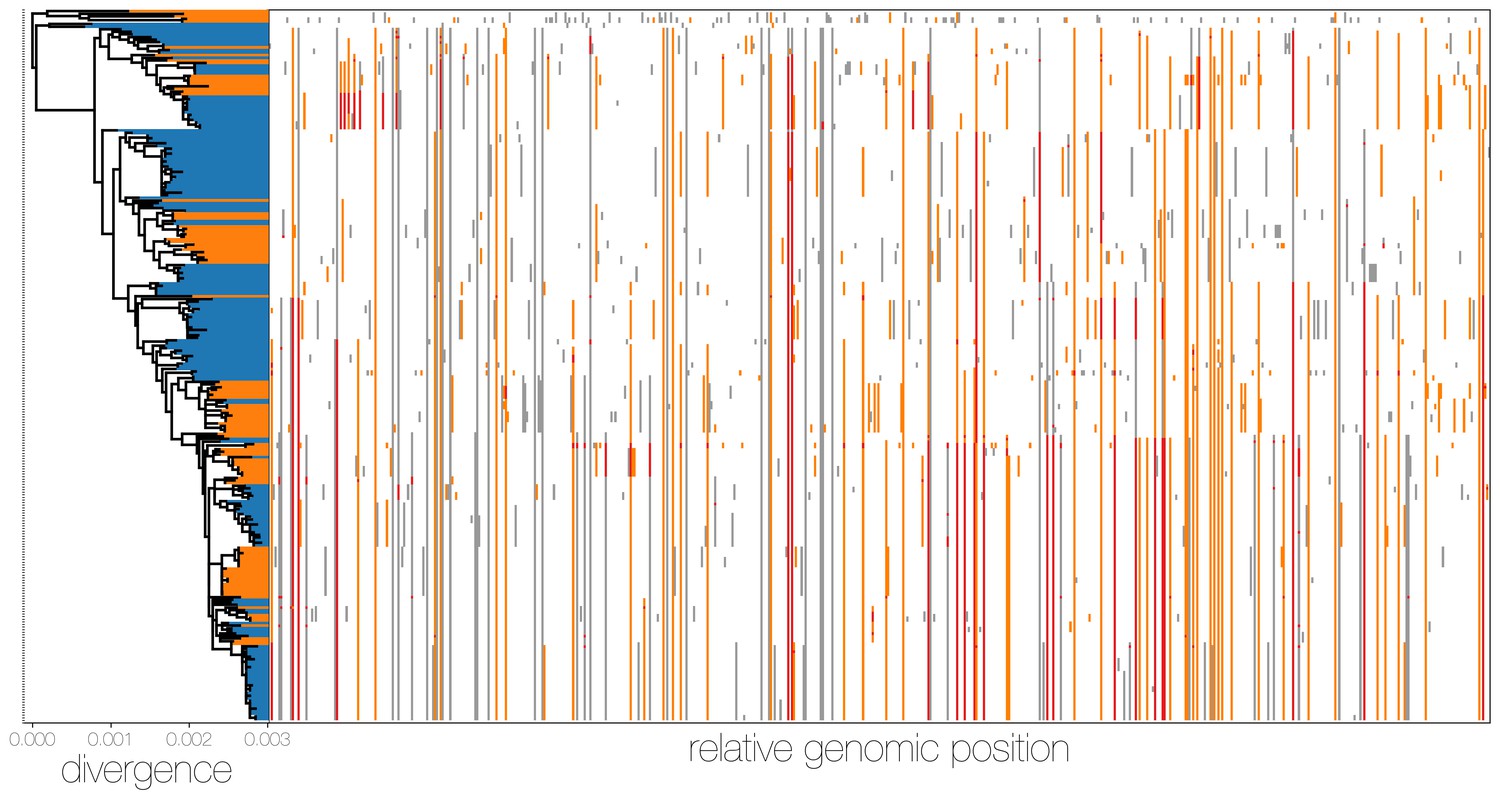
Recombinant features of MERS-CoV phylogenies.
(A) Marginal posterior probabilities of taxa collected from humans belonging to the same clade in phylogenies derived from different parts of the genome. Taxa are ordered according to phylogeny of fragment 2 (genome positions 21001 to 29364) reduced to just the human tips and is displayed on the left. Human clusters are largely well-supported as monophyletic and consistent across trees of both genomic fragments. (B) Tanglegram connecting the same taxa between a phylogeny derived from fragment 1 (left, genome positions 1 to 21000) and fragment 2 (right, genome positions 21001 to 29364), reduced to just the human tips and branches with posterior probability collapsed. Human clusters exhibit limited diversity and corresponding low levels of incongruence within an introduction cluster.
-
Figure 4—source data 1
XML to run structured coalescent analysis on bisected alignment with output files.
- https://doi.org/10.7554/eLife.31257.027
-
Figure 4—source data 2
Output from PHI and 3Seq recombination analyses.
- https://doi.org/10.7554/eLife.31257.028
-
Figure 4—source data 3
Output from ClonalFrameML analysis.
- https://doi.org/10.7554/eLife.31257.029
Figure 4—figure supplement 1
Tests of recombination across MERS-CoV clades.
Maximum clade credibility tree of MERS-CoV genomes annotated with results of two recombination detection tests (PHI and 3Seq) applied to descendent sequences of each clade. Both tests identify large portions of existing sequence data as containing signals of recombination. Note that markings do not indicate where recombinations have occurred on the tree, merely the minimum distance in sequence/time space between recombining lineages.
Figure 4—figure supplement 2
MERS-CoV genomes exhibit high numbers of non-clonal loci.
Ancestral state reconstruction (right) identifies a large number of sites in which mutations have occurred more than once in the tree (homoplasies, orange) or are reversions (red) from a state arising in an ancestor. Mutations that apparently only occur once in the tree (synapomorphies) are shown in grey. The maximum likelihood phylogeny on the left is coloured by whether sequences were sampled in humans (blue) or camels (orange).
Figure 4—figure supplement 3
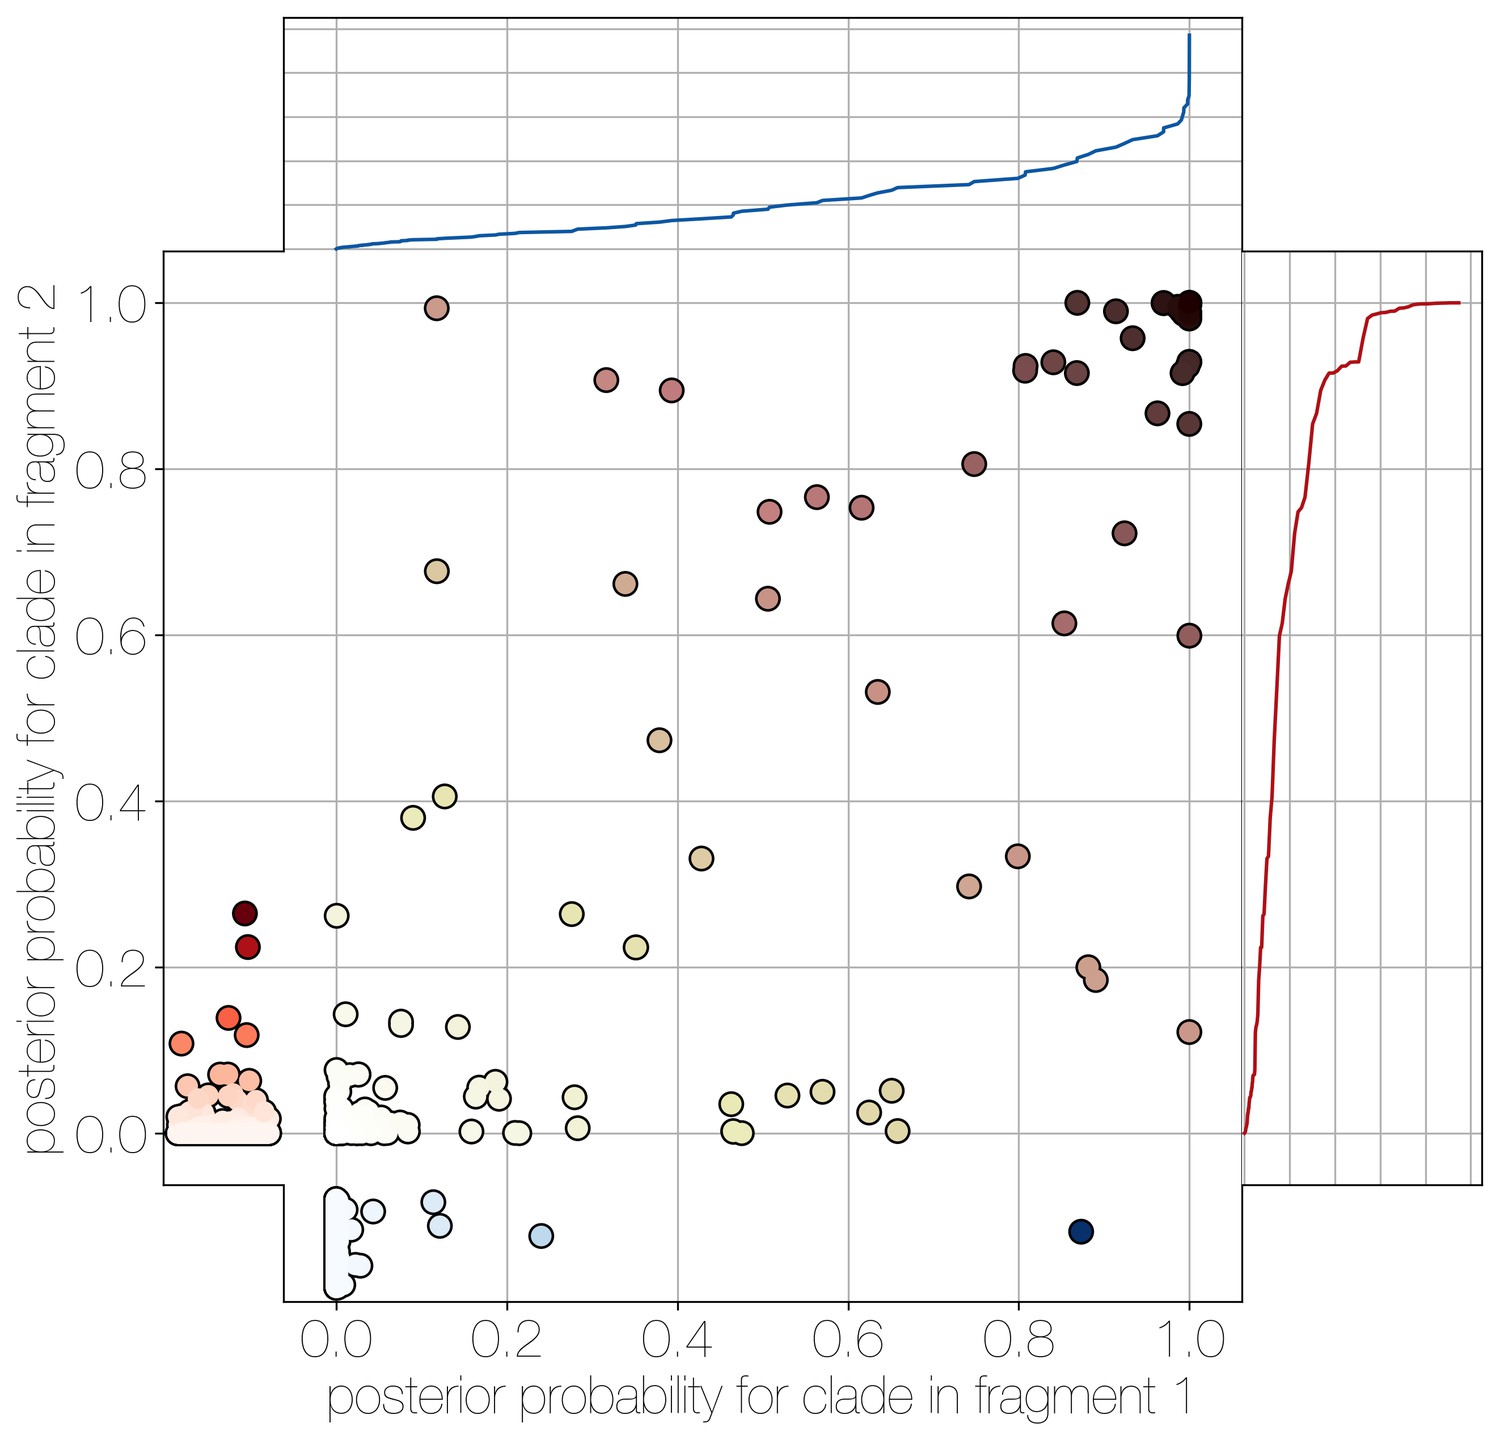
Human clade sharing between genomic fragments 1 and 2.
Central scatter plot shows the posterior probability of human clades shared between genomic fragments 1 and 2, in their respective trees. Left and bottom scatter plots track the posterior probability of human clades only observed in fragment 2 (left) or fragment 1 (bottom). The cumulative probability of human clades present in either tree are tracked by plots on the right (fragment 2) and top (fragment 1). Most of the probability mass is concentrated within human clades that are present in trees of both genomic fragment 1 and 2 (0.9701 and 0.9474 of all human clades across posteriors, respectively).
Figure 5 with 1 supplement
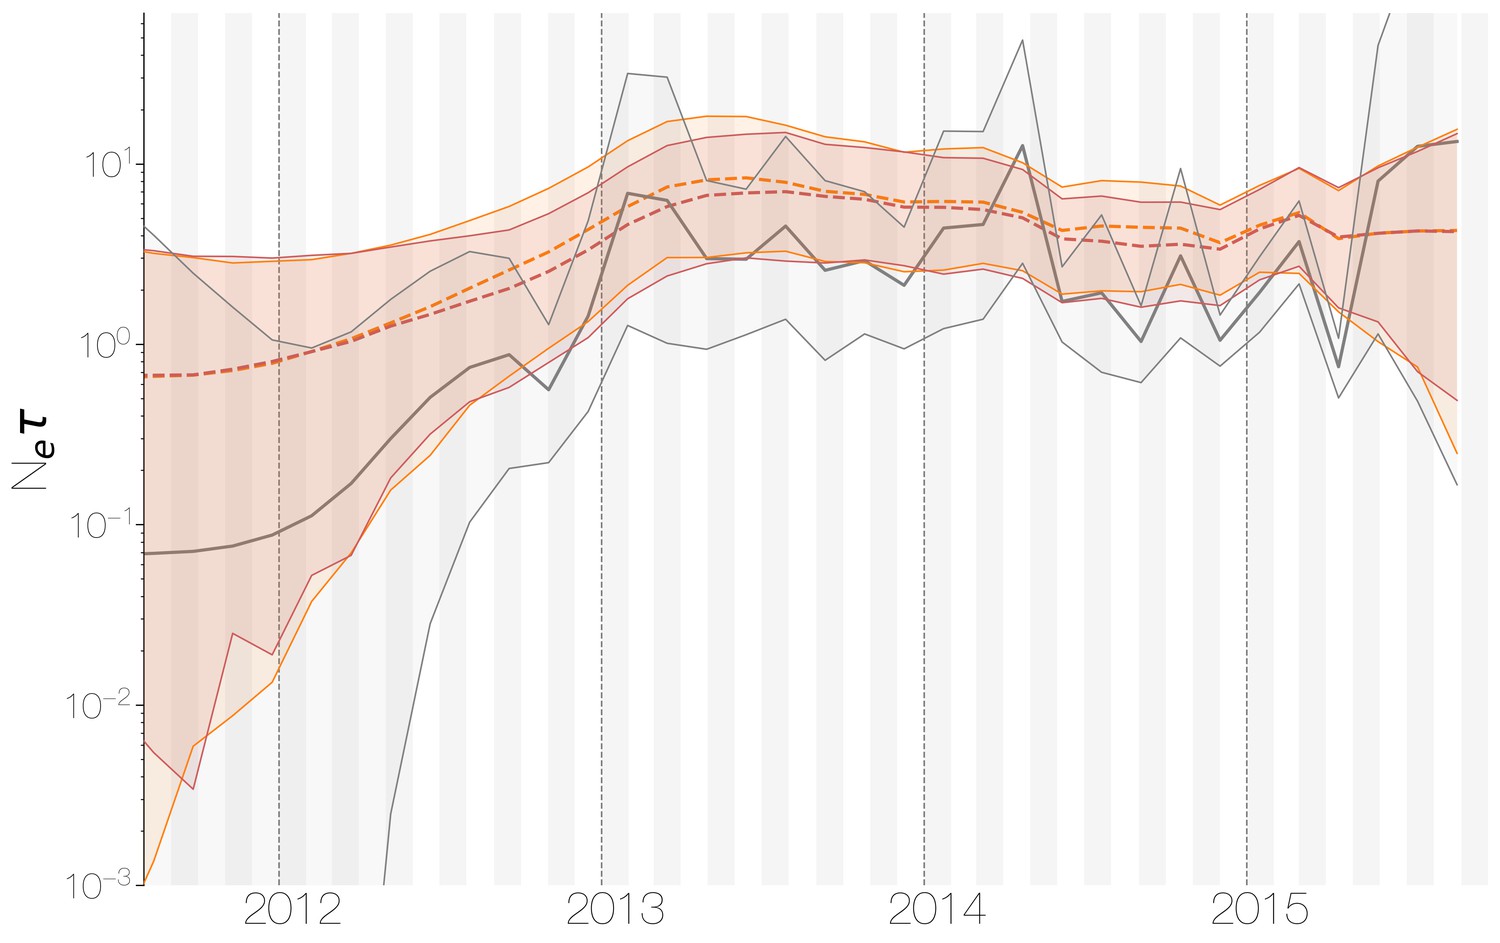
Demographic history of MERS-CoV in Arabian peninsula camels.
Demographic history of MERS-CoV in camels, as inferred via a skygrid coalescent tree prior (Gill et al., 2013). Three skygrid reconstructions are shown, red and orange for each of the stationary distributions reached by MCMC with the whole genome and a black one where the genome was split into ten partitions. Shaded interval indicates the 95% highest posterior density interval for the product of generation time and effective population size, . Midline tracks the inferred median of .
-
Figure 5—source data 1
XML to run skygrid analysis on camel-like sequence data and output files.
- https://doi.org/10.7554/eLife.31257.032
Figure 5—figure supplement 1
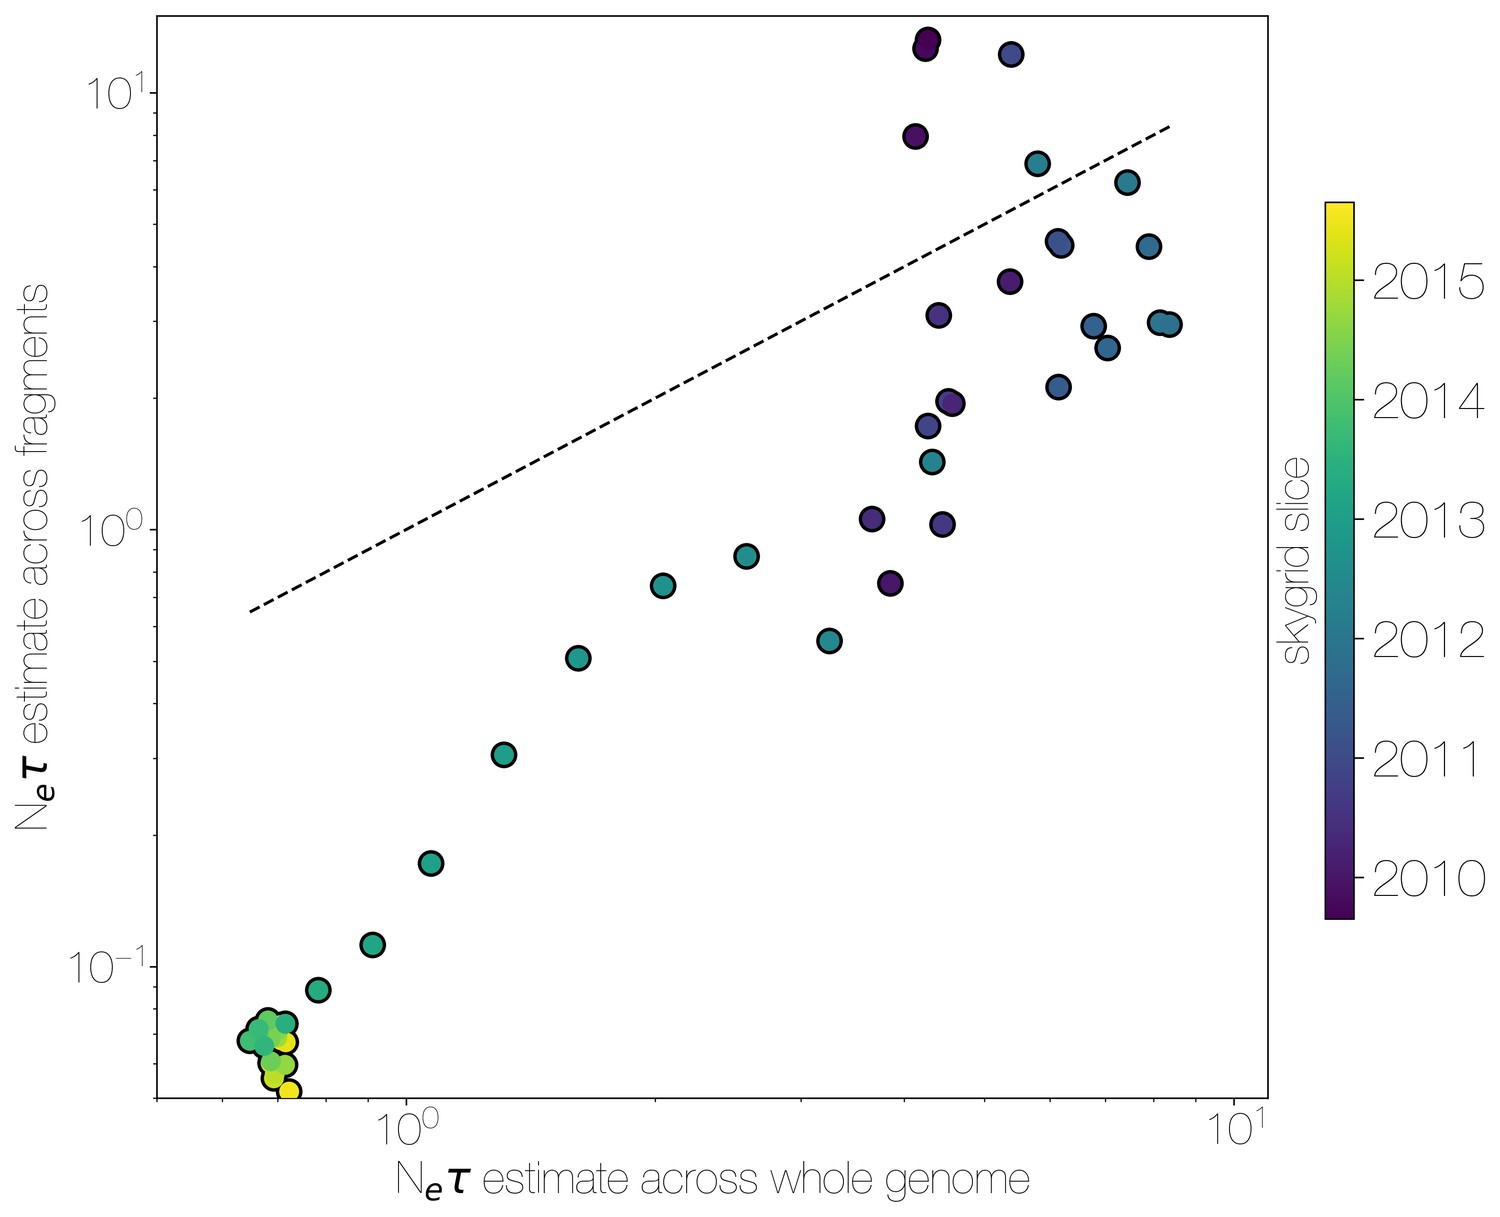
Skygrid comparison between whole and fragmented genomes.
Inferred median recovered using a skygrid tree prior on whole genome (bottom) and ten genomic fragments with independent trees (left), coloured by time. Dotted line indicates the one-to-one line.
Additional files
-
Source data 1
MERS-CoV sequences used in the study.
- https://doi.org/10.7554/eLife.31257.033
-
Supplementary file 1
Strain names, accessions (where available), identified host and reported collection dates for MERS-CoV genomes used in this study.
- https://doi.org/10.7554/eLife.31257.034
-
Transparent reporting form
- https://doi.org/10.7554/eLife.31257.035
Download links
A two-part list of links to download the article, or parts of the article, in various formats.
Downloads (link to download the article as PDF)
Open citations (links to open the citations from this article in various online reference manager services)
Cite this article (links to download the citations from this article in formats compatible with various reference manager tools)
MERS-CoV spillover at the camel-human interface
eLife 7:e31257.
https://doi.org/10.7554/eLife.31257


