Molecular determinants of permeation in a fluoride-specific ion channel
- Howard Hughes Medical Institute, Brandeis University, United States
Figures
Figure 1 with 1 supplement
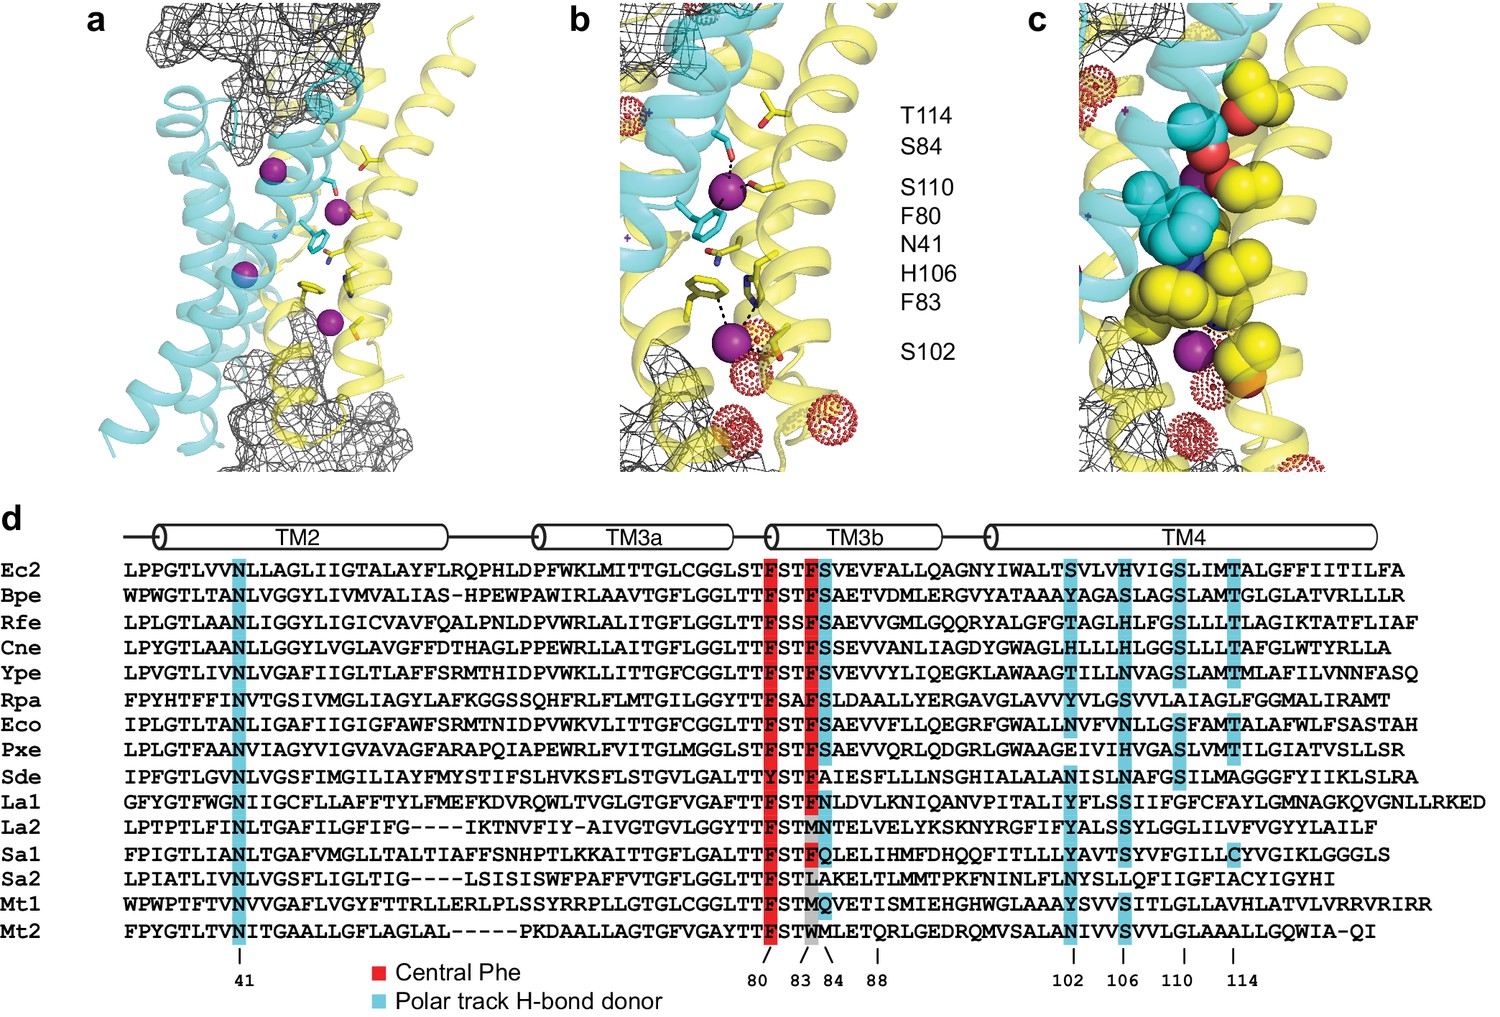
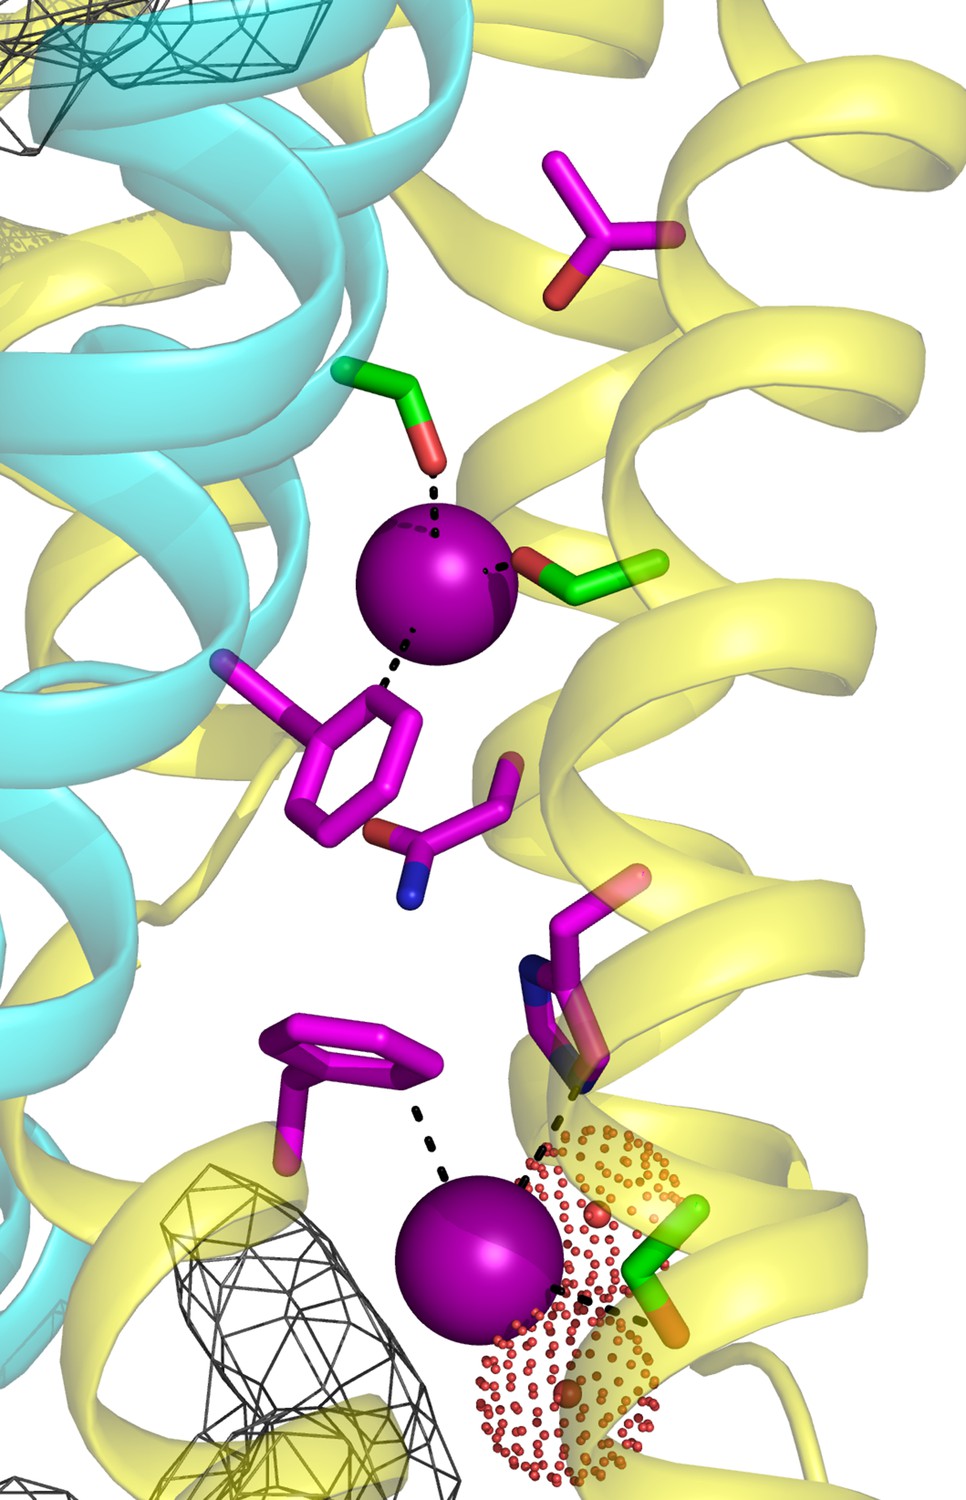
Fluc-Ec2 channel structure.
(a) Crystal structure of Ec2-S9 complex (PDB #5A43, re-refined) showing double-pore assembly, with F- ions in purple and subunits in cyan and yellow. Grey mesh marks surfaces of the bound S9 monobodies delineating the channel's aqueous vestibules. (b) Blow-up of an individual pore region, with coordinating Phe and polar track side chains indicated and colored according to the subunit from which they project. Crystallographic waters are shown as dotted spheres. (c) Space-fill representation of same region. (d) Bacterial Fluc sequence alignment spanning polar track residues (TM2-TM4), with color code indicated. Top two sequences (Ec2, Bpe) refer to structurally known homodimeric homologues. Known or surmised heterodimers are shown in six lower sequences (La1/2, Sa1/2, Mt1/2). Other sequences are taken arbitrarily from Swissprot for illustration.
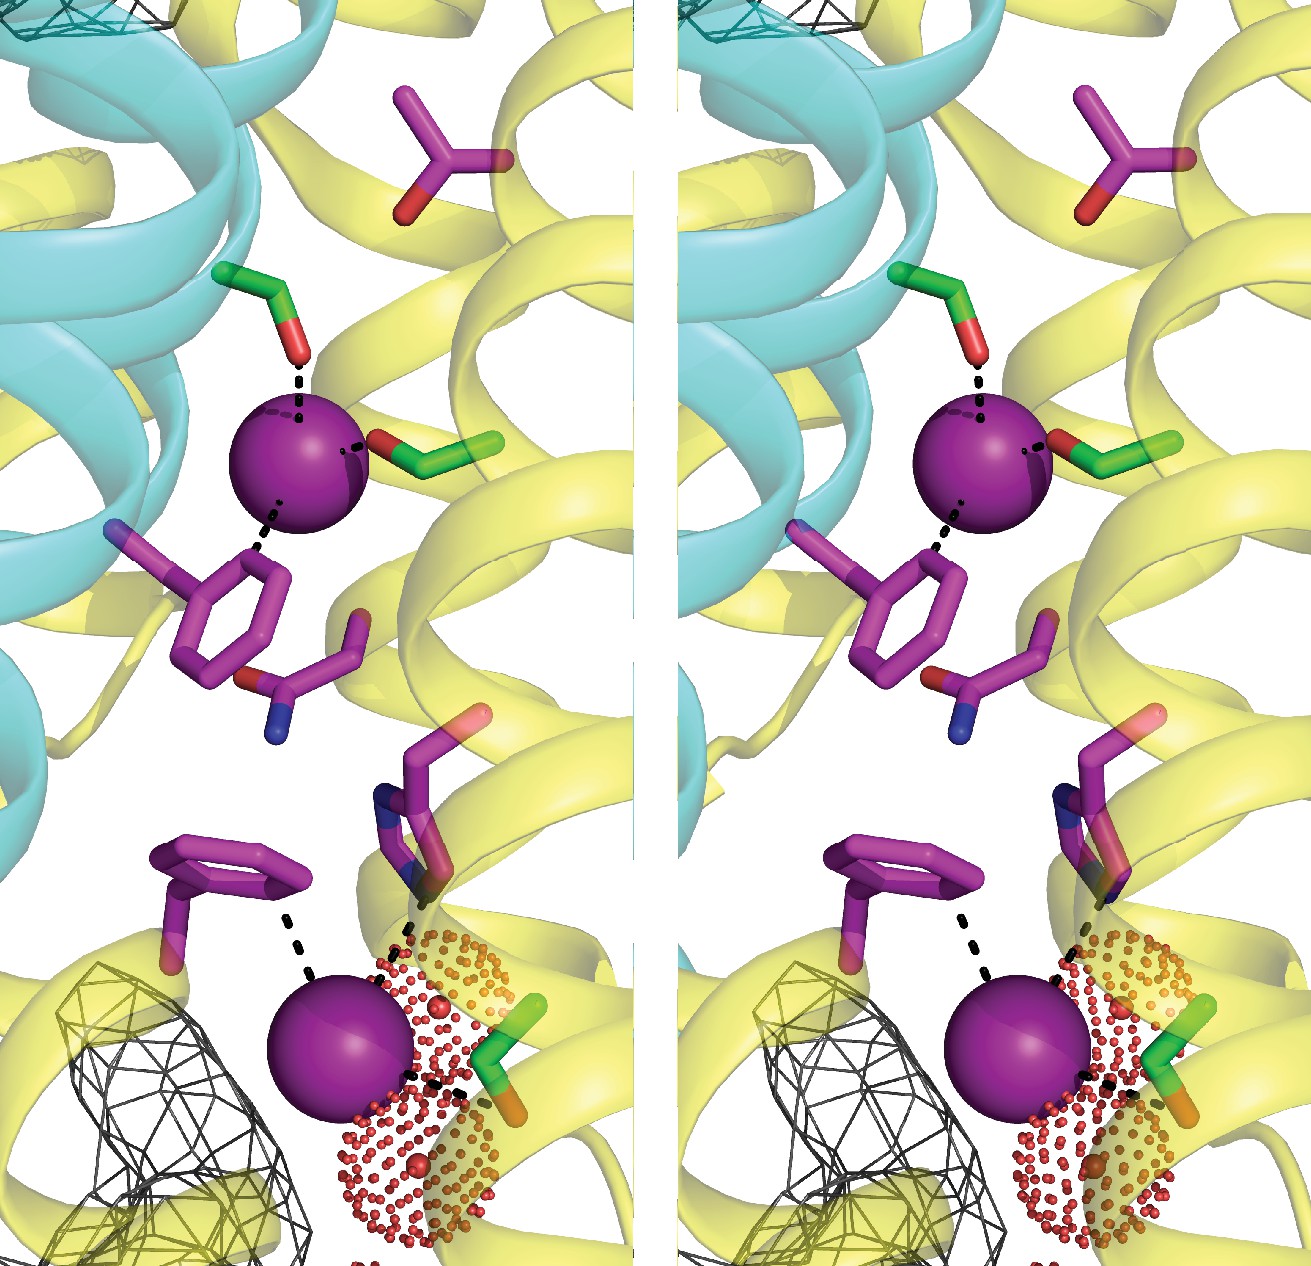
Figure 1—figure supplement 1
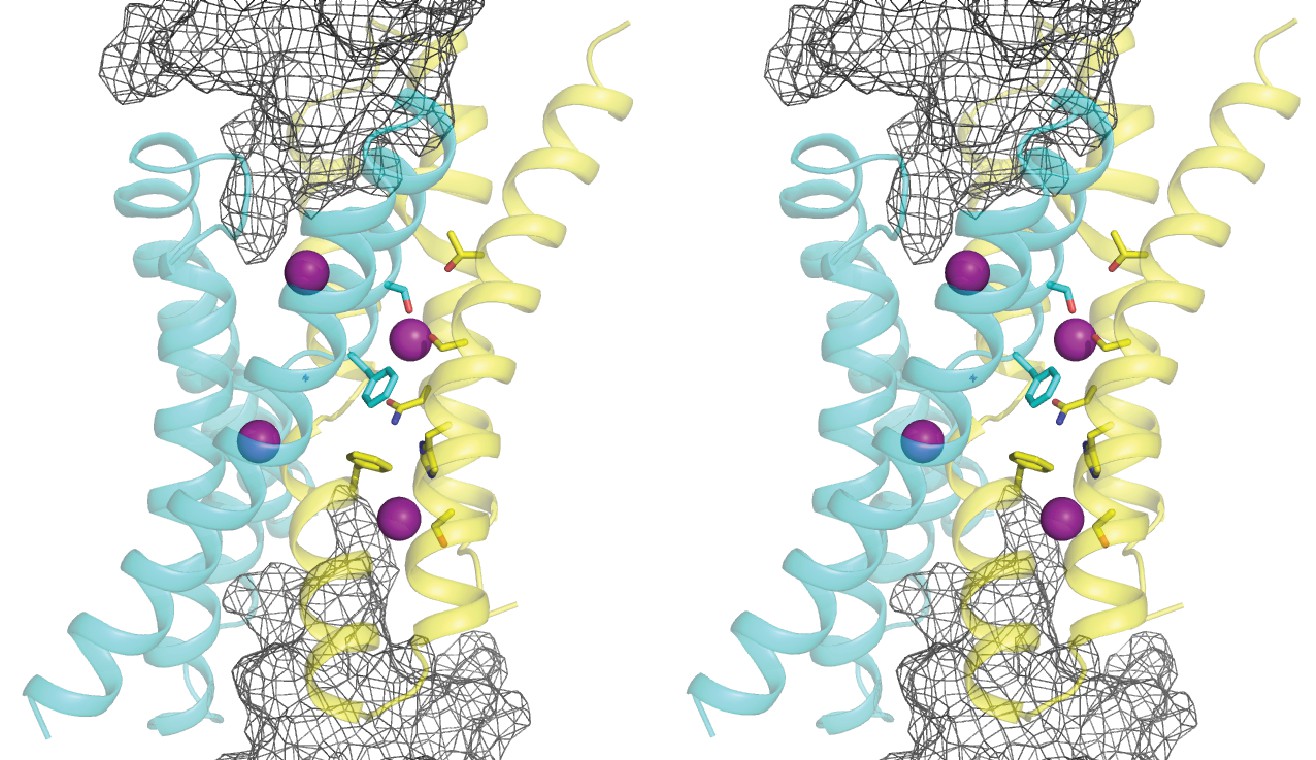
Stereo (wall-eye) view of Figure 1a.
https://doi.org/10.7554/eLife.31259.003
Figure 2 with 2 supplements
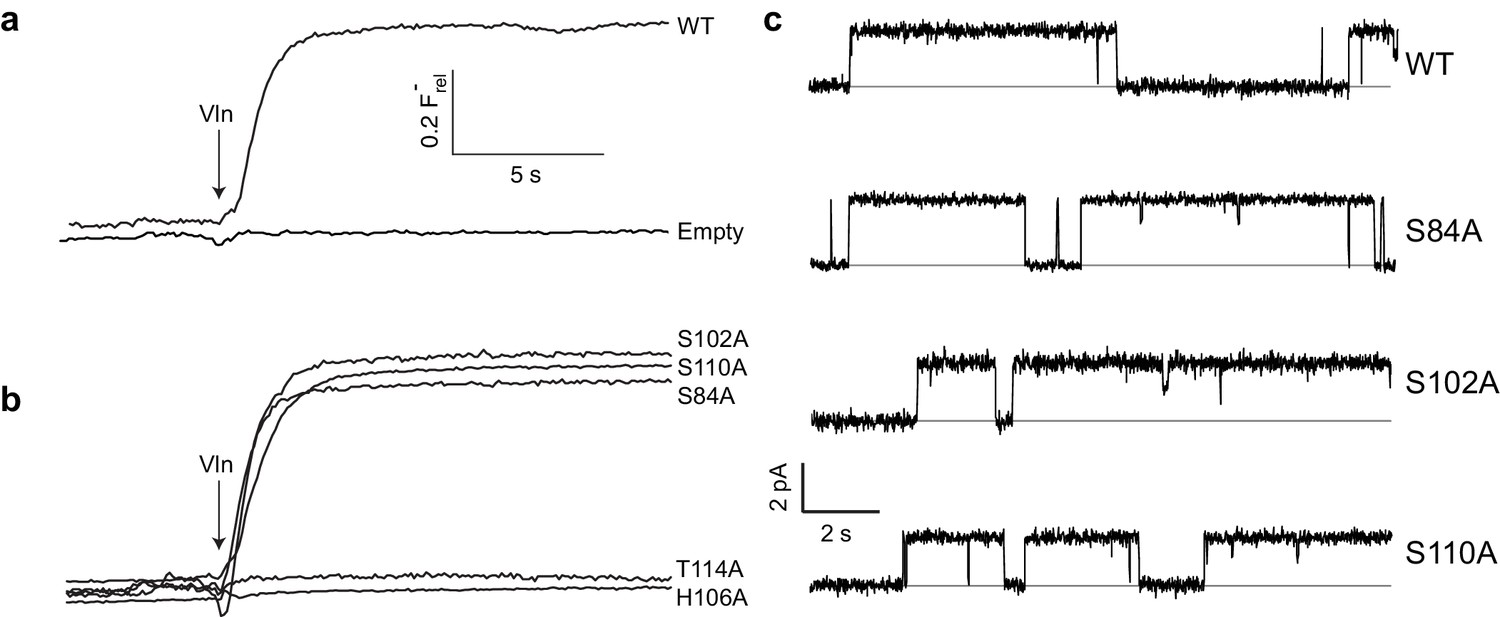
Effect of polar track mutation on Fluc function.
(a) WT fluoride flux, limited by the response time of the measurement. (b) Polar track Ala mutations. (c) Single channel records of active polar track mutants in the presence of reversible blockers (monobodies) that completely inhibit flux and allow measurement of the zero-current level (gray line).
Figure 2—figure supplement 1

F- efflux recordings of N41 and H106 mutants.
https://doi.org/10.7554/eLife.31259.005
Figure 2—figure supplement 2
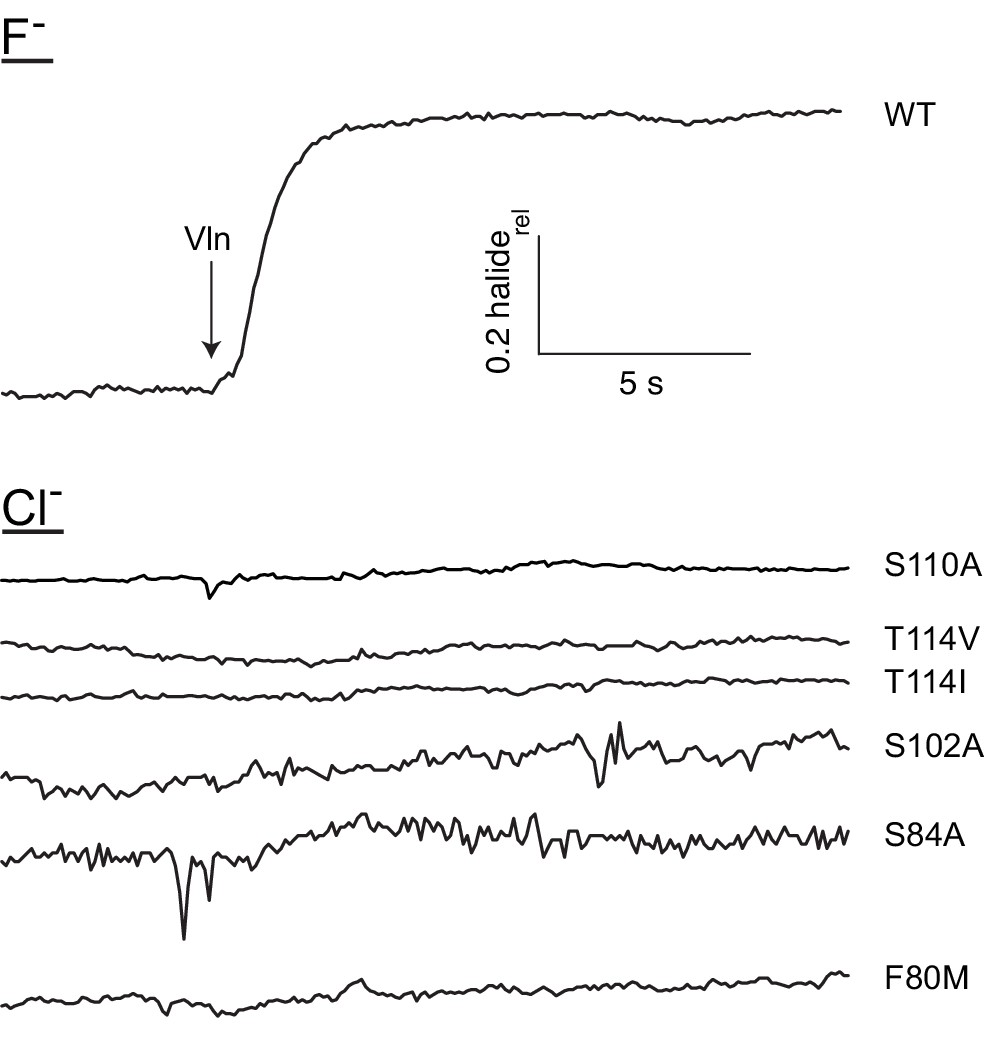
Mutants retain impermeability to Cl-.
Illustrative Cl- efflux traces of indicated F- permeable mutants, with WT F- efflux shown for comparison.
Figure 3 with 4 supplements
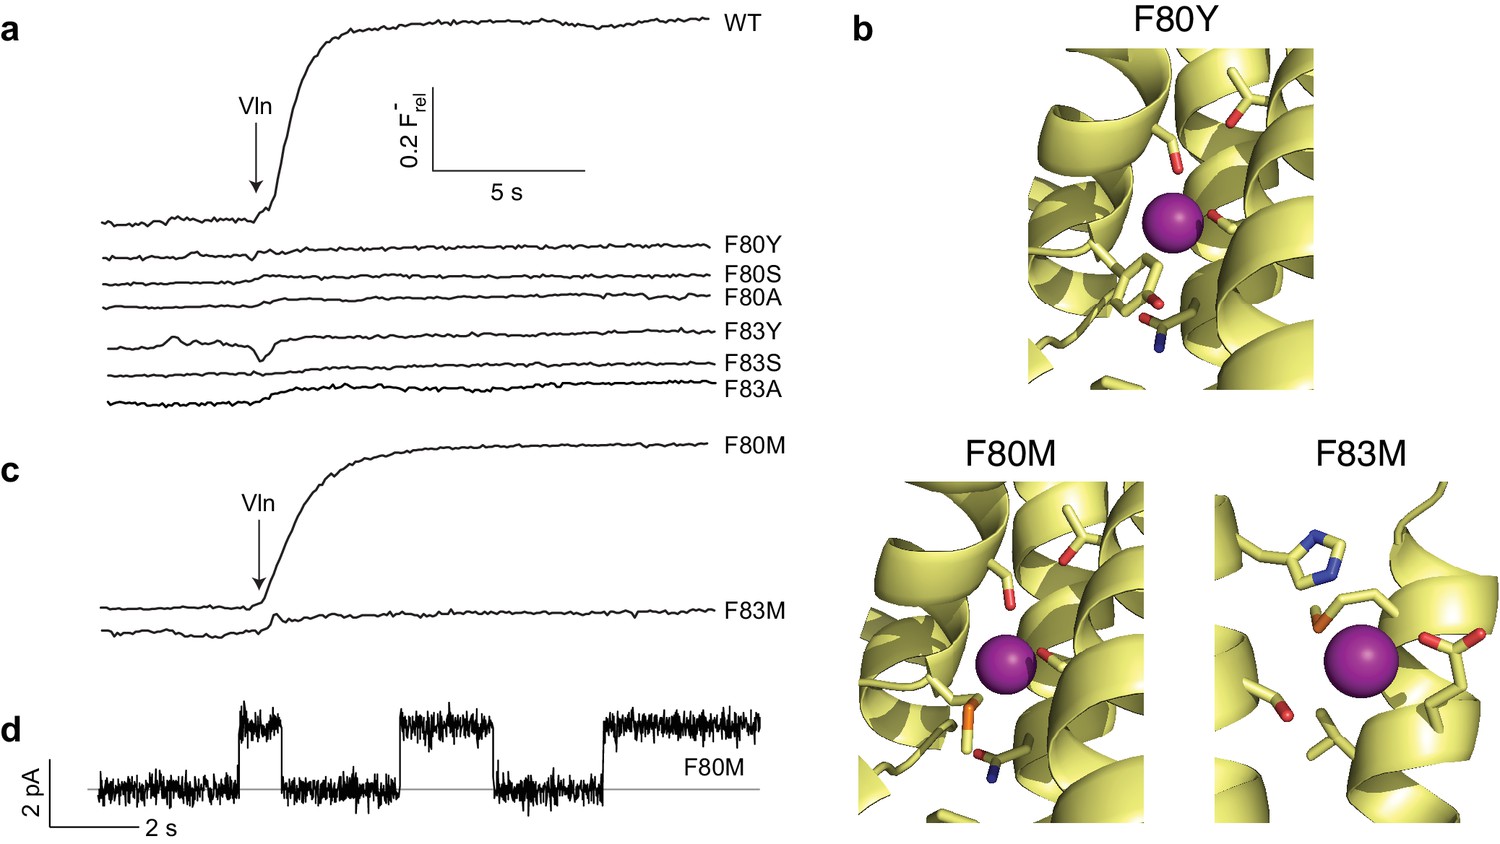
Mutagenesis of central Phe residues.
(a) F- efflux traces of indicated mutants. (b) Structures of Phe mutants in F--coordination region. (c) F- efflux traces of Met substitutions at central Phe residues. (d) Single-channel recording of F80M.
Figure 3—figure supplement 1

F- efflux recordings of central Phe mutants.
https://doi.org/10.7554/eLife.31259.009
Figure 3—figure supplement 2
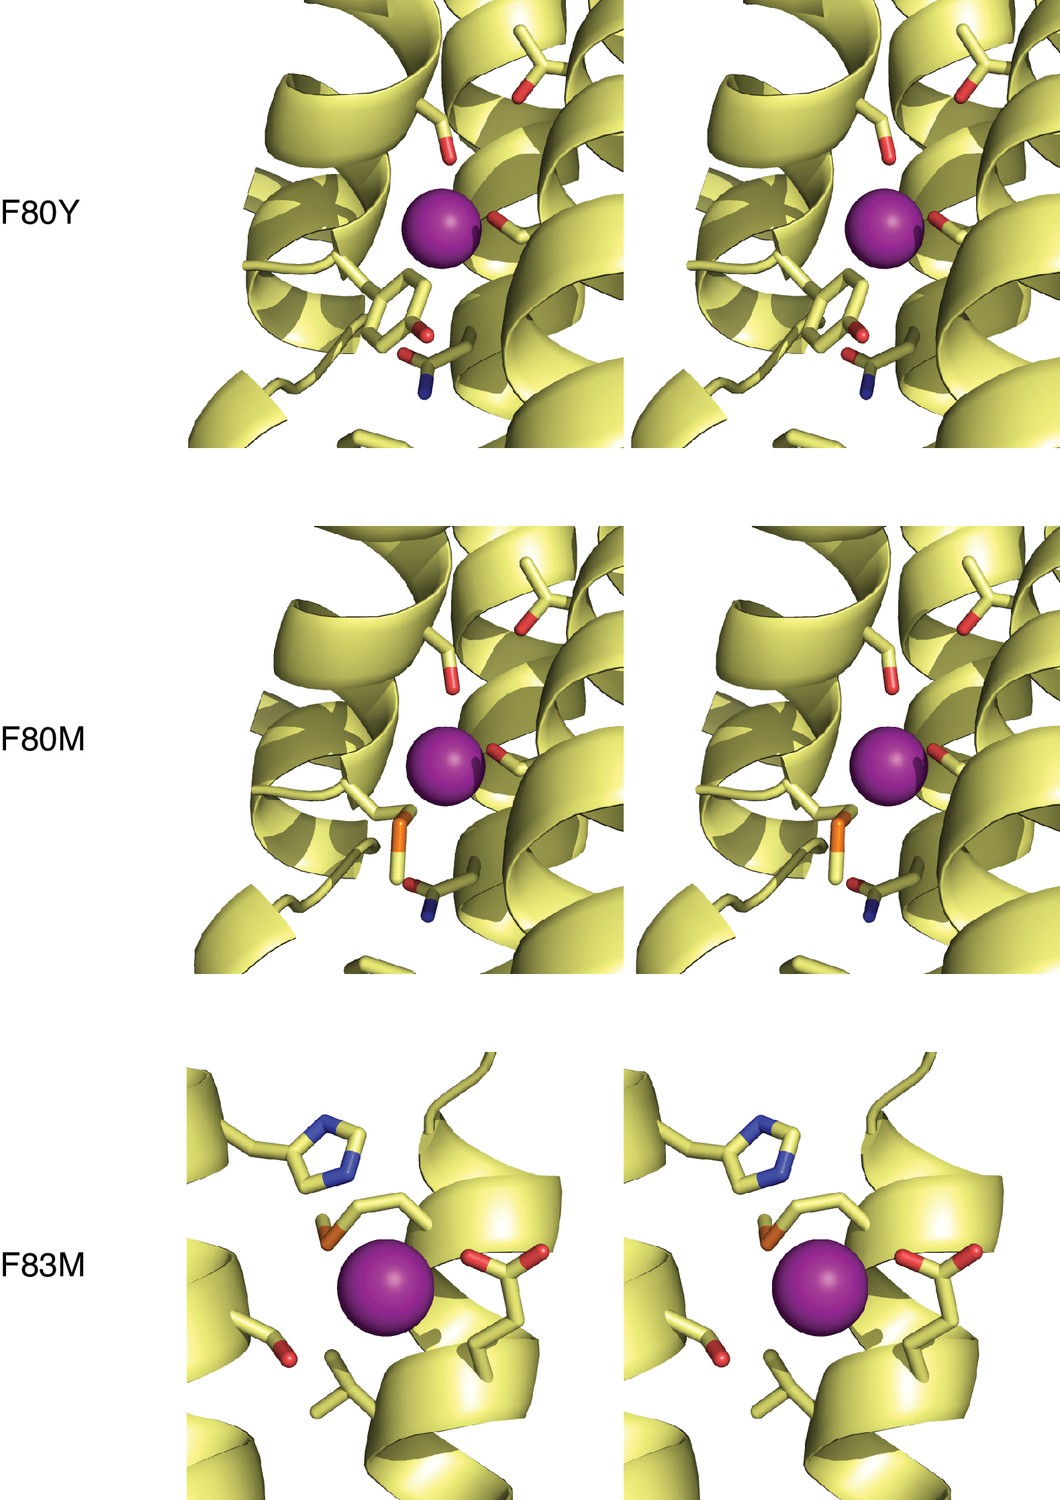
Stereo views of Figure 3b.
https://doi.org/10.7554/eLife.31259.010
Figure 3—figure supplement 3
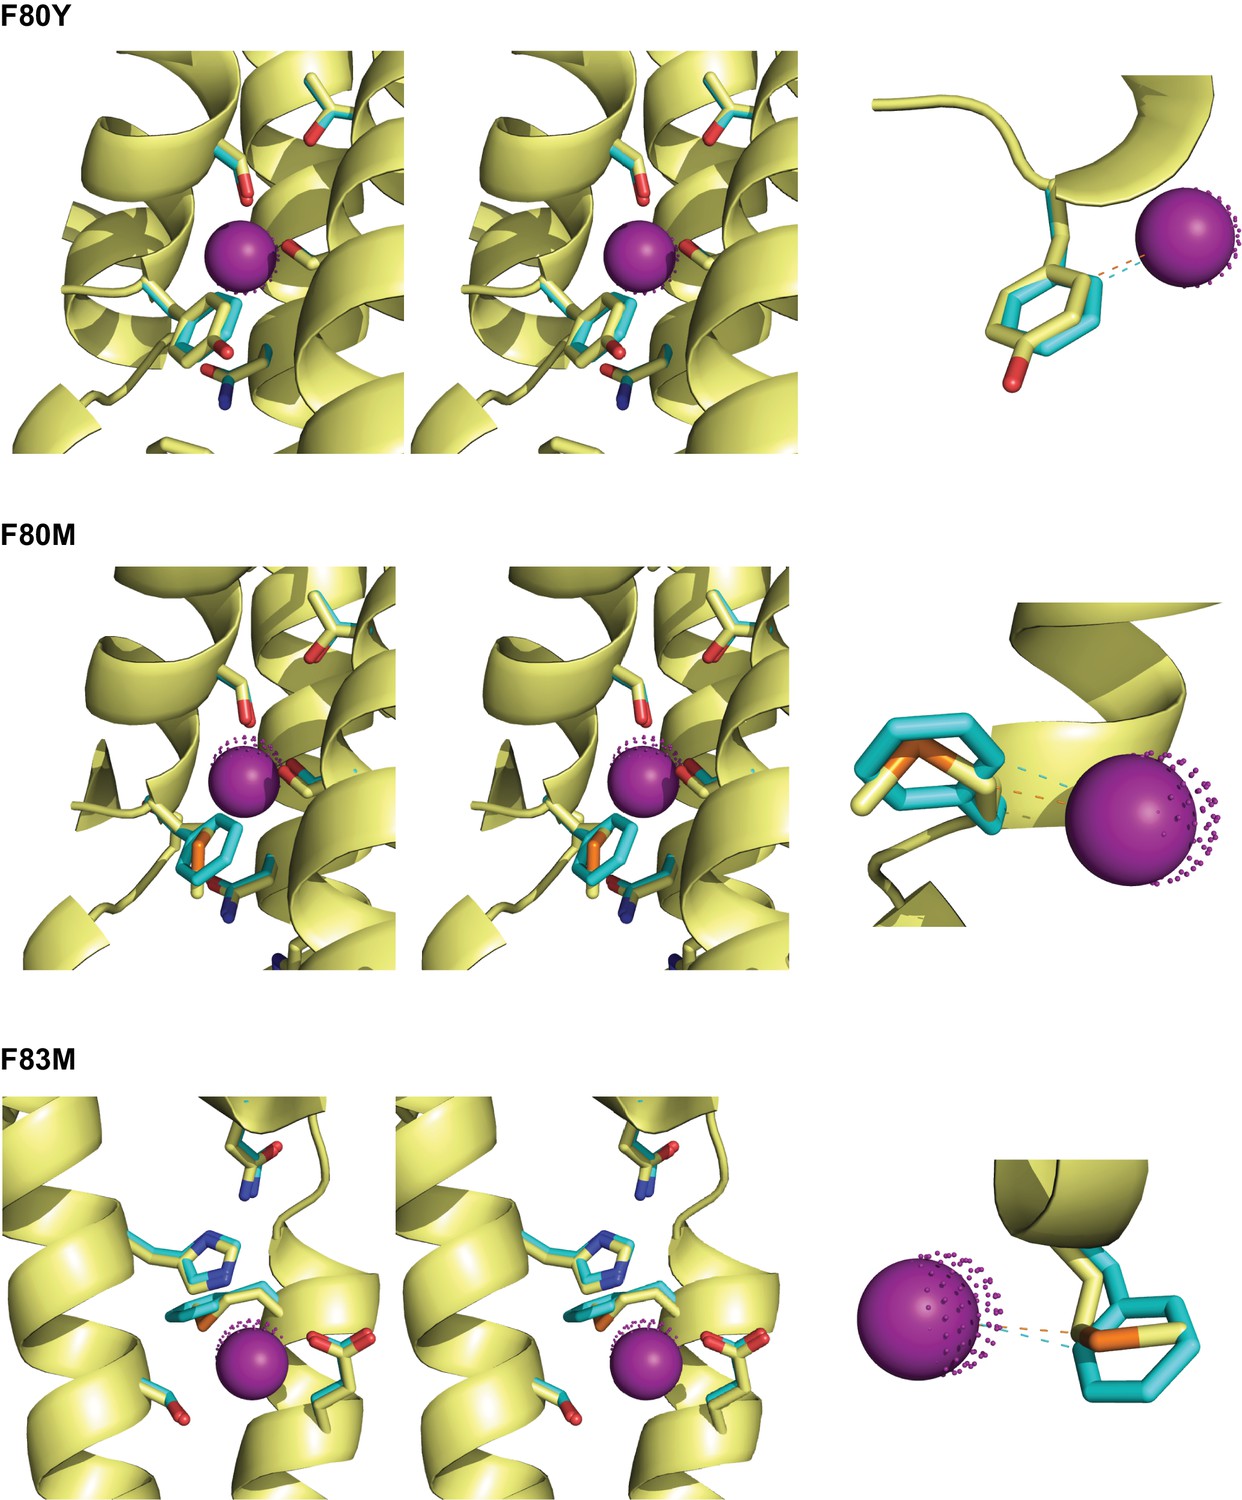
Crystal structures of central Phe mutants. F--coordinating region of the indicated mutants (yellow) are shown along with aligned WT showing positions of side chains (cyan) and corresponding F- ion (purple dots).
https://doi.org/10.7554/eLife.31259.011
Figure 3—figure supplement 4
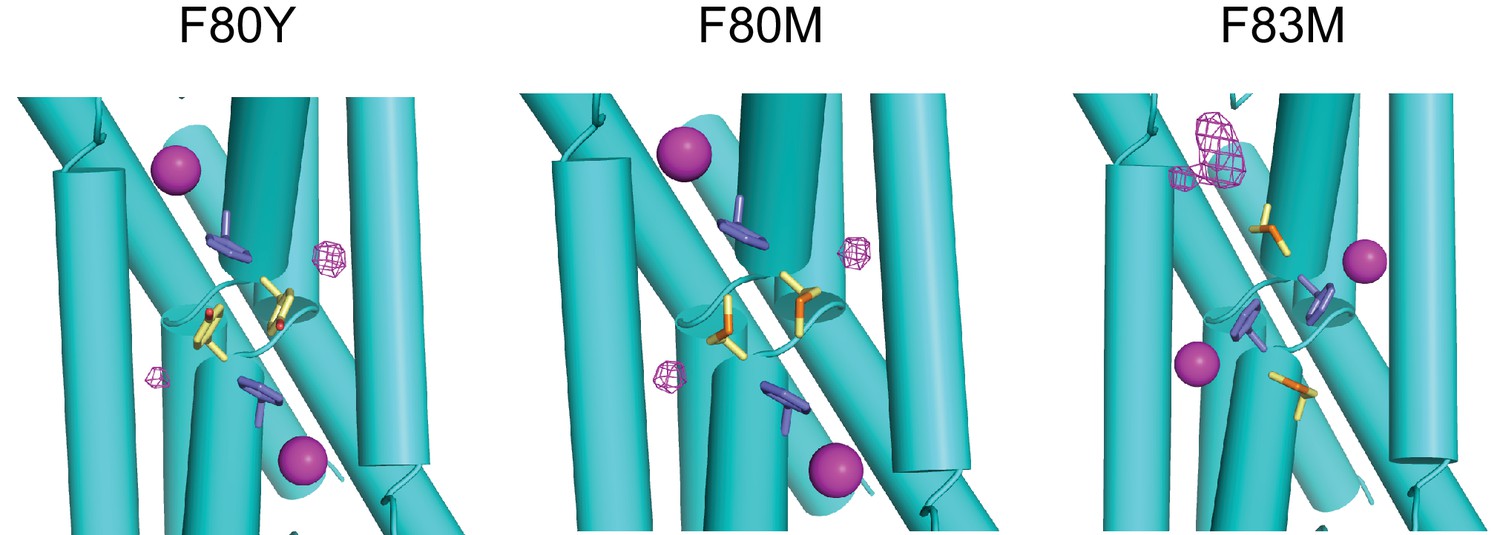
F- density in central Phe mutants.
F--omit (at mutated positions) difference density contoured at 4σ is shown in magenta mesh of indicated mutants. F- ions coordinated by Phe residues are shown as magenta spheres. For F83M, difference density is seen only on one end of channel, and consists of a F- ion and two waters. No NCS averaging was used in refinement, nor was F- included in refinement at the mutated positions at any point prior to making the difference maps.
Figure 4 with 4 supplements
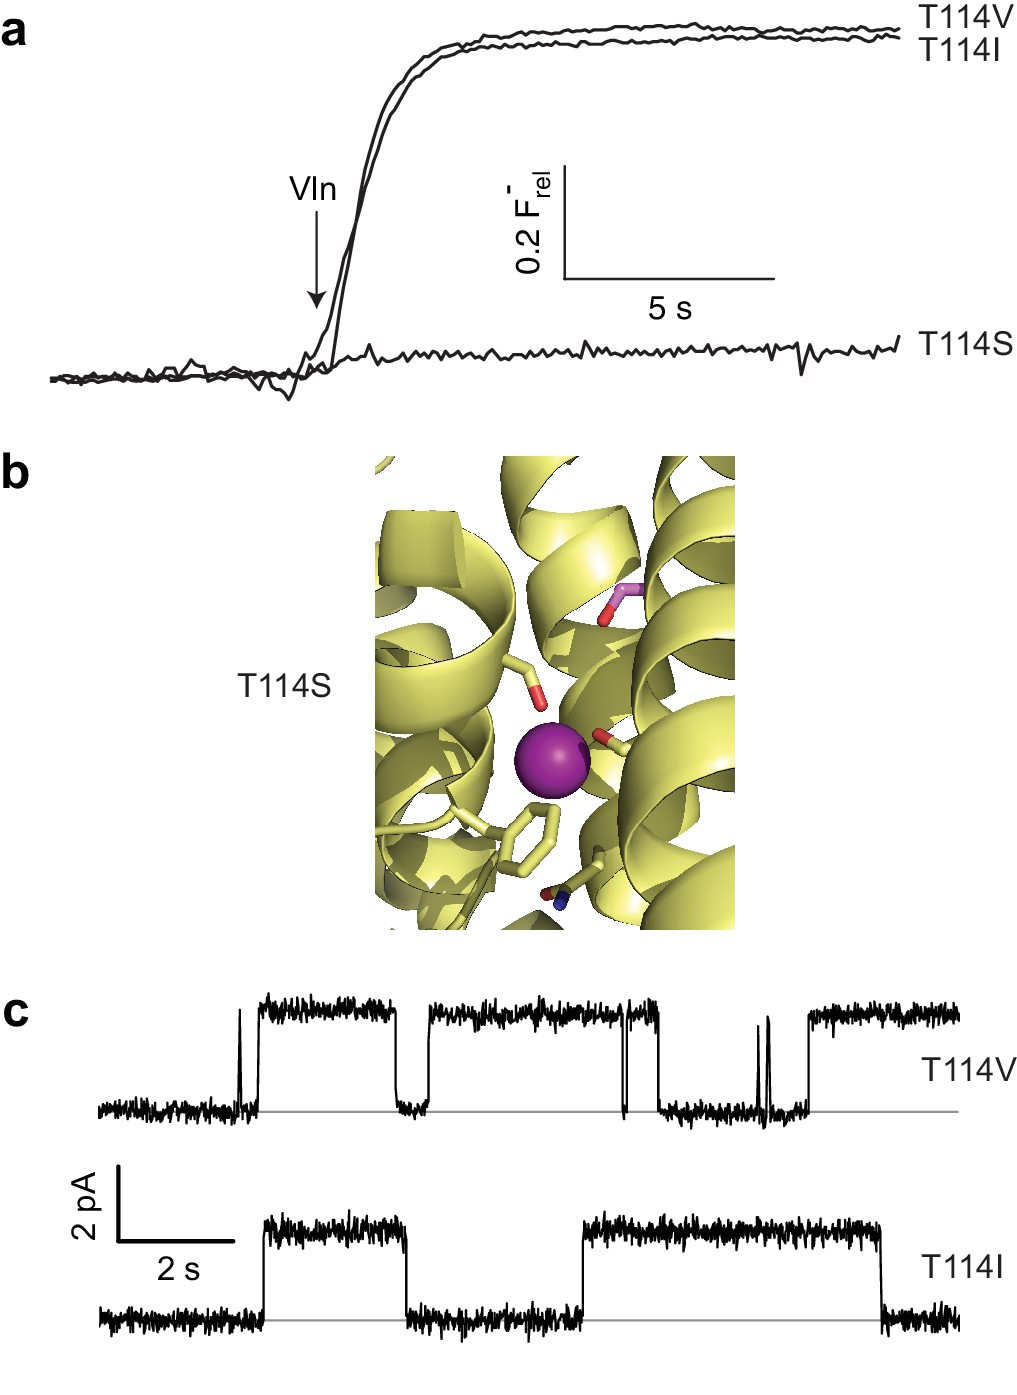
Unexpected T114 interaction.
(a) Active and inactive T114 substitutions in F- efflux assay. (b) F--coordinating region of T114S crystal structure. Mutated residue is in pink. (c) Illustrative single-channel recordings of apolar substitutes scoring active in flux assay.
Figure 4—figure supplement 1

Stereo view of Figure 4b.
https://doi.org/10.7554/eLife.31259.014
Figure 4—figure supplement 2
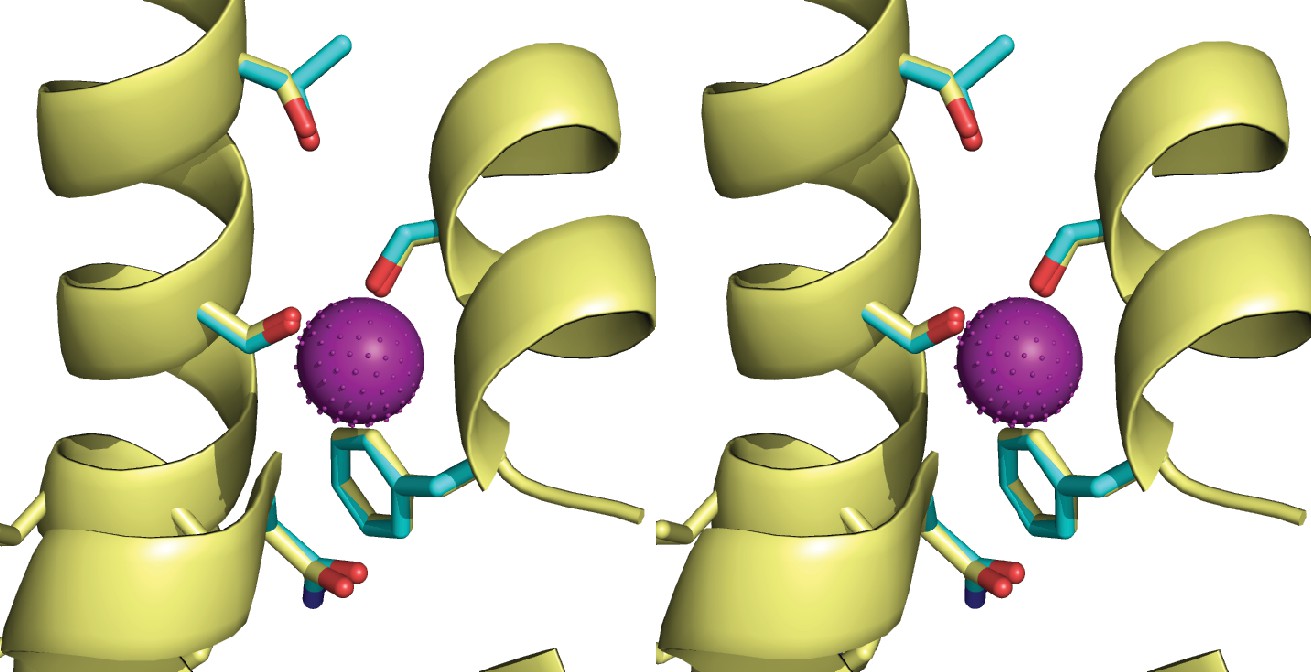
Overlay of WT and T114S structures. Blow-up of F-- coordinating region of T114S crystal structure (yellow) aligned with WT (cyan).
https://doi.org/10.7554/eLife.31259.015
Figure 4—figure supplement 3
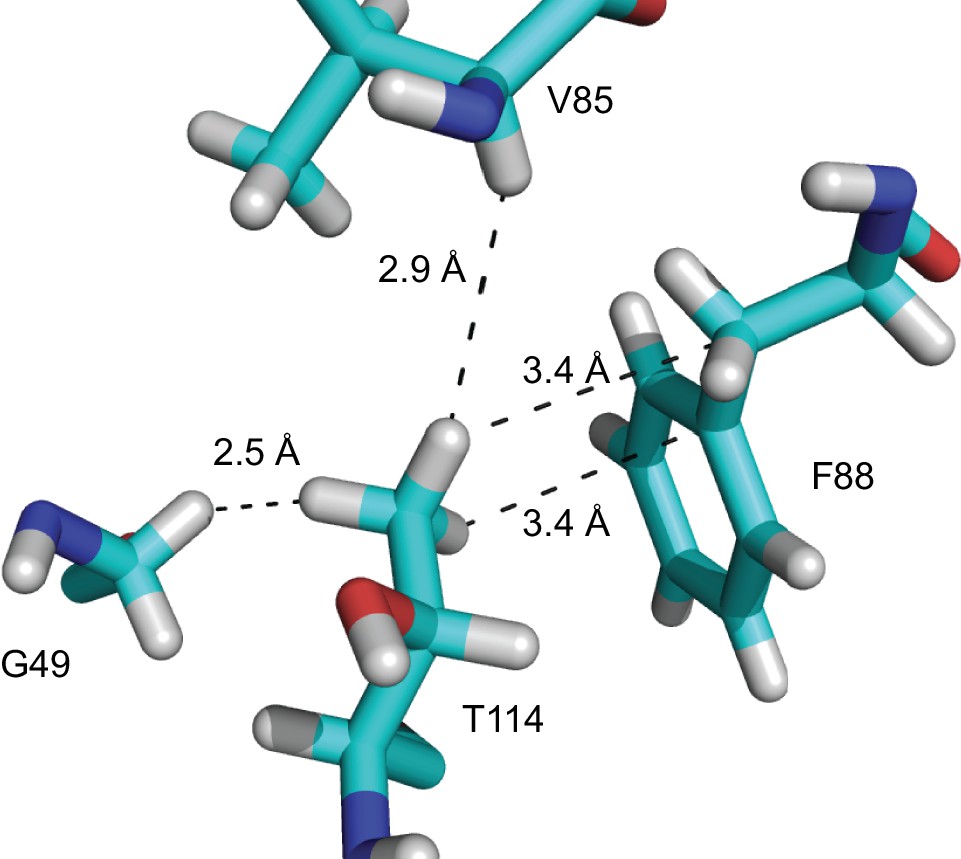
Close contacts with the T114 β-branched methyl.
https://doi.org/10.7554/eLife.31259.016
Figure 4—figure supplement 4

F- efflux (a) and single-channel recording (b) of F88A.
https://doi.org/10.7554/eLife.31259.017
Figure 5 with 1 supplement
Summary of critical pore regions in Fluc Ec2. View of single pore with side chains scored as functionally sensitive to mutagenesis (magenta) or tolerant of mutagenesis (green).
https://doi.org/10.7554/eLife.31259.018
Figure 5—figure supplement 1
Stereo view of Figure 5.
https://doi.org/10.7554/eLife.31259.019Tables
Table 1
F- transport activity of Ec2 channel mutants.
Activity (single-channel conductance), relative to WT, was calculated for mutants showing efflux behavior similar to WT by recording single-channel currents at 200 mV and symmetrical F-, and normalizing to WT current under identical conditions. Mutants scored 'X' gave no discernable flux, equivalent to a relative turnover <10−4 of the WT rate. F80I and F83I results are from Last et al. (2016).
| Construct | Activity | Construct | Activity |
|---|---|---|---|
| WT | 1 | N41S | X |
| N41Q | X | ||
| F80A | X | S84A | 1.0 ± 0.1 |
| F80L | X | ||
| F80I | X | F88A | 0.63 ± 0.06 |
| F80Y | X | ||
| F80W | X | S102A | 1.0 ± 0.1 |
| F80S | X | ||
| F80T | X | H106A | X |
| F80Q | X | H106S | X |
| F80H | X | H106N | X |
| F80M | 0.78 ± 0.05 | H106Y | X |
| H106W | X | ||
| F83A | X | H106F | X |
| F83L | X | ||
| F83I | X | S110A | 0.80 ± 0.06 |
| F83Y | X | ||
| F83W | X | T114A | X |
| F83S | X | T114S | X |
| F83H | X | T114V | 0.99 ± 0.06 |
| F83M | X | T114I | 1.1 ± 0.1 |
Table 2
Crystallographic data collection and refinement statistics
https://doi.org/10.7554/eLife.31259.020| F80Y | F80M | F83M | T114S | |
|---|---|---|---|---|
| Data collection | PDB 6B24 | PDB 6B2A | PDB 6B2B | PDB 6B2D |
| Spacegroup | P41 | P41 | P41 | P41 |
| Cell dimensions | ||||
| a, b, c (Å) | 88.4, 88.4, 146.1 | 87.3, 87.3, 143.2 | 87.0, 87.0, 141.4 | 87.1, 87.1, 143.9 |
| a, b, g (°) | 90, 90, 90 | 90, 90, 90 | 90, 90, 90 | 90, 90, 90 |
| Resolution (Å) | 42.7–2.75 (2.90–2.75) | 43.7–2.65 (2.78–2.65) | 47.1–2.60 (2.72–2.60) | 37.8–3.01 (3.19–3.01) |
| Rmeas | 0.111 (1.40) | 0.099 (1.52) | 0.107 (1.98) | 0.106 (1.57) |
| I/σ | 11.2 (1.5) | 14.4 (1.5) | 15.0 (1.5) | 14.1 (1.5) |
| CC1/2 | 0.998 (0.714) | 0.997 (0.667) | 1.00 (0.662) | 0.999 (0.707) |
| Completeness | 95.9 (97.2) | 100 (100) | 99.9 (99.9) | 99.8 (99.6) |
| Multiplicity | 10.1 (9.5) | 9.9 (8.7) | 12.9 (13.2) | 8.7 (8.9) |
| Refinement Statistics | ||||
| Resolution (Å) | 42.7–2.75 | 43.7–2.65 | 47.1–2.60 | 37.8–3.01 |
| No. Reflections | 26553 | 29629 | 30718 | 20151 |
| Rwork/Rfree | 0.225/0.251 | 0.225/0.243 | 0.221/0.250 | 0.238/0.254 |
| Ramachandran Favored | 0.97 | 0.97 | 0.97 | 0.97 |
| Ramachandran Outliers, % | 0 | 0 | 0.2 | 0 |
| RMS deviations | ||||
| Bond Lengths (Å) | 0.0076 | 0.0072 | 0.0070 | 0.0065 |
| Bond Angles (°) | 1.10 | 1.12 | 1.13 | 1.03 |
Additional files
-
Transparent reporting form
- https://doi.org/10.7554/eLife.31259.021
Download links
A two-part list of links to download the article, or parts of the article, in various formats.
Downloads (link to download the article as PDF)
Open citations (links to open the citations from this article in various online reference manager services)
Cite this article (links to download the citations from this article in formats compatible with various reference manager tools)
Molecular determinants of permeation in a fluoride-specific ion channel
eLife 6:e31259.
https://doi.org/10.7554/eLife.31259


