Therapeutic effects of telomerase in mice with pulmonary fibrosis induced by damage to the lungs and short telomeres
- Spanish National Cancer Centre, Spain
- Roche Innovation Center Basel, F. Hoffmann-La Roche Ltd, Switzerland
- EIN, F. Hoffmann-La Roche Ltd, Switzerland
- Complutense University of Madrid, Spain
- School of Veterinary Medicine, Autonomous University of Barcelona, Spain
Figures
Figure 1 with 1 supplement
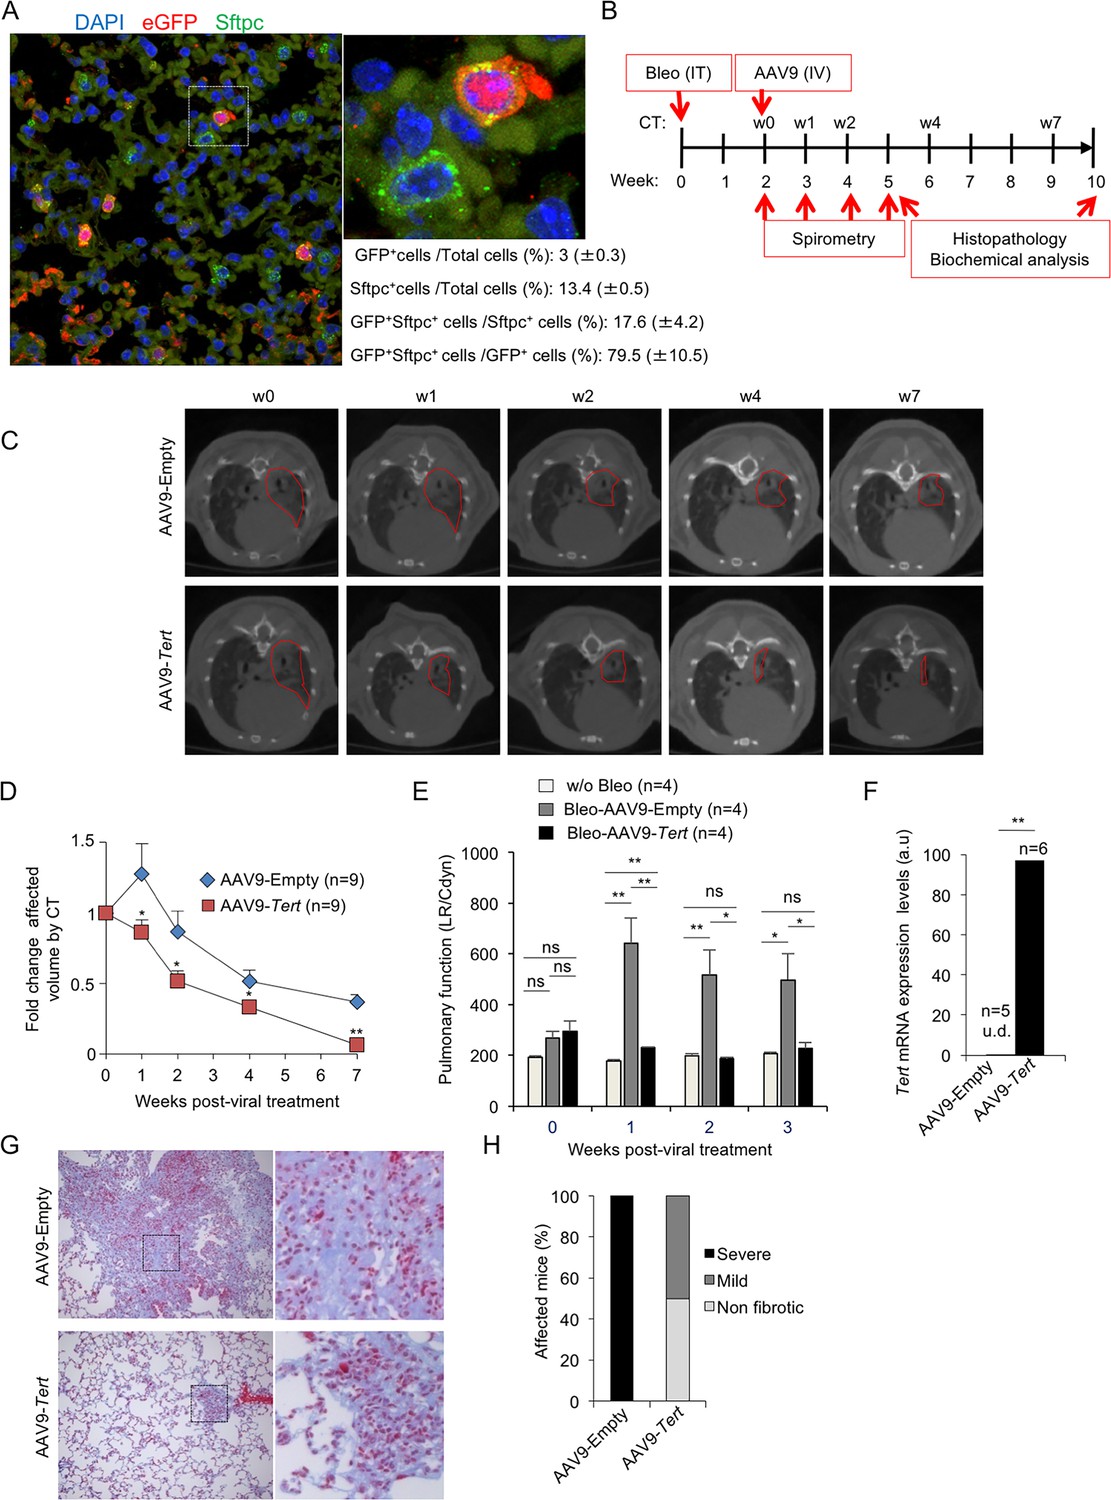
AAV9-Tert treatment targets ATII cells leading to remission of pulmonary fibrosis.
(A) Representative image of immunofluorescence against eGFP (in red) and Sftpc (in green). Mice were injected intravenously in the tail with AAV9-eGFP and sacrificed two weeks later to determine virus cell type target. The quantification of percentage of GFP+ Sftpc+ cells relative to total GFP+ cells and to total Sftpc+ cells is shown. (B) Eight-ten week old male G2Tert-/- mice were intratracheally inoculated with 0.5 mg/kg BW bleomycin and two weeks after computed tomography (CT)-diagnosed with pulmonary fibrosis (PF). Affected mice were treated intravenously either with AAV9-empty or AAV9-Tert. Spirometric follow–up was performed at 1, 2 and 3 weeks post-viral treatment with the viral vectors. CT follow-up was performed at 1, 2, 4 and 7 weeks post-treatment with the viral vectors. Mice were sacrificed at 3 and 8 weeks post-treatment with the viral vectors for further biochemical and histopathological lung examination. (C) CT representative images for every time point of the treatment (fibrotic area in red). (D) Quantification of fold change affected lung volume with PF normalized to the affected volume before the viral treatment by computed tomography (CT). (E) Follow-up of pulmonary function measured as the ratio between lung resistance and dynamic compliance (LR/Cdyn) (F) Tert transcriptional levels in lung 8 weeks post-viral treatment. a.u., arbitrary units (G) Masson´s trichrome staining from lung sections to evaluate fibrotic regions at end point 8 weeks post-viral treatment (collagen fibers in blue; nuclei and erythrocytes in red). (H) Histopathological analysis and fibrosis score from lung sections at end point. The number of mice analyzed per group is indicated. T-test was used in D, E and F and χ2 analysis in H and I for statistical analysis. *p=0.05; **p<0.01.
Figure 1—figure supplement 1
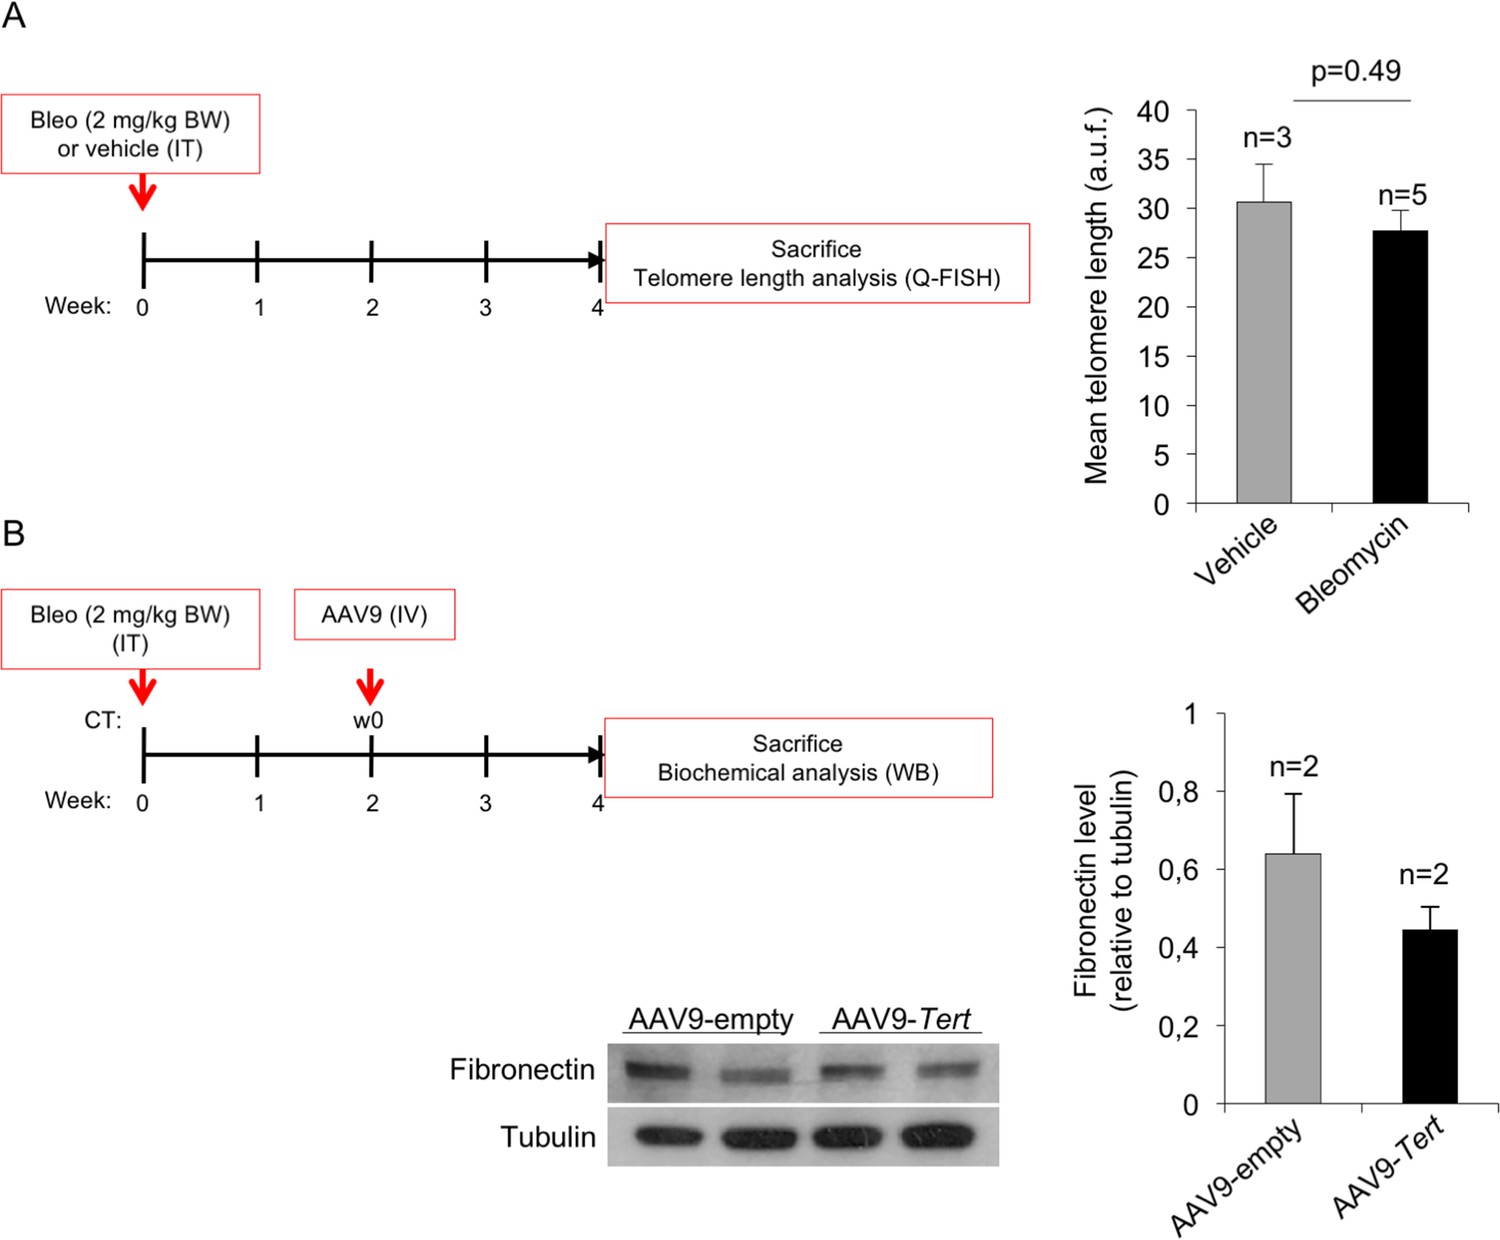
High dose of bleomycin induces pulmonary fibrosis without affecting telomere length in lung cells.
(A) Eight-ten week old wild type mice were intratracheally inoculated either with 2 mg/kg body weight bleomycin or with vehicle and sacrificed after four weeks to measure telomere length by Q-FISH in lung sections (B) Eight-ten week old wild type mice were intratracheally inoculated with 2 mg/kg body weight bleomycin and two weeks after computed tomography (CT) diagnosed with pulmonary fibrosis (PF). Affected mice were treated intravenously either with AAV9-Empty or AAV9-Tert and sacrificed after two weeks to quantify fibronectin levels by western blot. Representative Western Blot images are shown. T-test was used for statistical analysis. Error bars represent standard error. The number of mice analyzed per group is indicated. a.u.f., arbitrary units of fluorescence.
Figure 2
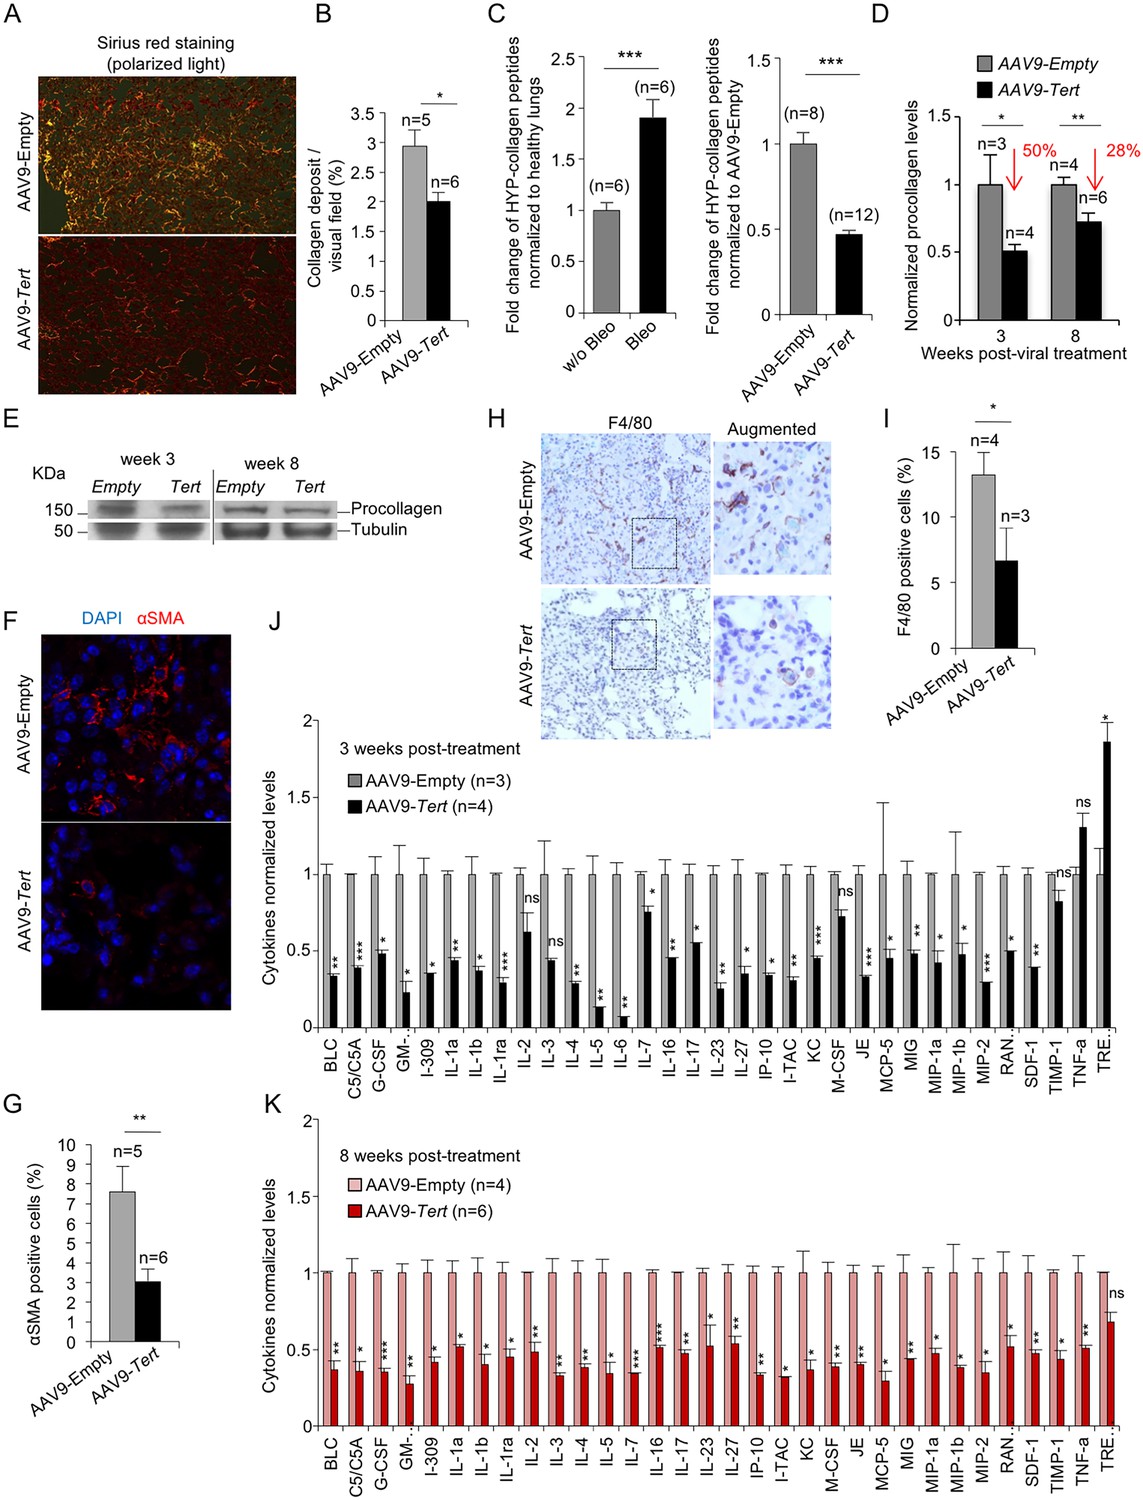
AAV9-Tert treatment leads to lower collagen deposition, less inflammation and decreased active fibrotic foci.
(A) Representative images of picosirius red staining visualized by polarized light where collagen fibers are bright orange from mice treated either with AAV9-Tert or empty vector 8 weeks post-viral treatment. (B) Percent of lung area filled with collagen fibers 8 weeks post-viral treatment. (C) Quantification of specific collagen peptides containing hydroxyproline in healthy lungs without bleomycin and in fibrotic lungs 5 weeks after bleomycin insult (left panel) and in lungs treated either with Tert or empty vector at 8 weeks post-treatment (right panel). (D–E) Quantification of total procollagen levels (D) and representative Western Blot images (E) in lung samples of AVV9-Tert and AVV9-empty infected lungs at 3 and 8 weeks post-viral treatment. (F) Representative images of immunofluorescence for αSMA (in red) and DAPI (in blue) at 8 weeks post-viral treatment. (G) Quantification of αSMA positive cells at 8 weeks post-treatment. (H) Representative images of F4/80 (macrophage specific marker) immunohistochemistry staining in AAV9-Empty and AAV9-Tert treated mice at 8 weeks post-viral treatment. (I) Quantification of F4/80 positive cells at 8 weeks post-viral treatment. (J–K) Quantification of the indicated cytokines in lung samples of AVV9-Tert and AVV9-empty infected lungs at 3 (J) and 8 (K) weeks post-viral treatment. Data represent the mean ±SE of analyzed mice within each group. The number of mice analyzed per group is indicated. T-test was used for statistical analysis. *p=0.05; **p<0.01; ***p<0.001.
Figure 3
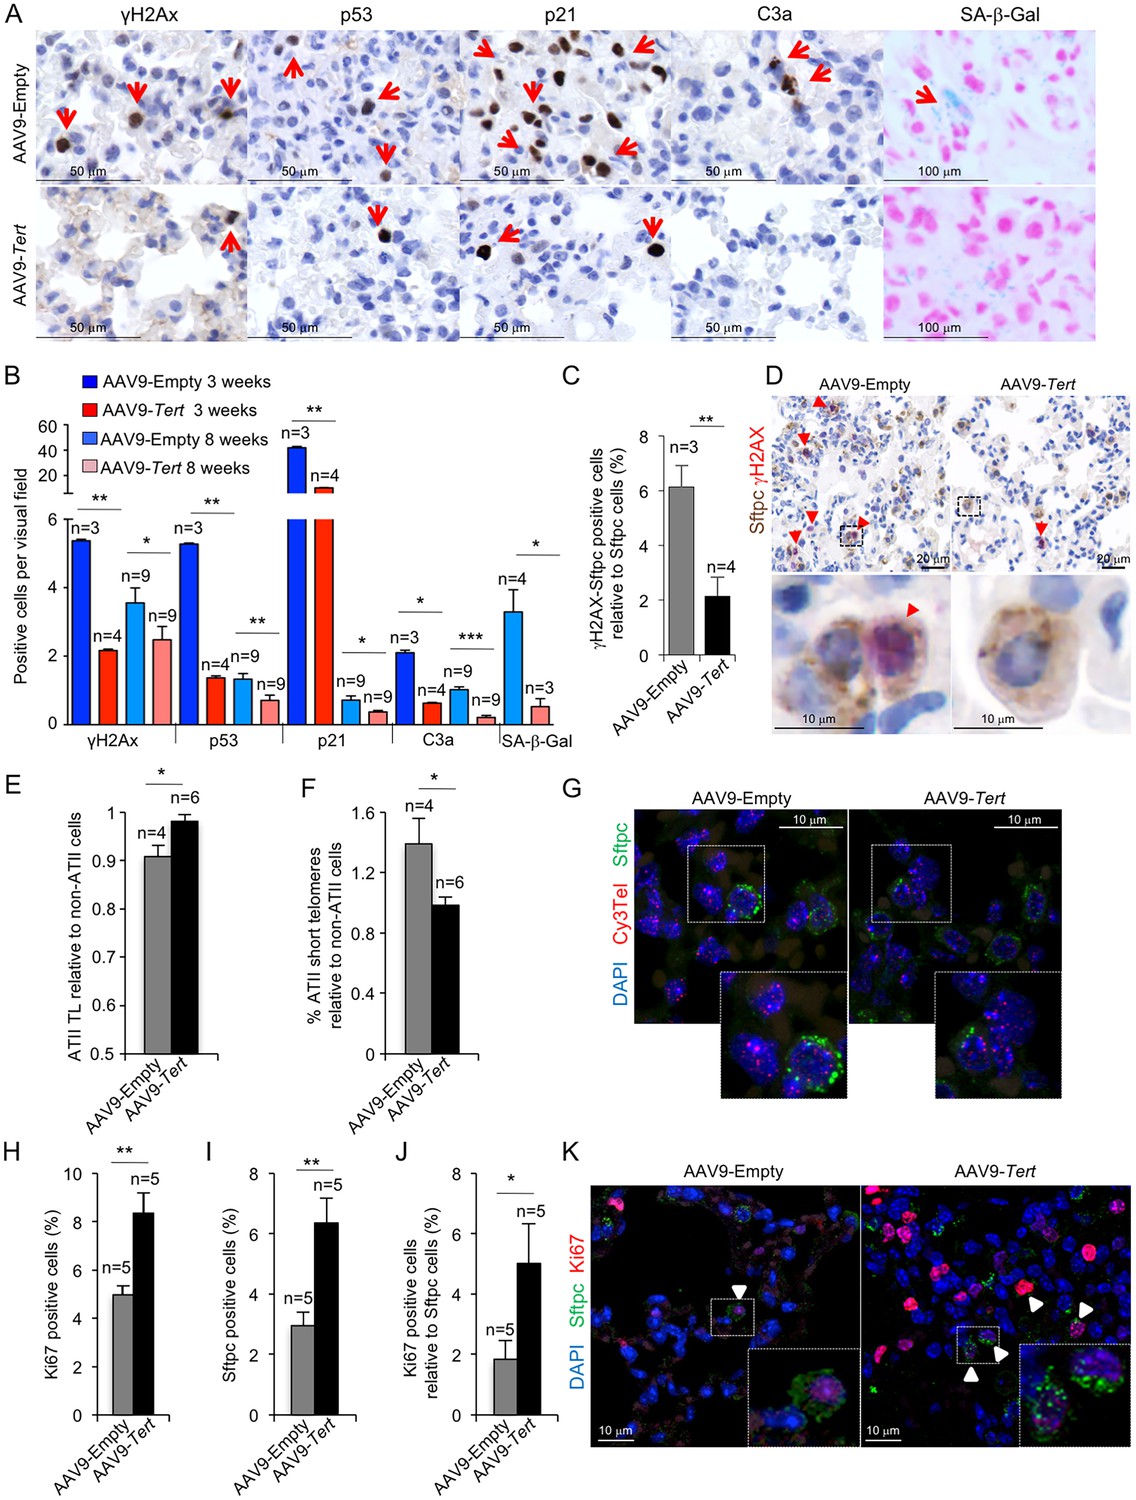
AAV9-Tert treatment reduces DNA damage, improves telomere maintenance and proliferation in ATII cells.
(A) Representative images for γH2AX, p53, p21, active caspase 3 (C3a) and SA-β-Gal stained lungs at 3 weeks post-viral treatment. (B) Quantification of γH2AX, p53, p21, C3a and SA-β-Gal positive cells per visual field of lungs treated either with Tert or empty vector at 3 and 8 weeks post-viral treatment. (C) percentage of damaged (γH2AX positive) ATII cells (Stfpc positive) in lungs treated either with Tert or empty vector at three post-viral treatment. (D) Representative images of double immunohistochemistry against Stfpc (brown) and γH2AX (red) of lungs treated either with Tert or empty vector at three post-viral treatment. (E–F) Fold change in telomere length (E) and percentage of short telomeres (F) in ATII cells relative to non-ATII cells at 8 weeks post-viral treatment. (G) Representative images of immuno-QFISH with Cy3Telomere probe (in red), Sftpc (in green) and DAPI (in blue) in lungs at 8 weeks post-viral treatment. (H–J) Quantification of percentage of Ki67 positive cells (H), Sftpc positive cells (I) and Ki67 positive cells relative to Sftpc positive cells at 8 weeks post-viral treatment (J). (K) Representative images of double immunofluorescence against Sftpc (in green) and Ki67 (in red) in lungs at 8 weeks post-viral treatment. Data represent the mean ±SE of analyzed mice within each group. The number of mice analyzed per group is indicated. T-test was used for statistical analysis. *p=0.05; **p<0.01; ***p<0.001.
Figure 4 with 2 supplements
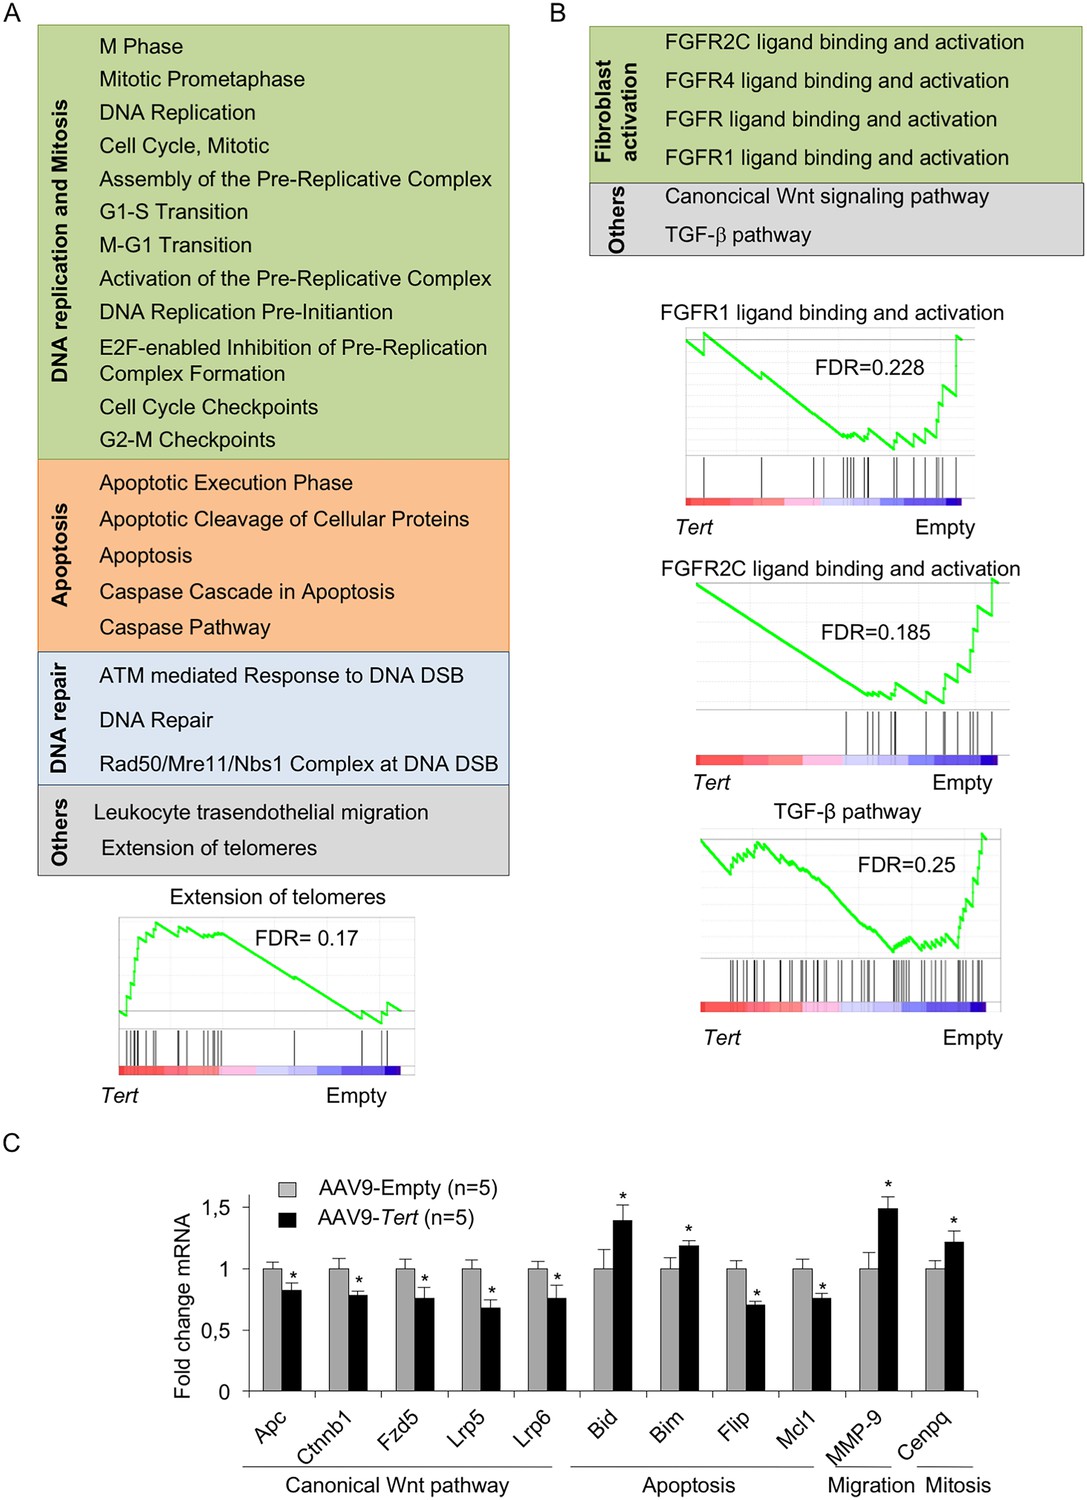
AAV9-Tert treatment induces transcriptional changes in the lungs.
(A–B) Summary table indicating various significantly (FDR < 0.25) upregulated (A) and downregulated (B) pathways in AAV9-Tert compared with AAV9-Empty treated lungs at 8 weeks post-viral treatment. Examples of GSEA plots for the indicated pathways are shown below. Microarray genes were ranked based on the two-tailed t-statistic tests obtained from the AAV9-Tert versus AAV9-Empty by pair-wise comparisons. The red to blue horizontal bar represents the ranked list. Those genes showing higher expression levels for each cohort are located at the edges of the bar (AAV9-Empty; AAV9-Tert). The genes located at the central area of the bar show small differences in gene expression fold changes between both groups. (C) Fold change mRNA expression levels of candidate genes related with canonical Wnt pathway, apoptosis, mitosis and transendothelial migration in AAV9-Tert relative to empty vector. For GSEA Kolmogorov–Smirnoff testing was used for statistical analysis. The FDR is calculated by Benjamini and Hochberg FDR correction. Data represent the mean ± SE of analyzed mice within each group. The number of mice analyzed per group is indicated. T-test was used for q-PCR statistical analysis. *p=0.05.
Figure 4—figure supplement 1

Differentially expressed genes from AAV9-Tert treated mice correlate with ATII cells gene expression signature.
(A) GSEA plots for the indicated pathways in lung tissue. Microarray genes were ranked based on the two-tailed t-statistic tests obtained from the AAV9-Tert versus AAV9-Empty by pair-wise comparisons. The red to blue horizontal bar represents the ranked list. Those genes showing higher expression levels for each cohort are located at the edges of the bar (AAV9-Empty; AAV9-Tert). The genes located at the central area of the bar show small differences in gene expression fold changes between both groups. For GSEA Kolmogorov–Smirnoff testing was used for statistical analysis. The FDR is calculated by Benjamini and Hochberg FDR correction. (B–C) Heat maps representing the upregulated genes (B) and downregulated genes (C) in AAV9-Tert compared to empty vector treated mice that corresponded to ATII cells, lung leukocytes and mouse embryonic fibroblast (MEFs). The size of the heat map for each cell type correlates with the amount of genes deregulated. The red/blue bars represent an over/down-expression of the gene in this sample compared with the other cohort.
Figure 4—figure supplement 2

Tert overexpression in fibrotic lungs mimic neonatal regenerative heart tissue after infarctation.
(A) GSEA plot for LAD/Sham List from Haubner et al. study. A heatmap of indicated core-enriched genes is displayed under the enrichment plot. Microarray genes were ranked based on the two-tailed t-statistic tests obtained from the AAV9-Tert versus AAV9-Empty by pair-wise comparisons. The red to blue horizontal bar represents the ranked list. Those genes showing higher expression levels for each cohort are located at the edges of the bar (AAV9-Empty; AAV9-Tert). The genes located at the central area of the bar show small differences in gene expression fold changes between both groups. (B) REACTOME Pathways differentially enriched with genes of the core-enriched from the previous GSEA. For GSEA Kolmogorov–Smirnoff testing was used for statistical analysis. The FDR is calculated by Benjamini and Hochberg FDR correction.
Figure 5
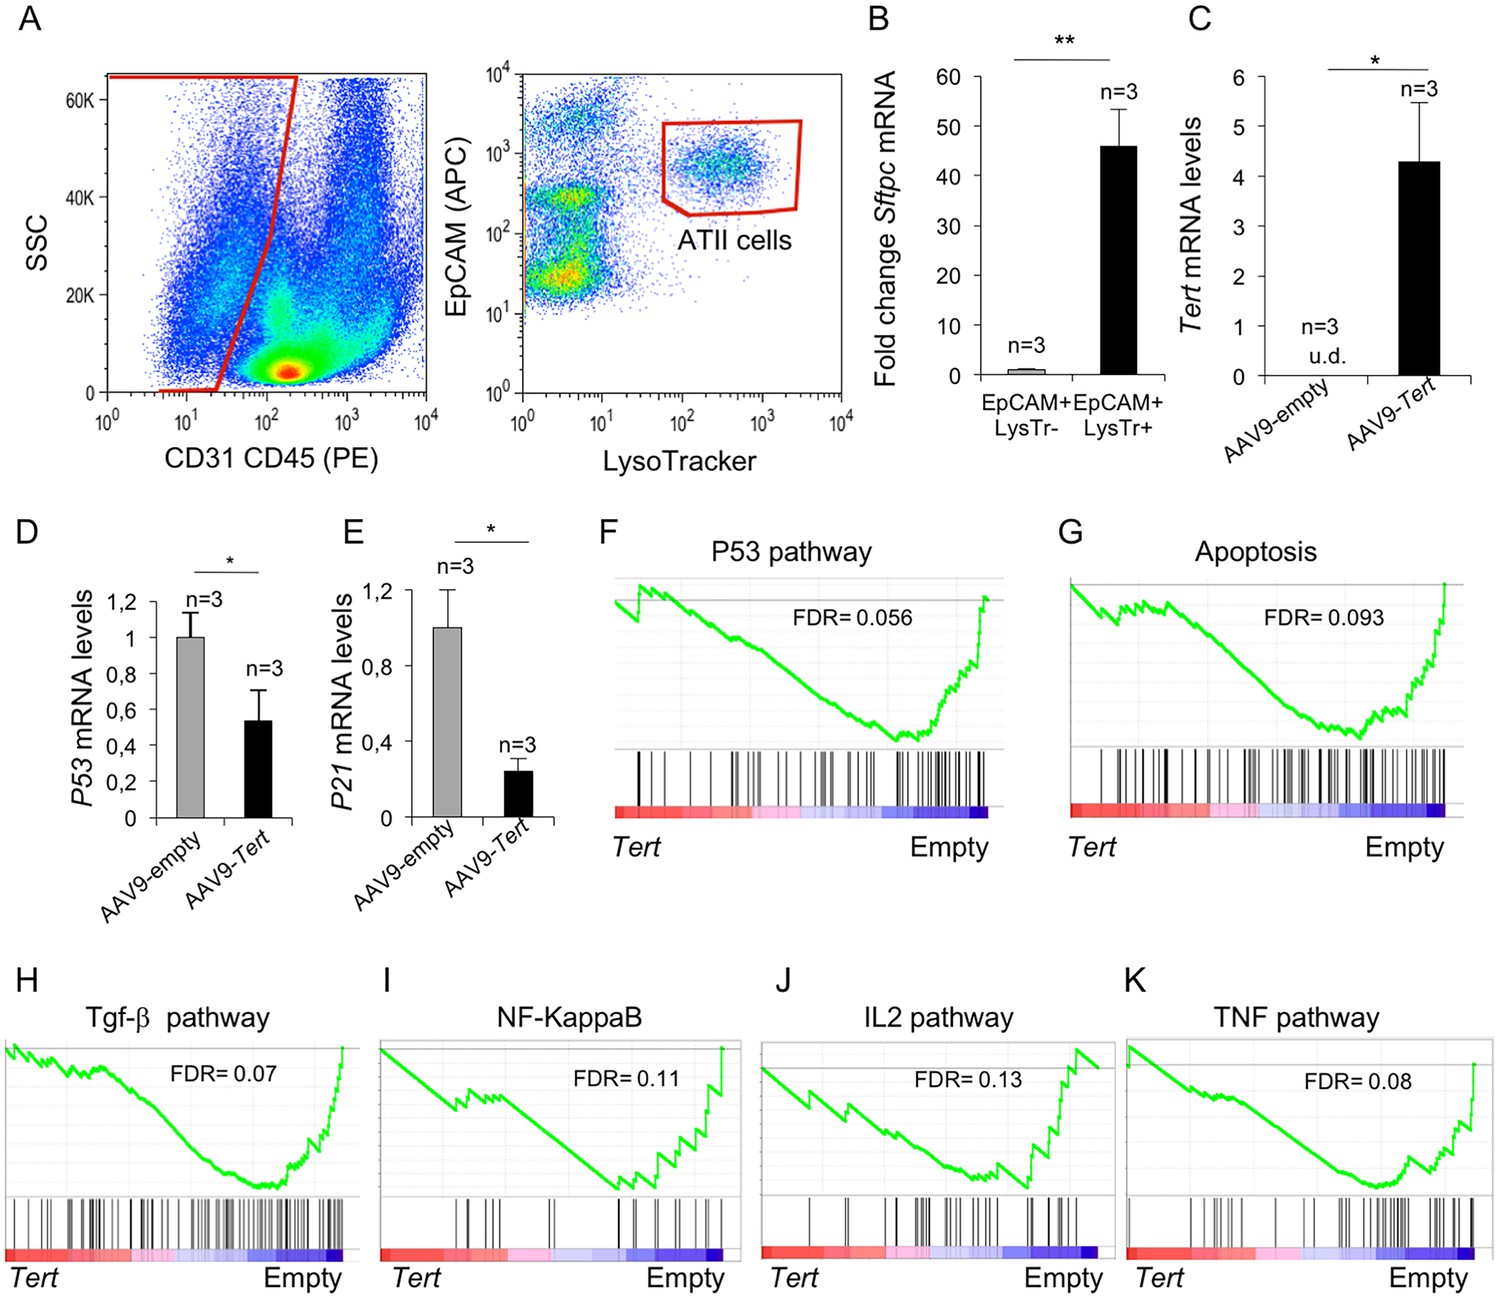
Isolated ATII cells overexpress Tert and show downregulation of DDR- and inflammatory- related pathway.
(A) FACs representative dot plots of lungs one week post either AAV9-Empty or AAV9-Tert treatment. The epithelial cell population was identified as CD31/CD45 double negative. ATII cells were identified by LysoTracker and EpCAM doubly positive cells and isolated by cell sorting. (B) Validation of specific ATII cells marker Sftpc by RT-qPCR. (C) Transcriptional levels of Tert in isolated ATII cells from lungs treated with the indicated vectors. (D–E) mRNA expression levels of p53 (C) and p21 (D) genes in ATII by RT-qPCR from lungs treated with the indicated vectors. (F–G) GSEA plots for the indicated downregulated DDR related pathways in AAV9-Tert infected ATII cells. (H–K) GSEA plots for the indicated downregulated inflammatory related pathways in AAV9-Tert infected ATII cells. Microarray genes were ranked based on the two-tailed t-statistic tests obtained from the AAV9-Tert versus AAV9-Empty by pair-wise comparisons. The red to blue horizontal bar represents the ranked list. Those genes showing higher expression levels for each cohort are located at the edges of the bar (AAV9-Empty; AAV9-Tert). The genes located at the central area of the bar show small differences in gene expression fold changes between both groups. Data represent the mean ±SE of analyzed mice within each group. The number of mice analyzed per group is indicated. T-test was used for RT-qPCR statistical analysis. *p=0.05; **p<0.01. For GSEA Kolmogorov–Smirnoff testing was used for statistical analysis. The FDR is calculated by Benjamini and Hochberg FDR correction.
Figure 6
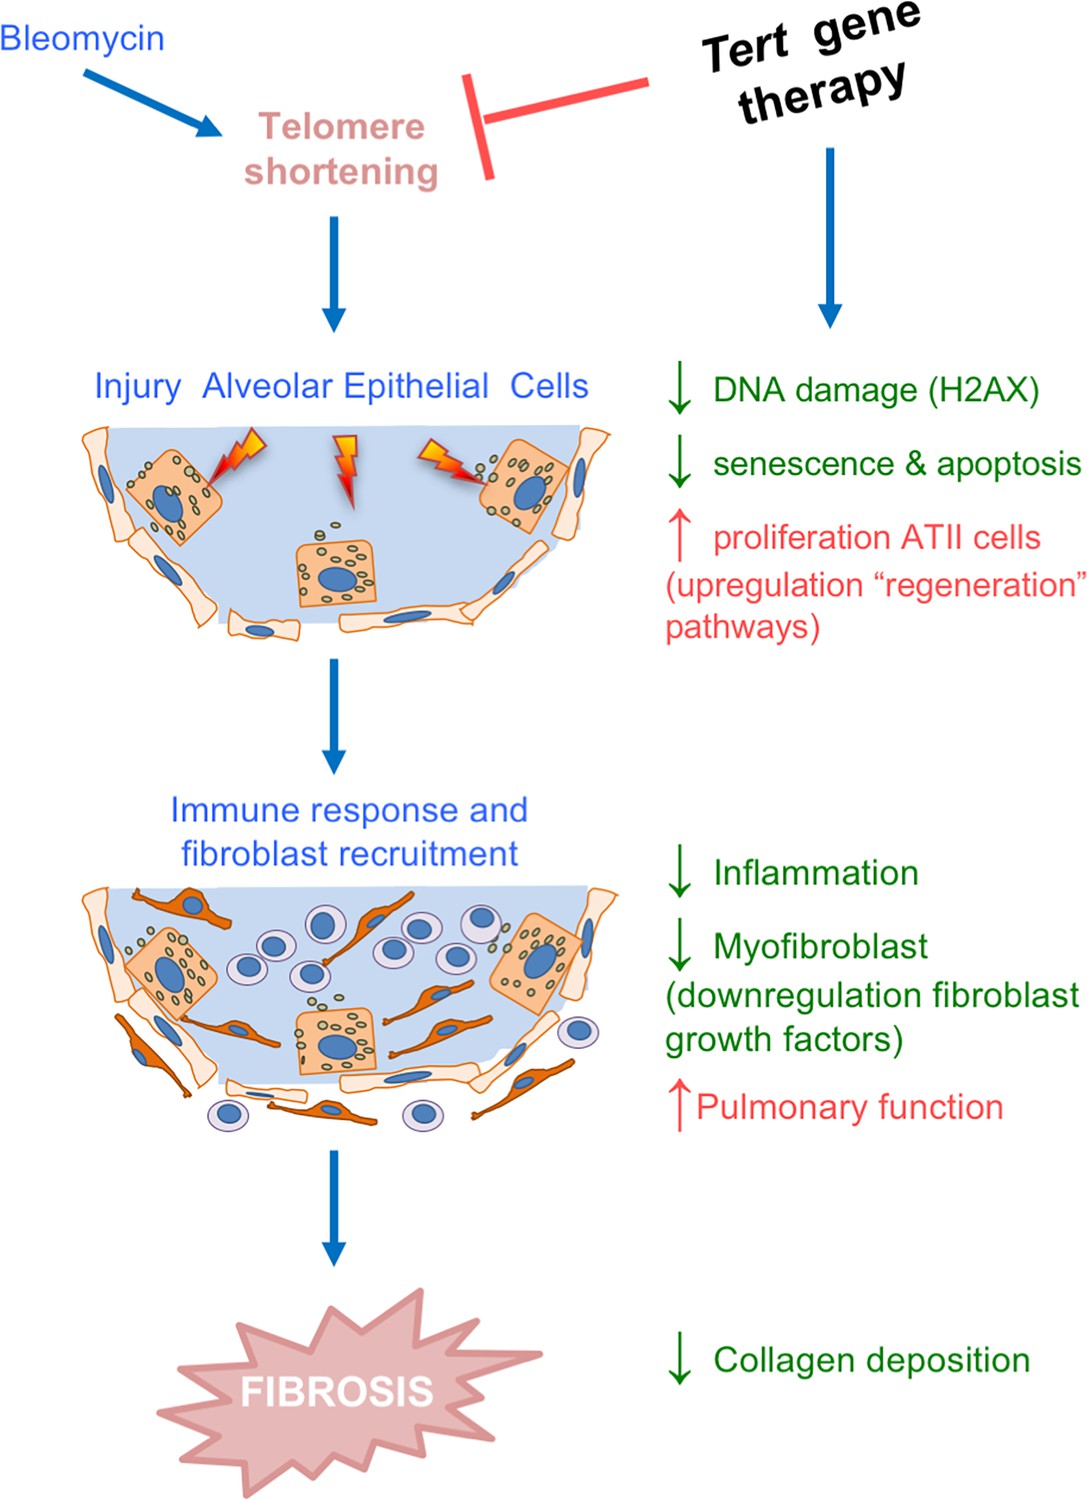
Tert gene therapy targets the basis of pulmonary fibrosis.
Proposed model for the mechanism underlying Tert gene therapy. AAV9-Tert therapy targets one of the molecular causes of the disease, short telomeres (Alder et al., 2008; Armanios et al., 2007; Povedano et al., 2015), resulting in decreased DNA damage, senescence/apoptosis and improved proliferative potential of the ATII cells and subsequently decreasing inflammation and fibrosis.
Author response image 1
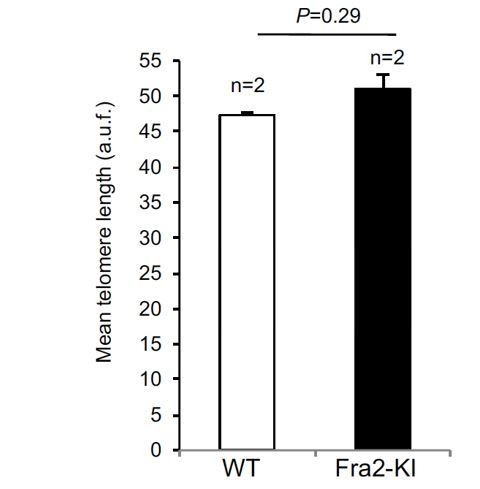
Mean telomere length in wild type and fibrotic Fra2 Knock-in mice.
https://doi.org/10.7554/eLife.31299.015Tables
Key resources table
| Reagent type (species) or resource | Designation | Source or reference | Identifiers | Additional information |
|---|---|---|---|---|
| gene (Mus musculus) | Tert | NA | Gene ID: 21752 | Liu et al. (2000) |
| strain, strain background (Mus musculus) | G2 Tert-/- ; male | NA | ||
| strain, strain background (AAV9) | AAV9-Tert | Other | Bernardes de Jesus et al. (2012) | |
| strain, strain background (AAV9) | AAV9-EGFP | Other | Bernardes de Jesus et al. (2012) | |
| antibody | anti-p53 | CNIO histopathology core unit | POE316A/E9 | (1:200) |
| antibody | anti-p21 | CNIO histopathology core unit | HUGO-291H/B5 | (1:200) |
| antibody | anti-phospho–H2AX(Ser139) | Merck Millipore | Clone JBW301 | (1:200) |
| antibody | anti-F4/80 | ABD serotec | CI:A3-1 | (1:200) |
| antibody | anti-p19 | Santa Cruz Biotecchnology | 5-C3-1 | (1:50) |
| antibody | anti-Sftpc | Merck Millipore | AB3786 | (1:200) |
| antibody | anti-cleaved Caspase 3 | R& and D systems | (1:1000) | |
| antibody | anti-Sftpc | Santa Cruz Biotecchnology | C-19 | (1:50) |
| antibody | anti-alfaSMA | Biocare Medical | CME 305 | (1:200) |
| antibody | anti-GFP | Roche | 05-636 | (1:100) |
| antibody | anti-Ki67 | Master Diagnostica | 0003110QD | (1:500) |
| antibody | PE antimouse CD45 | BD Biosciences | Clone 30-F11 | (1:200) |
| antibody | PE antimouse CD31 | BD Biosciences | Clone MEC 13.3 | (1:200) |
| antibody | APC antimouse EpCAM | BD Biosciences | Clone EBA-1 | (1:200) |
| commercial assay or kit | Mouse Cytokine Array | R&D systems | ProteomeProfiler mouse Cytokine Array Panel A | |
| chemical compound, drug | LysoTracker | Molecular Probes | LysoTracker Green DND-26, Cat. Num. L7526 | |
| software, algorithm | MicroView | GE Healthcare | MicroView | |
| other | high-resolution CT system | GE Healthcare | CT Locus |
Additional files
-
Supplementary file 1
Differentially expressed genes in AAV9-Tert compared to empty vector treated fibrotic lungs (FDR < 0.05).
The FDR is calculated by Benjamini and Hochberg FDR correction.
- https://doi.org/10.7554/eLife.31299.012
-
Transparent reporting form
- https://doi.org/10.7554/eLife.31299.013
Download links
A two-part list of links to download the article, or parts of the article, in various formats.
Downloads (link to download the article as PDF)
Open citations (links to open the citations from this article in various online reference manager services)
Cite this article (links to download the citations from this article in formats compatible with various reference manager tools)
Therapeutic effects of telomerase in mice with pulmonary fibrosis induced by damage to the lungs and short telomeres
eLife 7:e31299.
https://doi.org/10.7554/eLife.31299


