The asymmetrically segregating lncRNA cherub is required for transforming stem cells into malignant cells
- Institute of Molecular Biotechnology of the Austrian Academy of Sciences, Austria
- University of Basel, Switzerland
Figures
Figure 1
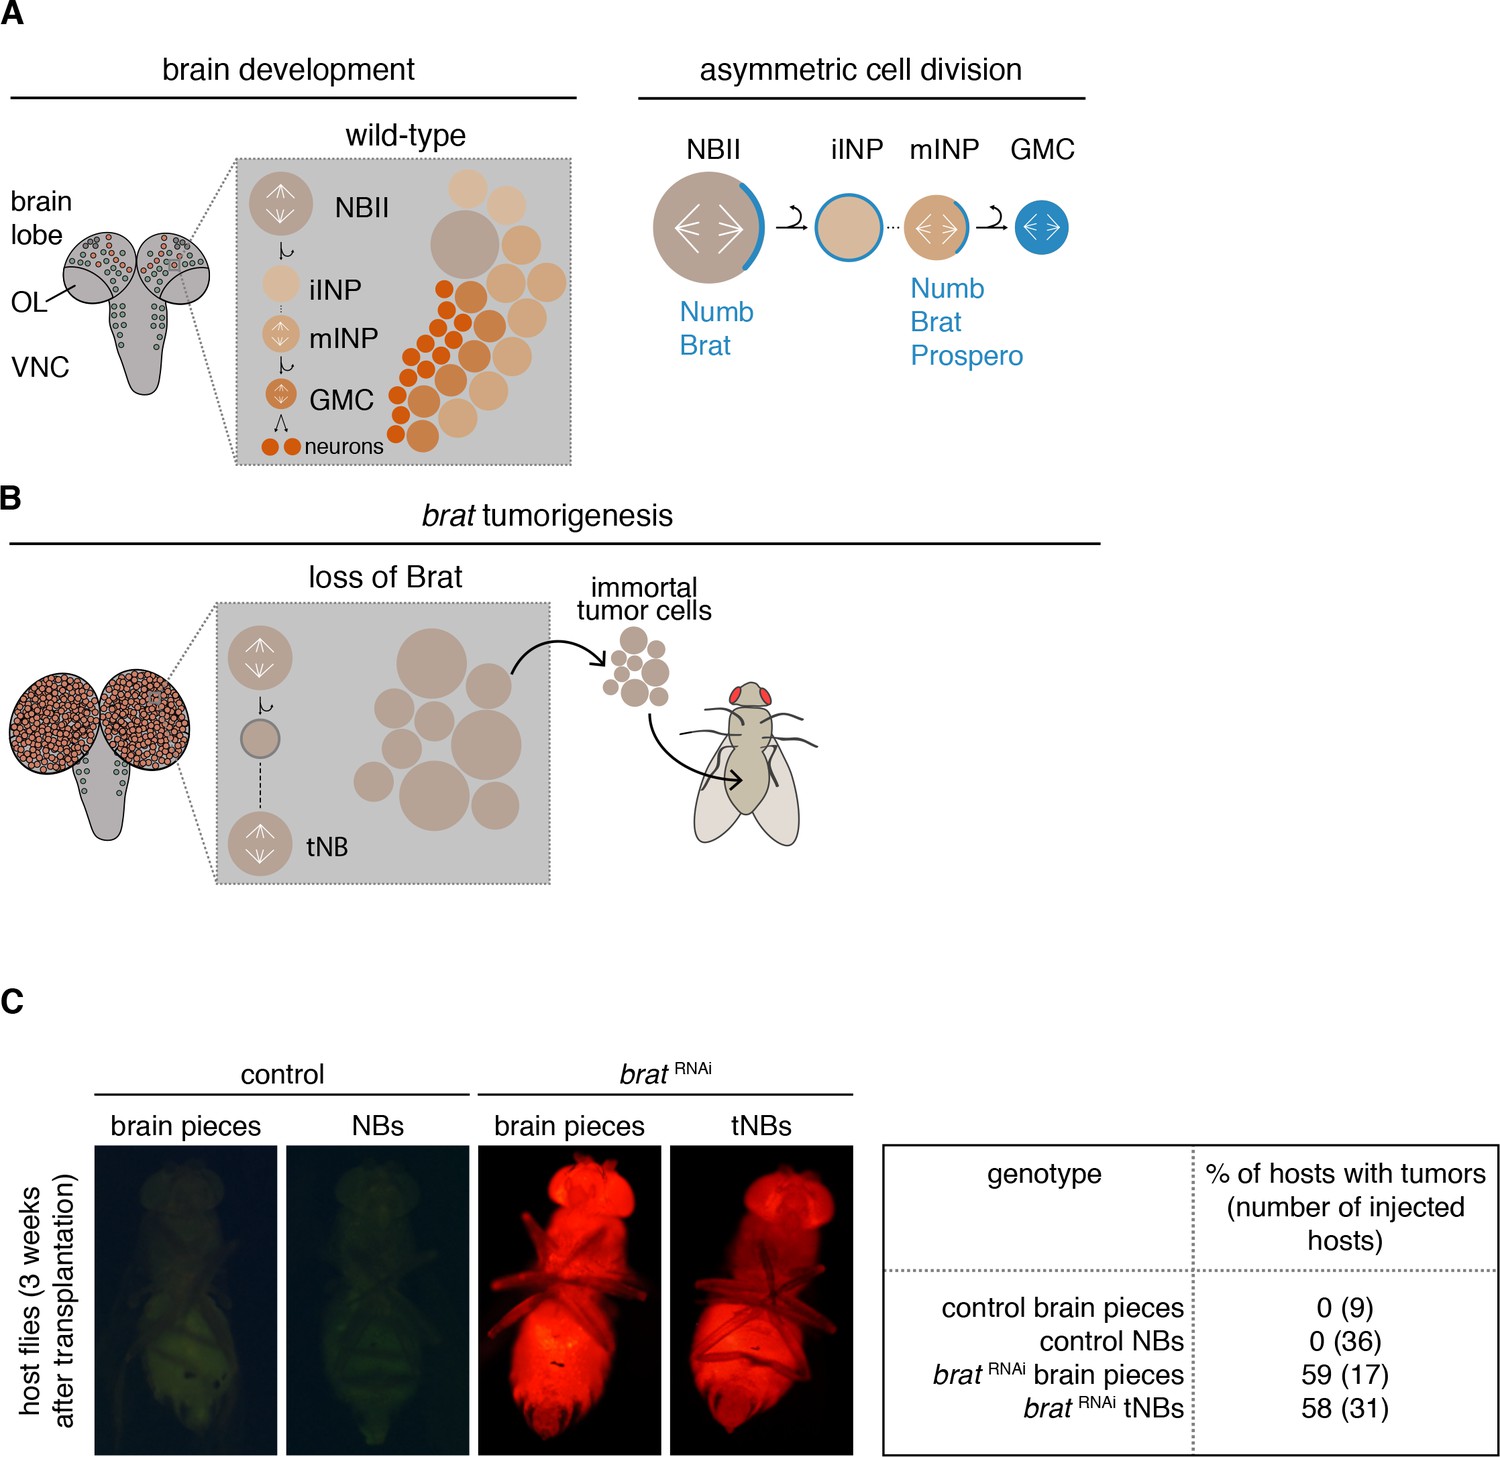
brat tumor neuroblast possess increased proliferation potential.
(A) Cartoon depicting a Drosophila larval brain (OL optic lobe, VNC ventral nerve cord) harboring different neuroblast populations: mushroom body NBs (grey), type I (NBI, green) and II (NBII, orange) neuroblasts. Close-up shows a NBII lineage (iINP - immature intermediate neural progenitor, mINP - mature INP, GMC - ganglion mother cell) and the typical arrangement of cell types in a NBII clone (left). Proteins (blue) are asymmetrically segregated in NBII and mINP to ensure lineage directionality (right). (B) In brat mutants, the smaller daughter cell fails to differentiate and after a transient cell cycle block regrows into an ectopic neuroblast (tNB - tumor neuroblast). brat tumors continue to grow upon transplantation. (C) Representative images of adult host flies injected with FACS-sorted control NBs (GFP+) and brat RNAi tNBs (RFP+) from third instar larvae. Transplantations of brain pieces served as controls.
Figure 2
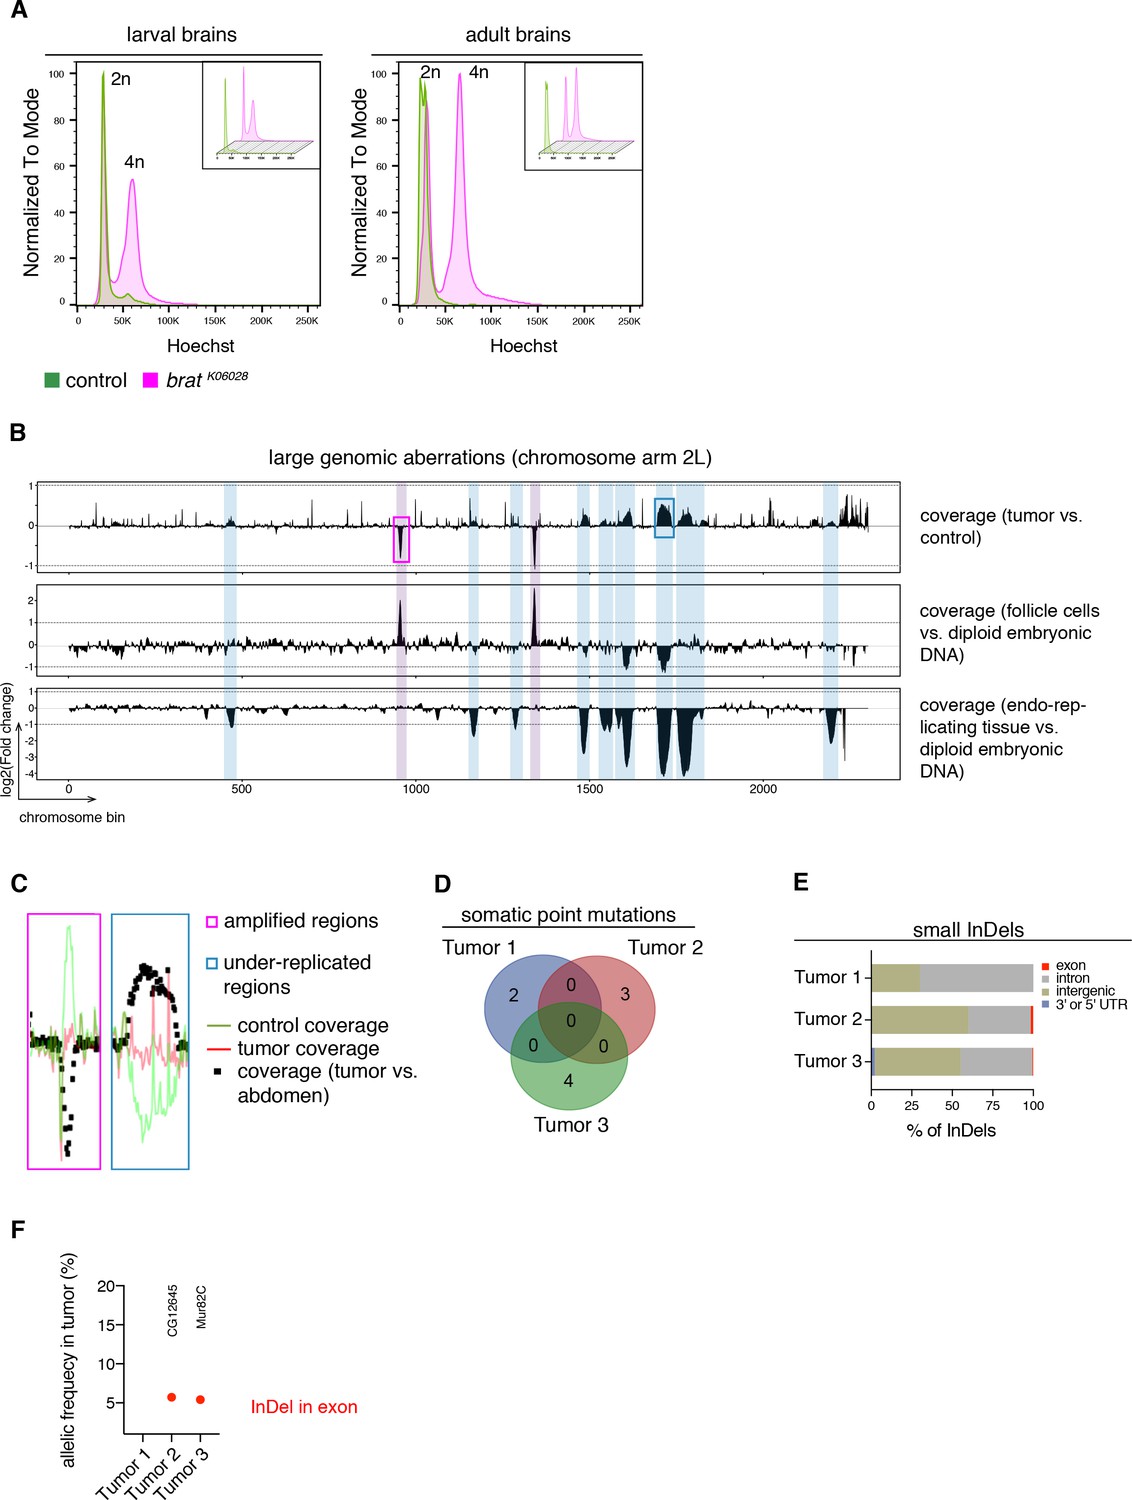
brat tumors form independently of common DNA alterations.
(A) DNA content analysis of brat k06028 mutant and control brains showing non-dividing (2n) and mitotic cells (4n). DNA content for each genotype is shown separately in small boxes. (B–F) Genome sequencing of bratk06028 brains and abdominal tissue (control). Note that Drosophila brain cells are diploid while the control samples harbor endo-replicating tissue and follicle cells with increased DNA copy number. (B) A representative coverage plot of chromosome arm 2L of one tumor is shown (top row), together with datasets indicating under-replicated (blue) and amplified (magenta) genomic regions. (C) Close-ups of boxes marked in (B) showing steady tumor coverage (red) and a drop (under-replication) or increase (amplification) in the coverage of the control sample (green). (D) Genes with identified somatic point mutations (coverage tumor >14 and control >8, allelic frequency ≥0.1) of three tumors do not overlap. (E) Affected genomic regions of identified small InDels. (F) In tumor 2 and 3, one small InDel each was identified in an exon with low allelic frequency. Affected genes are indicated.
Figure 3 with 1 supplement
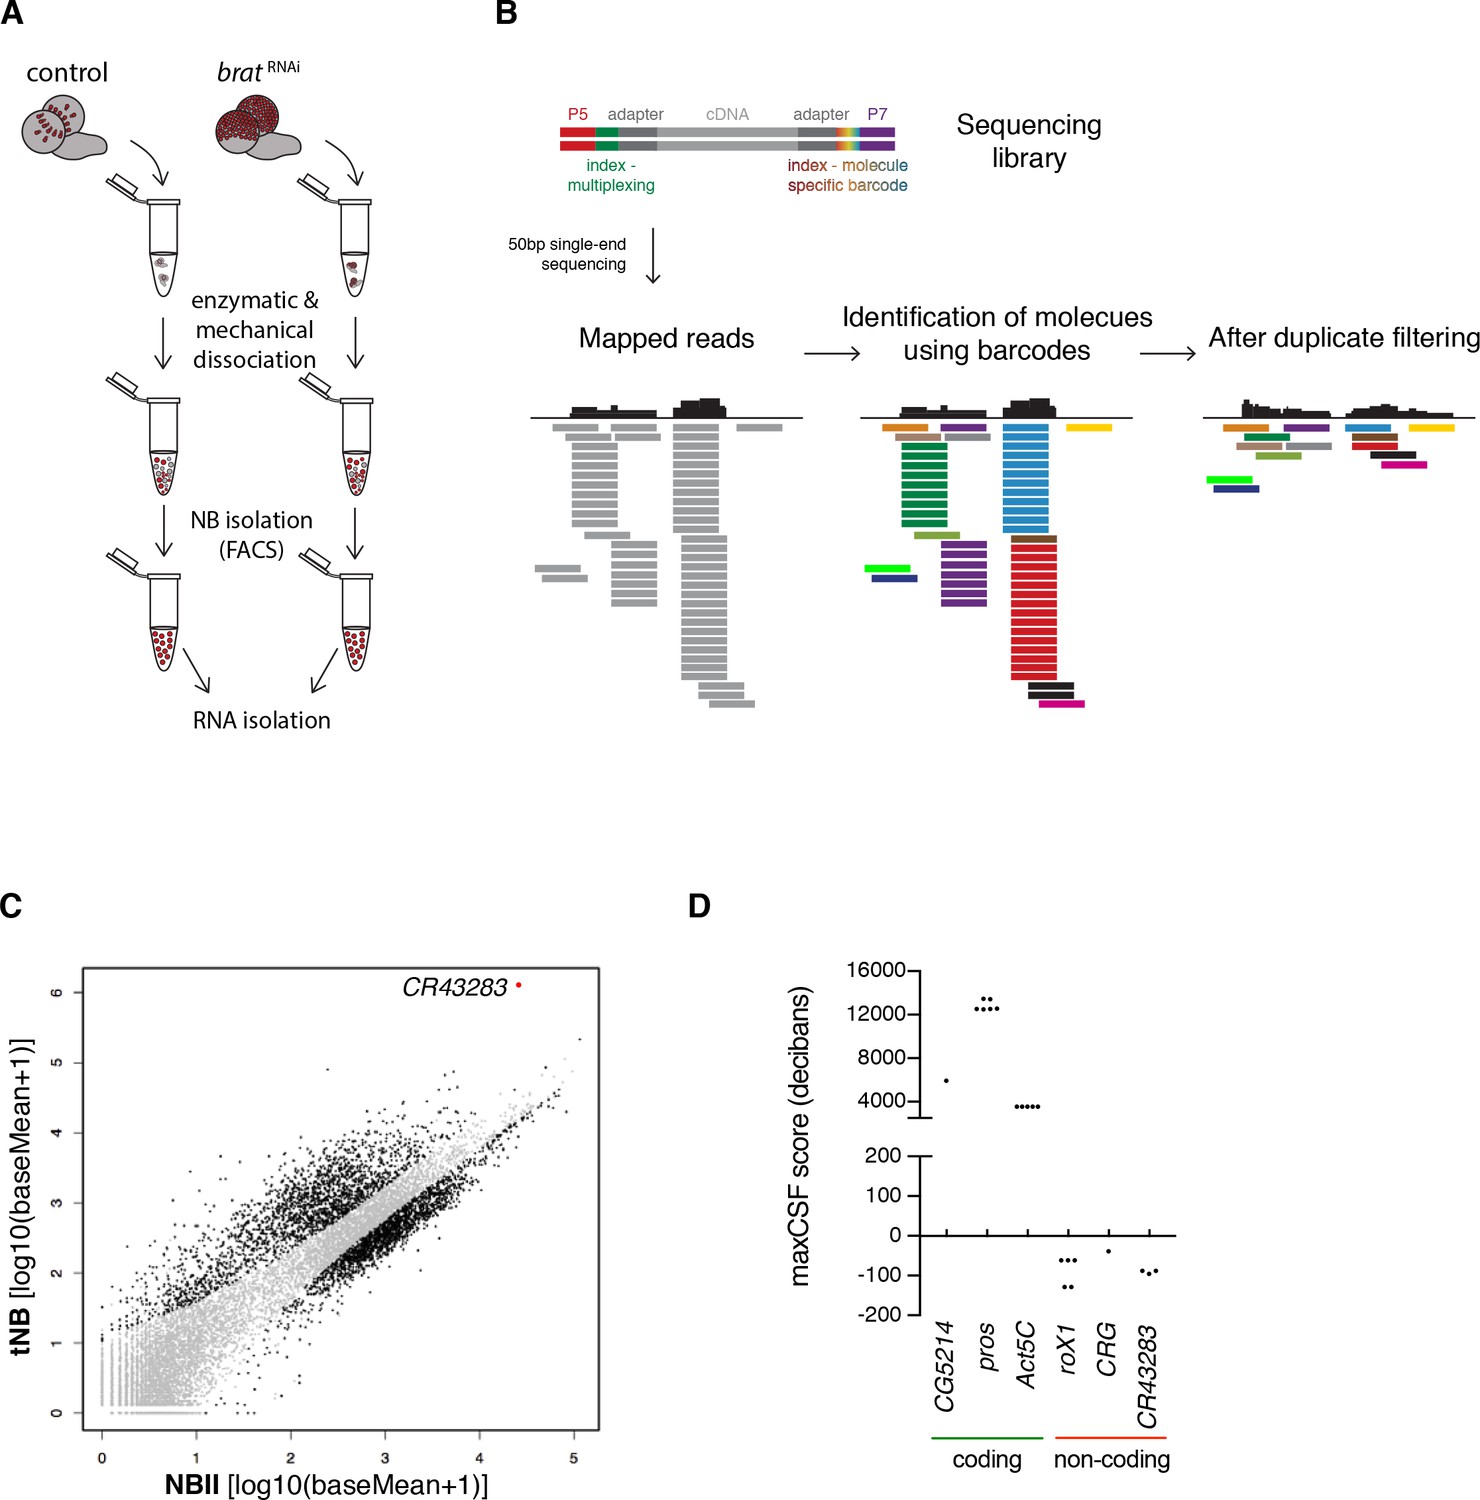
The lncRNA CR43283 is upregulated in brat tumor neuroblasts.
(A) Cartoon illustrating the strategy to isolate NBII and tNBs. (B) Schematic overview of DigiTAG. cDNA fragments of the sequencing library harbor random 8-mer index tags (barcodes) unique for each individual molecule. After sequencing, reads are mapped and barcodes are assigned to each read. Reads with identical barcodes are removed to avoid amplification biases. (C) Scatter plot showing the expression in tNBs and NBIIs of genes detected by DigiTAG. Genes significantly up- or downregulated are shown in black (FDR 0.01, p<0.01), genes unchanged in expression levels in grey. CR43283 (cherub) is highlighted in red. (D) Protein coding genes show positive CSF scores, CR43283 has a negative CSF score (non-coding) similar to well known lncRNAs (roX1, CRG). CSF score for each isoform of a gene is depicted.
Figure 3—figure supplement 1

Confirmation of up- and downregulated genes in brat tumor neuroblasts identified by DigiTAG.
(A–C) Expression of indicated genes of FACS-sorted NBIIs and tNBs expressing UAS-Stinger::RFP under the control of UAS-dcr2; wor-GAL4, ase-GAL80 was measured by qPCR. Data are mean ±SD. Student’s t-test. *p<0.05, **p<0.01, ***p<0.001, ****p<0.0001. (A) brat mRNA levels are significantly reduced upon the expression of brat RNAi. n = 3 biological replicates. Expression of genes identified to be up (B) or downregulated (C) in brat RNAi tNBs compared to control NBIIs are confirmed by qPCR. (B, C) For all tested genes n = 4 biological replicates.
Figure 4 with 1 supplement
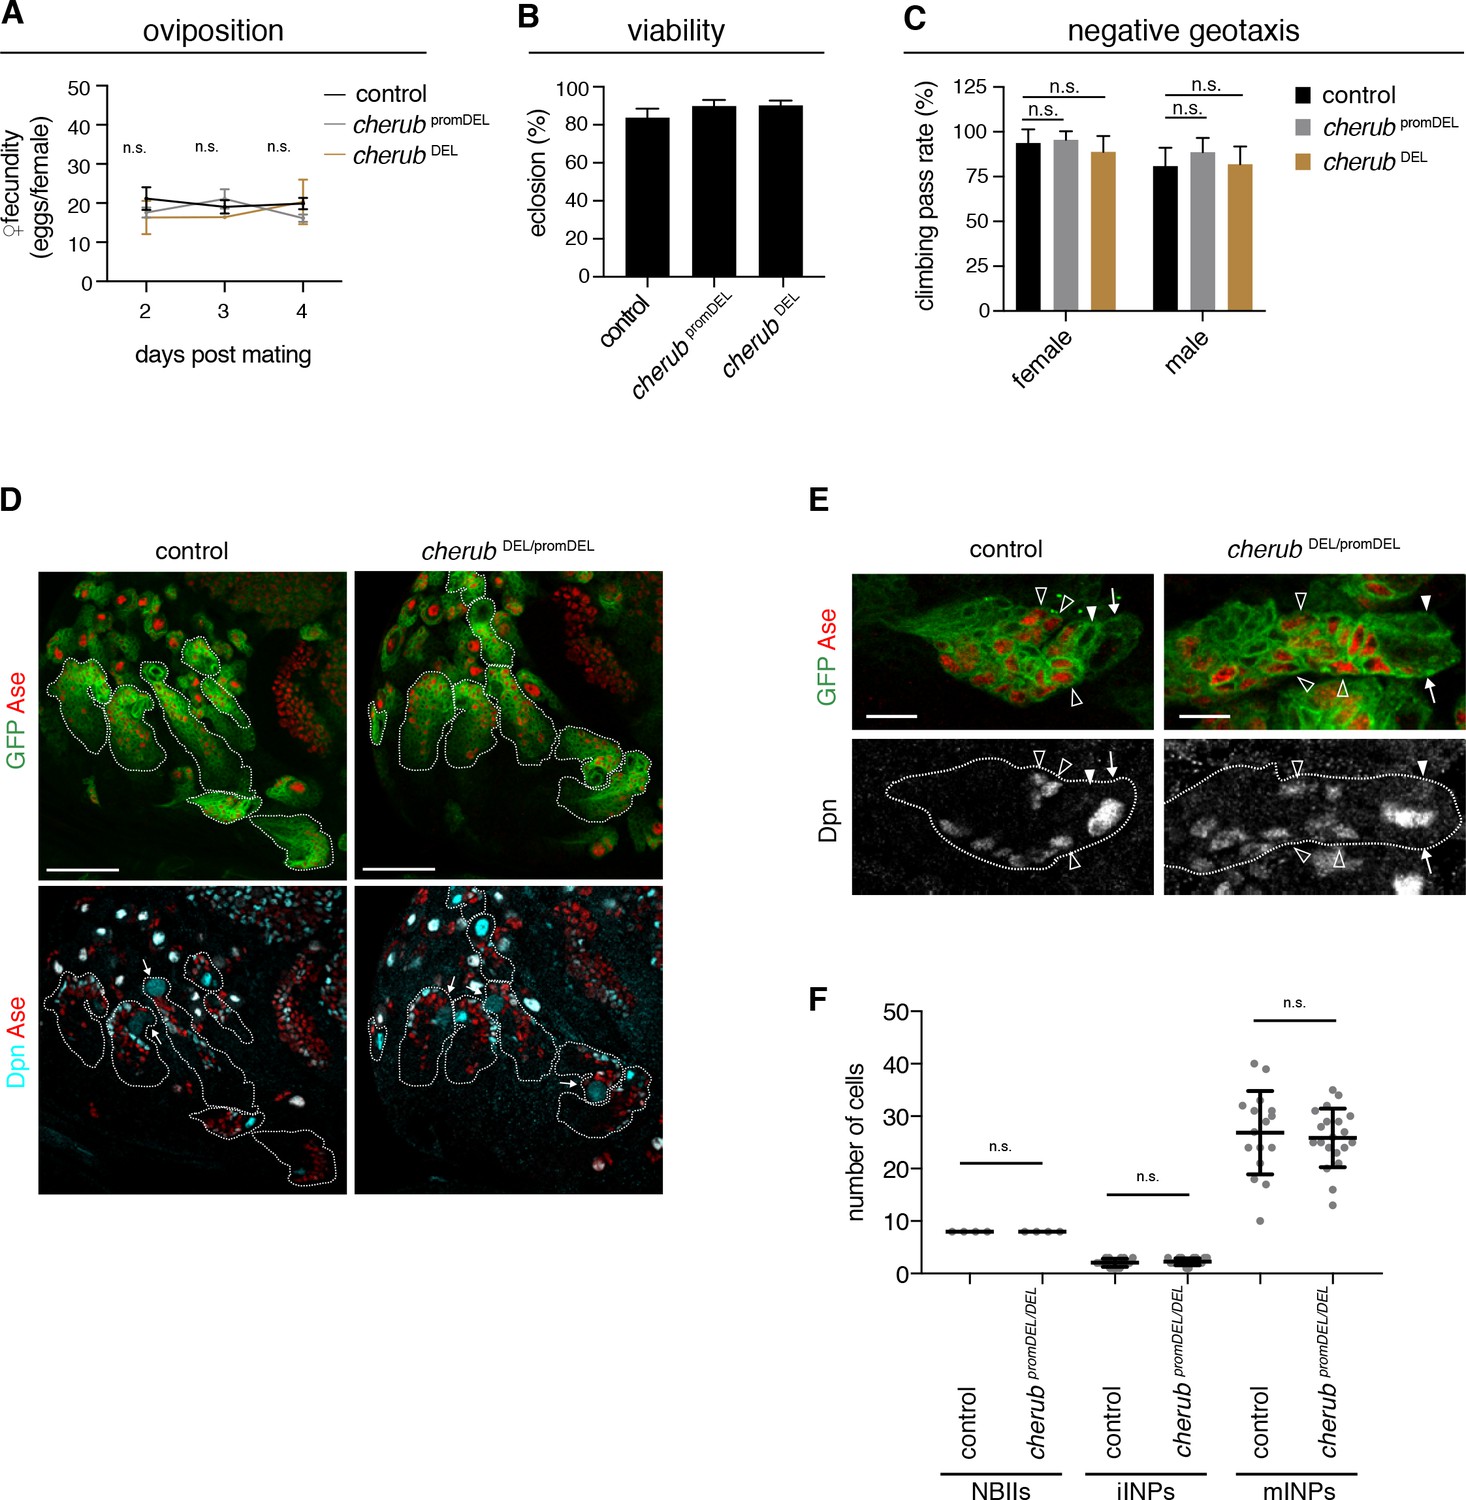
cherub is dispensable for brain development.
(A) Assessment of female fecundity. For each genotype n = 3 independent crosses. Data are mean ±SD. One-way ANOVA. Not significant (n.s.). (B) Fertility and viability of cherub mutants shown as percentage of collected eggs giving rise to adult flies. Per genotype n = 10 replicates each consisting of 100 collected eggs. Data are mean ±SD. (C) Quantification of the negative geotaxis behavior in cherub mutants and control. For each genotype n = 10 replicates, each consisting of 10 adult flies. Data are mean ±SD. One-way ANOVA, not significant (n.s.). (D) NBII lineages (outline) of one brain lobe. NBII marked by Dpn. Dividing NBII show cytoplasmic Dpn staining (arrows). Scale bars 50 μm. (E) Close-ups of control and cherub mutant NBII lineages (outlined) show one single big Dpn+ NBII (arrow), Dpn- Ase- iINP (arrowhead) and Dpn+ Ase+ mINPs (open arrowheads). Scale bars 10 μm. (D, E) UAS-dcr2; insc-GAL4, UAS-CD8::GFP was used to outline NB lineages. (F) Quantifications of large Dpn+ NBIIs (n = 4 brain lobes from four different brains), Ase-Dpn- iINPs and Ase+ Dpn+ mINPs in control (n = 16 lineages from four brain lobes) and cherub mutant (n = 20 lineages from four brain lobes) L3 brains. Error bars show mean ±SD. Student’s t-test. n.s. not significant.
Figure 4—figure supplement 1
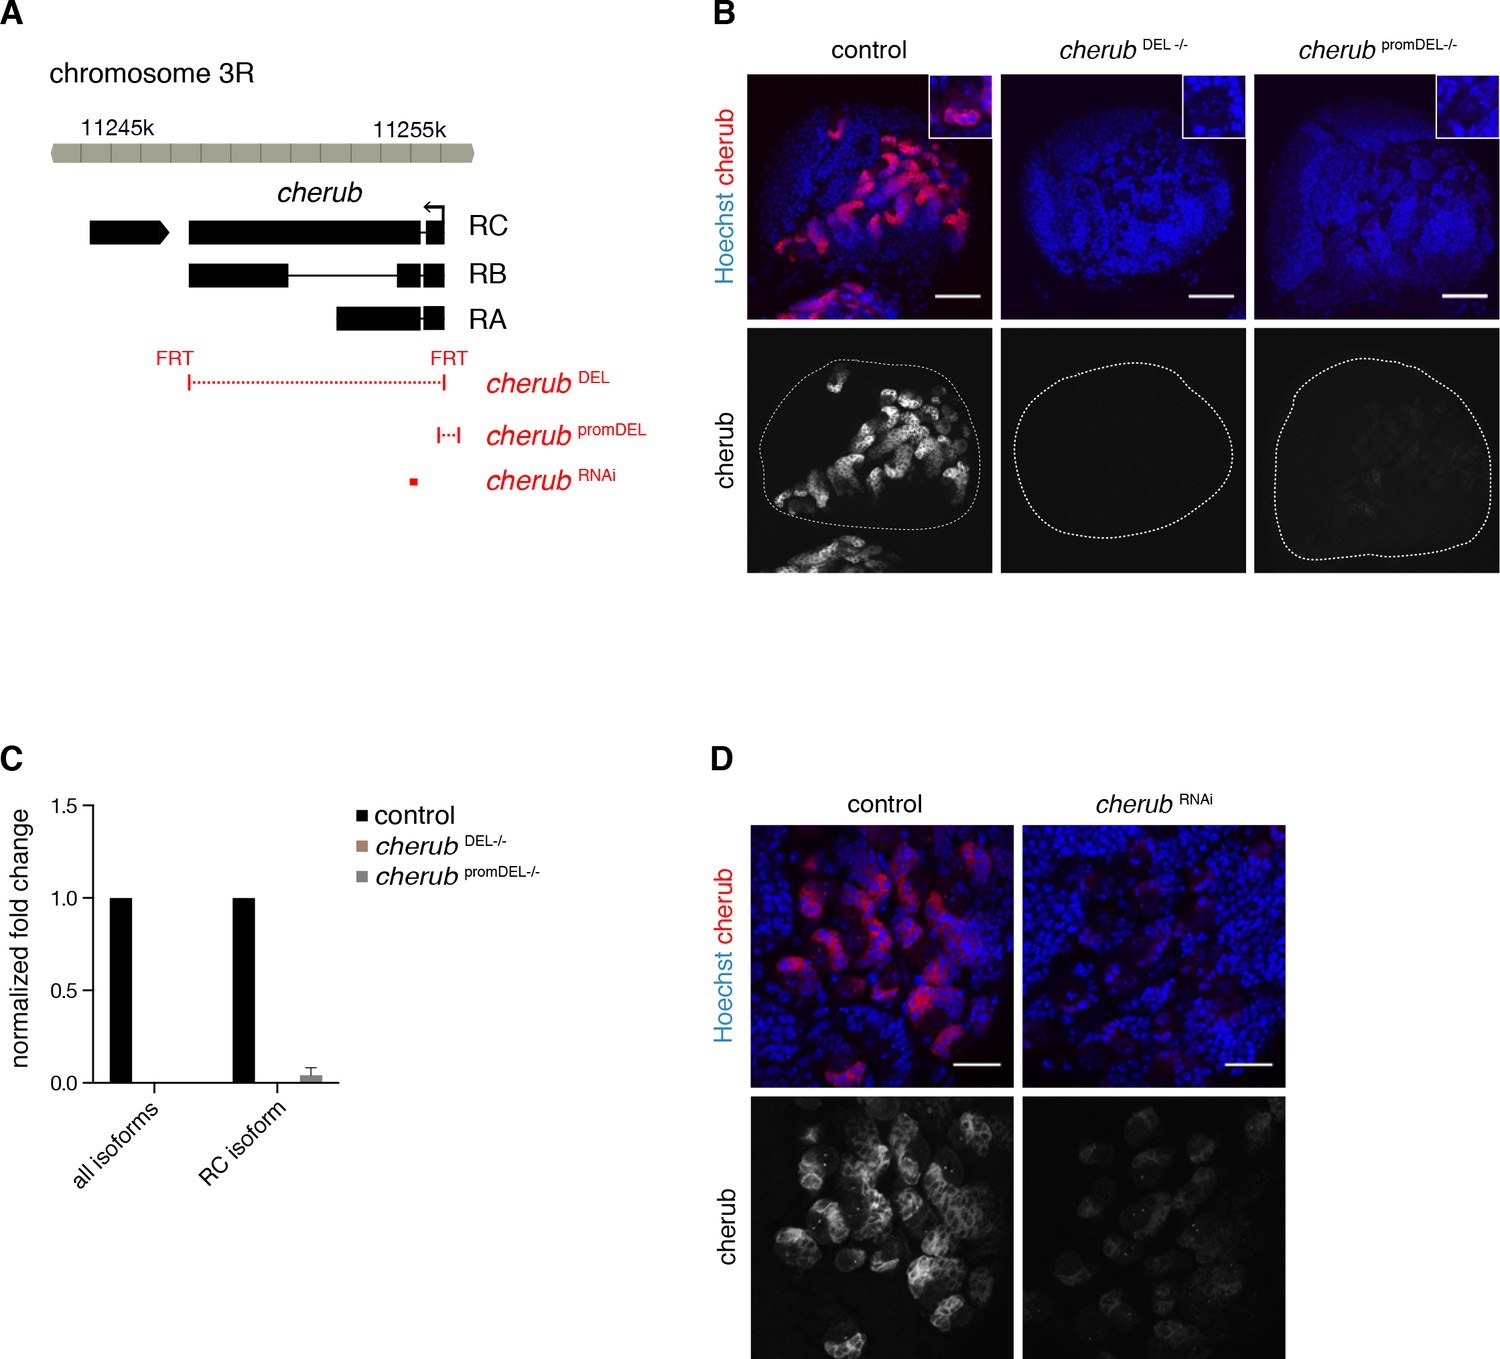
Analysis of cherub mutants.
(A) Overview of the cherub gene locus. Deletions of cherub mutants and target site of cherub RNAi are indicated (red). (B) Overviews of brain lobes (outlined) showing the absence (cherub DEL) or strong reduction (cherub promDEL) of cherub FISH signal in cherub mutants. Scale bars 50 μm. Each close-up shows one NB with surrounding cells. (C) Quantification of cherub transcript levels using qPCR on whole larval brain samples. n = 3 biological replicates. Data are mean ±SD. (D) cherub RNA levels are reduced by expressing cherub RNAi under the control of UAS-dcr2; insc-GAL4, UAS-CD8::GFP. Scale bars 20 μm.
Figure 5 with 1 supplement
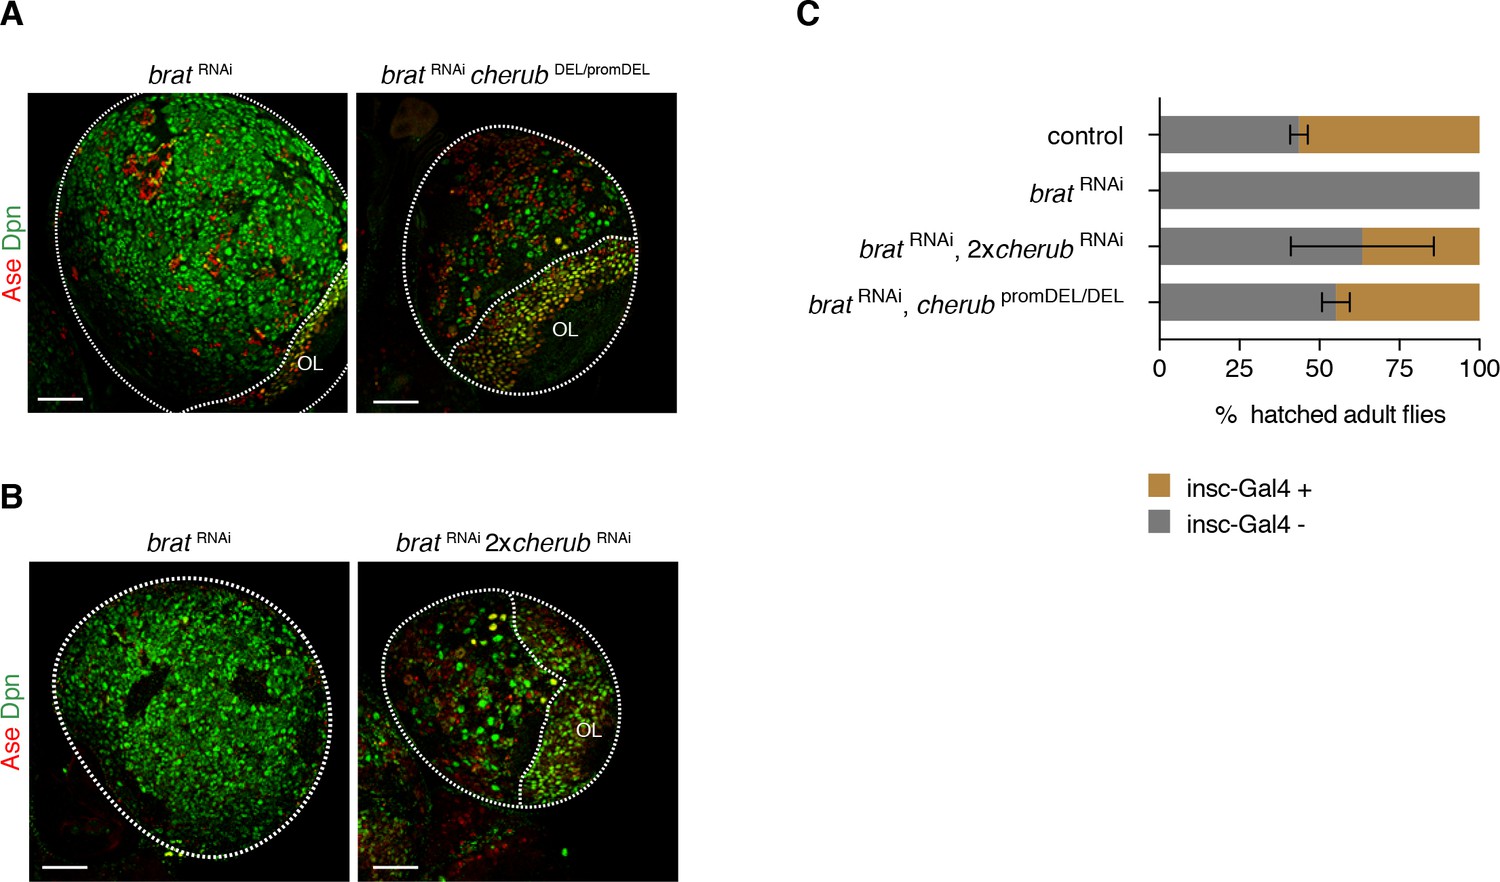
cherub is required for brat tumorigenesis.
(A, B) Brain lobes (outlined) stained for Dpn (NB marker) and Ase (differentiating cells). OL, optic lobe. Scale bars 50 μm. Driver line was UAS-dcr2; insc-GAL4, UAS-CD8::GFP. (C) Percentage of hatched adult flies. brat RNAi flies were crossed to insc-GAL4/CyO. Flies with brat RNAi that inherit the balancer CyO hatch, but those with insc-GAL4 die. cherub mutants rescue the survival of insc-GAL4 + brat RNAi expressing flies. n = 2 independent experiments per genotype. For each genotype per experiment ≥50 flies were counted. Data are mean ±SD.
Figure 5—figure supplement 1
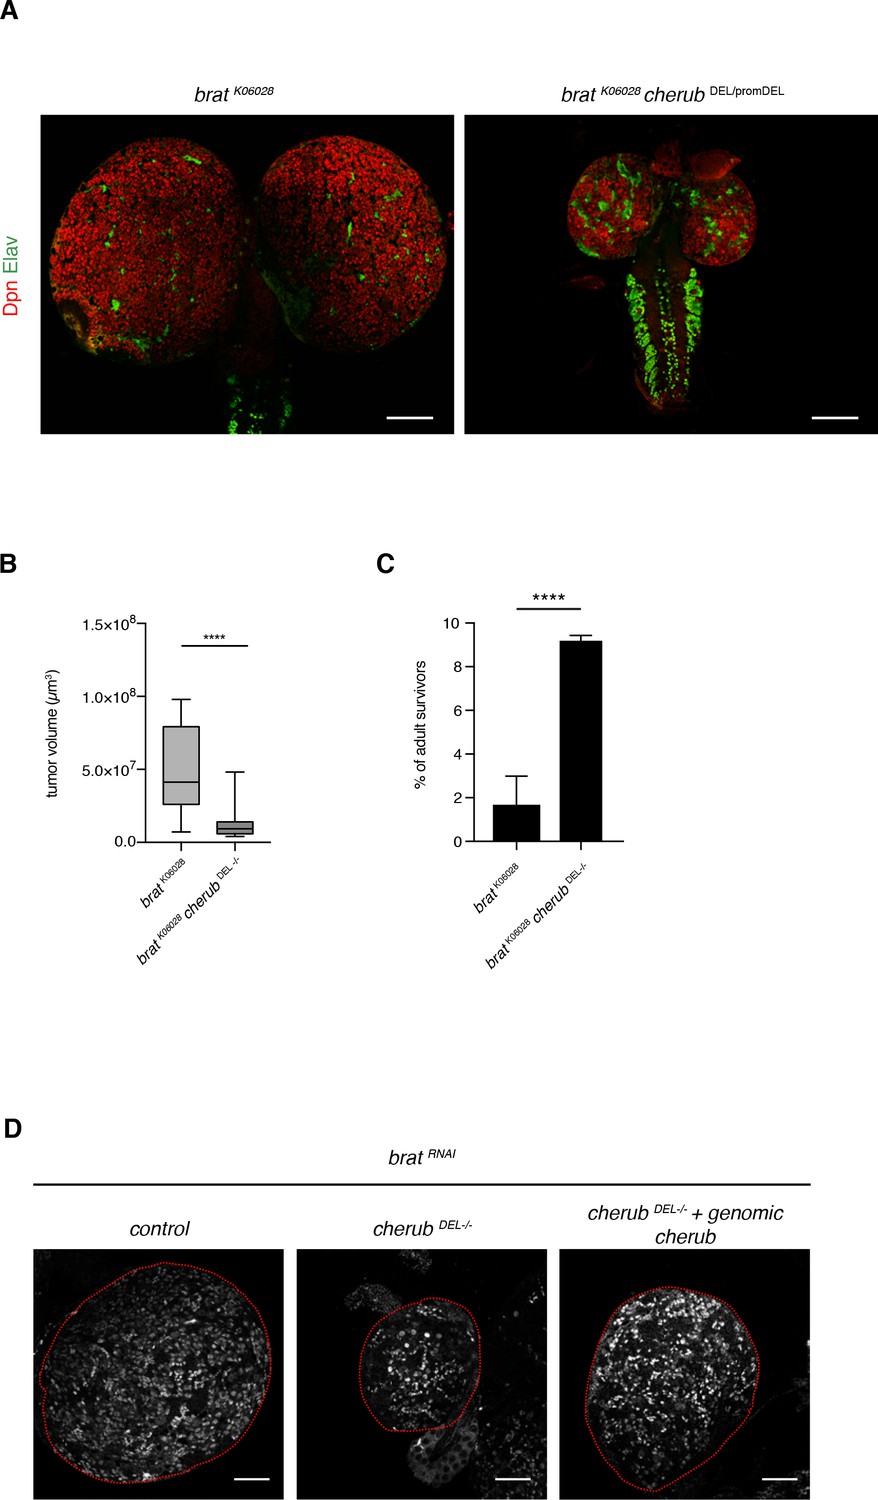
cherub reduces tumor growth in brat mutants.
(A) Representative images of brat and brat cherub mutant larval brains (NB marker Dpn, neuron marker Elav). Scale bars 100 μm. (B) Quantification of brat mutant (n = 17 brain lobes) and brat cherub double mutant (n = 19 brain lobes) tumor volumes. Results are pooled from two independent experiments. Student’s t-test. ****p<0.0001. (C) The percentage of surviving adult escapers is increased in brat cherub double mutants compared to brat mutants. n = 4 independent crosses per genotype. For each genotype per experiment ≥76 flies were counted. Mean ±SD is shown. Student’s t-test. ****p<0.0001. (D) The cherub genomic rescue construct increases the number of Dpn+ tNBs in cherub DEL-/- brat RNAi brains. Brains are outlines. Scale bar 50 µm. Driver line was UAS-dcr2; insc-GAL4, UAS-CD8::GFP.
Figure 6 with 3 supplements
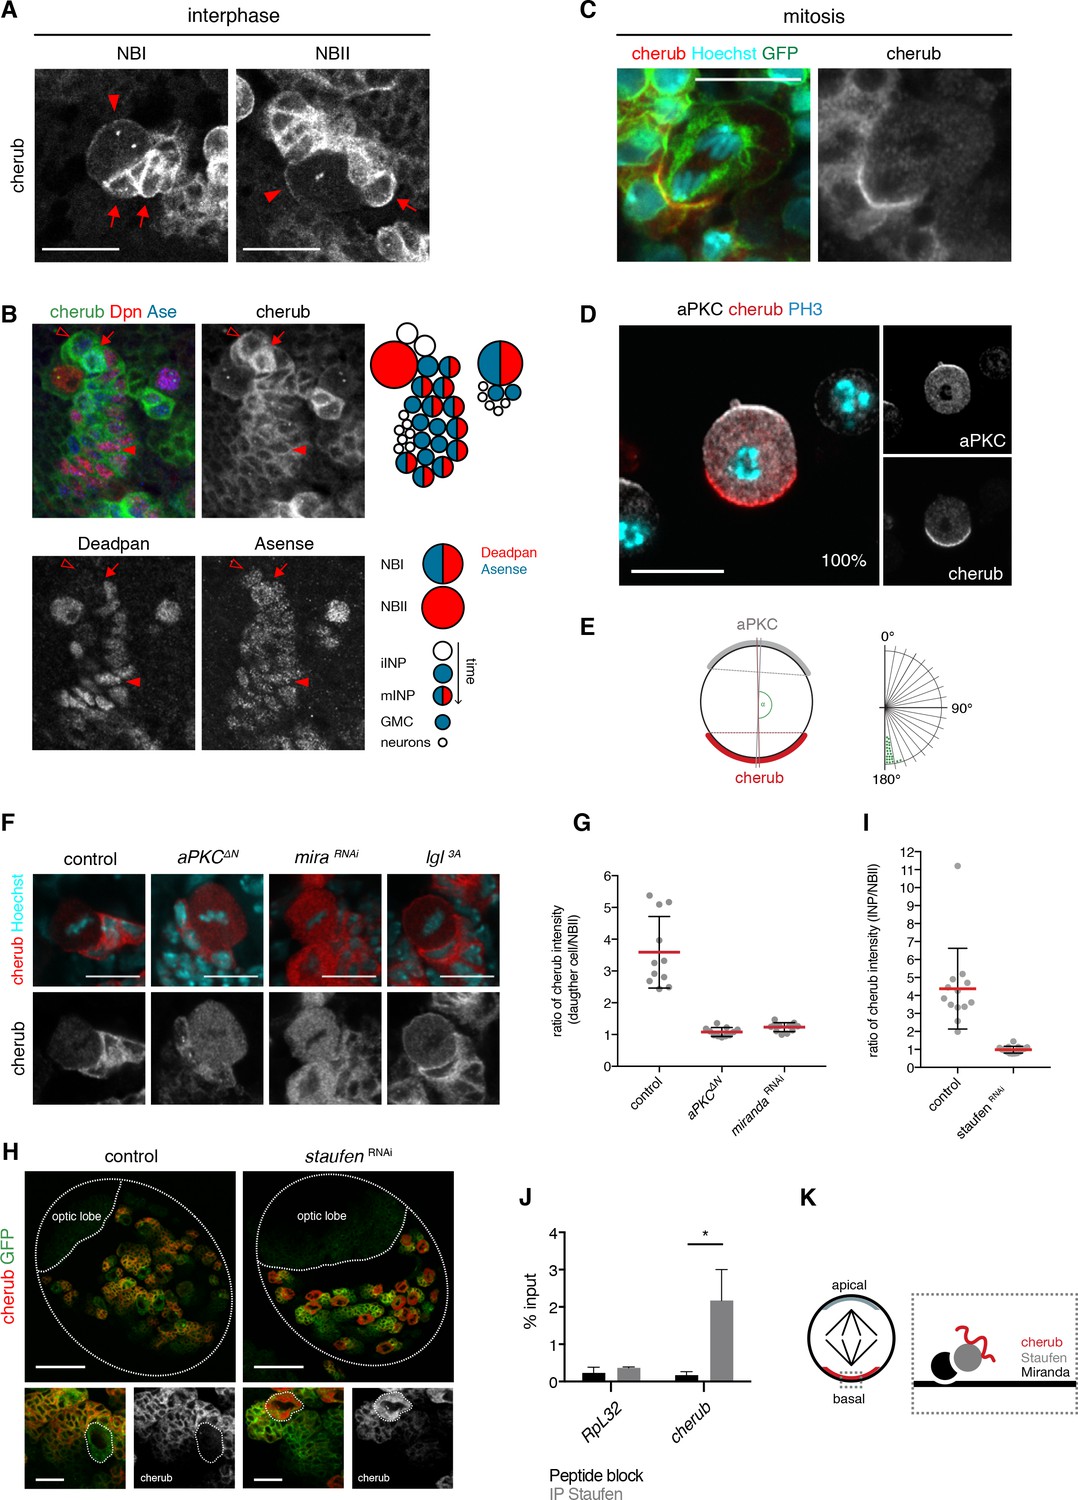
The RNA-binding protein Staufen segregates cherub asymmetrically into the INP upon cell division.
(A) Close-up images of NB clones in interphase. In NBs (arrowhead) cherub FISH signal is detected as two dots and cortically enriched. Nearest daughter cells (arrows) show high cherub levels in the cytoplasm. Scale bars 20 μm. (B) Close-up of a NBI and a NBII lineage. Cell types are defined by cell size and the marker combination of Dpn and Ase according to the cartoon. Newly born Dpn- iINPs (open arrowhead) have higher cherub levels than older Dpn+ Ase+ mINPs (arrowhead). Mitotic INPs show uniform cytoplasmic cherub localization (arrow). (C) Close-up images of cherub localization in a mitotic NBII outlined by membrane-bound GFP in vivo. Scale bar 10 μm. (D) Representative image of a dividing NBII in vitro. 100% of mitotic NBIIs show cherub crescents (E) opposite to the apical aPKC crescent as measured by the angle between aPKC and cherub crescents. An angle of 180° corresponds to crescents opposite each other. n = 23 NBIIs. Scale bar 10 μm. (F) Expressing constitutively active Lgl (Lgl3A) leads to a uniformly cortical distribution while constitutively active aPKC (aPKCΔN) or miranda (mira) knockdown displaces cherub from the cell cortex. Scale bars 10 μm. (G) Ratios of cytoplasmic cherub intensity of INP (or daughter cell) and NBII are depicted. In control, asymmetric cell division leads to higher cherub levels in INPs (n = 11 NB-INP pairs from four different brains). Upon the expression of aPKCΔN (n = 11 NB-daughter cell pairs from four different brains) or miranda RNAi (n = 12 NB-daughter cell pairs from four different brains), cherub levels are similar in NBIIs and their recently born (closest) daughter cell. Data are mean ±SD. (H) cherub localization in control and upon staufen knockdown. Brain lobes (top) and NBII (bottom) are outlined. Scale bars 50 and 10 μm. Driver line was UAS-dcr2; insc-GAL4, UAS-CD8::GFP. (I) In contrast to control (n = 13 NBII-INP pairs of 4 different brains), staufen depletion leads to similar cytoplasmic cherub levels between INP and NBII (n = 15 NBII-INP pairs of 4 different brains). Data are mean ±SD. (J) RIP-qPCR analysis for cherub and the non-Staufen target RpL32. Note that brain lysates from brat k06028 mutants were used to enrich for NBs as cherub is only cortically localized in NBs. Data are mean ±SD. n = 3 independent RIP-qPCR experiments, Student’s t-test. *p<0.05. (K) Cartoon of a mitotic NB with apical and basal crescents. Close-up of the basal crescent (right) shows that the Staufen-Miranda complex localizes cherub to the plasma membrane.
Figure 6—figure supplement 1
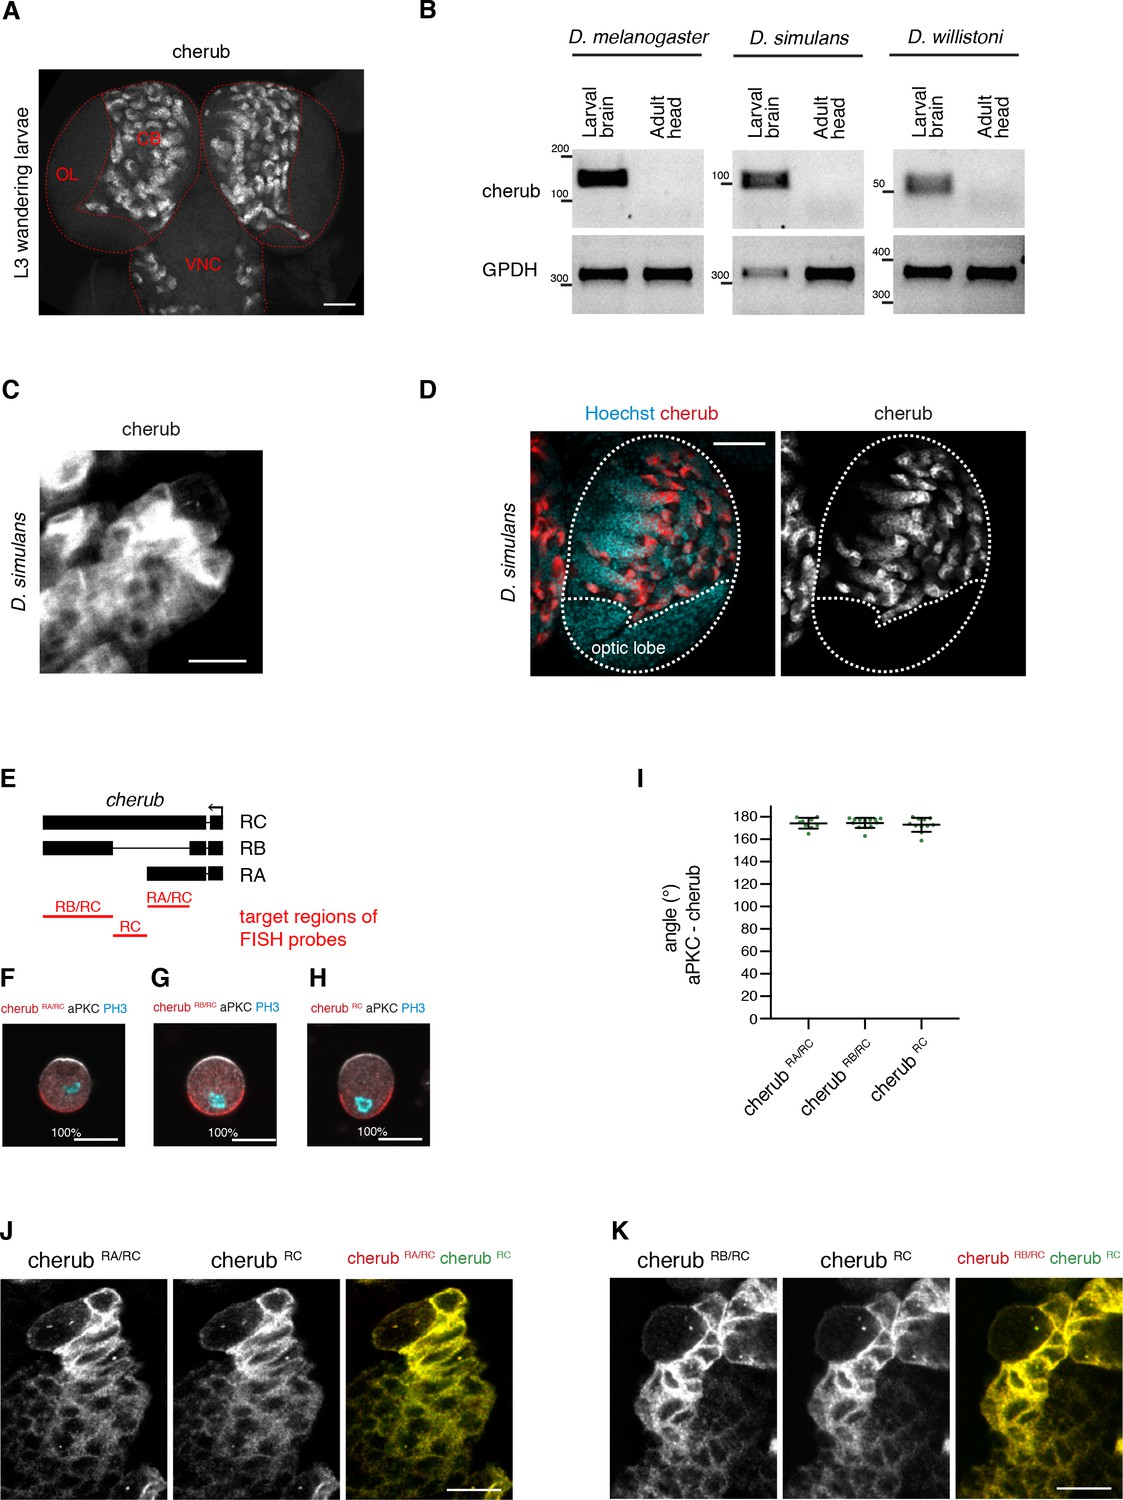
The expression and localization of cherub in the Drosophila CNS.
(A) Overview of a larval brain showing cherub expression in the central brain (CB) and ventral nerve cord (VNC), but not in the optic lobe (OL). Scale bar 50 μm. (B) RT-PCR analysis on larval brain and adult head samples showing similar cherub expression patterns between D. melanogaster, D. simulans and D. willistoni. (C, D) cherub expression in larval neuroblast (arrow) and daughter cells in D. simulans (C) and (D) larval brain lobe (outlined). Scale bars 10 μm (C) and 50 μm (D). (E) Overview of regions targeted by isoform-specific FISH probes. (F–H) Representative images and percentages of mitotic NBII with cherub crescents in vitro. Scale bars 10 μm. (I) Angle between cherub isoforms and aPKC crescents. Data are mean ±SD. (F–I) RA/RC n = 9 NBIIs, RB/RC n = 13 NBIIs, RC n = 11 NBIIs. (J, K) Localization of cherub isoforms in NBIIs and daughter cells in vivo.
Figure 6—figure supplement 2
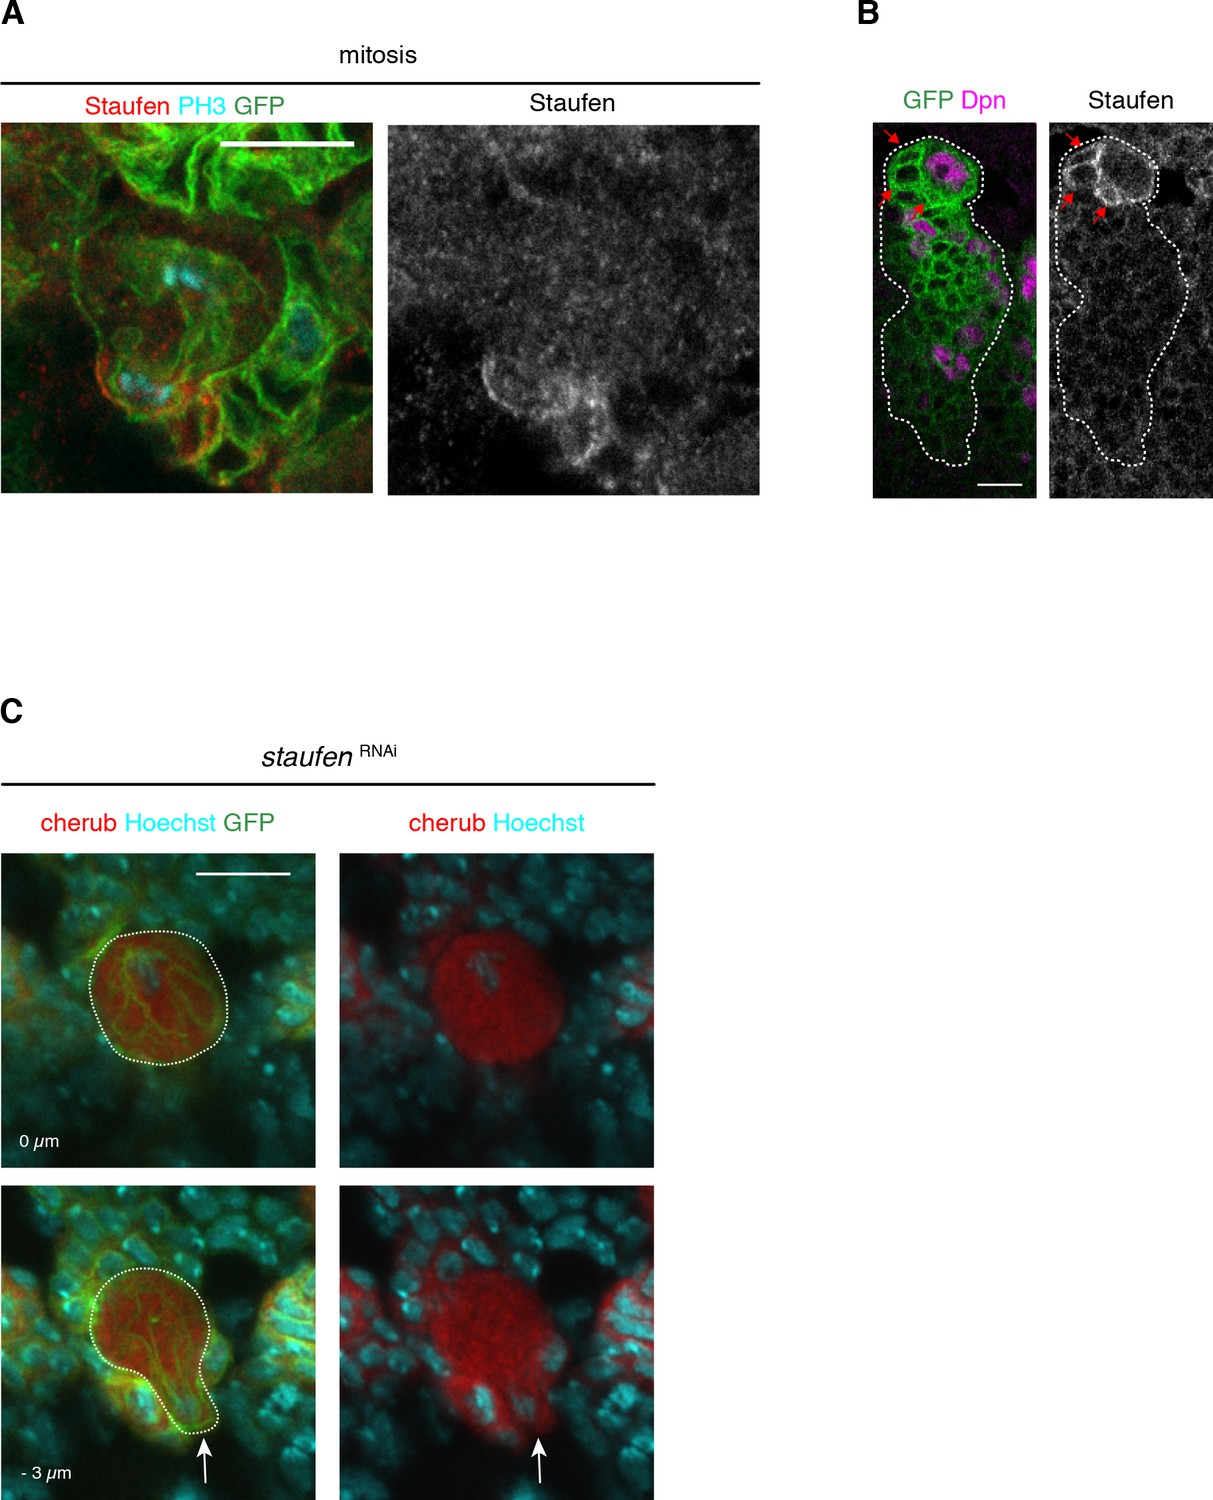
Staufen, similar to cherub, is asymmetrically segregated from the NBII into INPs.
(A) Close-up images of Staufen localization in a dividing NBII marked by membrane-bound GFP. (B) Images of NBII and daughter cells marked by membrane-bound GFP showing Staufen enrichment in the most recent born iINPs (arrows), which are identified by the closest NBII proximity and the lack of Dpn. (C) Upon staufen depletion, cherub is not enriched at the basal cell pole (arrow) of in mitotic NB (dashed outline). (A–C) Scale bars 10 μm. Lineages marked with UAS-dcr2; insc-GAL4, UAS-CD8::GFP.
Figure 6—figure supplement 3

cherub transcripts harbor conserved secondary RNA structures.
(A) Overview of the genomic region of cherub. Two measurements of evolutionary conservation are depicted, PhyloP (Basewise conservation) and phastCons (Element conservation). Below, pairwise alignments of 27 D. species with D. melanogaster. Darker grey values indicate higher levels of conservation as scored by phastCons. Ns in the gap region are marked in yellow, one or more unalignable bases in the gap region are shown as double line and a discontinuity is highlighted with a blue bar. A scheme of the phylogenetic tree depicts the relationship between different Drosophila species (left). Sequence repeats and evolutionary conserved RNA structures are depicted. (B) Pairwise sequence identity of the cherub locus. Complete linkage clustering of the Euclidean distance of percent sequence identity between the genomic loci of different D. species. (C) RNAz-predicted stem structures (corresponding to red secondary structures in (A)) resemble Staufen binding sites. Shades of color indicate absence (dark) or presence (bright) of mutations preventing base pairing in some sequences of the alignment. For stem 4, multiple sequence alignments are shown.
Figure 7 with 1 supplement
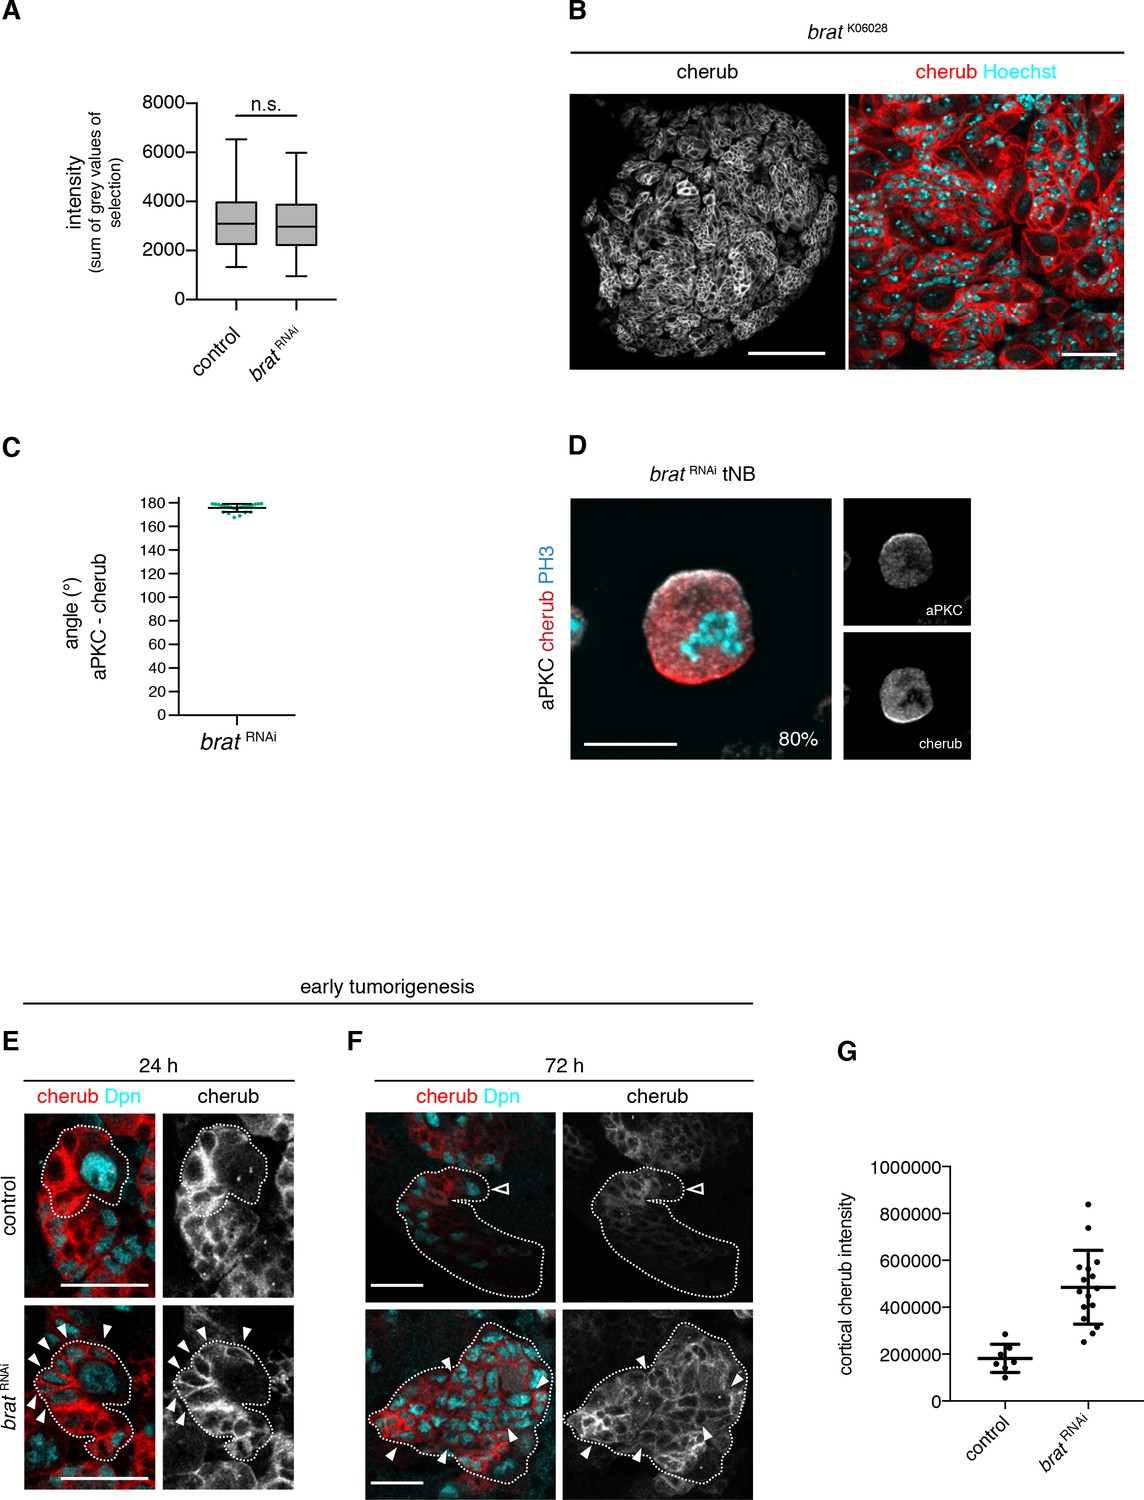
The asymmetrically segregated lncRNA cherub accumulates in brat tumor neuroblasts.
(A) Intensity measurements of nascent cherub transcript in NBIIs (n = 43 NBs) and brat tNBs (n = 43 tNBs) from three independent FISH experiments. Student’s t-test. Not significant (n.s.) p>0.05. (B) cherub localization in a brat mutant brain lobe (left, scale bar 100 µm) and close-up of tNBs (right, scale bar 20 µm). (C) Quantification of the angle between aPKC and cherub crescents of mitotic tNBs in vitro. An angle of 180° corresponds to a basal cherub crescent. n = 23 mitotic tNBs. Mean ±SD is shown. (D) Representative image of a mitotic tNB in vitro. Scale bar 10 μm. Percentage of tNBs showing a cherub crescent during cell division is indicated. n = 82 mitotic tNBs. (E, F) cherub expression in NBII clones (outlined) induced with the TARGET system for 24 hr (E) or 72 hr (F). Arrowheads exemplify Dpn+ tNBs and the open arrowhead marks the NBII. Scale bars 20 μm. UAS transgenes are expressed by UAS-dcr2; wor-GAL4, ase-GAL80; UAS-CD8::GFP. (G) Quantification of cortical cherub intensity after 72 hr clone induction. Control n = 7 NBIIs and brat RNAin = 16 tNBs. Data are mean ±SD. Student’s t-test and ****p<0.0001.
Figure 7—figure supplement 1
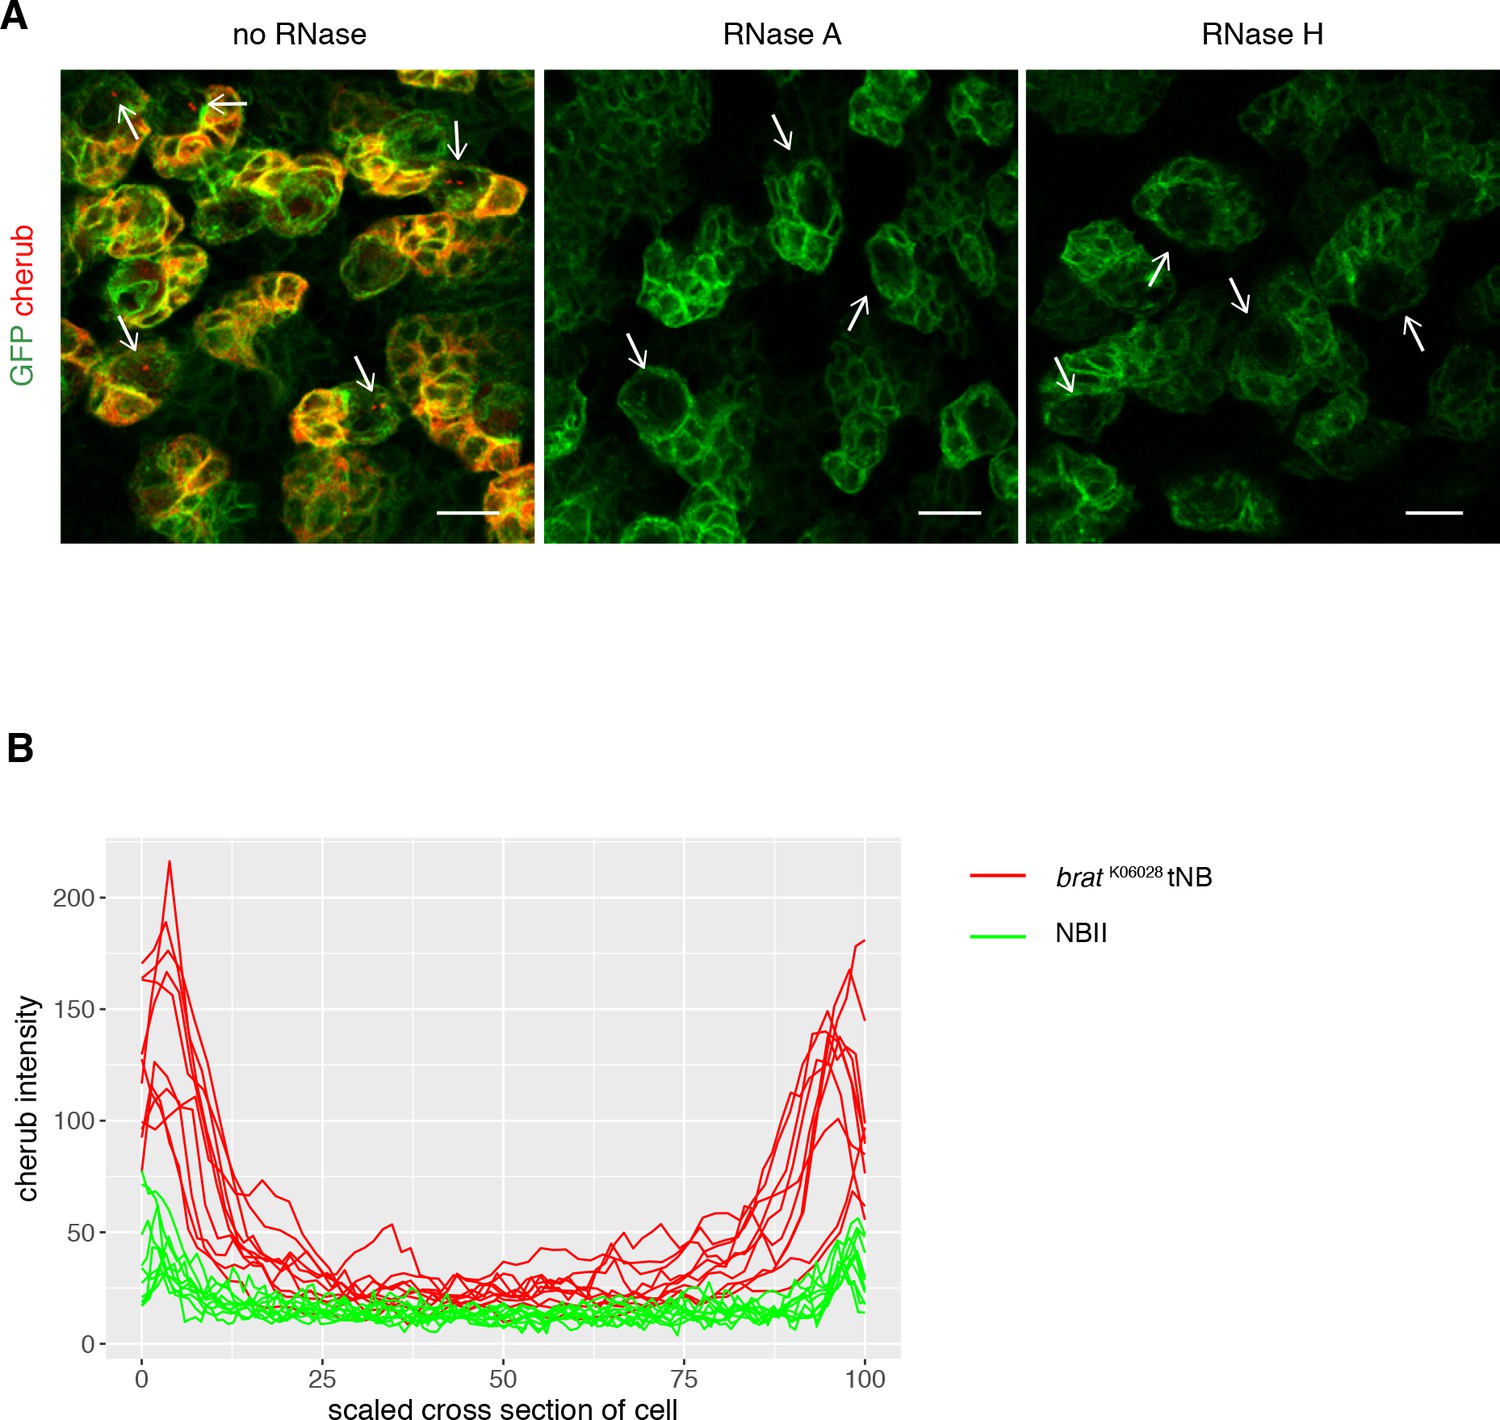
Cortical cherub levels are increased in brat tNBs.
(A) Representative images show NB linages marked by insc-GAL4; UAS-CD8::GFP. FISH signals from the probe set against cherub, including nuclear foci in NBs (arrows), were abolished upon RNase treatment. RNase H treatment was performed post-hybridization to allow DNA oligonucleotide probes to bind to its target RNAs, as RNase H specifically cleaves RNA/DNA duplexes. Scale bars 10 µm. (B) cherub intensity measurements across cells show higher cherub at the periphery (cortex) of tNBs than of NBIIs. For each condition n = 10 NBs.
Figure 8 with 1 supplement

Temporal neuroblast identity controls brat tumor growth.
(A) The expression of genes characteristic for a young NB identity are upregulated in tNBs compared to control NBIIs. Depicted is the log2 foldchange in expression of NBIIs versus tNBs. (B) Cartoon depicting the control of larval temporal NB identity by opposing RNA-binding protein (RBP) gradients (C) Expression of the early NB identity gene Imp in brat RNAi and brat RNAicherub DEL/promDEL tNBs. (D) Syncrip localization in brat RNAi and brat RNAicherub DEL/promDEL tNBs. (C, D) Scale bars 10 μm. Driver line UAS-dcr2; wor-GAL4, ase-GAL80; UAS-CD8::GFP. Membrane-bound GFP outlines tumor tissue. (E, F) Survival rates of adult flies bearing primary control tumors or rejuvenated (orange) or aged (purple) brat tumors. Student’s t-test. ****p<0.0001, n ≥ 4 independent survival experiments. 50% survival rate shown as mean ±SD. (G, H) Overview of brat brain lobes (outlined) stained with the NB marker Dpn upon downregulation of Imp (G) or Syp (H). Scale bars 50 μm. (I, J) Quantification of tumor volume from three independent experiments. Data are mean ±SD. Student’s t-test. ****p<0.0001. (I) Knockdown of Imp (n = 15 brain lobes) results in smaller tumors compared to control tumors (n = 13 brains lobes). (J) Tumors with reduced Syp levels (n = 15 brain lobes) are larger than control tumors (n = 14 brain lobes). (E–J) Transgenes were expressed using the NBII-specific driver line UAS-dcr2; wor-GAL4, ase-GAL80; UAS-CD8::GFP.
Figure 8—figure supplement 1
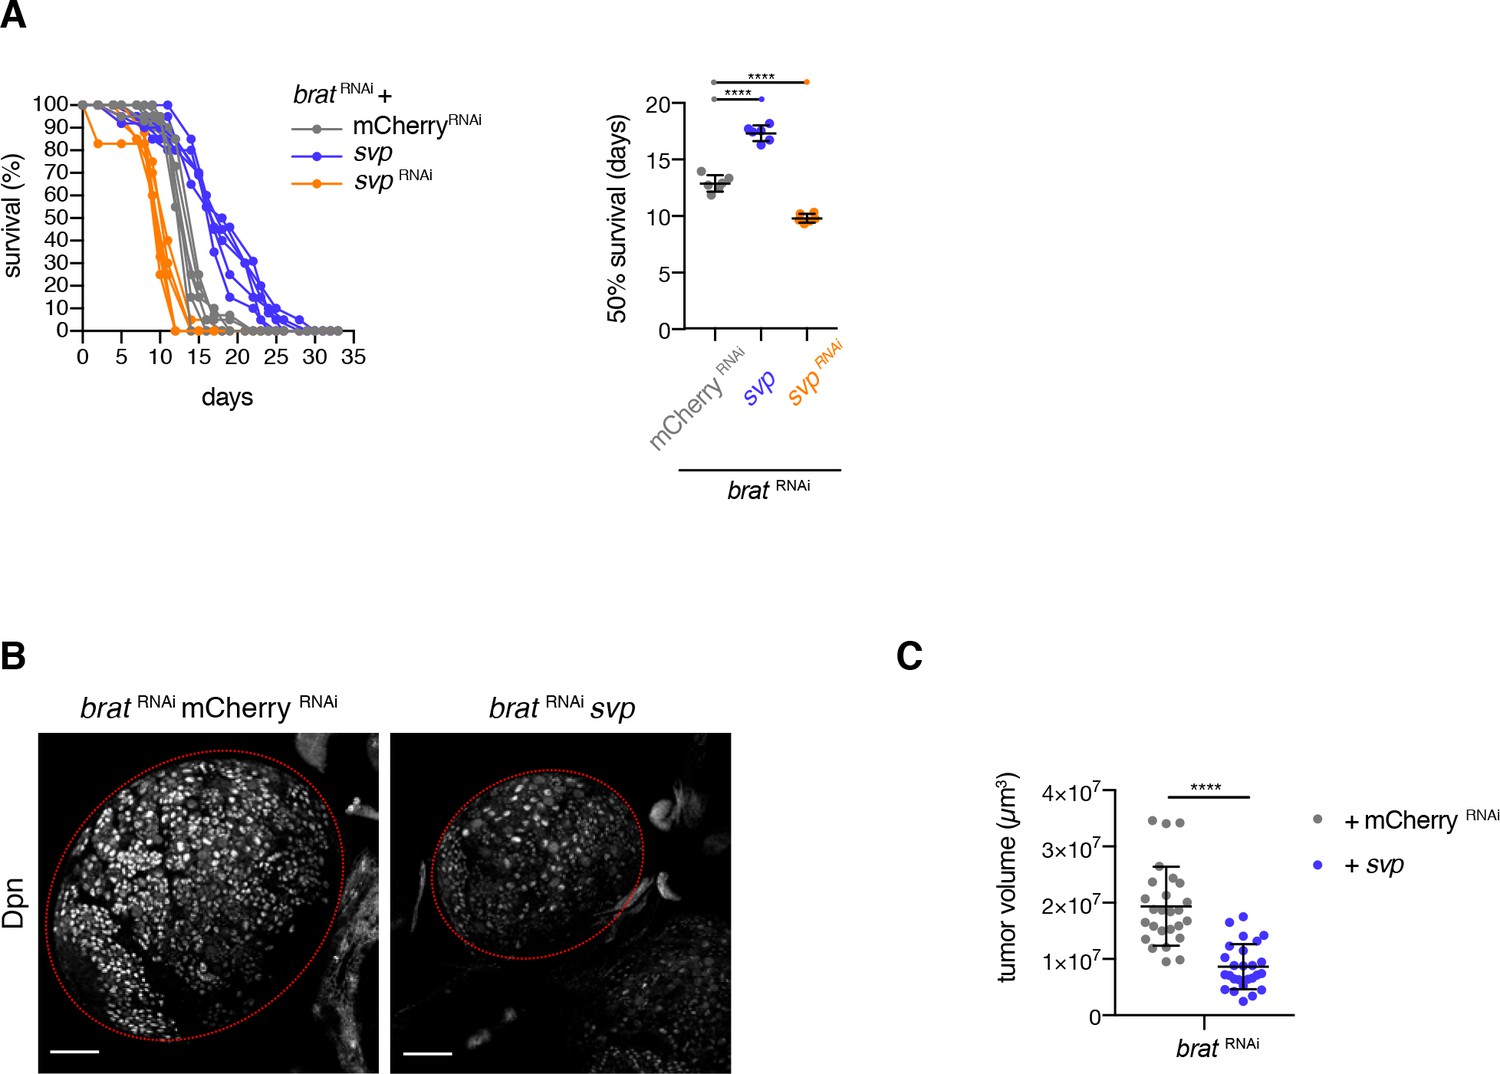
brat tumor growth requires a young neuroblast identity.
(A) Survival rates of adult flies bearing primary control tumors or svp RNAi (rejuvenated, orange) or svp overexpression (aged, purple) brat tumors. 50% survival rates shown as mean ±SD. Student’s t-test. ****p<0.0001, n = 6 independent survival experiments. (B) Overview of brat brain lobes (outlined) stained with the NB marker Deadpan (Dpn) upon overexpression of svp. Scale bars 50 µm. (C) Overexpression of svp (n = 26 brain lobes) reduces brat tumor size compared to control tumors (n = 26 brain lobes). Quantification of tumor volume from three independent experiments. (A–C) Transgenes were expressed using the NBII-specific driver line UAS-dcr2; wor-GAL4, ase-GAL80; UAS-CD8::GFP.
Figure 9 with 1 supplement
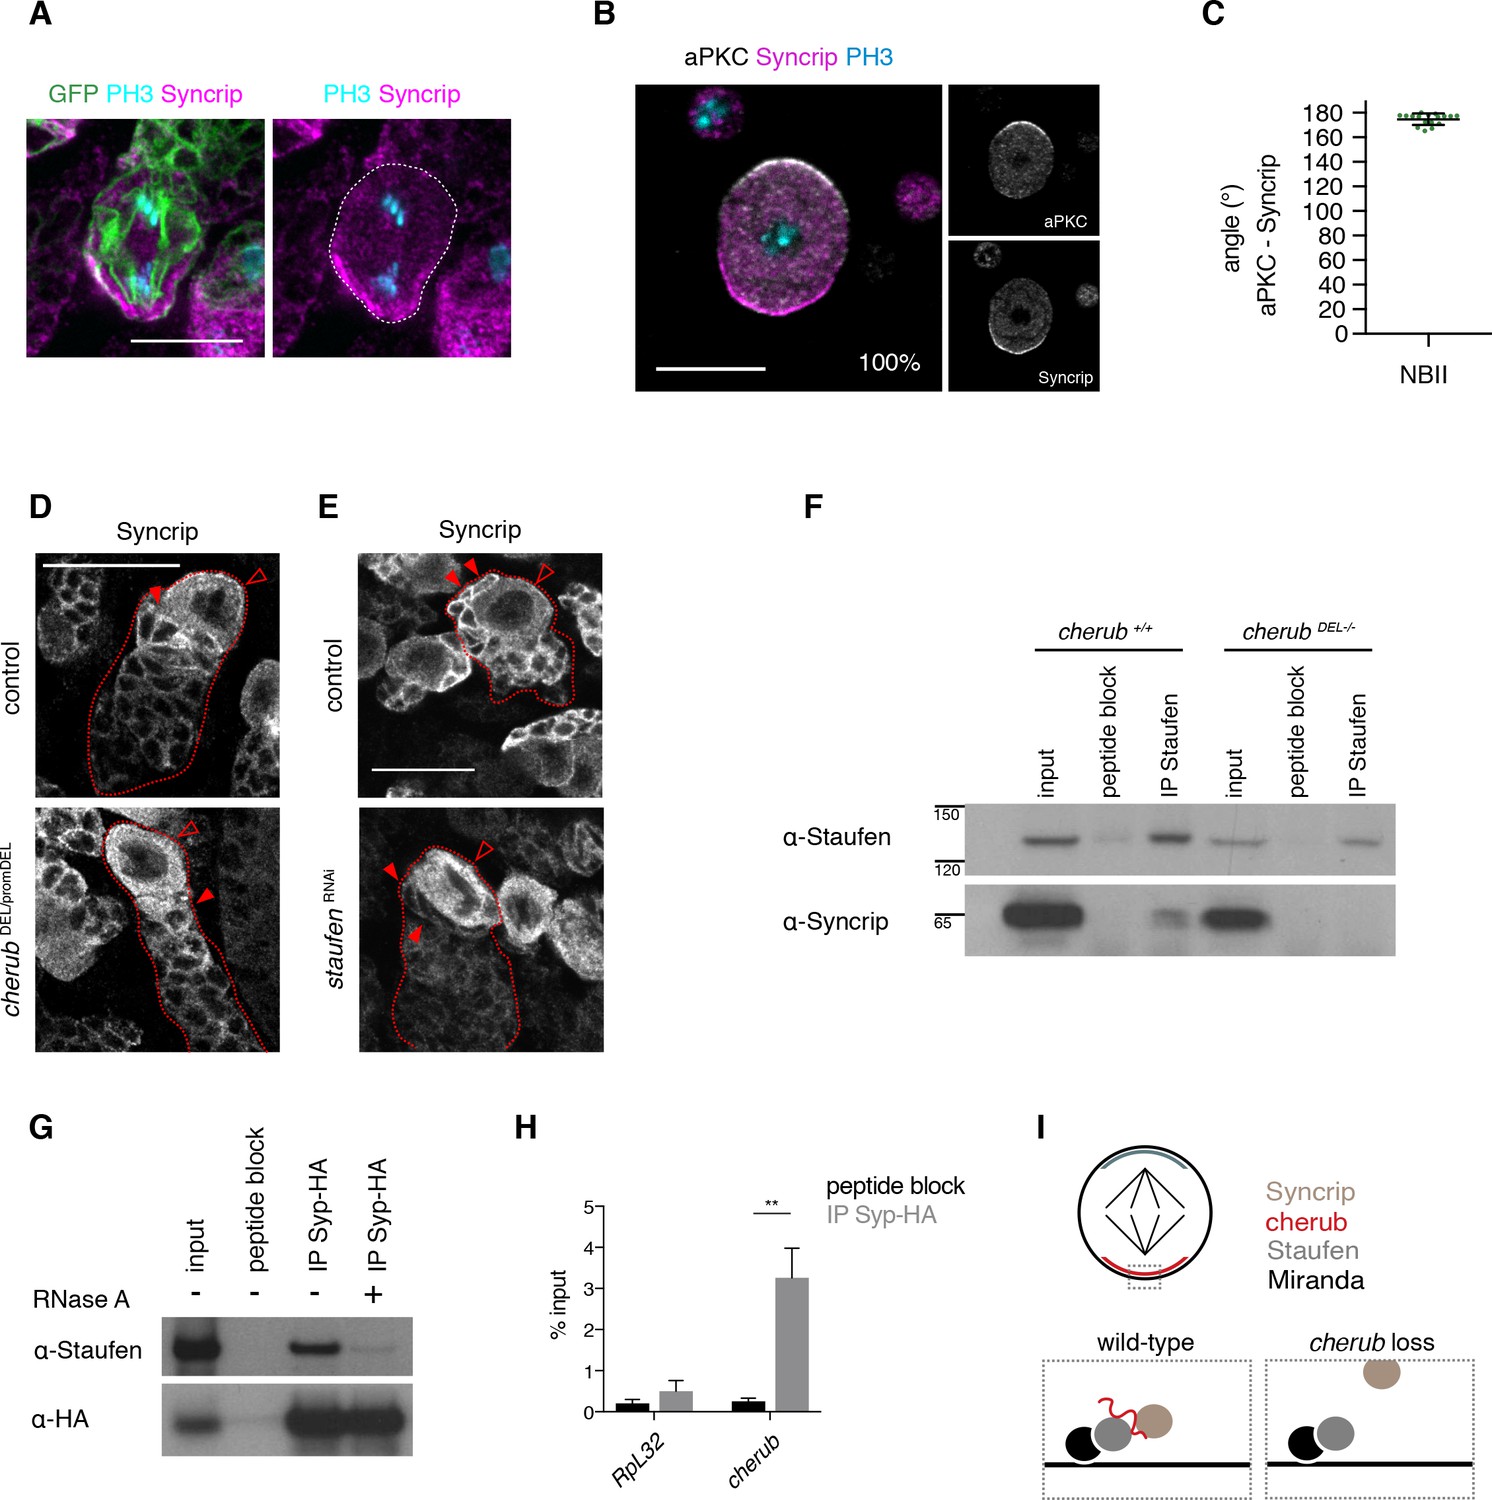
cherub facilitates the binding between Staufen and the late temporal factor Syncrip.
(A) Syncrip (Syp) localization in a mitotic NB (outlined) in vivo. Scale bar 10 μm. (B) Representative image and percentages of mitotic NBIIs in vitro showing Syp crescents. n = 17 mitotic NBIIs. Scale bar 10 μm. (C) Angle measurement between Syp and apical aPKC crescents. n = 17 mitotic NBIIs. Mean ±SD is shown. (D, E) Syp is delocalized in NBIIs (open arrowhead) and cytoplasmic enrichment in newly born INPs (arrowhead) is lost in cherub mutants (D) or upon Staufen reduction (E). Scale bars 20 μm. (E) UAS-dcr2; insc-GAL4, UAS-CD8::GFP was used. (F) Immunoprecipitation of Staufen in the presence and absence of cherub. (G) Immunoprecipitation of expressed HA-tagged Syp in the presence and absence of RNase treatment. (H) RIP-qPCR analysis of cherub and the negative control RpL32 upon Syp-HA pull down. Student’s t-test, **p<0.01, n = 3 independent RIP-qPCR experiments, depicted as mean ±SD. (F–H) Brain lysates from brat RNAi tumors and brat RNAi cherub DEL-/- or brat RNAi UAS-Syp-HA were used to enrich for NBs. Driver line used was UAS-dcr2; wor-GAL4, ase-GAL80; UAS-CD8::GFP. (I) Cartoon summarizing the role of cherub in Miranda-Staufen-Syncrip complex formation.
Figure 9—figure supplement 1
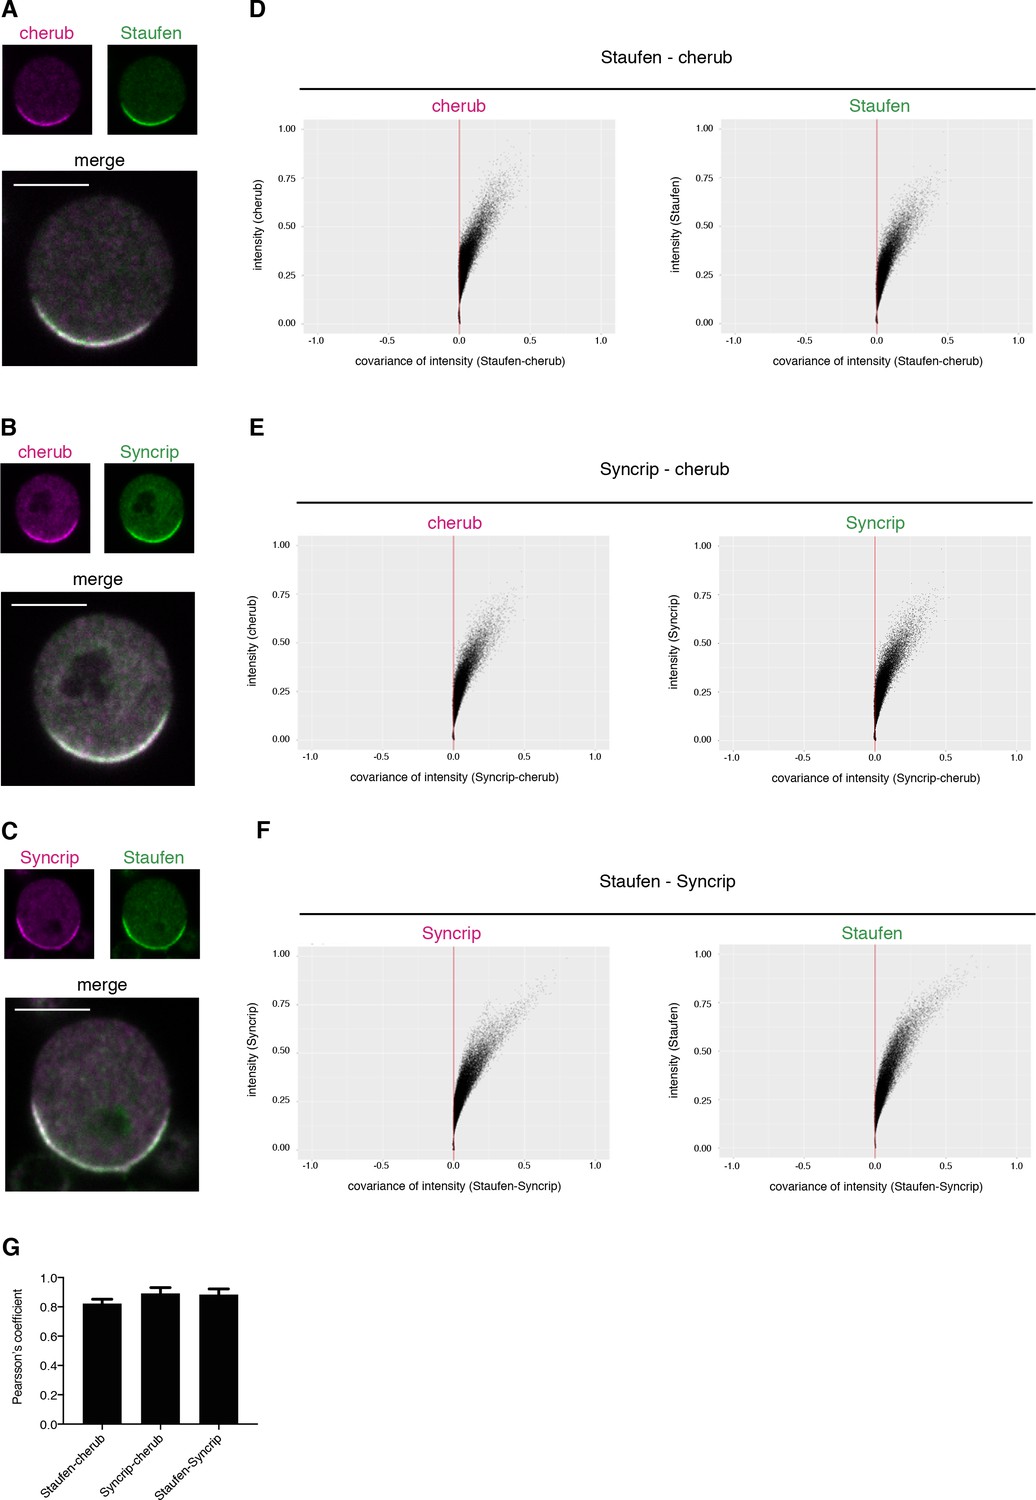
cherub, Staufen and Syncrip localize to the basal pole of mitotic NBIIs.
(A–C) Pairwise comparison of the localization of cherub, Staufen and Syncrip in mitotic NBIIs in vitro. Scale bars 5 µm. (D–F) Representative plot of Li’s intensity correlation analysis of one NBII for the respective channels. Covariance of intensities is calculated as (Ai-a)(Bi-b). A/Bi is the pixel intensity and a/b is the mean intensity of channel A or B. Colocalizing pixels are positive and adopt a C-shape. (G) Pearson’s coefficient of pairwise comparison of Staufen-cherub (n = 11 NBIIs), Syncrip-cherub (n = 8 NBIIs) and Staufen-Syncrip (n = 13 NBIIs). Mean ±SD are shown.
Author response image 1
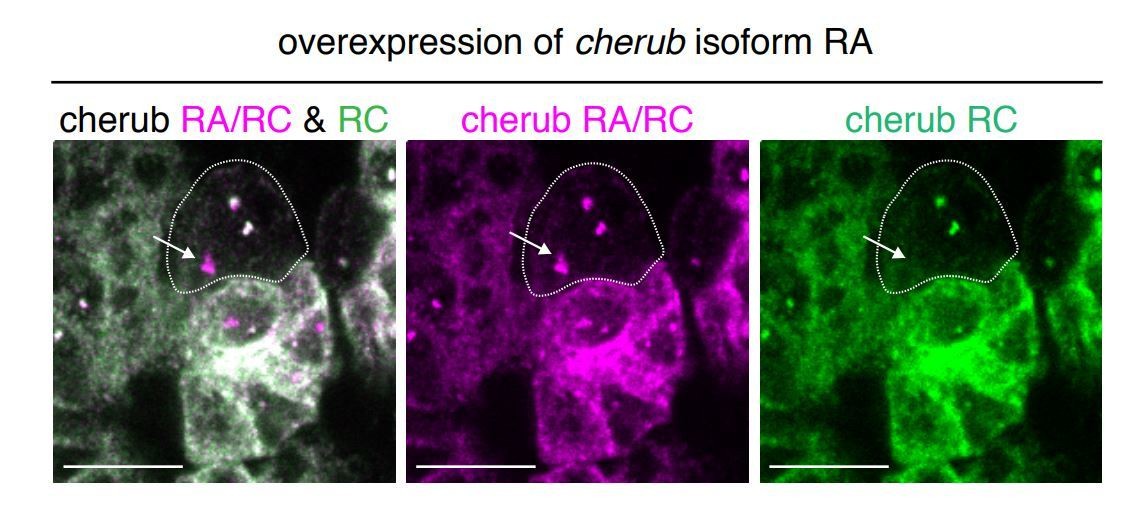
Overexpression of cherub RA isoform with UAS-dcr2; wor-GAL4, ase-GAL80; UAS-CD8::GFP.
The combination of isoform-specific FISH probes allows the detection of the transgene in the nucleus (arrow). Thus, the transgene is induced in NBs despite the lack of elevated cherub levels in the cytoplasma/cortex. Scale bars 10 μm.
Videos
Video 1
cherub is restricted to the basal cell pole of mitotic type II neuroblasts.
3D reconstruction of a representative z-stack showing a NBII marked with the apical marker aPKC (white), mitotic marker PH3 (cyan) and cherub (red). First view shows the raw fluorescence signal followed by the display of reconstructed surfaces. NBIIs were harvested from dissociated brains and arrested in mitosis using Colcemid.
Tables
Key resources table
| Reagent type (species) or resource | Designation | Source or reference | Identifiers | Additional information |
|---|---|---|---|---|
| gene (D. melanogaster) | cherub | NA | FLYB:FBgn0262972 | |
| gene (D. melanogaster) | Syncrip | NA | FLYB:FBgn0038826 | |
| gene (D. melanogaster) | Staufen | NA | FLYB:FBgn0003520 | |
| gene (D. melanogaster) | Imp | NA | FLYB:FBgn0285926 | |
| antibody | anti-Deadpan (guinea pig, polyclonal) | PMID:24630726 | (1:1000) | |
| antibody | anti-Elav (rat, monoclonal) | Developmental Studies Hybridoma Bank | 7E8A10, RRID:AB_528218 | (1:200) |
| antibody | anti-Staufen (rat polyclonal) | PMID:19481457 | (1:100) | |
| antibody | anti-Staufen (goat polyclonal) | Santa Cruz Biotechnology | dN-16, sc-15823, RRID:AB_661413 | (1:2000) |
| antibody | anti-Asense (rat polyclonal) | PMID:24630726 | (1:500) | |
| antibody | anti-HA (mouse monoclonal) | Roche | clone 12CA5, 11583816001 | |
| antibody | anti-aPKC (rabbit polyclonal) | Santa Cruz Biotechnology | sc-216, RRID:AB_2300359 | (1:500) |
| antibody | anti-GFP (chicken polyclonal) | Abcam | ab13970, RRID:AB_300798 | (1:500) |
| antibody | anti-Miranda (rabbit polyclonal) | PMID:24630726 | (1:500) | |
| antibody | secondary antibody (HRP-linked Whole Antibodies) | GE Healthcare, Abcam, Santa Cruz Biotechnologies | sc-2384, NA931V, ab6908, RRID:AB_955425, RRID:AB_634814 | 1:2000 |
| antibody | anti-Syncrip (guinea pig polyclonal) | PMID:23213441 | (1:500) | |
| antibody | anti-PH3(Ser10) (mouse monoclonal) | Cell Signalling Technologies | 9706S, RRID:AB_331748 | (1:1000) |
| antibody | Alexa 405, 488, 568, 647 | Invitrogen | Alexa Fluor dyes | (1:1500) |
| other | Hoechst 33342 | Thermo Scientific Fisher | 62249 | (20 µM) |
| chemical compound | Colcemid | Enzo Life Sciences | ALX-430–033 M001 | (25 µM) |
| chemical compound | Protein G Dynabeads | Thermo Scientific Fisher | 10004D | |
| Recombinant DNA reagent | genomic cherub region (Bac clone) | Pacman Resources | CH322-116G10, FLYB:FBcl0758452 | |
| Recombinant DNA reagent | Walium20 vector | Plasmid Repository of DNA Resource Core(Harvard Medical School) | pWalium20 | |
| other | FISH probes labeled with Quasar Dye | Biosearch Technologies | cherub all | this study - oligonucleotide sequence see Materials and methods |
| other | FISH probes labeled with Quasar Dye | Biosearch Technologies | cherub RA/RC | this study - oligonucleotide sequence see Materials and methods |
| other | FISH probes labeled with Quasar Dye | Biosearch Technologies | cherub RB/RC | this study - oligonucleotide sequence see Materials and methods |
| other | FISH probes labeled with Quasar Dye | Biosearch Technologies | cherub RC | this study - oligonucleotide sequence see Materials and methods |
| software,algorithm | JACoP | PMID:17210054 | ||
| software,algorithm | Prism 7 | GraphPad Software | RRID:SCR_002798 | |
| software,algorithm | PhyloCSF | PMID:21685081 | ||
| software,algorithm | FlowJo software | FlowJo, LLC | RRID:SCR_008520 | |
| software,algorithm | BWA | PMID:19451168 | RRID:SCR_015853 | |
| software,algorithm | Picard tools (v1.82) | Broad Institute | RRID:SCR_006525 | http://broadinstitute.github.io/picard |
| software,algorithm | GATK (v2.3) | Broad Institute | RRID:SCR_001876 | https://software.broadinstitute.org/gatk/ |
| software,algorithm | MuTect (v1.1.4) | PMID:23396013 | RRID:SCR_000559 | |
| software,algorithm | SnpEff (v3.2a) | PMID:22728672 | RRID:SCR_005191 | |
| software,algorithm | Published aCGH datasets | PMID:22090375 and 21724831 | ||
| software,algorithm | TopHat | PMID:19289445 | RRID:SCR_013035 | |
| software,algorithm | DESeq (v1.10.1) | PMID:20979621 | RRID:SCR_000154 | |
| software,algorithm | HTSeq | PMID:25260700 | RRID:SCR_005514 | |
| software,algorithm | Biostrings | R package version 2.40.2. | ||
| commercial assay | Nextera DNA Library Preparation Kit | Illumina | FC-121–1031 | |
| commercial assay | Agencourt AMPure XP beads | Beckman Coulter | A63880 | |
| commercial assay | TRIzol LS | Ambion | 10296010 | |
| commercial assay | NEBNext Ultra DNA Library Prep Kit | Illumina | E7370S | |
| commercial assay | Agilent High Sensitivity DNA Kit | Agilent Technologies | 5067–4626 | |
| other | Rinaldini solution | PMID:22884370 | 1X | |
| Peptide | Staufen Blocking peptide | Santa Cruz Biotechnology | sc-15823P | used 10x amount of primary antibody |
| Peptide | HA Blocking Peptide | Roche | 11666975001 | used 10x amount of primary antibody |
| genetic reagent (Drosophila melanogaster) | UAS-brat RNAi | Vienna Drosophila Resource Center | VDRC:105054 and 31333 | |
| genetic reagent (Drosophila melanogaster) | UAS-mira RNAi | PMID:16564014 | ||
| genetic reagent (Drosophila melanogaster) | UAS-mCherry RNAi | Bloomington Drosophila Stock Center | BDSC:35785, RRID:BDSC_35785 | |
| genetic reagent (Drosophila melanogaster) | UAS-aPKCΔN | PMID:12629552 | ||
| genetic reagent (Drosophila melanogaster) | UAS-staufen RNAi | Vienna Drosophila Resource Center | VDRC:106645 | |
| genetic reagent (Drosophila melanogaster) | UAS-Syp RNAi | Vienna Drosophila Resource Center | VDRC:33012 | |
| genetic reagent (Drosophila melanogaster) | UAS-Syp-RB-HA | PMID:26472907 | ||
| genetic reagent (Drosophila melanogaster) | UAS-Imp RNAi | Bloomington Drosophila Stock Center | BDSC:34977, RRID:BDSC_34977 | |
| genetic reagent (Drosophila melanogaster) | UAS-svp RNAi | Vienna Drosophila Resource Center | VDRC:37087 | |
| genetic reagent (Drosophila melanogaster) | UAS-svp | gift from Y. Hiromi | ||
| genetic reagent (Drosophila melanogaster) | brat k06028 | PMID:10949924 | ||
| genetic reagent (Drosophila melanogaster) | UAS-dcr2; wor-GAL4, ase-GAL80; UAS-CD8::GFP | PMID:21549331 | ||
| genetic reagent (Drosophila melanogaster) | UAS-dcr2; insc-GAL4, UAS-CD8::GFP | PMID:21549331 | ||
| genetic reagent (Drosophila melanogaster) | UAS-stinger::RFP | PMID:11056799 | ||
| genetic reagent (Drosophila melanogaster) | UAS-stinger::GFP | PMID:11056799 | ||
| genetic reagent (Drosophila melanogaster) | tubulin-GAL80ts | Bloomington Drosophila Stock Center | BDSC:7017, RRID:BDSC_7017 | |
| genetic reagent (Drosophila simulans) | D. simulans | Drosophila Species Stock Center | 14021–0251.265 | |
| genetic reagent (Drosophila willistoni) | D. willistoni | Drosophila Species Stock Center | 14030–0814.10 | |
| genetic reagent (Drosophila melanogaster) | UAS-cherub RNAi | this paper | RNAi against cherub | |
| genetic reagent (Drosophila melanogaster) | cherubDEL | this paper | full deletion of cherub locus | |
| genetic reagent (Drosophila melanogaster) | cherubpromDEL | this paper | deletion of promotor region of cherub | |
| genetic reagent (Drosophila melanogaster) | cherubgenomic rescue | this paper | genomic rescue construct of cherub, BAC clone CH322-116G10 |
Additional files
-
Transparent reporting form
- https://doi.org/10.7554/eLife.31347.022
Download links
A two-part list of links to download the article, or parts of the article, in various formats.
Downloads (link to download the article as PDF)
Open citations (links to open the citations from this article in various online reference manager services)
Cite this article (links to download the citations from this article in formats compatible with various reference manager tools)
The asymmetrically segregating lncRNA cherub is required for transforming stem cells into malignant cells
eLife 7:e31347.
https://doi.org/10.7554/eLife.31347


