Activation of Toll-like receptors nucleates assembly of the MyDDosome signaling hub
- Sarah Latty

- Jiro Sakai
- Lee Hopkins
- Brett Verstak
- Teresa Paramo
- Nils A Berglund
- Nicholas J Gay
- Peter J Bond
- David Klenerman
- Clare E Bryant
- University of Cambridge, United Kingdom
- University of Oxford, United Kingdom
- Bioinformatics Institute (A*STAR), Singapore
- National University of Singapore, Singapore
Figures
Figure 1 with 5 supplements
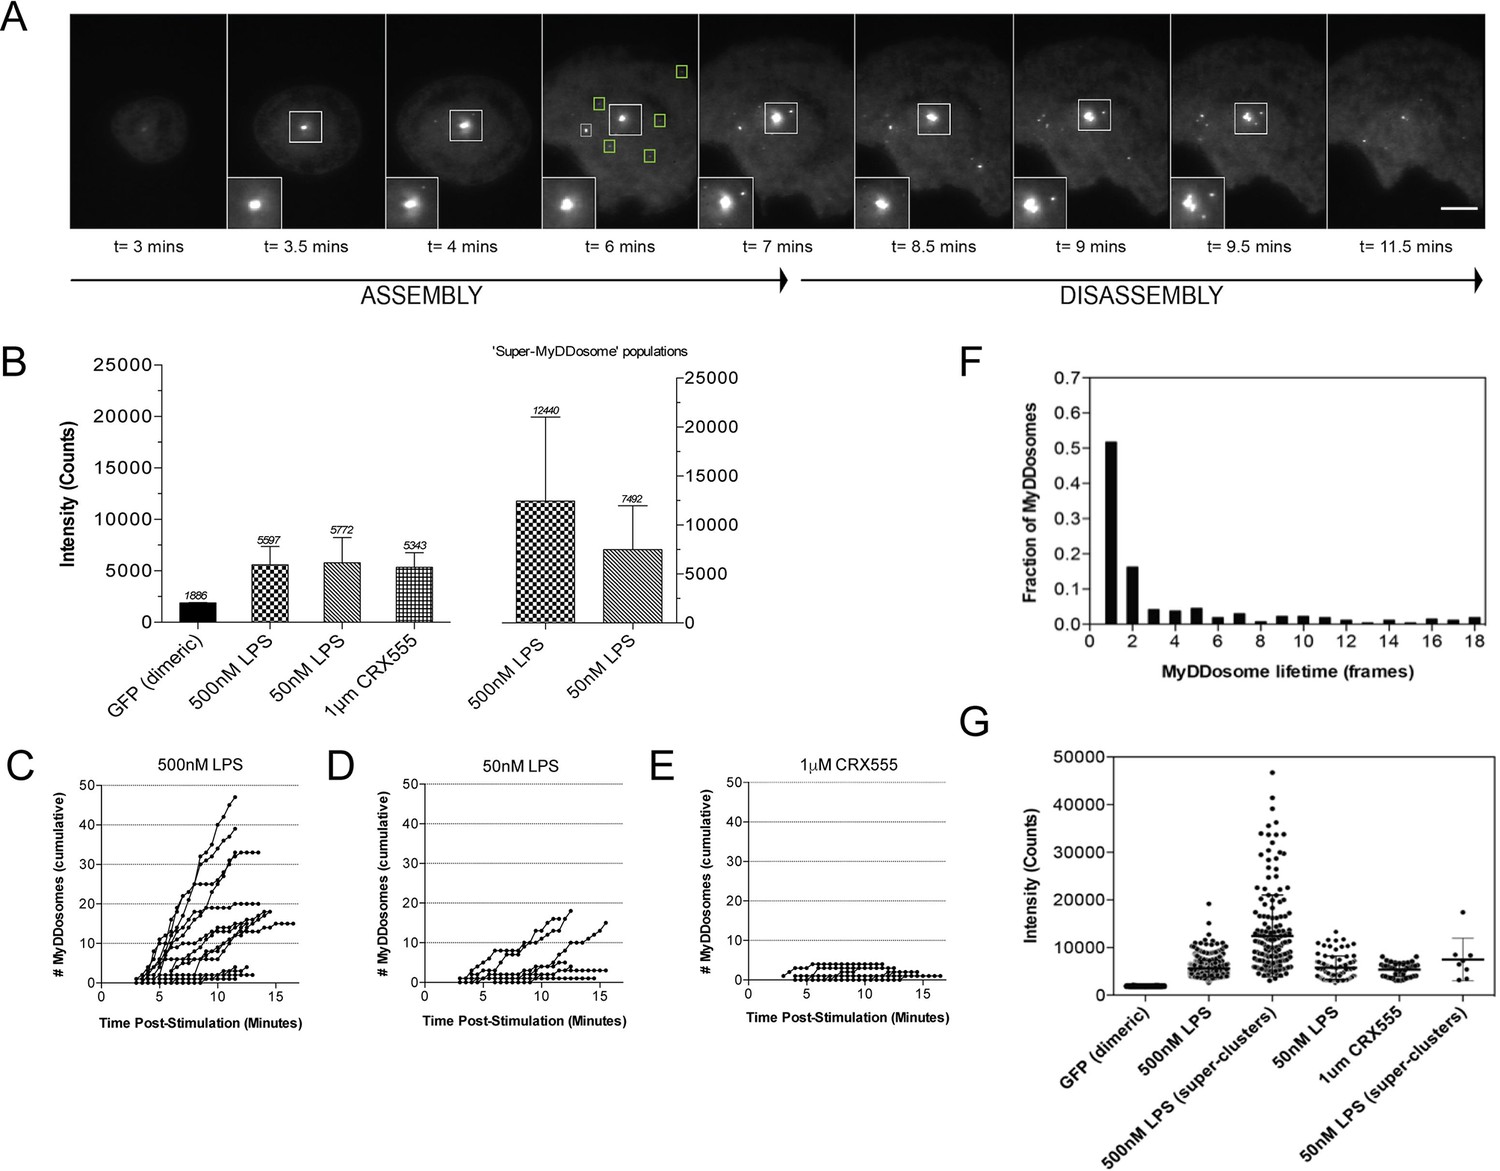
The kinetics and size of MyDDosome formation depend on the efficacy of TLR4 stimulation.
MyD88-/- iBMM were virally transduced with pHRMyD88-GFP and either left unstimulated or stimulated with LPS (10–500 nM) or CRX-555 (500 nM-1µM). (A) Stills showing MyDDosome formation in a live cell in response to 500 nM LPS stimulation. Imaging was started 3 min post-stimulation and the assembly of MyDDosomes was observed up until 8 min following stimulation. After 8 min the MyD88 complex can disassociate. Scale bar is 5 μm. (B) Mean fluorescent intensities of MyDDosomes post-stimulation. Mean intensity values are displayed above the error bars. These values are compared to the distribution obtained from dimeric recombinant GFP. Error bars represent SEM. (C, D, E) The cumulative number of MyDDosomes per cell (each trace represents a single cell) for 500 nM LPS, 50 nM LPS and 1 μM CRX555 stimulations respectively. Single MyDDosomes are surrounded by green boxes. In response to a high dose of LPS (500 nM) a large MyDDosome population of varying sizes forms. Upon stimulation with lower concentrations of LPS (50 nM) fewer MyDDosomes were formed within the same time frame (p<0.05). The partial agonist CRX555 (1 μM) results in less cumulative MyDDosome formation than LPS (500 nM; p<0.0001). A minimum of 10 cells were analyzed for at least three repeats per condition. (F) Histogram of MyDDosome lifetime (frames) following stimulation with 500 nM LPS. 1 frame = a 30 s interval. Many tracks vanish in one frame but a proportion are slower. A minimum of 10 cells were analyzed for at least three repeats per condition. (G) Comparison of the fluorescence intensity of dimeric GFP with MyD88 in response to stimulation with different TLR4 ligands. Larger clusters of MyD88 were seen in response to LPS, particularly at higher doses. Data are presented with error bars as standard deviation of the intensity values.
Figure 1—figure supplement 1

(i) To determine whether addition of a fluorescent tag to MyD88 effects its ability to signal HEK cells were transiently transfected with 10 ng MyD88-GFP, along with an 10 ng p-NFκΒ Luc reporter and 5 ng of phRG (constitutively active renilla control plasmid).
Cells were lysed 48 hr after transfection and NFκΒ activity measured normalised to renilla activity in response to MyD88 over expression (data are expressed as mean luciferase/renilla ± SEM; n = 3). As expected over expression of MyD88 activates NFκΒ signaling (ii) WT or MyD88-/- iBMDMs lentivirally transduced with MyD88-GFP 72 hr previously were seeded overnight into 8-well chamber slides (NUNC) and incubated for 30 min with or without 10 ng/ml ultrapure LPS (Invivogen,). Cells were fixed in 4% PFA for 15 min at room temperature (RT) followed by washing with Dulbeccos phosphate buffered saline (DPBS). Fixed cell membranes were permeabilised using 0.1% TX-100/DPBS for 10 min at RT prior to blocking with 1% BSA/DPBS for 1 hr at RT. Cells were incubated with anti-p65 antibody (Thermoscientific, 710048) diluted 1:250 in 0.1% BSA/DPBS for 2 hr at 37°C followed by washing and incubation with goat-anti-rabbit IgG Alexa-568 secondary antibody (Invitrogen) diluted 1:500 in 0.1% BSA/DPBS for 1 hr at 37°C. Stained cells were washed and mounted in Vectashield mounting medium containing DAPI (Vector Labs) and imaged using a Leica DMI300B fluorescence microscope.
Figure 1—figure supplement 2

An overview of the MyDDosome tracking process using a TrackMate plugin.
(A) shows an example of raw data collected over a 9 min period following cell stimulation with 500 nM LPS. In this case imaging commences 3 min post-stimulation and ends at 11.5 min post-stimulation. Each frame is captured following a time period of 30 s. (B) shows the tracks detected by software (T1-21) with threshold settings as described in the text. Spots detected by the program but which appear for only one frame are labeled (S1-28). These spots do not link to another spot within the threshold of 2 frames (1 min) and thus do not constitute tracks. (C) shows the resulting track scheme following track detection (T1-21). All identified spots regardless of frame duration are incorporated into subsequent data analysis. Scale bar is 5 μm. A minimum of 10 cells were analyzed for at least three repeats per condition.
Figure 1—figure supplement 3

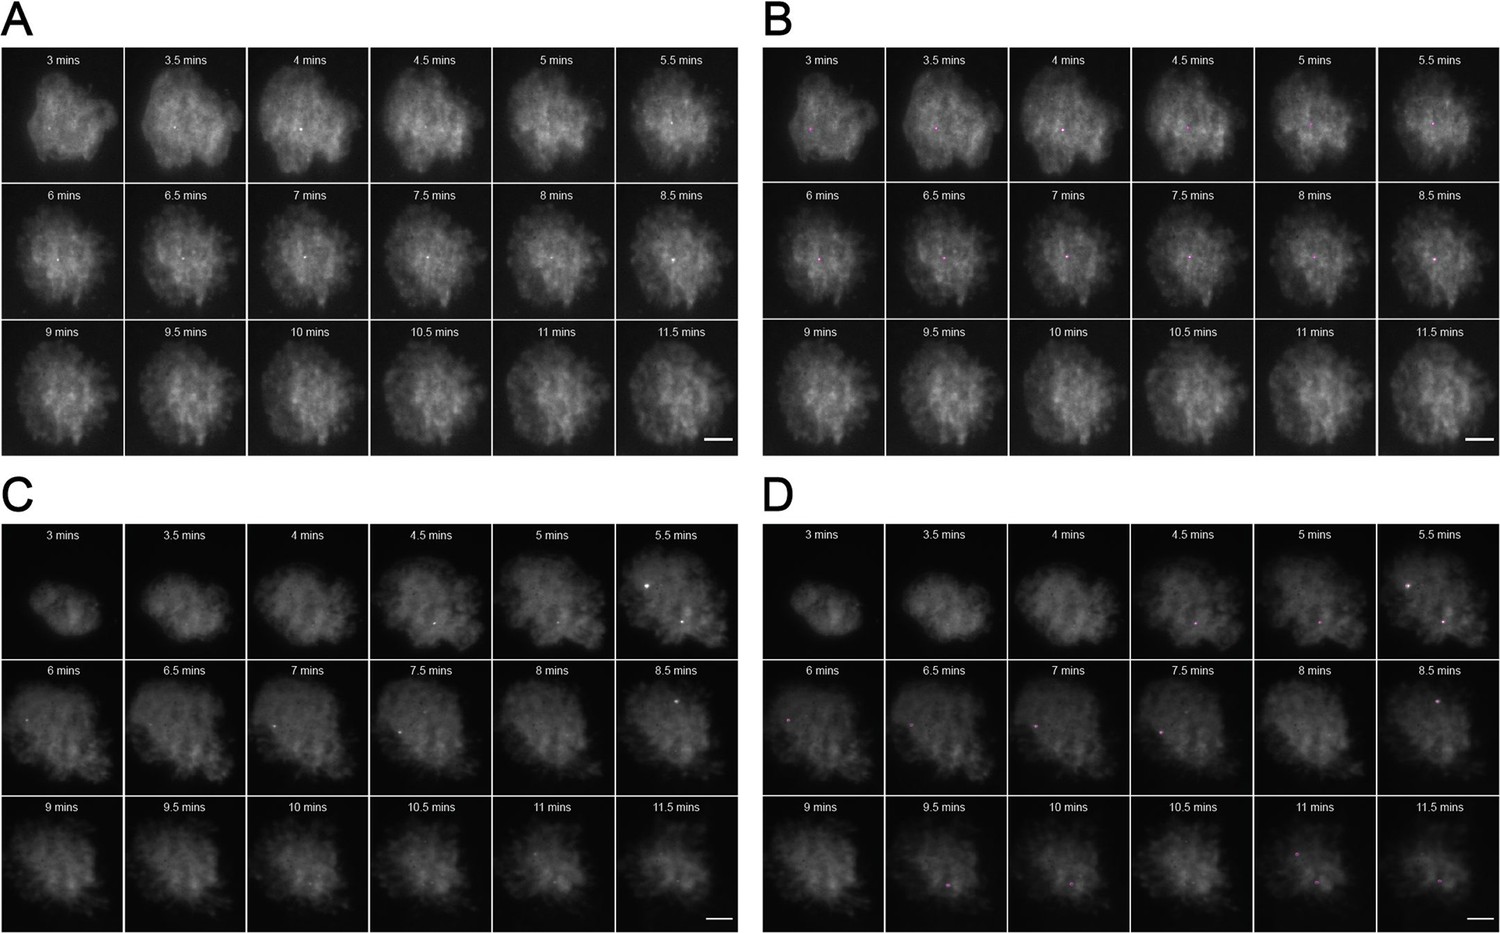
Representative MyD88-GFP data for 500 nM LPS treated cells.
(A and B) represent 18 frames of acquired data for a single cell post-stimulation with 500 nM LPS. Acquisition commenced at 3 mi. $$BOX_TXT_END$$ n utes post-stimulation and continued for 9 min (one frame recorded every 30 s). (B) shows the same set of frames following application of a TrackMate plugin to detect MyDDosomes. (C and D) represent 18 frames of acquired data for a single cell post-stimulation with 50 nM LPS. Acquisition commenced at 3 min post-stimulation and continued for 9 min (one frame recorded every 30 s). (D) shows the same set of frames following application of a TrackMate plugin to detect MyDDosomes. Scale bars are 5 μm. A minimum of 10 cells were analyzed for at least three repeats per condition.
Figure 1—figure supplement 4
Representative MyD88-GFP data for 50 nM LPS treated cells.
(A and B) represent 18 frames of acquired data for a single cell post-stimulation with 50 nM LPS. Acquisition commenced at 6 min post-stimulation and continued for 9 min (one frame recorded every 30 s). (B) shows the same set of frames following application of a TrackMate plugin to detect MyDDosomes. (C and D) represent 18 frames of acquired data for a single cell post-stimulation with 50 nM LPS. Acquisition commenced at 3 min post-stimulation and continued for 9 min (one frame recorded every 30 s). (D) shows the same set of frames following application of a TrackMate plugin to detect MyDDosomes. Scale bars are 5 μm. A minimum of 10 cells were analyzed for at least three repeats per condition.
Figure 1—figure supplement 5
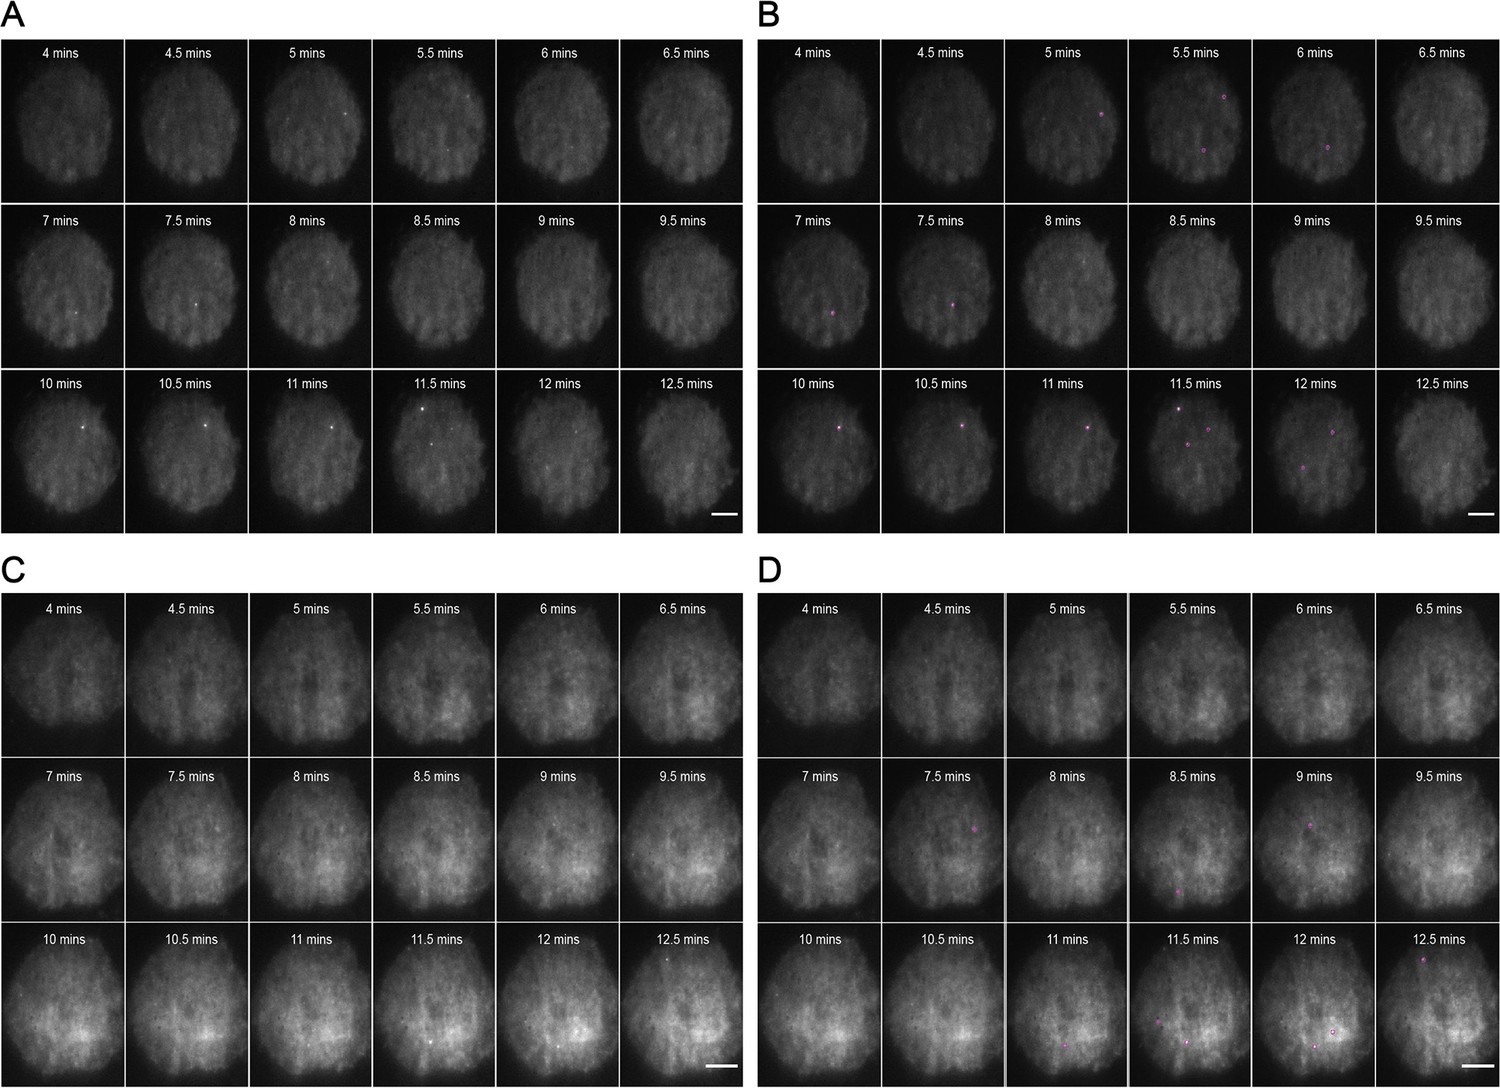
Representative MyD88-GFP data for 1 μM CRX-555-treated cells.
(A and B) represent 18 frames of acquired data for a single cell post-stimulation with 1 uM CRX-555. Acquisition commenced at 4 min post-stimulation and continued for 9 min (one frame recorded every 30 s). (B) shows the same set of frames following application of a TrackMate plugin to detect MyDDosomes. (C and D) represent 18 frames of acquired data for a single cell post-stimulation with 1 μM CRX-555. Acquisition commenced at 4 min post-stimulation and continued for 9 min (one frame recorded every 30 s). (D) shows the same set of frames following application of a TrackMate plugin to detect MyDDosomes. Scale bars are 5 μm. A minimum of 10 cells were analyzed for at least three repeats per condition.
Figure 2 with 3 supplements
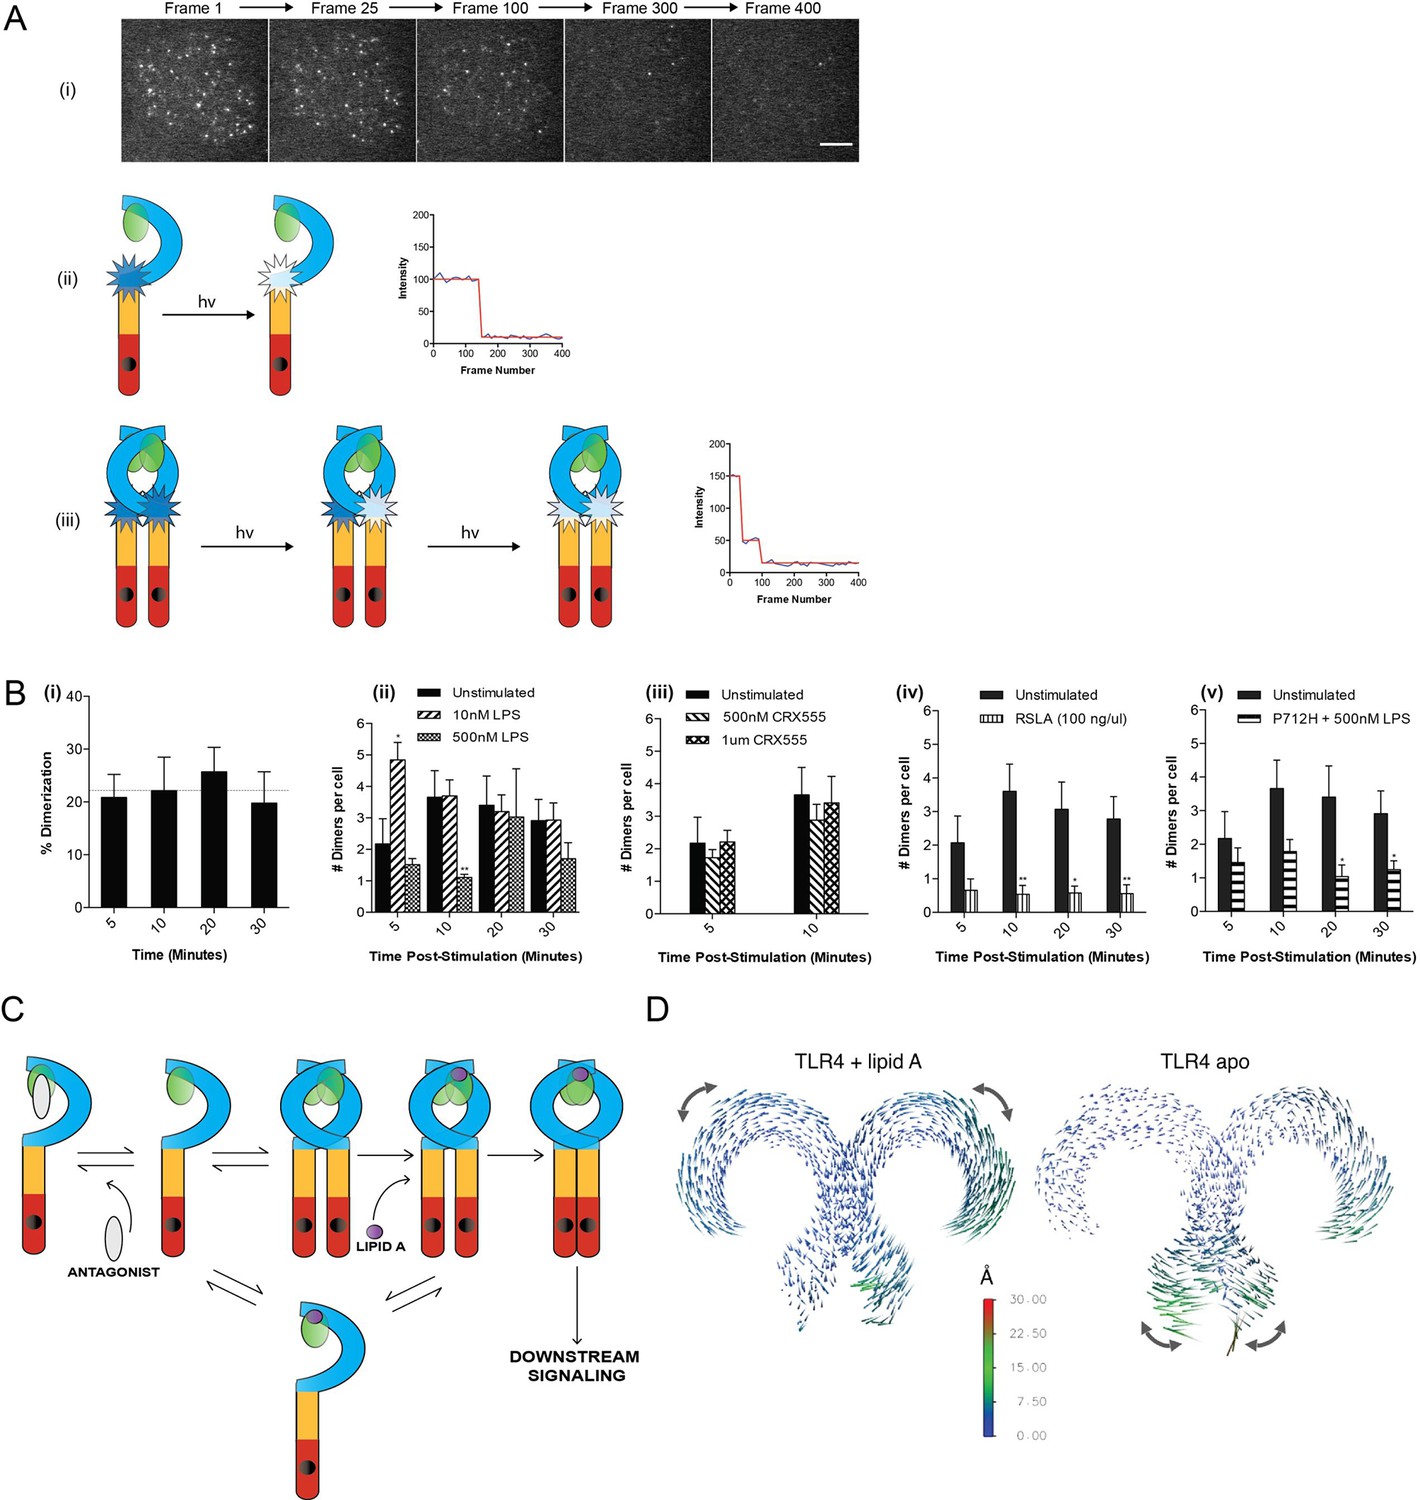
The effect of ligands upon TLR4 dimerization.
TLR4-/- iBMM virally transduced with pHR-TLR4-Halo were incubated with HaloTag R110Direct. Cells were either left unstimulated or stimulated with LPS (10–500 nM) or CRX-555 (500 nM-1µM), fixed at specific time points and subjected to photobleaching analysis. (A) Photobleaching analysis with stills from cells stimulated with LPS (10 nM) for 5 min. If the labeled TLR4 is a monomer then photobleaching occurs in a single step. If the labeled TLR4 is a dimer then two photobleaching steps occur. Since it was not possible to independently determine the efficiency of labeling of TLR4, this analysis allows the relative number of TLR4 monomers and dimers on the cell surface to be determined. (B) (i) TLR4 expression in unstimulated cells: monomeric (78 ± 3%); dimeric (22 ± 3%) (ii) increased number of detected TLR4 dimers after LPS stimulation (10 nM) for 5 min (p<0.05) (iii) the number of detected TLR4 dimers is unchanged by CRX555 (iv) less TLR4 dimers were detected with the antagonist Rhodobacter sphaeroides Lipid A (RSLA) compared to unstimulated cells (p<0.05) and (v) LPS-stimulation of TLR4-Pro712His-Halo shows reduced number of dimers compared to wild-type TLR4 (p<0.05). At least 16 cells were analyzed at each time point in three independent repeat experiments, data are expressed as mean ± SEM, and data were analyzed by a two-tailed unpaired Student’s t-test. (C) A two-step model for TLR4 signaling: ligand induced dimer stabilization followed by apposition of the TIRs. (D) Porcupine plots from molecular dynamics simulations of TLR4/MD2, with magnitudes of atomic motion indicated by length and color of associated arrows: minor rotational motions of the ECDs with lipid A brings the C-termini of the TLR4 ECD into close apposition.
Figure 2—figure supplement 1
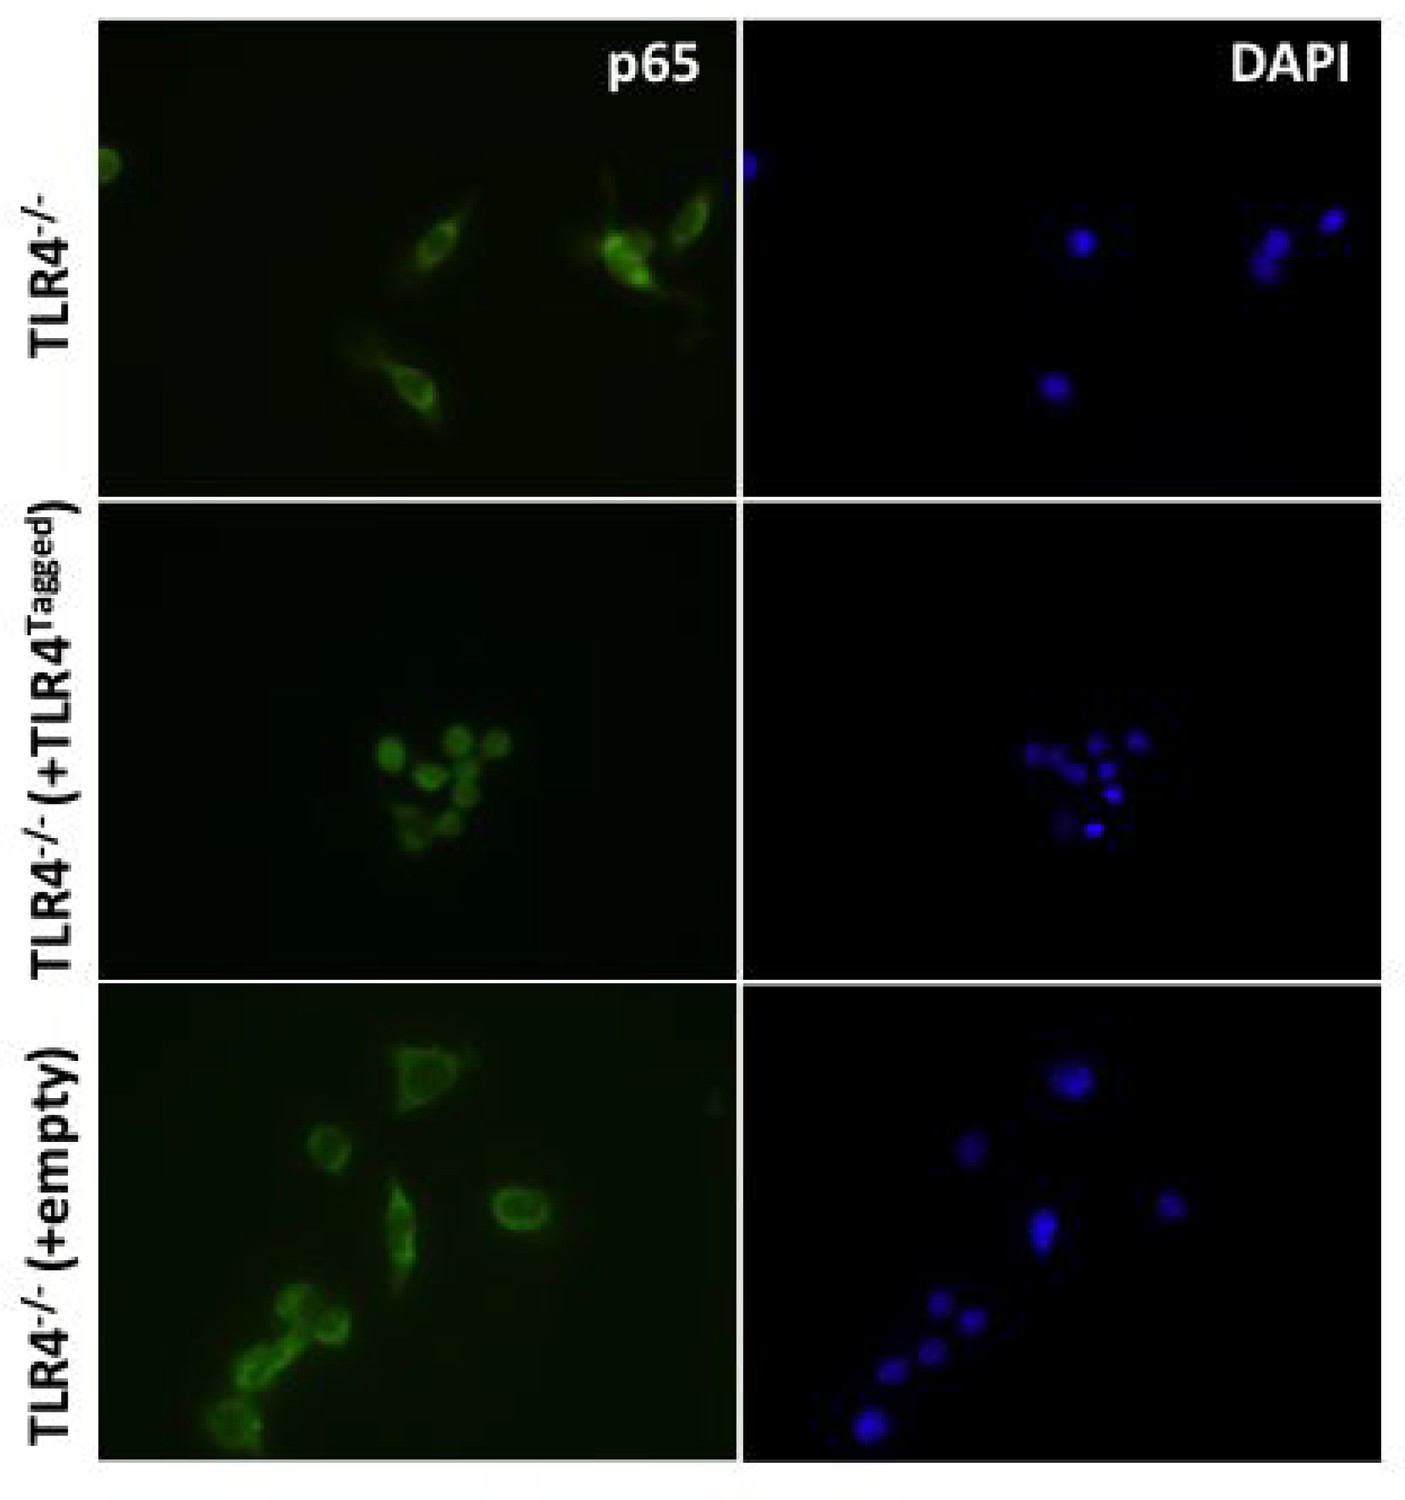
(i) To determine whether addition of a Halo tag to TLR4 effects its ability to signal HEK cells were transfected with 1 ng Wild-type (TLR4WT) or Halo-Tagged TLR4 (TLR4Ha), 1 ng each of CD14 and MD2, 10 ng p-NFκΒ Luc reporter and 5 ng of phRG (constitutively active renilla control plasmid).
After 48 h cells were stimulated with LPS (1 ng/ml or 10 ng/ml); data are expressed as mean luciferase/renilla ± SEM; n = 3). (ii) TLR4-/- iBMDMs were lentivirally transduced with TLR4-Halo. After seven days cells were seeded overnight into 8-well chamber slides (NUNC) and incubated for 30 min with or without 10 ng/ml ultrapure LPS (Invivogen,). Cells were fixed in 4% PFA for 15 min at room temperature (RT) followed by washing with Dulbeccos phosphate buffered saline (DPBS) Fixed cells were permeabilised using 0.1% TX-100/DPBS for 10 min at RT prior to blocking with 1% BSA/DPBS for 1 hr at RT. Cells were incubated with anti-p65 antibody (Thermoscientific,, 710048) diluted 1:250 in 0.1% BSA/DPBS for 2 hr at 37°C followed by washing and incubation with goat-anti-rabbit IgG Alexa-488 secondary antibody (Invitrogen) diluted 1:500 in 0.1% BSA/DPBS for 1 hr at 37°C. Stained cells were washed and mounted in Vectashield mounting medium containing DAPI (Vector Labs) and imaged using a Leica DMI300B fluorescence microscope.
Figure 2—figure supplement 2

Porcupine plots based on three independent replica simulations of apo, ligand-free TLR4/MD2, with magnitudes of atomic motion indicated by length and color of associated arrows, reveal large lateral fluctuations of C-termini, consistent across all replicas.
This suggests that ligand binding brings the C-termini of the TLR4 ECD into close apposition.
Figure 2—figure supplement 3
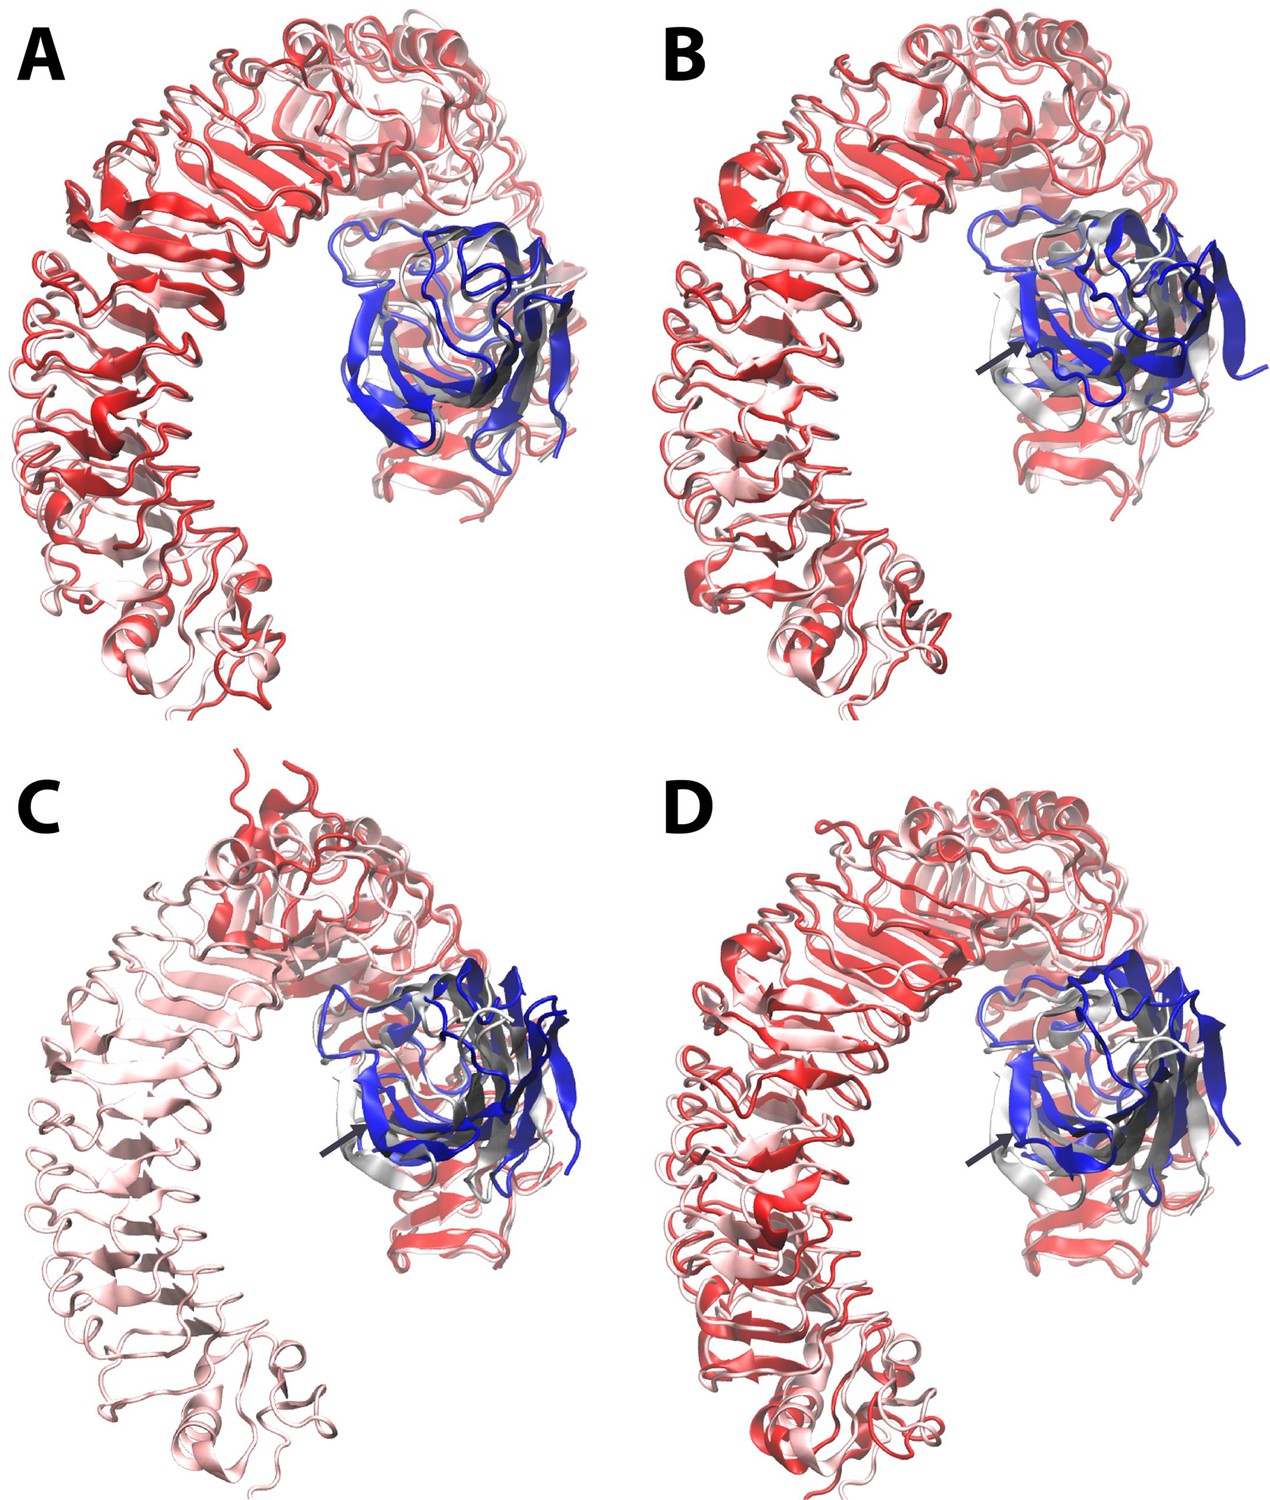
Dynamic motion of MD2 relative to TLR4.
Starting from the LPS bound X-ray structure (pdb ID 3FXI) (http://www.nature.com/nature/journal/v458/n7242/full/nature07830.html) of MD2 (transparent grey) bound to dimeric TLR4 (transparent pink), molecular dynamics simulations reveal that (A) the Lipid A agonist-bound complex is stable, whereas (B) complete removal of ligand leads to a shift of up to ~ 10 Angstroms in the position of MD2 (dark blue) relative to its primary TLR4 partner (dark red) as it dissociates from the secondary, dimeric TLR4 interface (not shown for clarity). The LPS-bound structure is overlaid in the same format for the X-ray structures (http://www.cell.com/cell/fulltext/S0092-8674(07)01021–5) of (C) a truncated human TLR4/hagfish VLR construct (dark red) in complex with Eritoran antagonist-bound MD2 (dark blue) (PDB ID 2Z65), and (D) monomeric mouse TLR4 (dark red) in complex with MD2 (dark blue) in the absence of ligand (PDB ID 2Z64). In (B)-(D), dark arrows indicate the direction of motion of MD-2 relative to TLR4.
Figure 3 with 1 supplement
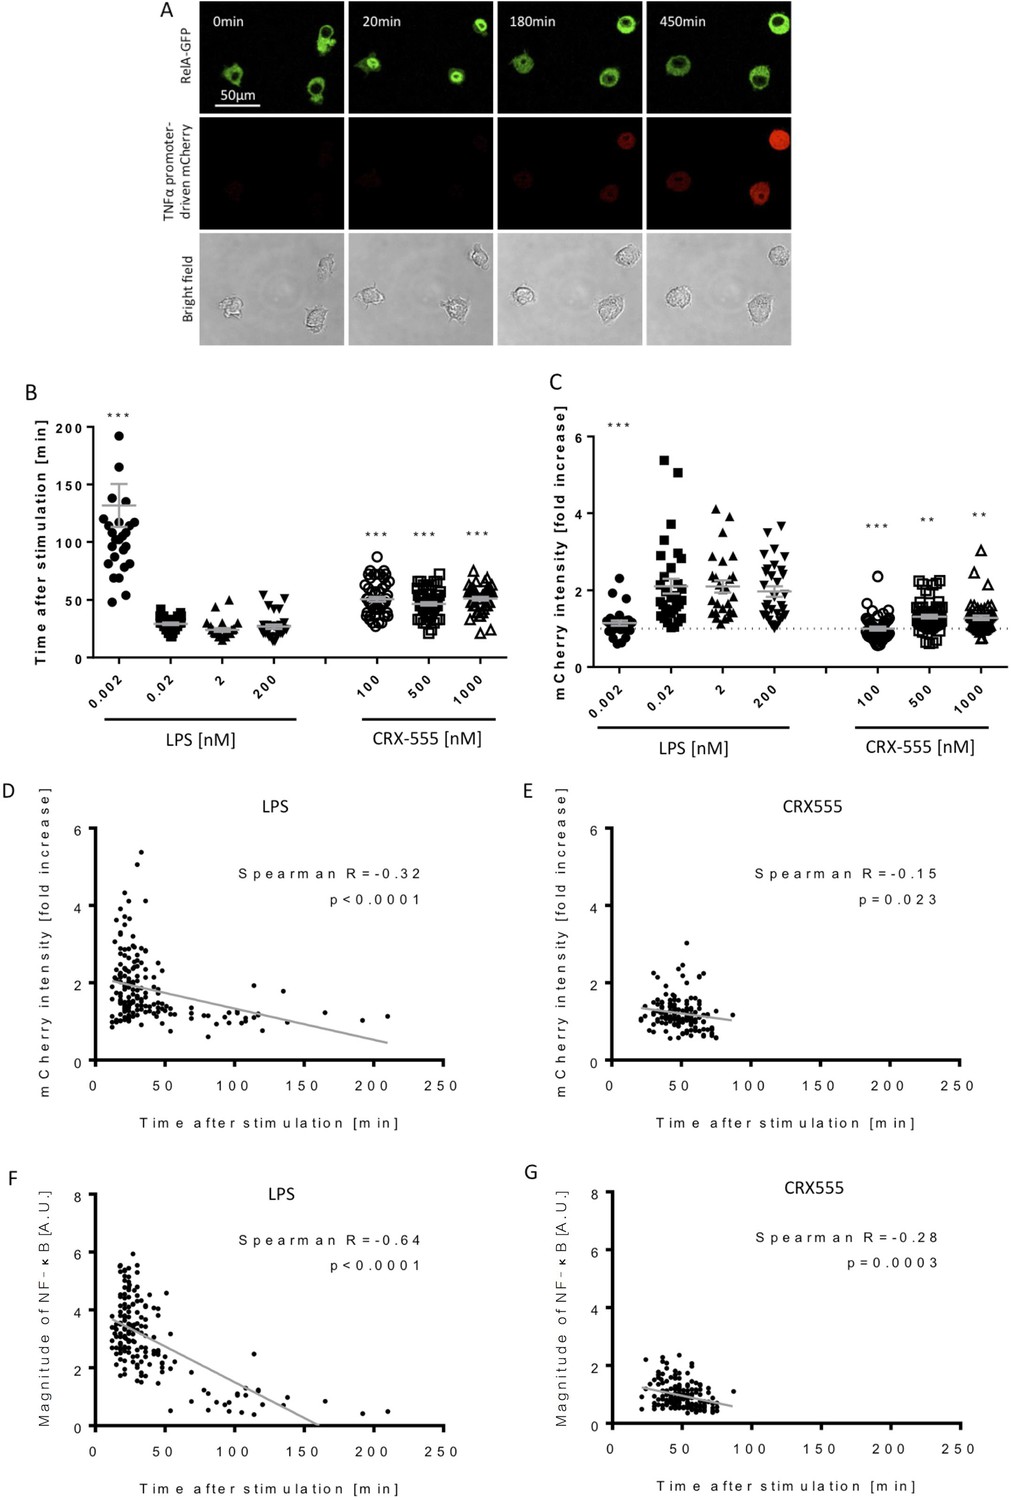
Macrophages stimulated with CRX555 show delayed NF-κB nuclear translocation in comparison to cells stimulated with LPS.
RAW264.7 macrophages stably expressing RelA-EGFP and a TNFα promoter-mCherry reporter were stimulated with LPS or CRX555. Confocal time-lapse images were captured every 3 min for 15 hr. (A) Stills of NF-κB nuclear translocation and mCherry expression following 2 nM LPS stimulation. (B) NF-κB dynamics was assessed as the ratio of the nuclear:cytoplasmic EGFP fluorescence. Time to the first peak of NF-κB translocation was measured in response to LPS or CRX-555. (C) Fold increase of mCherry intensity following stimulation with LPS or CRX555 (the dotted line indicates no increase in mCherry). Each dot represents a single cell from four independent experiments (n = 30–50 for each condition). The bar represents mean value ± s.d. ***p<0.0001, **p<0.01, *p<0.05, one-way ANOVA with Kruskal- Wallis post-test, compared with cells stimulated with the lowest concentration of LPS (0.002 nM). (D and E) Statistical analysis of the correlation between the speed of NF-κB nuclear translocation and TNFα promoter activation. Spearman’s correlation coefficient was used to assess links between time to the first peak of NF-κB nuclear translocation and the fold increase in mCherry intensity or magnitude of NF-κB translocation following LPS (D) (F) or CRX-555 stimulation (E) (G).
Figure 3—figure supplement 1
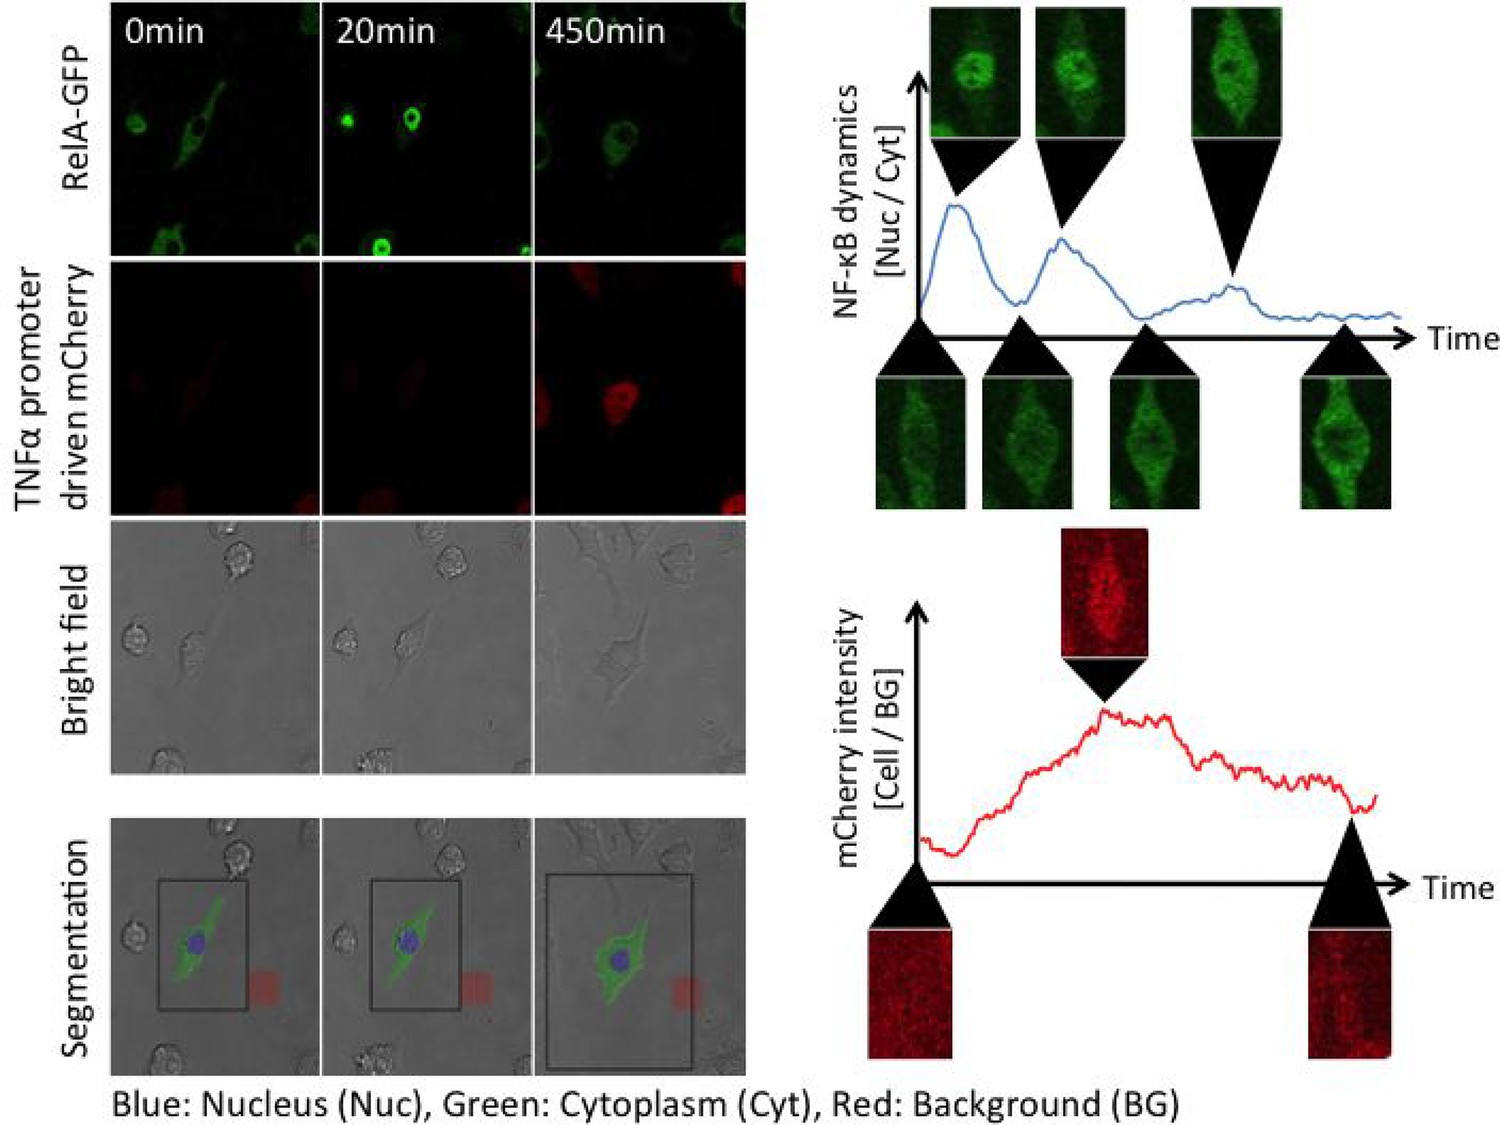
MATLAB-based automated analysis of NF-κB translocation and mCherry fluorescence intensity.
segmentation to determine the area of a cell body was performed based on GFP pictures and bright field pictures. A nuclear region was determined as a circle with a diameter which was selected manually (blue region). In this study, the size of a nuclear area was assumed to be constant. The area of a cell body was determined from the bright field pictures. A cytosolic area was defined as the area remaining after subtracting the nuclear area from the area of a cell body (green areas). The GFP intensity of all pixels in the nucleus or the cytoplasm was measured and then averaged for the nuclear value (Nuc) and the cytosolic value (Cyt) in each frame. NF-κB nuclear translocation was assessed by the ratio of the nuclear GFP intensity to the cytoplasm (Nuc/Cyt). The intensity of mCherry fluorescence was measured from the area of a cell body determined by bright field pictures and then averaged for the cell body (Cell). Background noise (BG) was measured from a rectangular area without a cell (red areas) and then averaged. The intensity of mCherry fluorescence in the cell body was normalized by background noise (Cell/BG).
Additional files
-
Supplementary file 1
Structural properties of TLR4/MD2 heterotetrameric complex observed during final 20 ns of molecular dynamics simulations
The modeled TLR4/MD-2 heterotetramer exhibited increased structural drift with respect to the LPS-bound X-ray structure in the absence of ligand (apo state), as reflected in the mean RMSD values. Measurement of the surface areas buried between protein chains reveals that the largest conformational changes are evident at the primary TLR4 dimerization interfaces (which govern the stability of the higher-order heterotetrameric complex) than at the secondary TLR4 dimerization interfaces, with shifts of up to ~ 60% versus~20%, respectively. This is consistent with the observed relative motion of up to ~ 10 Å of MD2 relative to its primary TLR4 partner in the apo state, as described in the main text.
- https://doi.org/10.7554/eLife.31377.015
-
Transparent reporting form
- https://doi.org/10.7554/eLife.31377.016
Download links
A two-part list of links to download the article, or parts of the article, in various formats.
Downloads (link to download the article as PDF)
Open citations (links to open the citations from this article in various online reference manager services)
Cite this article (links to download the citations from this article in formats compatible with various reference manager tools)
Activation of Toll-like receptors nucleates assembly of the MyDDosome signaling hub
eLife 7:e31377.
https://doi.org/10.7554/eLife.31377


