Persistent activity in a recurrent circuit underlies courtship memory in Drosophila
- Janelia Research Campus, United States
- Research Institute of Molecular Pathology, Austria
- University of Queensland, Australia
Figures
Figure 1 with 1 supplement
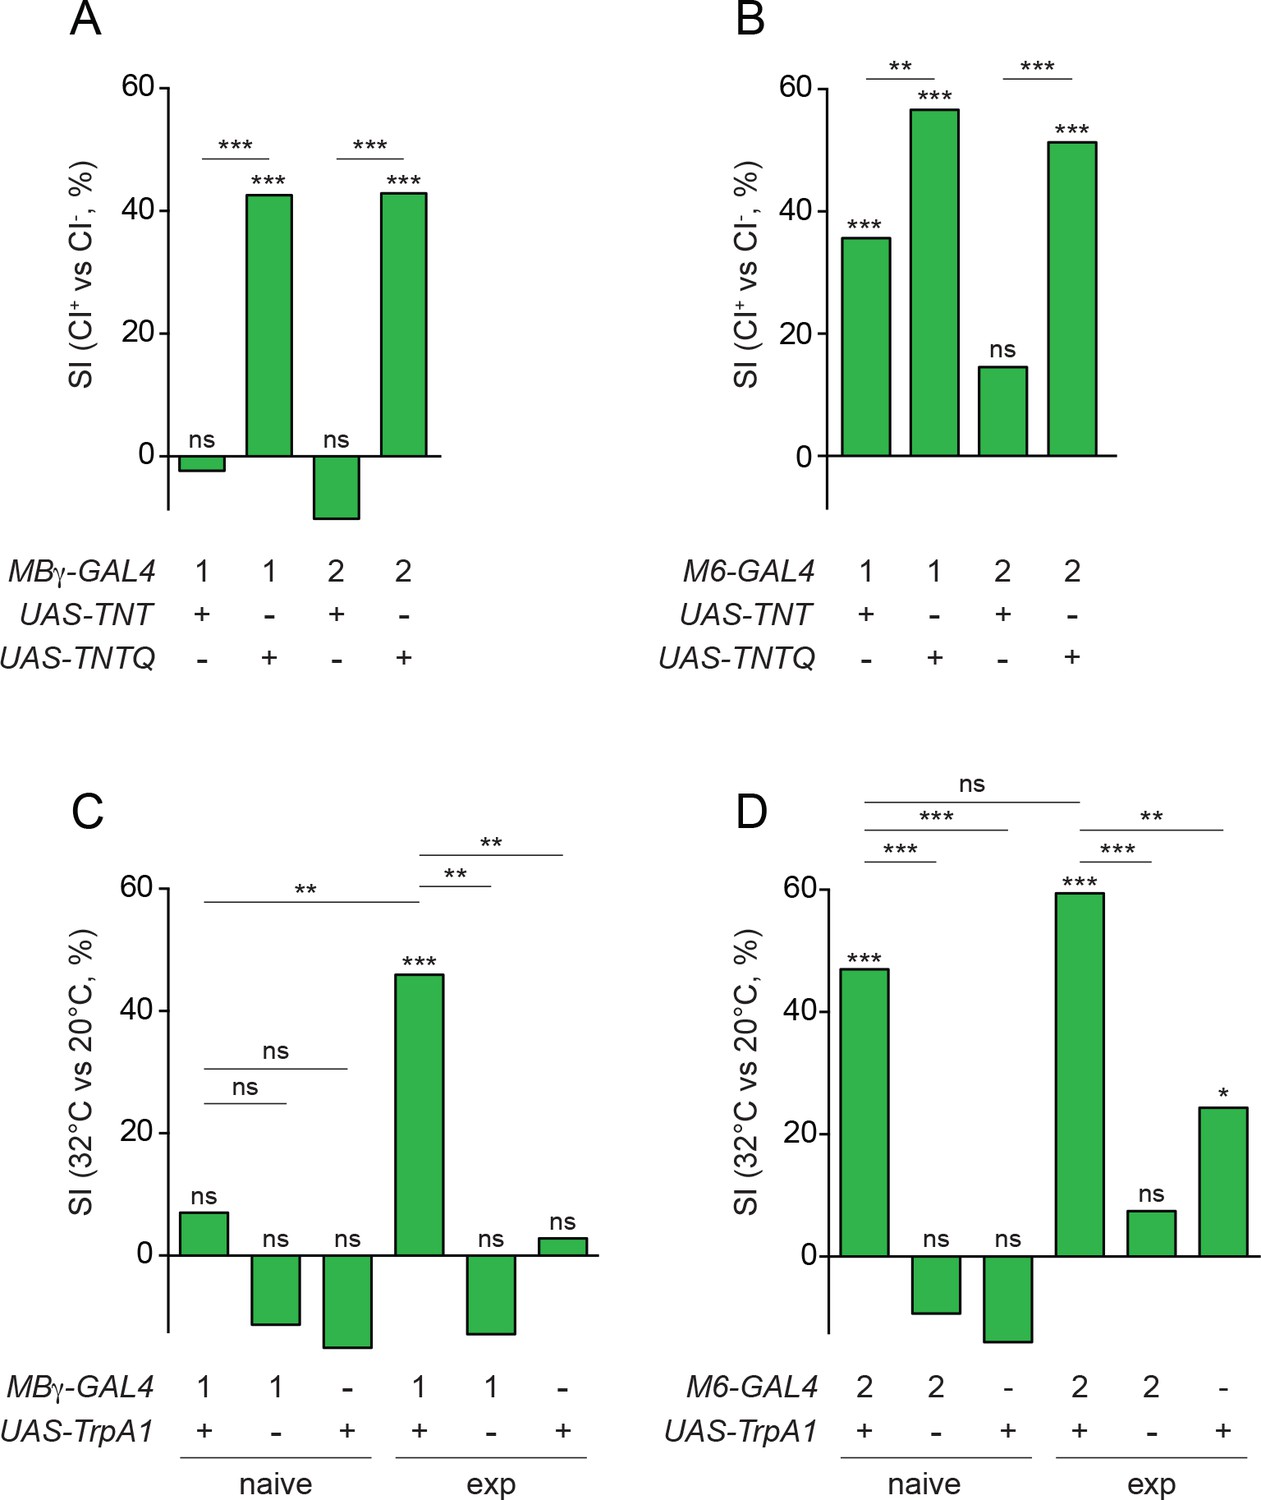
Experience modulates circuit properties between MBγ and M6 neurons.
(A) Suppression indices (SI), calculated from mean courtship indices of male flies in which active (UAS-TNT) or inactive (UAS-TNTQ) tetanus toxin is expressed in MBγ neurons (1, VT044966-GAL4; 2, VT030413-GAL4). In this and other panels, statistical significance of differences from zero or from control groups is indicated as follows: ***p<0.001, **p<0.01, *p<0.05, n.s. p>0.05, permutation tests, see Supplementary file 1. (B) Suppression indices (SI), calculated from mean courtship indices of male flies in which active (UAS-TNT) or inactive (UAS-TNTQ) tetanus toxin is expressed in M6 neurons (1, VT014702-GAL4; 2, VT032411-GAL4). See Supplementary file 1. (C) Suppression indices (SI) of naïve or experienced (exp) male flies upon thermogenetic activation of MBγ neurons (1, VT044966-GAL4). See Supplementary file 1. (D) Suppression indices (SI) of naïve or experienced (exp) male flies upon thermogenetic activation of M6 neurons (2, VT032411-GAL4). See Supplementary file 1.
Figure 1—figure supplement 1
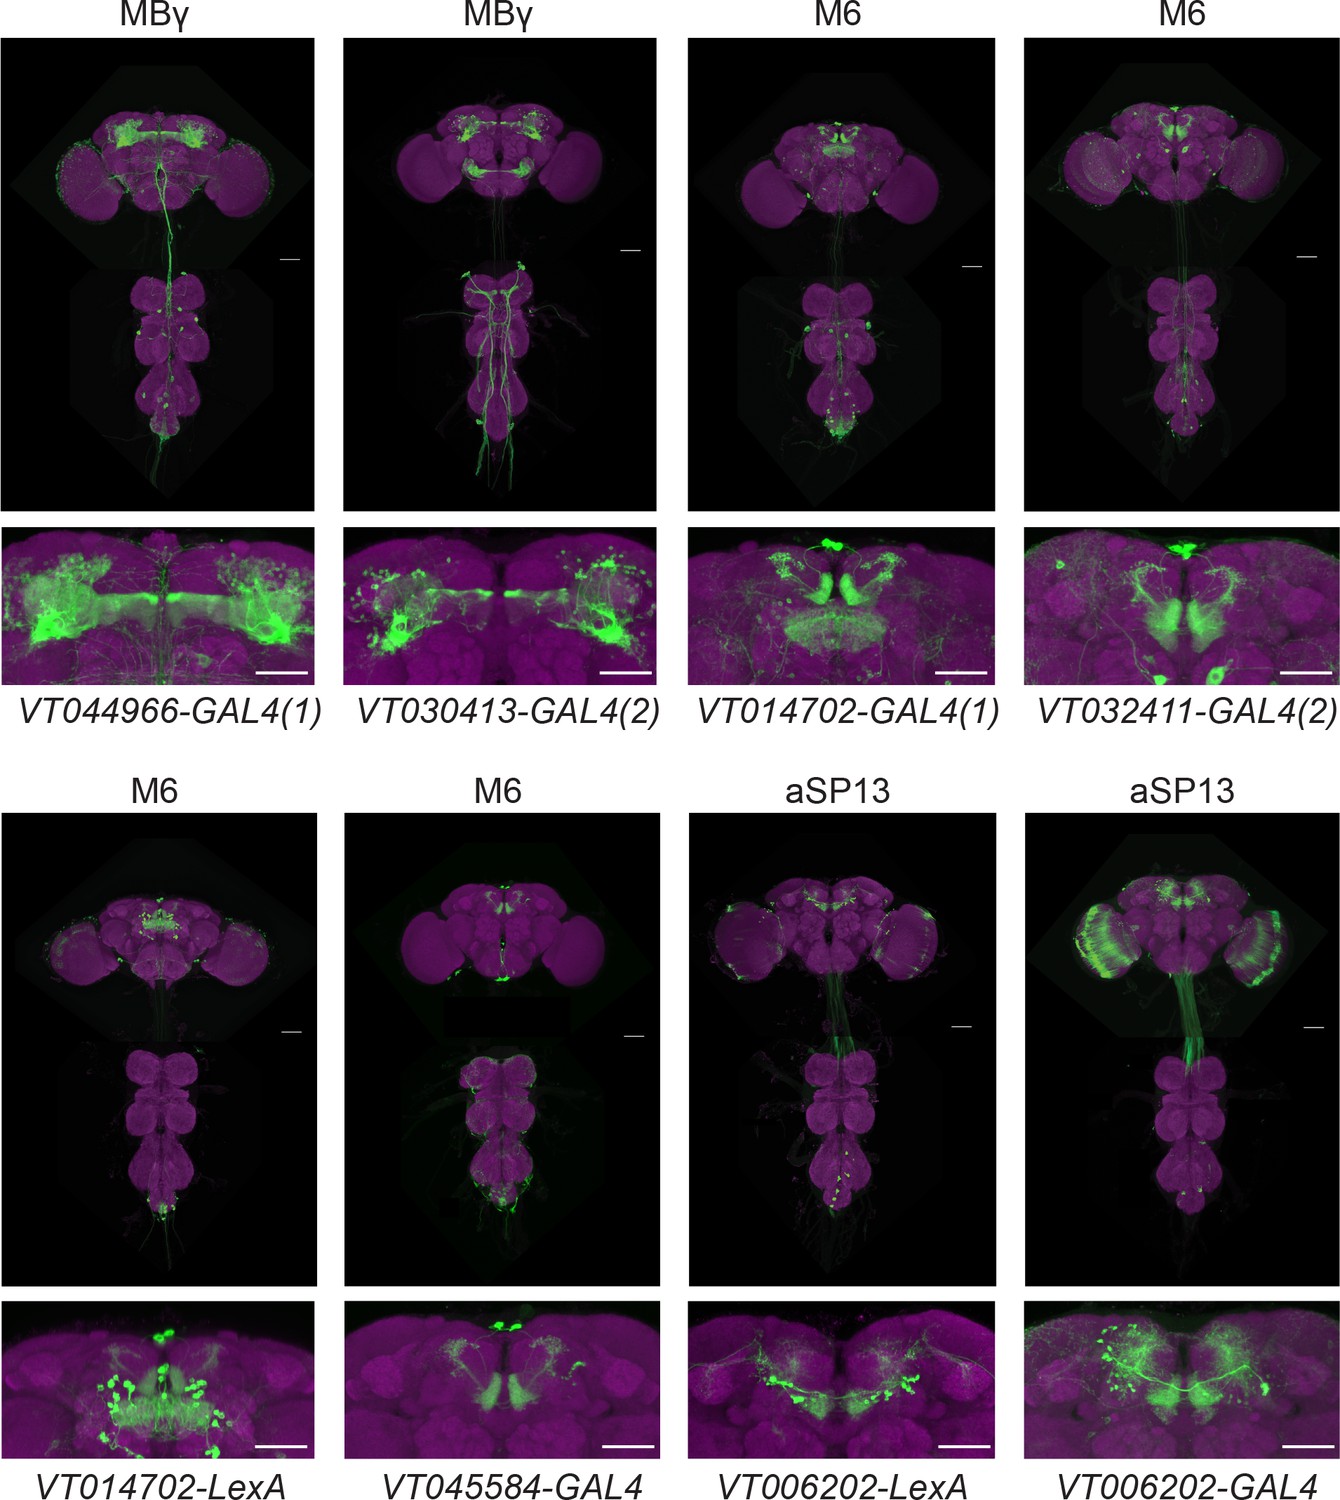
MBγ, M6 and aSP13 GAL4 driver lines.
Maximum intensity projections from confocal images of whole central nervous systems of VT-GAL4 UAS-mCD8-GFP or VT-LexA LexAop-mCD8-GFP males, stained for presynaptic sites (magenta, mAb nc82) and anti-GFP (green). Scale bars, 50 μm.
Figure 2 with 3 supplements
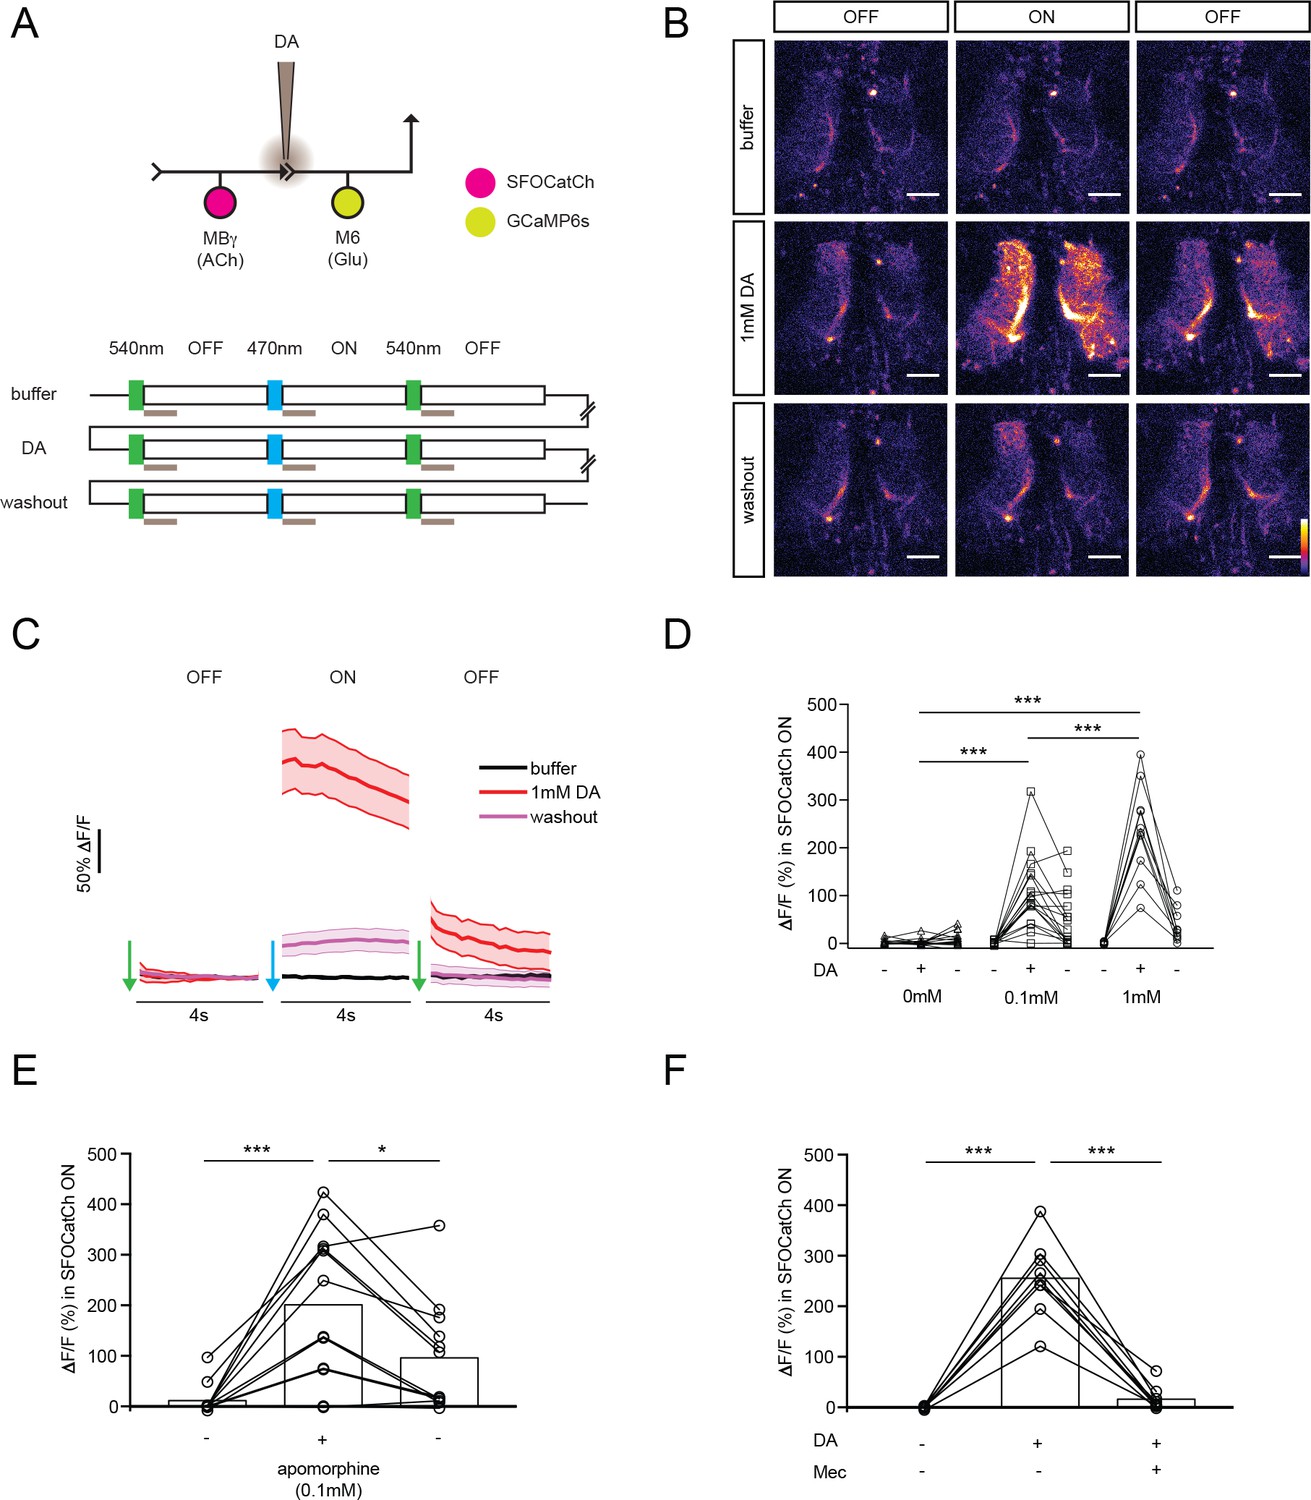
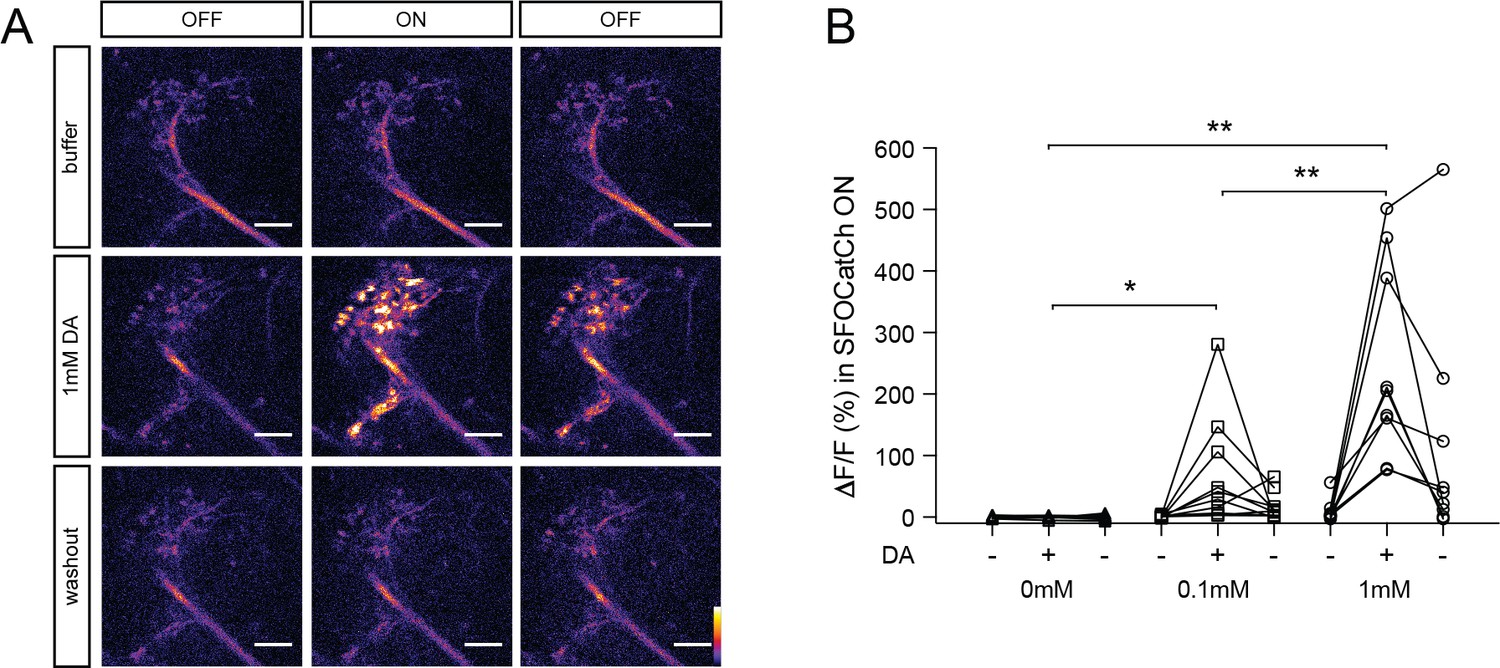
Dopamine modulates synaptic transmission from MBγ to M6 neurons.
(A) Experimental protocol. OFF and ON indicate 4 s imaging periods, preceded by 100 ms pulses of 540 nm or 470 nm light to switch SFOCatCh OFF and ON, respectively. Gray bars indicate 1 s focal perfusion into the γ5 compartment. Buffer, dopamine injection (DA) and washout trials are separated by 3 min intervals. (B) Representative calcium responses in M6 dendrites in the γ5 compartment. Scale bar, 10 μm. (C) Average ΔF/F responses in M6 dendrites. n = 10. Mean ± s.e.m. (D) Average ΔF/F responses during the SFOCatCh ON periods of successive buffer, DA, and washout trials. n = 15, 17, 10 for 0, 0.1, and 1.0 mM DA, respectively. ***p<0.001, t-test. (E) Average ΔF/F responses during the SFOCatCh ON periods of successive buffer, apomorphine, and washout trials. n = 12. *p<0.05, ***p<0.001, t-test. (F) Average ΔF/F responses during the SFOCatCh ON periods of successive trials with buffer only, 1 mM DA, and DA plus 0.15 mM mecamylamine (Mec). n = 9. ***p<0.001, t-test.
Figure 2—figure supplement 1
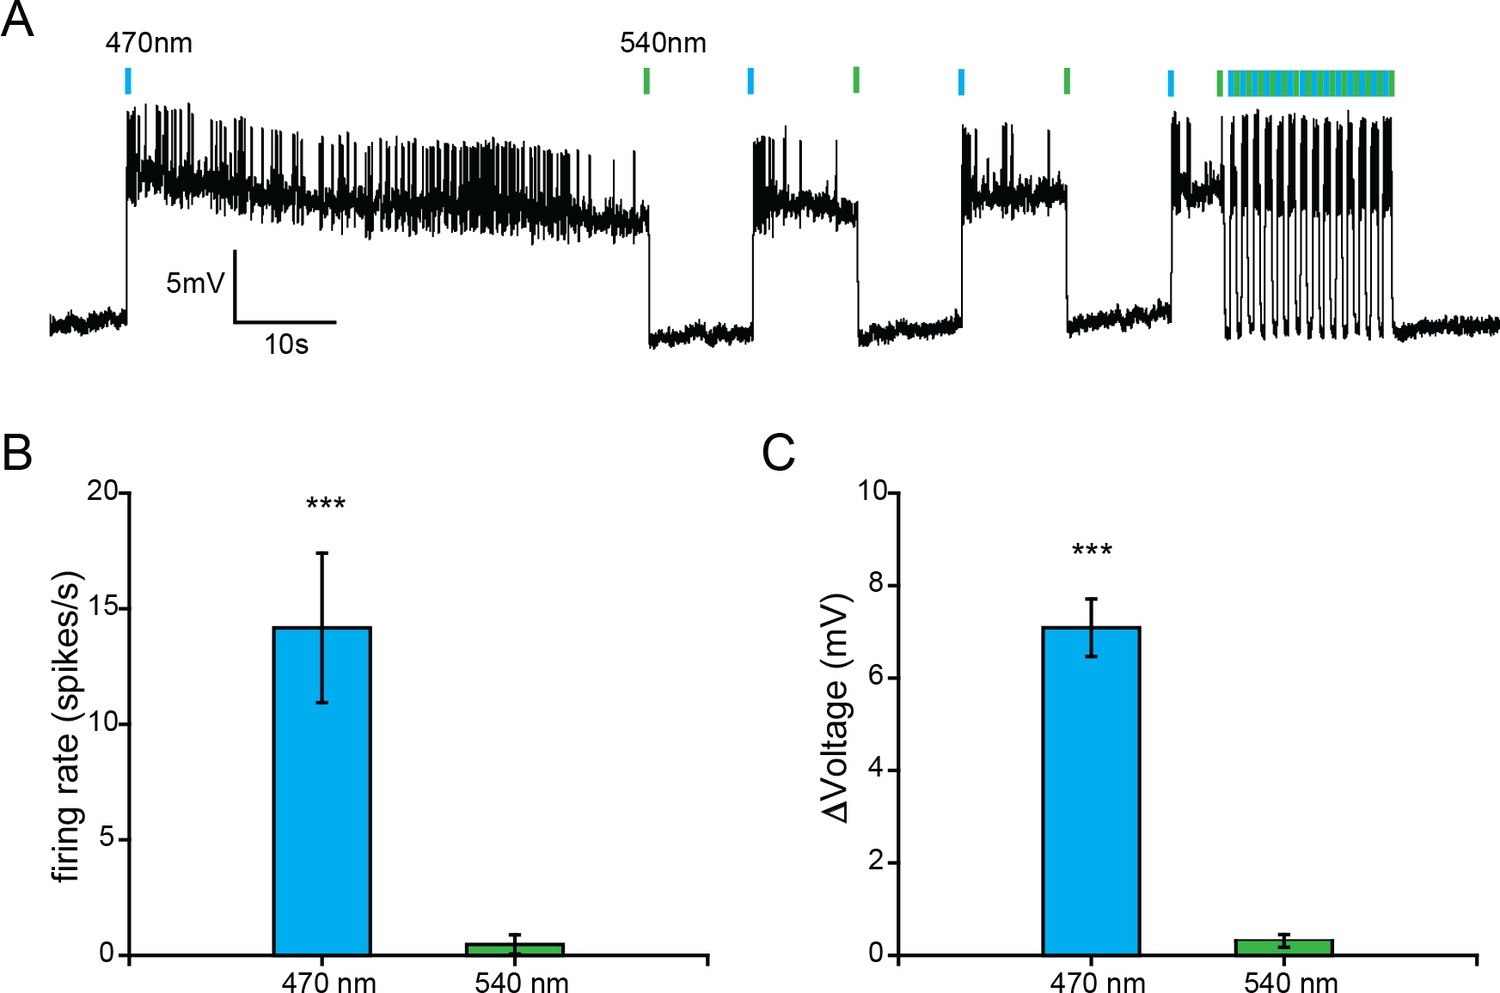
SFOCatCh, a step-function optogenetic activator.
(A) Patch-clamp recording from an olfactory projection neuron of a GH146-GAL4 UAS-SFOCatCh male. Blue and green bars indicate 100 ms pulses of 470 nm and 540 nm light. (B) and (C) Firing rate (B), n = 11 cell-attached recordings) and membrane potential (C), n = 4 whole-cell recordings of olfactory projection neurons during the first 5 s after stimulation with 470 nm or 540 nm light. Mean ± s.e.m. ***p<0.001 for comparisons to zero, t-test.
Figure 2—figure supplement 2
Calcium responses in M6 axons upon optogenetic stimulation of MBγ neurons using SFOCatCh.
(A) Representative calcium responses in M6 axons. Experimental protocol as in Figure 2A. Scale bar, 10 μm. (B) Average ΔF/F responses in M6 axons during the SFOCatCh ON periods of successive buffer, DA, and washout trials. n = 11, 10, 9 for 0, 0.1, and 1.0 mM DA, respectively. *p<0.05, **p<0.01, one-way ANOVA test.
Figure 2—figure supplement 3
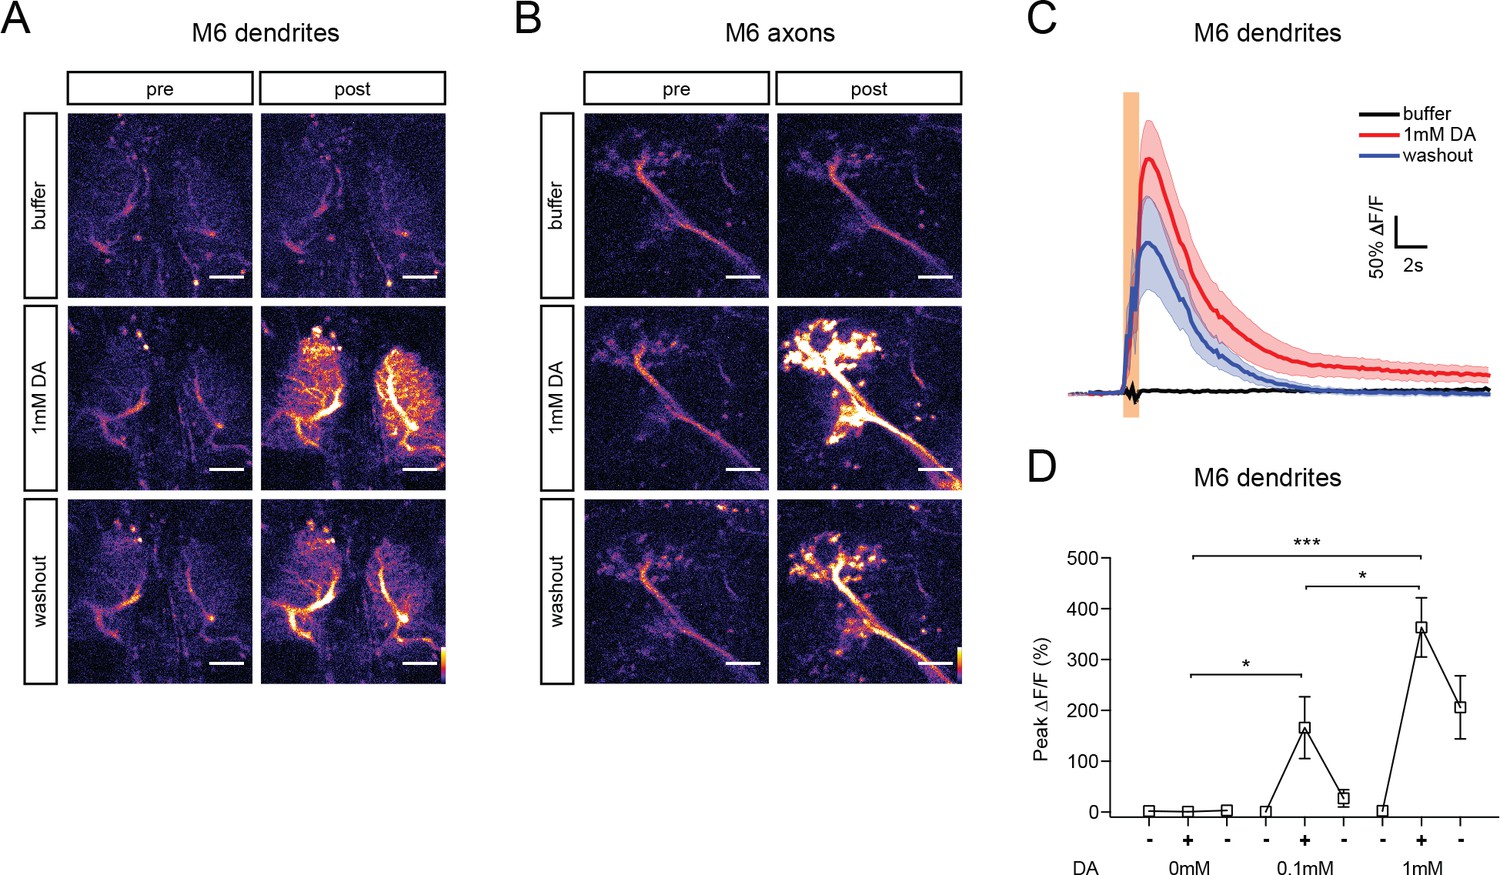
Calcium responses in M6 neurons upon optogenetic stimulation of MBγ neurons using CsChrimson.
(A) and (B) Representative calcium responses in M6 dendrites (A) and axons (B) of male brains expressing GCaMP6s in M6 neurons and CsChrimson in MBγ neurons, prior to (pre) and after (post) stimulation with 635 nm LED light Scale bar, 10 μm. Buffer, DA, and washout trials were performed at 3 min intervals. (C) Average ΔF/F responses in M6 dendrites during successive buffer, DA, and washout trials. Light red bar indicates stimulation with 30 2 ms LED pulses at 30 Hz. Mean ± s.e.m. n = 12. (D) Average ΔF/F responses in M6 dendrites during successive buffer, DA, and washout trials. n = 12, 7, 12 for 0, 0.1, and 1.0 mM DA, respectively. *p<0.1, ***p<0.001, one-way ANOVA test.
Figure 3
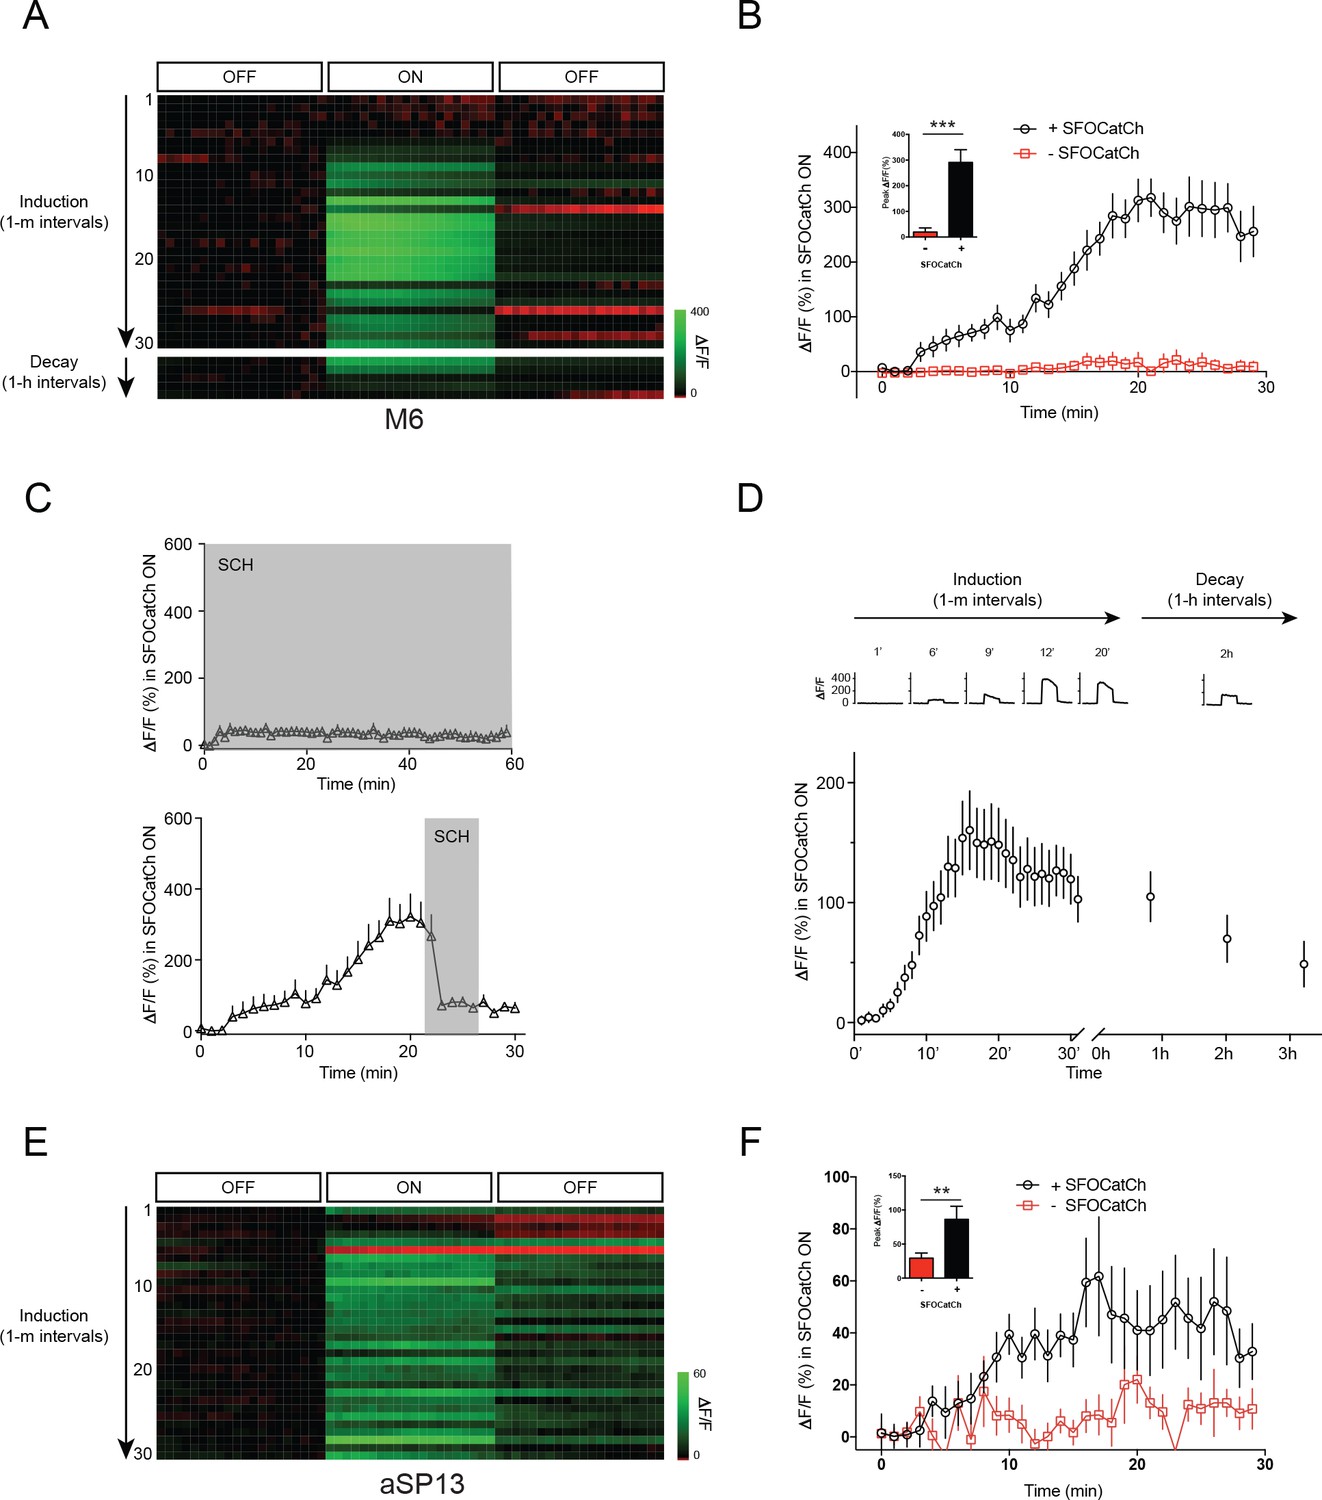
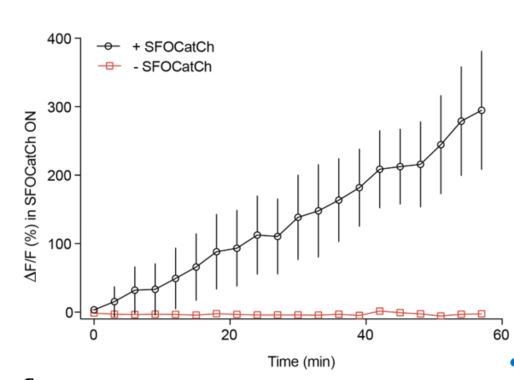
Repetitive stimulation of MBγ potentiates MBγ to M6 transmission.
(A) Representative calcium responses in M6 dendrites in the γ5 compartment upon repetitive optogenetic stimulation of MBγ neurons with SFOCatCh. (B) Time course of average ΔF/F responses in M6 dendrites during potentiation, mean ± s.e.m. n = 16 for +SFOCatCh, n = 6 for –SFOCatCh. Inset, peak ΔF/F responses, mean ± s.e.m. ***p<0.001, t-test. (C) Average ΔF/F responses during the SFOCatCh ON periods in M6 dendrites in the γ5 compartment in trials with SCH23390 present (grey shading) either during (top) or after (bottom) induction. (D) Time course of average ΔF/F responses in M6 dendrites during potentiation (30 stimuli at 1 m intervals) and decay (stimulation at ~1 hr intervals), mean ± s.e.m. n = 19. Top, representative calcium responses at various time points, during the 3 × 4 s OFF/ON/OFF imaging periods. (E) Representative calcium responses in aSP13 axons in the γ5 compartment upon repetitive optogenetic stimulation of MBγ neurons with SFOCatCh. (F) Time course of average ΔF/F responses in aSP13 axons during potentiation, mean ± s.e.m. n = 10 for +SFOCatCh, n = 7 for –SFOCatCh. Inset, peak ΔF/F responses, mean ± s.e.m. **p<0.01, t-test.
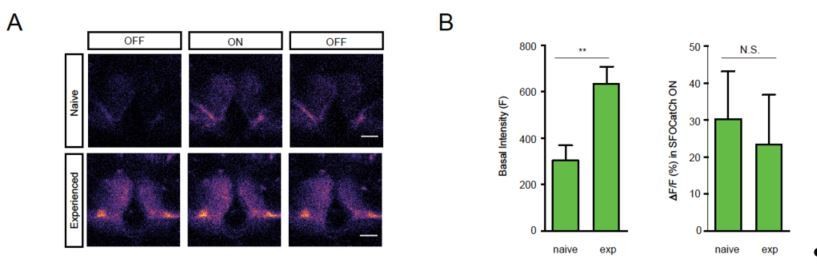
Figure 4 with 2 supplements

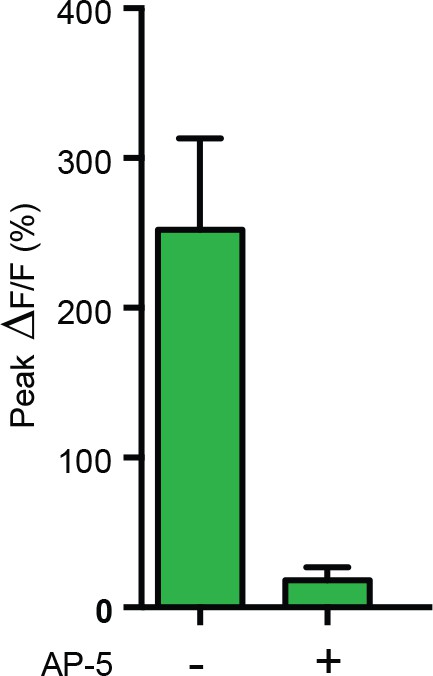
M6 or MBγ activation induces a persistent calcium response in aSP13.
(A) Experimental protocol for M6 activation and aSP13 imaging, and representative calcium responses in aSP13 axons in the γ5 compartment. Scale bar, 10 μm. (B) Average ΔF/F responses in aSP13 axons, mean ± s.e.m. n = 22. (C) Average ΔF/F responses during the SFOCatCh ON periods in trials with (n = 9) or without 50 μM D-AP-5 (n = 22). ***p<0.001, t-test. (D) Average ΔF/F responses, imaged at 1 Hz after 200 s of post-stimulus section. (E) Experimental protocol for MBγ activation and aSP13 imaging, and representative calcium responses in aSP13 axons in the γ5 compartment. Scale bar, 10 μm. (F) Average ΔF/F responses in aSP13 axons, mean ± s.e.m. n = 13. (G) Average ΔF/F responses during the SFOCatCh ON periods in trials with or without 1 mM DA, 50 μM AP-5, or 150 μM mecamylamine (Mec). n = 13, 13, 5,10, respectively. **p<0.01, ***p<0.001, t-test. (H) Average ΔF/F responses, imaged at 1 Hz after 200 s of post-stimulus section. (I) Suppression indices (SI) of male flies in which shits is expressed in M6 neurons, shifted to 32°C during training or testing, as indicated. ***p<0.001, **p<0.01, *p<0.05, permutation tests, see Supplementary file 2.
Figure 4—figure supplement 1
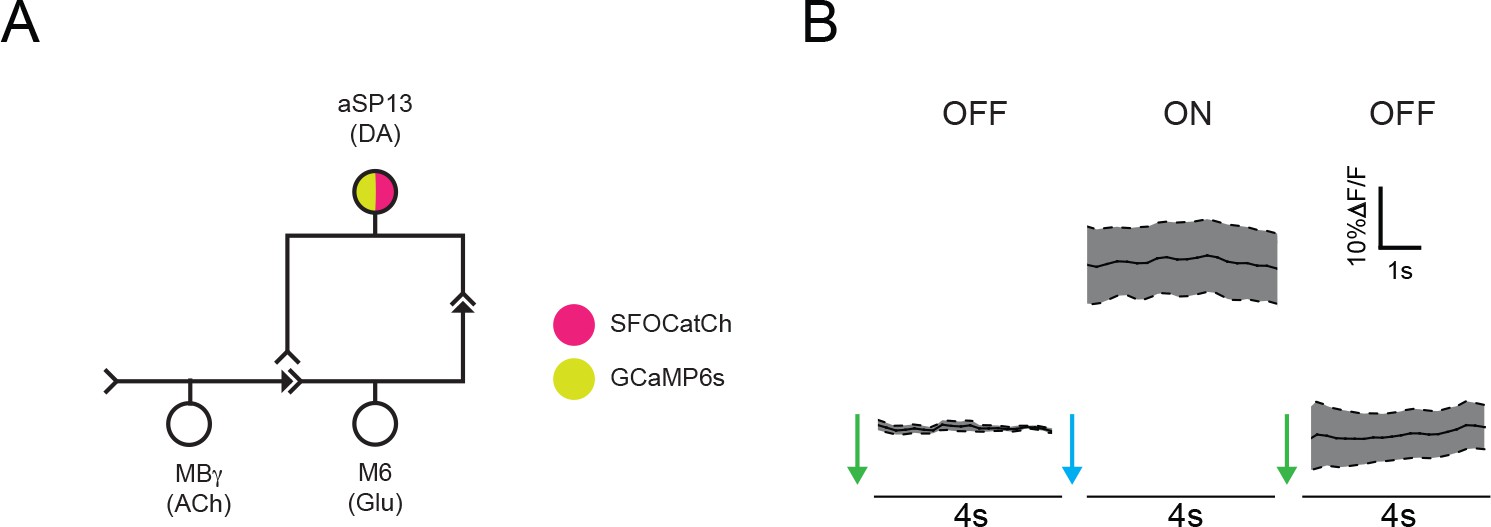
Stimulation of aSP13 does not elicit a persistent autonomous calcium response.
Average ΔF/F responses in the γ5 compartment of males expressing both SFOCatCh and GCaMP6s in aSP13 neurons. Experimental protocol as in Figure 3A. Mean ± s.e.m. n = 6.
Figure 4—figure supplement 2
Response in M6 after repetitive activation of MBγ is blocked by NMDA-R antagonist.
Average ΔF/F responses during the SFOCatCh ON periods with or without 50 μM AP-5. Mean ± s.e.m. n = 6 and 9, respectively.
Author response image 1
Repetitive stimulation of MBg every 3 minutes potentiates MBg to M6 transmission without the exogenous DA.
Time course of average DF/F responses in M6 dendrites during potentiation, mean+/-s.e.m.
Author response image 2
Author response image 3
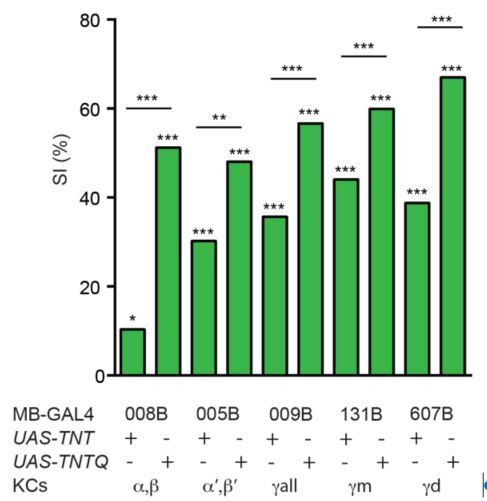
KCs are required for courtship learning.
Suppression indices (SI) in male flies in which active (UAS-TNT) or inactive (UAS-TNTQ) tetanus toxin was expressed in MB neurons. Statistical significance of differences from zero or from control groups is indicated as follows: *** P<0.001, ** P<0.01, *P<0.05.
Additional files
-
Supplementary file 1
Table S1.
Constitutive silencing of MBγ neurons impairs STM. Courtship indices of naïve (CI-) and experienced (CI+) males of the indicated genotypes according to Figure 1A, tested in single-pair assays with mated females as trainers and testers, shown as mean ± s.e.m. and median (italics) of n males. P values determined by permutation test for the null hypothesis that learning equals 0 (H0: SI = 0) or for the null hypothesis that experimental and control males learn equally well (H0: SI = SIc). Table S2. Constitutive silencing of M6 neurons impairs STM. Courtship indices of naïve (CI-) and experienced (CI+) males of the indicated genotypes according to Figure 1B, tested in single-pair assays with mated females as trainers and testers, shown as mean ± s.e.m. and median (italics) of n males. P values determined by permutation test for the null hypothesis that learning equals 0 (H0: SI = 0) or for the null hypothesis that experimental and control males learn equally well (H0: SI = SIc). Table S3. Activation of MBγ neurons is more potent in experienced than naïve males. Courtship indices at 20⁰C (CI20) and 32⁰C (CI32) of naïve (-) or experienced (+) males of the indicated genotypes according to Figure 1C, tested in single-pair assays with pseudomated females, shown as mean ± s.e.m. and median (italics) of n males. All males where trained at room temperature. P values determined by permutation test for the null hypotheses that learning equals 0 (H0: SI = 0), that experimental flies do not differ from the controls (H0: SI = SIc), and that courtship is equally suppressed in experienced and naïve males (H0: SI+=SI-). Table S4. Activation of M6 neurons is equally potent in naïve and experienced males. Courtship indices at 20⁰C (CI20) and 32⁰C (CI32) of naïve (-) or experienced (+) males of the indicated genotypes according to Figure 1D, tested in single-pair assays with pseudomated females, shown as mean ± s.e.m. and median (italics) of n males. All males where trained at room temperature. P values determined by permutation test for the null hypotheses that learning equals 0 (H0: SI = 0), that experimental flies do not differ from the controls (H0: SI = SIc), and that courtship is equally suppressed in experienced and naïve males (H0: SI+ = SI-).
- https://doi.org/10.7554/eLife.31425.013
-
Supplementary file 2
Table S5.
Acute silencing of M6 neurons impairs STM acquisition and retrieval. Courtship indices of naïve (CI-) and experienced (CI+) males of the indicated genotypes according to Figure 4H, tested in single-pair assays at the indicated temperature (⁰C) during training (Train) or testing (Test), with mated females as trainers and testers, shown as mean ± s.e.m. and median (italics) of n males. P values determined by permutation test for the null hypothesis that learning equals 0 (H0: SI = 0) or for the null hypothesis that experimental and either type of control males learn equally well (H0: SI = SIc).
- https://doi.org/10.7554/eLife.31425.014
-
Supplementary file 3
Fly genotypes.
Specific fly genotypes used in all main and supplementary figures.
- https://doi.org/10.7554/eLife.31425.015
-
Transparent reporting form
- https://doi.org/10.7554/eLife.31425.016
Download links
A two-part list of links to download the article, or parts of the article, in various formats.
Downloads (link to download the article as PDF)
Open citations (links to open the citations from this article in various online reference manager services)
Cite this article (links to download the citations from this article in formats compatible with various reference manager tools)
Persistent activity in a recurrent circuit underlies courtship memory in Drosophila
eLife 7:e31425.
https://doi.org/10.7554/eLife.31425


