Hepatitis B virus core protein allosteric modulators can distort and disrupt intact capsids
- Indiana University, United States
- Indiana University Electron Microscopy Center, United States
- Assembly Biosciences, United States
Figures
Figure 1
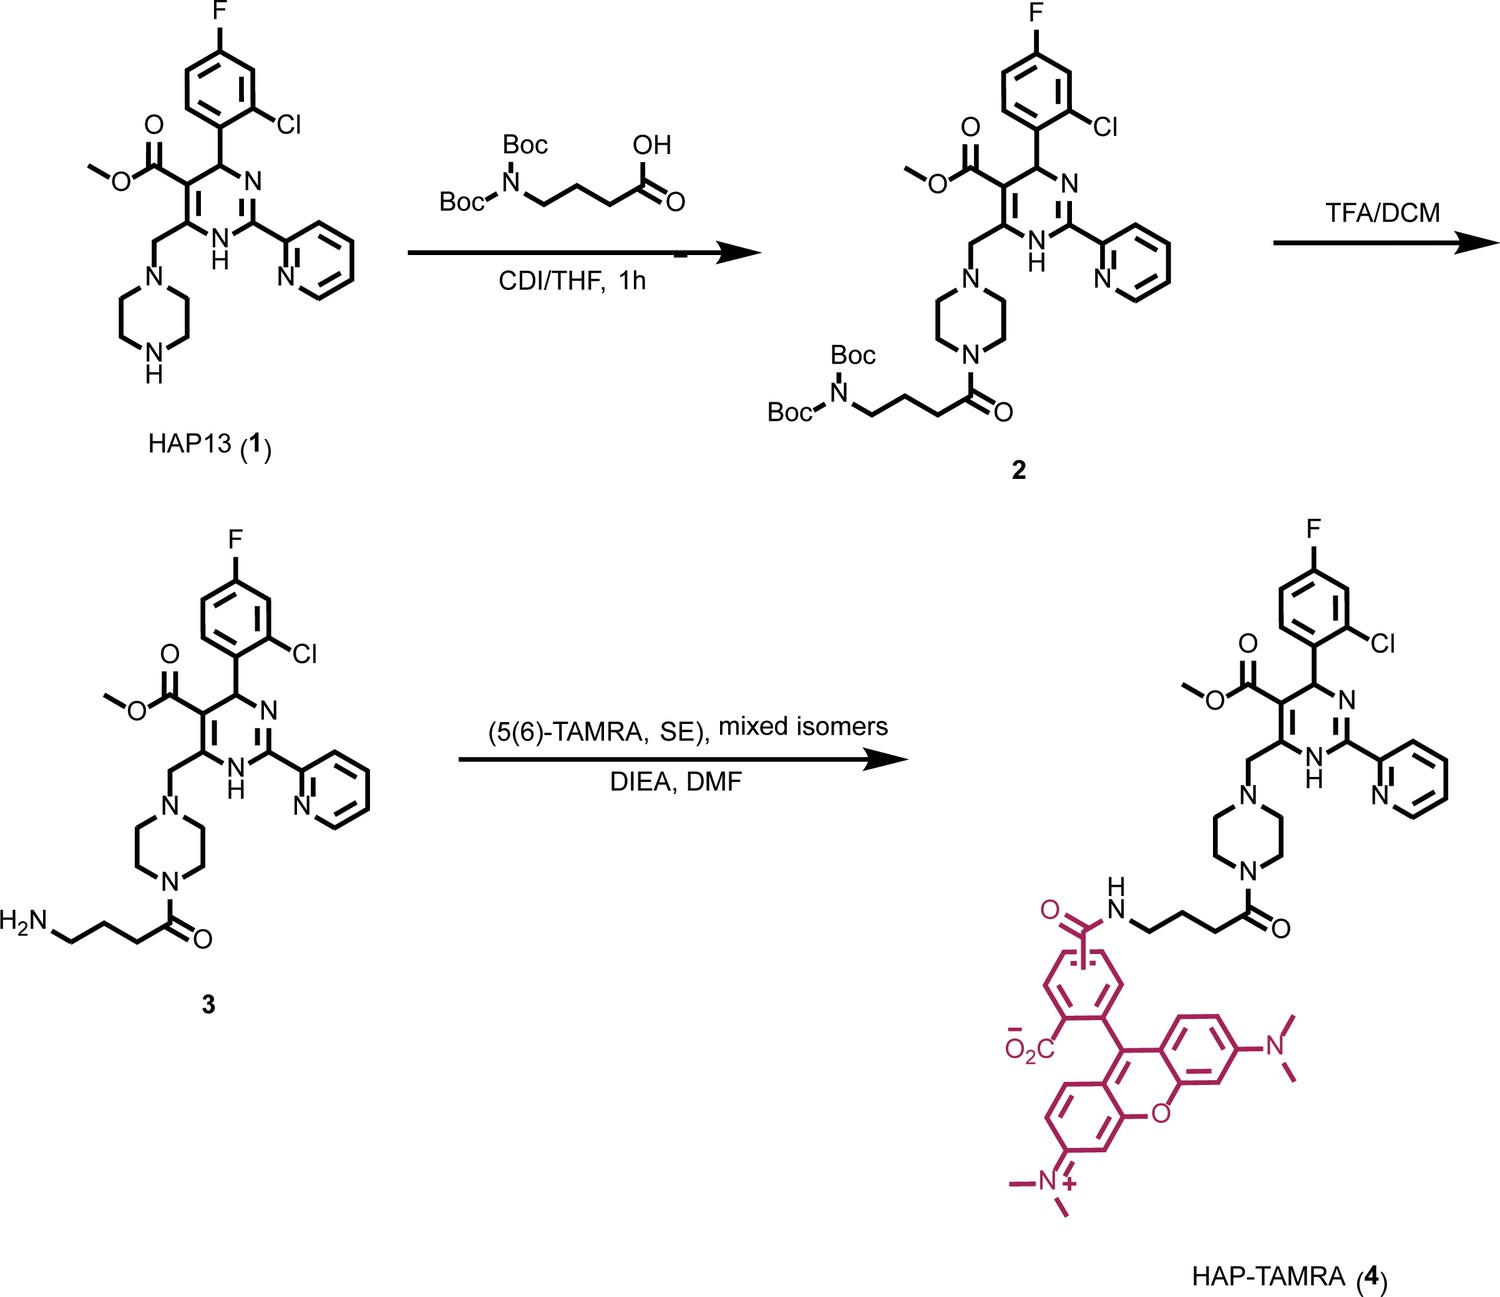
Synthesis of HAP-TAMRA.
HAP-TAMRA is a derivative of HAP13 (Bourne et al., 2008) with a tetramethylrodamine (TAMRA) moiety.
Figure 2

HAP-TAMRA drives core protein assembly.
(a) A negative stain micrograph of a typical assembly reaction using purified core protein. (b) Like other HAPs, stoichiometric excess of HAP-TAMRA drives assembly of non-capsid polymers of core protein. (c) A representative size exclusion chromatograph, monitored at 555 nm to pick up TAMRA, shows that HAP-TAMRA co-elutes with capsid. (inset) Spectra of the capsid-bound HAP-TAMRA (blue) and free forms show an unusual chromatic shift, suggestive of π-stacking of TAMRA moieties in the capsid. (d) Using the absorbance shift as an indicator (either the value at 520 nm or the ratio of 520/555 nm), we find that preformed capsids saturate at a stoichiometry of about one small molecule per dimer. The x axis represents ‘effective’ probes per Cp dimer, considering that half the input probe is an inactive enantiomer. Each point is an average of three measurements with error bars showing the standard deviation. The scale bars in (a) and (b) are 100 nm.
Figure 3
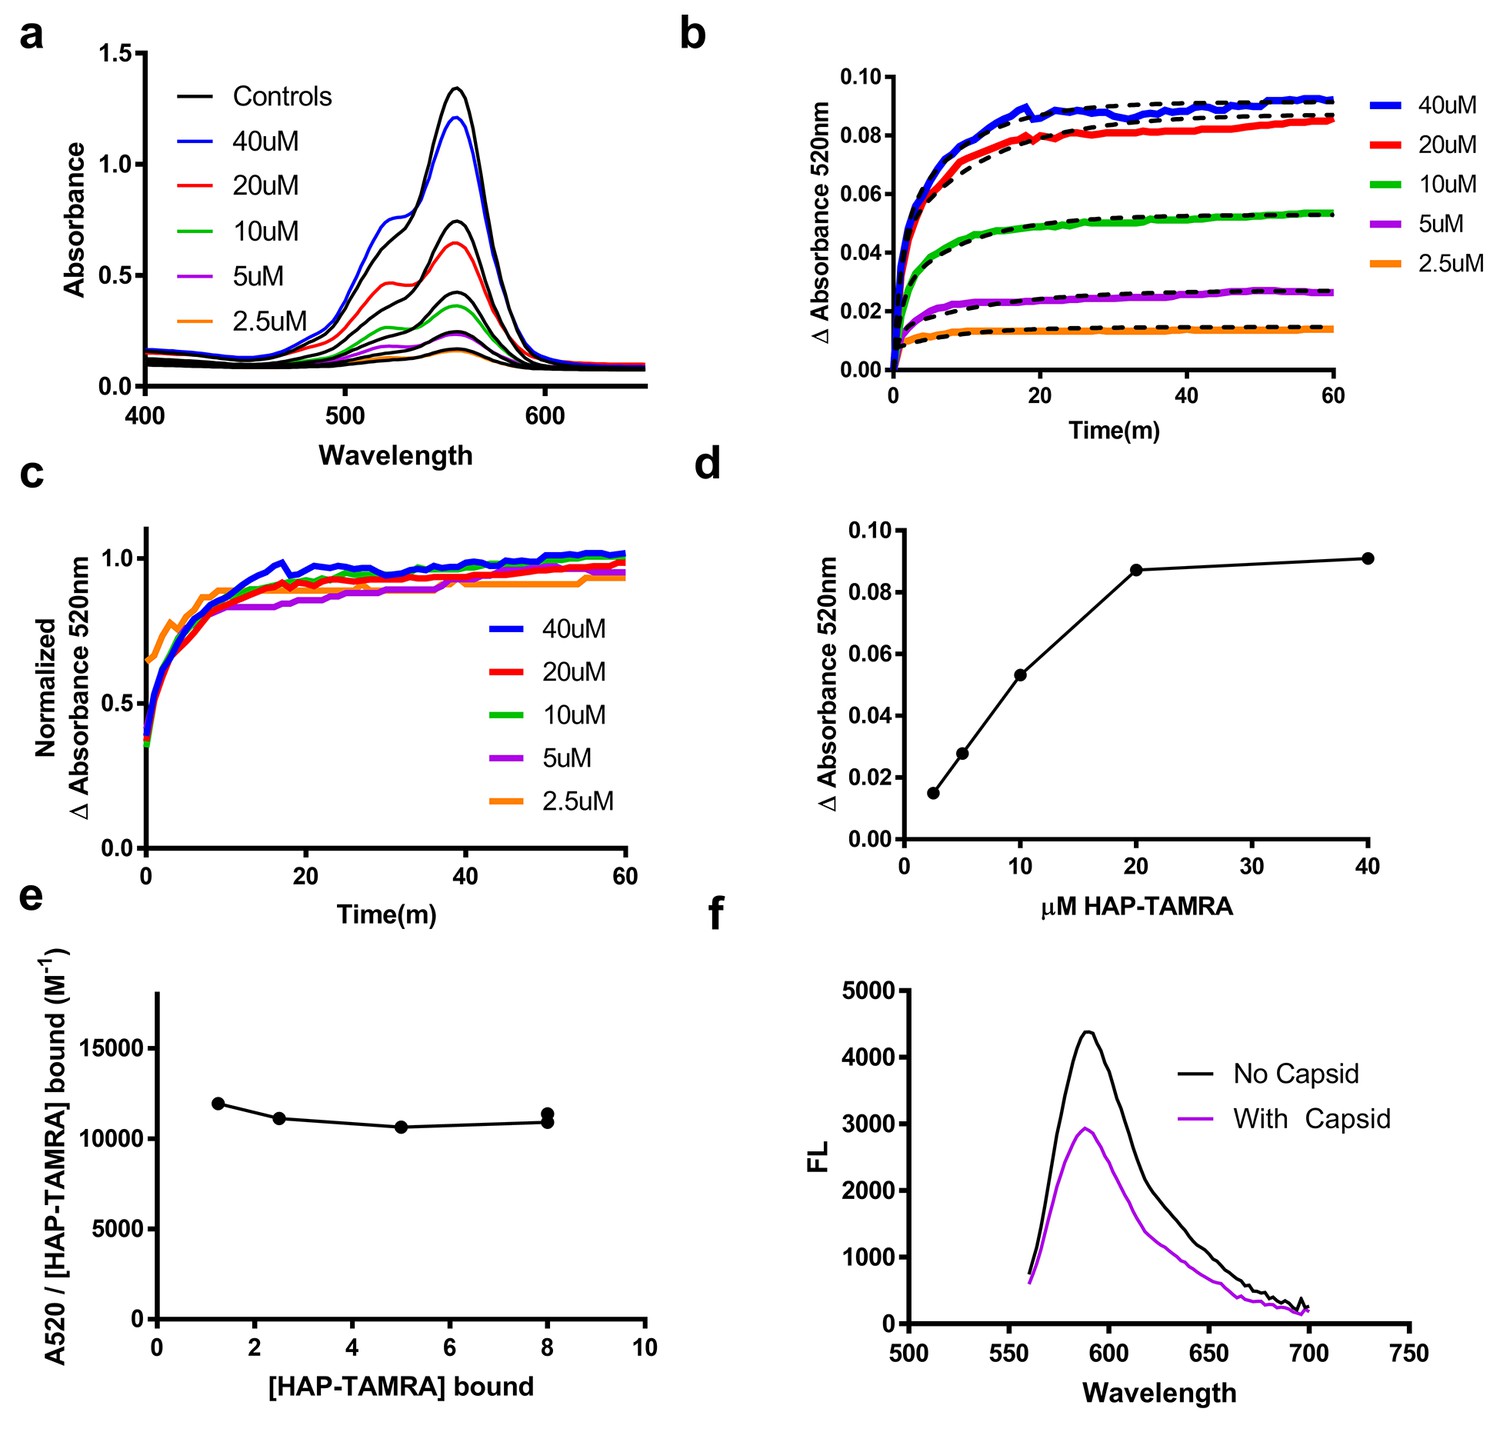
HAP-TAMRA absorbance and fluorescence change in response to binding capsid.
(a) HAP-TAMRA in solution for a matched pair of samples with 8 µM capsid (colored lines) and without (black lines). In the presence of capsid, the absorbance spectrum shifts towards one that resembles a π-stacked TAMRA dimer (Adachi et al., 2014). The change is not as dramatic as in Figure 2c, due to the presence of free dye in sample that have not been purified by SEC. (b) The change in absorbance at 520 nm can be used to observe kinetics of binding different HAP-TAMRA concentrations to 8 µM capsid, showing the time dependence of forming the samples in panel a. The kinetic traces are averages of three independent experiments. The dashed lines fit to a two-phase exponential association. The half-life for binding is between 5 and 10 min. (c) Further normalization of the kinetic curves by their maximum value gives a visual expression of the similarity of the half-lives, and reiterates that the kinetics appear to be similar across input concentrations (d) The time course in b was monitored for 350 min. Shown are the endpoint values of the change in 520 nm absorbance. The result is comparable to the one in Figure 2d, where the bound probe is isolated from the free probe. (e) Assuming the maximum amount of HAP-TAMRA binds to the protein in each condition, we can calculate the concentration of HAP-TAMRA bound. Plotting extinction coefficient for the ΔA520nm signal is constant across the titration, with a value of 11196 M−1 ± 4%. (f) A demonstration that fluorescence is also quenched upon binding using 40 µM HAP-TAMRA, 8 µM Cp dimer. In the presence of capsid, we estimate that 75% of the HAP-TAMRA was unbound, accounting for most of the residual fluorescence.
Figure 4
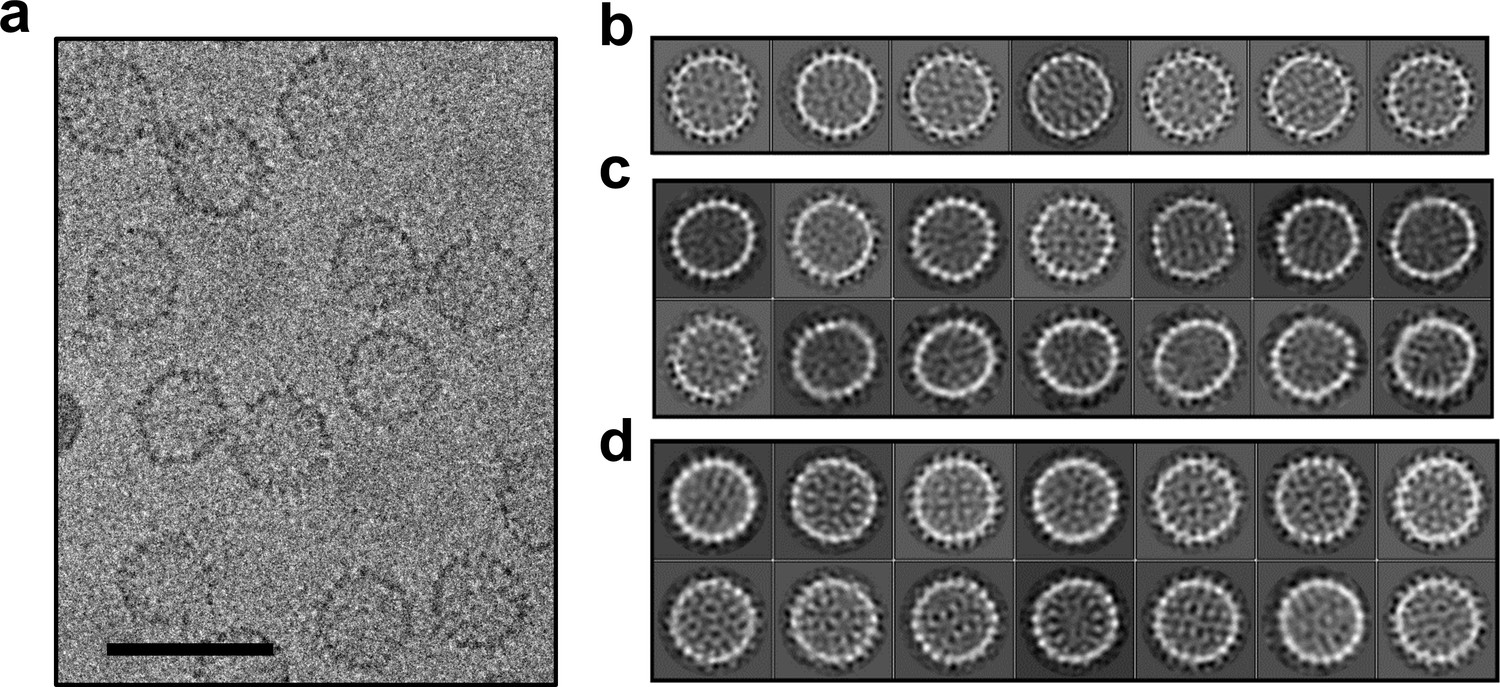
Cryo-microscopy shows that HAP-TAMRA distorts capsids.
(a) A cryo-micrograph shows a section of a field of Cp149 capsids treated with HAP-TAMRA. Particles appear asymmetric and have marked angles. None have the spherical cross-section typical of Cp149 capsids. (b–d) Cryo-micrographs of capsids were subject to 2D class averaging to identify their major characteristics. In each case, the classes are sorted by descending class distribution, (b) For apo-capsids of Cp149, lacking any HAP-TAMRA, all classes have a circular cross-section and a periphery of spikes. These seven classes encompass more than 80% of the Cp149 capsid particles sampled. (c) For micrographs of Cp149 particles soaked with HAP-TAMRA the most common class has an elliptical cross-section. Other classes have distinct and asymmetric faceting. The data in panels a and c are independent acquisitions of the same experimental conditions, demonstrating the repeatability of the effect. (d) The fourteen most populated classes from a micrograph of cysteine cross-linked Cp150 capsids treated with HAP-TAMRA resemble those of apo-Cp149 in panel b.
Figure 5
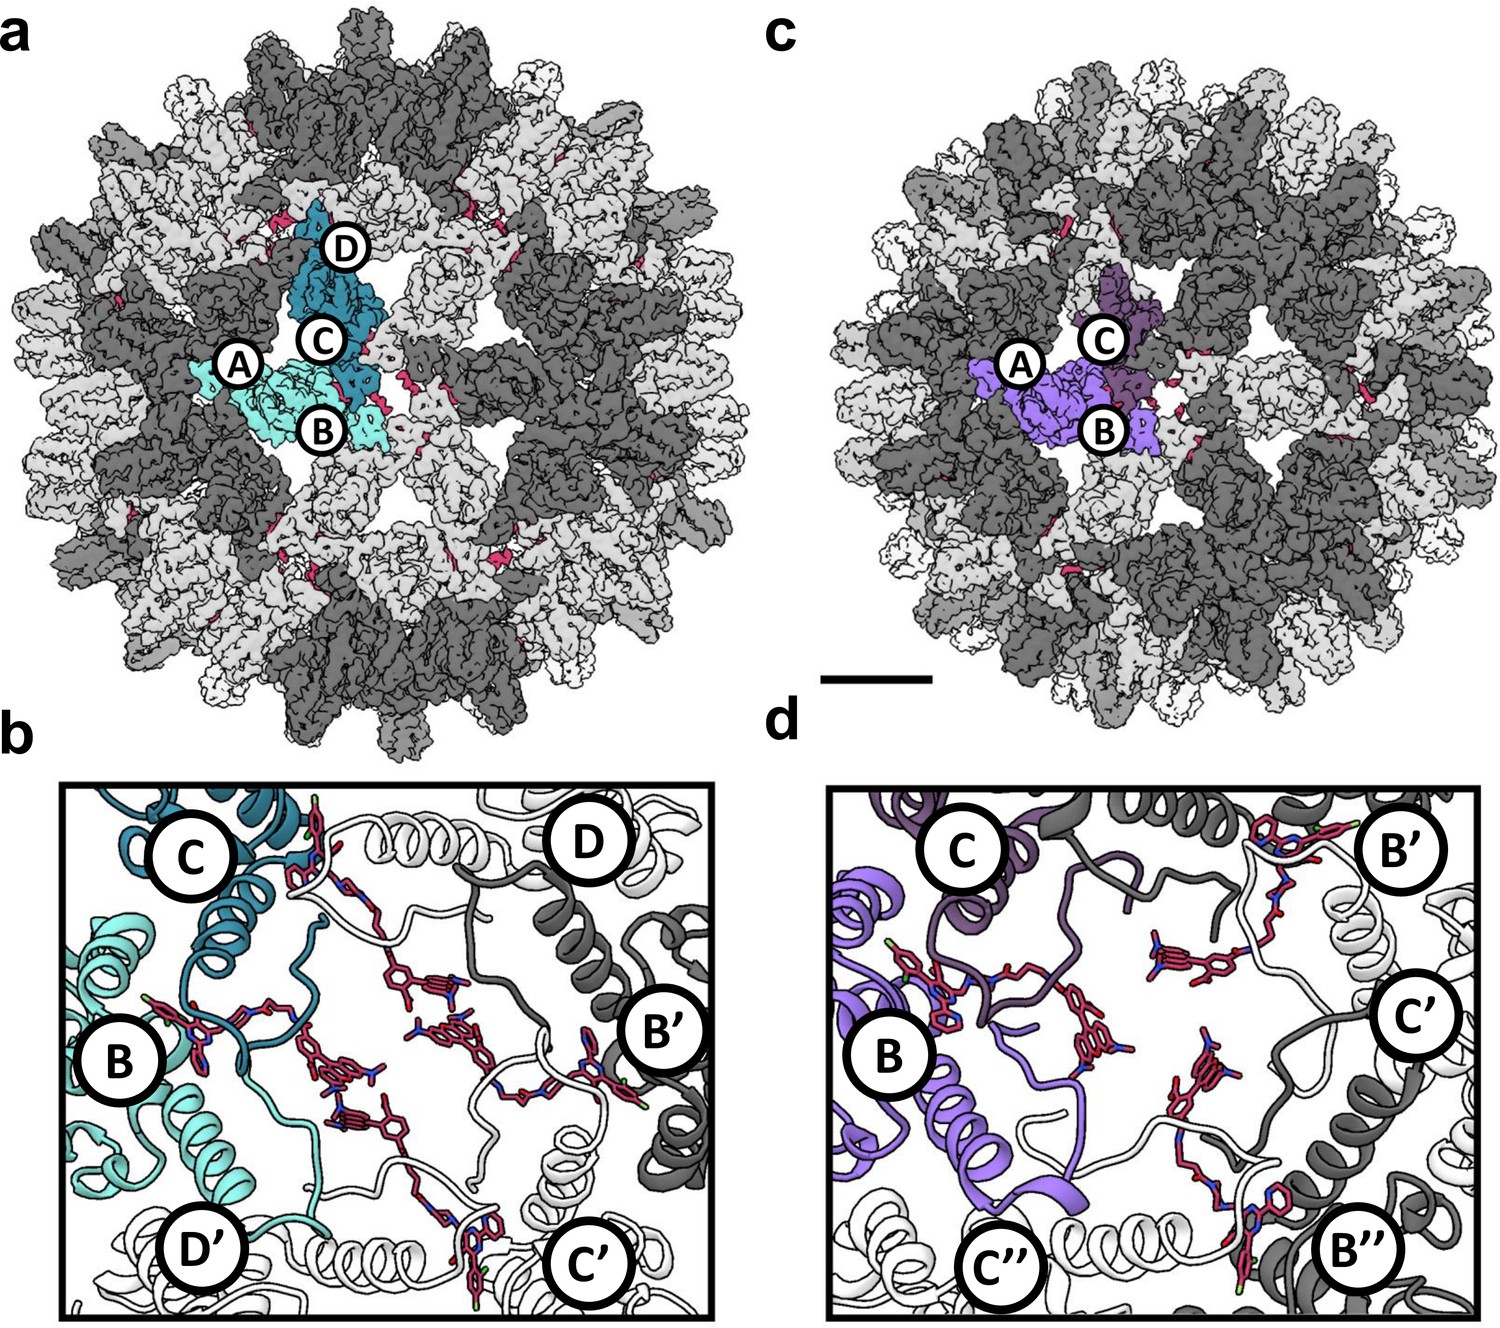
Reconstruction of T = 4 and T = 3 particles.
(a) A T = 4 capsid. A single asymmetric unit is composed of two dimers, and by convention the component subunit chains are labeled with letters A,B and C,D. The two subunits that form the AB dimer (light green) and a CD dimer (dark green) are highlighted. The HAP-TAMRA molecules are highlighted (red), and bind around a quasi-sixfold (icosahedral twofold) symmetry axis. The remaining AB dimers are shown in darker grey than the CD dimers. The scale bar is 5 nm and also applies to panel (c). (b) A single quasi-sixfold cluster from a T = 4 capsid. The coloring scheme is that same as in (a) except that all HAP-TAMRA molecules at the quasi-sixfold are highlighted. (c) A T = 3 capsid with the asymmetric unit comprised of an AB dimer (light purple) and one half of a CC dimer (dark purple) highlighted. (d) As per (b) except a T = 3 quasi-sixfold has threefold symmetry and three bound HAP-TAMRA molecules. In panels (b) and (d) symmetry-related subunits are denoted by the prime or double prime symbols.
Figure 6
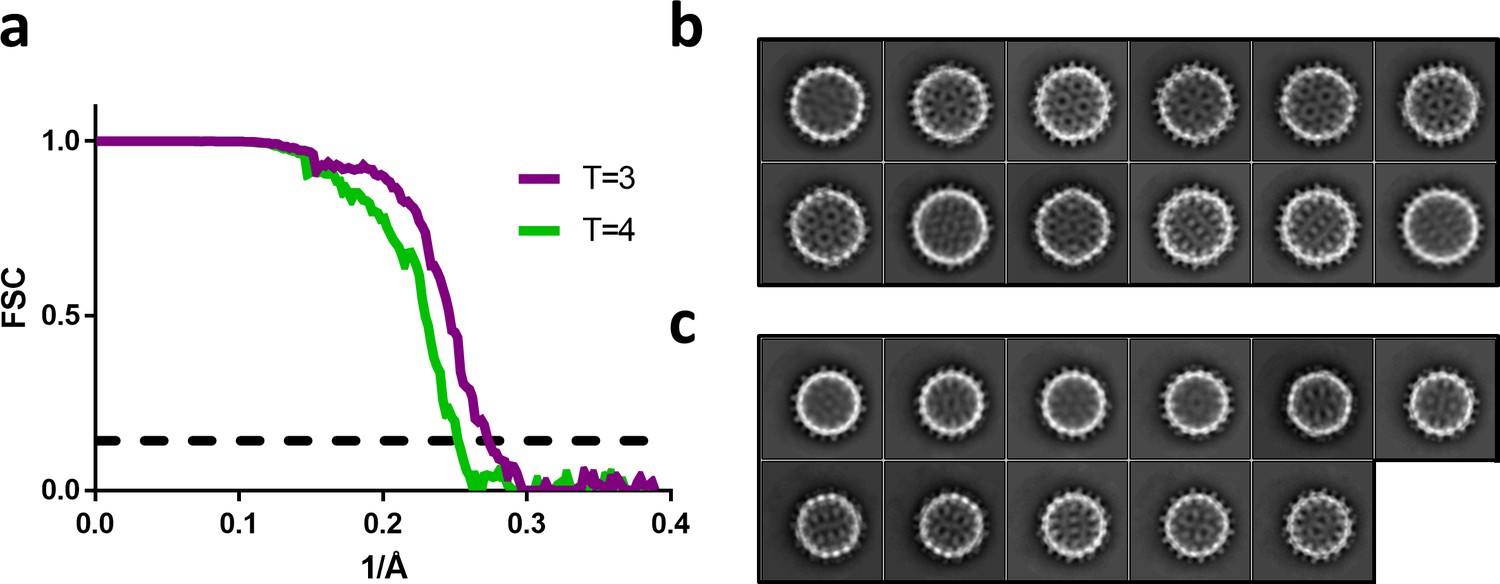
Fourier shell correlation and 2D class averages of T = 4 and T = 3 particles.
(a) Fourier shell correlation for the T = 4 and T = 3 reconstruction in green and purple, respectively. The dashed line indicates a correlation of 0.143. (b) The most populated 2D class averages from the T = 4 dataset reconstructed in Figure 5a. (c) The most populated 2D class averages from the T = 3 dataset reconstructed in Figure 5c.
Figure 7
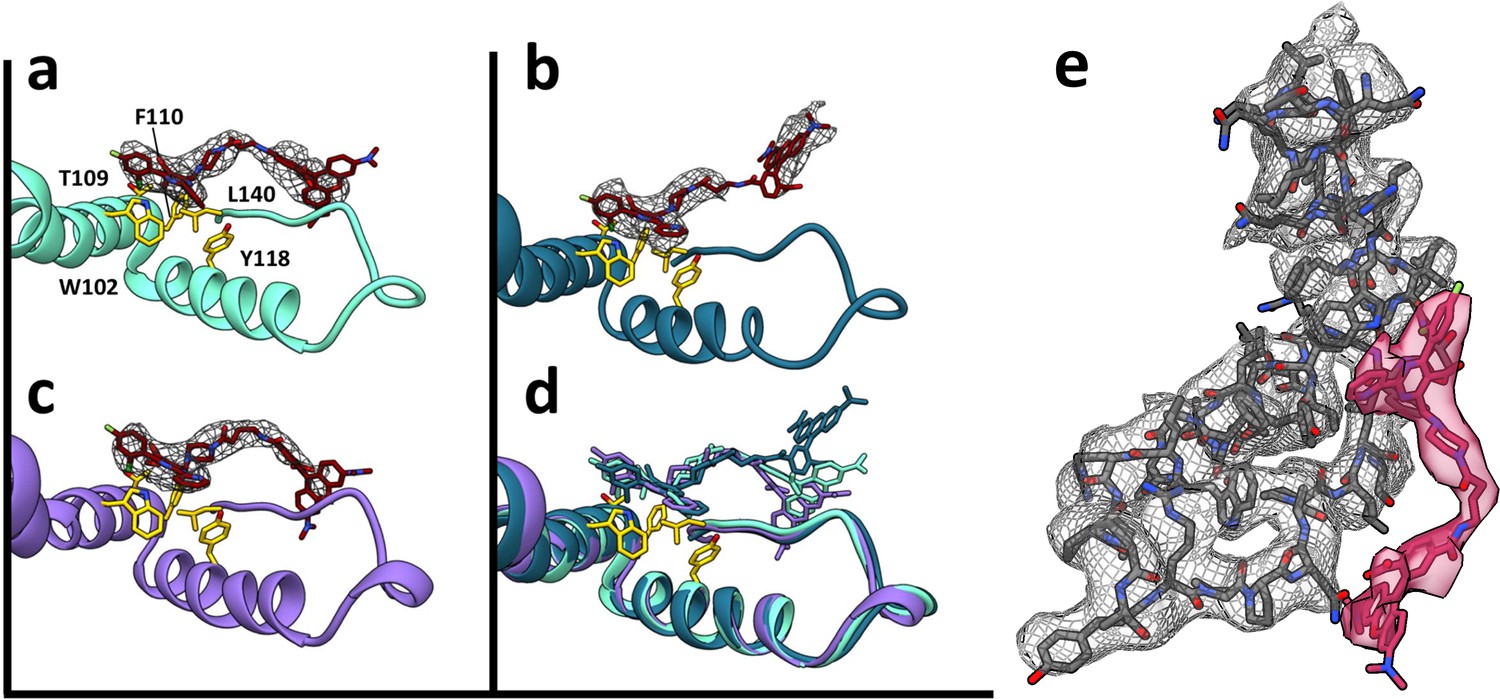
HAP-TAMRA has a very similar structure in three different quasi-equivalent environments.
The HAP site consists of a pocket in one subunit that is capped by a neighboring subunit. The pockets of the T = 4 B and C subunits (panels a and b) and the T = 3 B subunit (c) each has unambiguous density for the HAP and linker moieties of HAP-TAMRA at a contour level of 3.6 σ. The B subunits of T = 3 and T = 4 show well defined density for the TAMRA moiety. The TAMRA density of the T = 4 C subunit is more ambiguous (b), suggesting multiple orientations. We show a fit consistent with available density, and note that the HAP and TAMRA regions become contiguous by 2.6σ contour. When the HAP pockets are compared, based on overlaying the respective protein monomers (d), we observe that the HAP and linker moieties have essentially the same conformation in all three sites. (e) The B site for the T = 4 structure, from a different perspective than shown in panel (a), showing density for protein and HAP-TAMRA (contoured a 3.6σ). Note that Y132, the lower left of this view, is in the peptide turn on the right side of panels a-d.
Figure 8
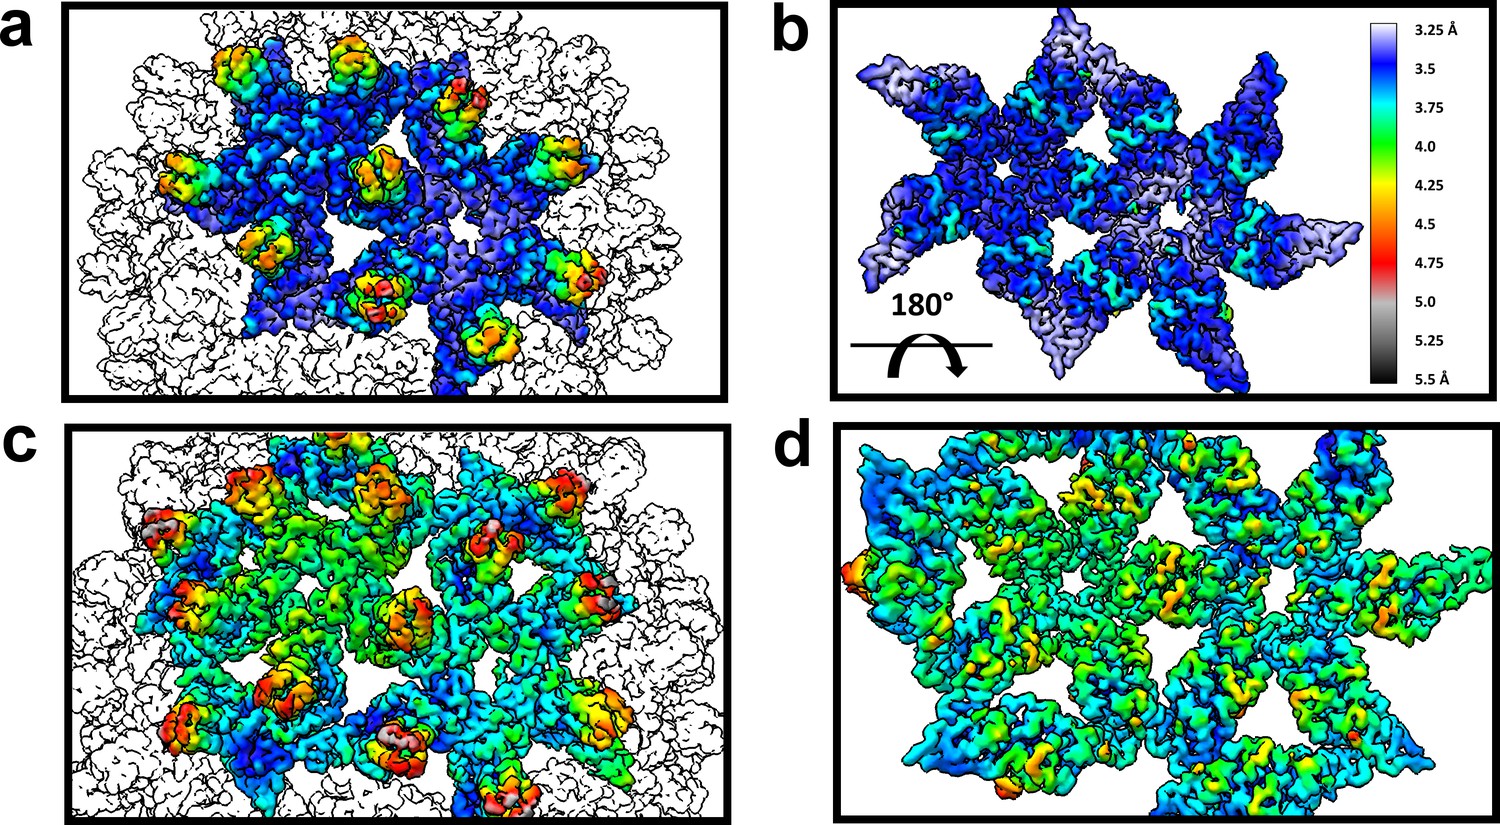
The dimer-dimer interactions, including the HAP-pocket, are structurally conserved.
T = 3 (a,b) and T = 4 (c,d) capsids are color coded by resolution. Spike tips are the lowest resolution features at 4.5–5 Å resolution. The interdimer interfaces near the HAP pockets and hydrophobic cores (i.e. the dimer chassis subdomain) at the intradimer interfaces are the highest resolution regions of both capsids. Variation of resolution is analogous to differences in crystallographic B factor.
Figure 9
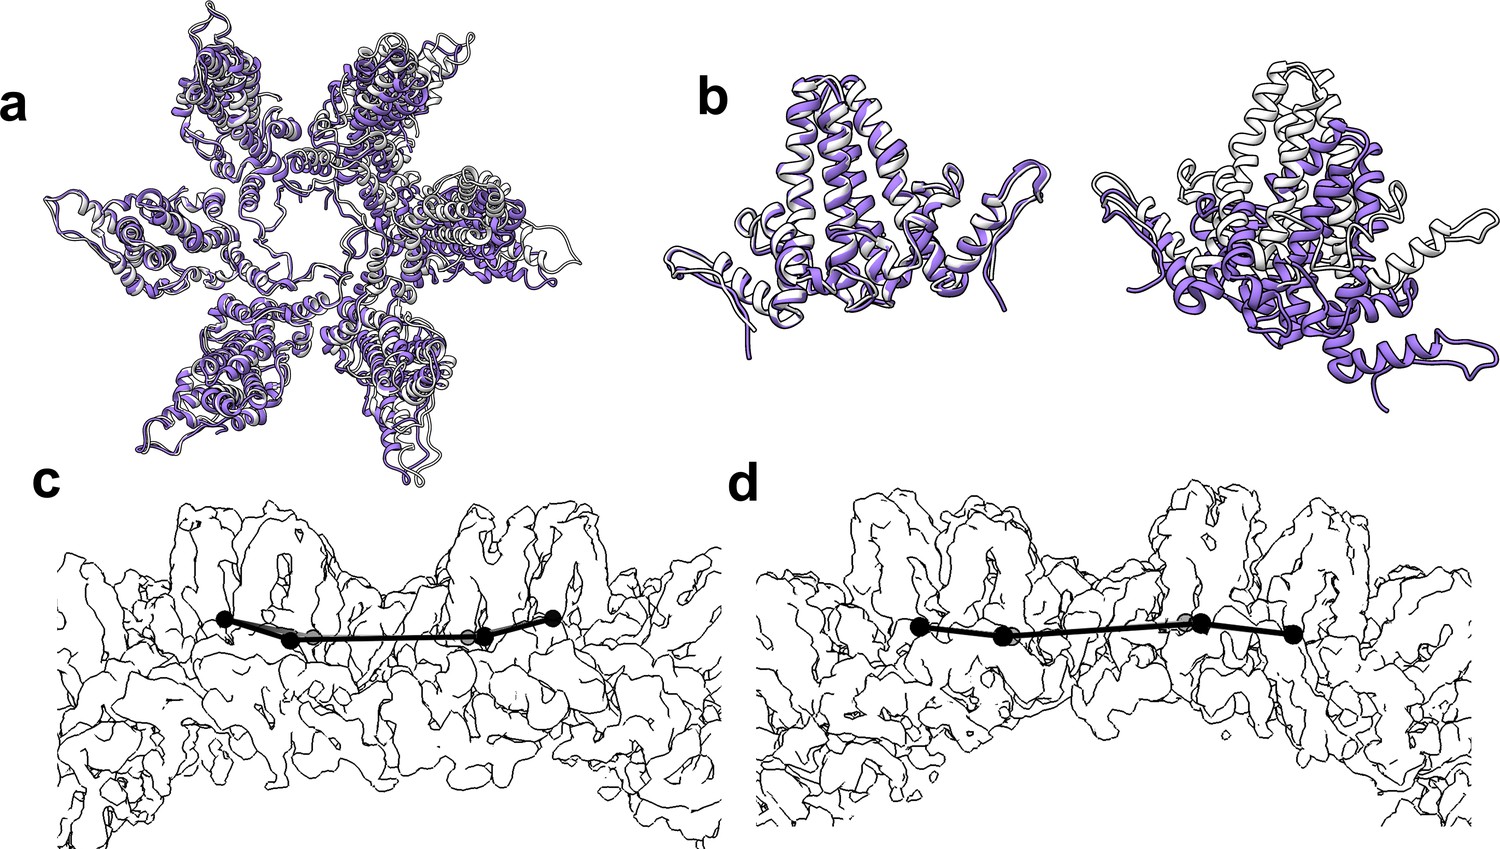
The flexibility of interdimer geometry is demonstrated by comparison of T = 3 and T = 4 quasi-sixfold vertices.
Dimer–dimer interaction varies in response to quasi-equivalent interaction, T number, and the presence of CpAM. The difference in the geometry of interaction can be difficult to see. (a) Quasi-sixfold clusters of dimers from the T = 4 (white) and T = 3 (purple) structures are overlaid based on the leftmost dimer; in both cases this is an AB dimer. (b) The aligned dimers (left) are nearly identical. The dimer opposite shows a dramatic difference in 4° structure imposed by a series of relatively subtle differences. (c, d) Side views of T = 4 (c) and T = 3 quasi-sixfold show that their 4° structures are analogous to the boat and chair conformations, respectively, associated with 6-membered rings in organic chemistry (e.g. cyclohexane).
Figure 10
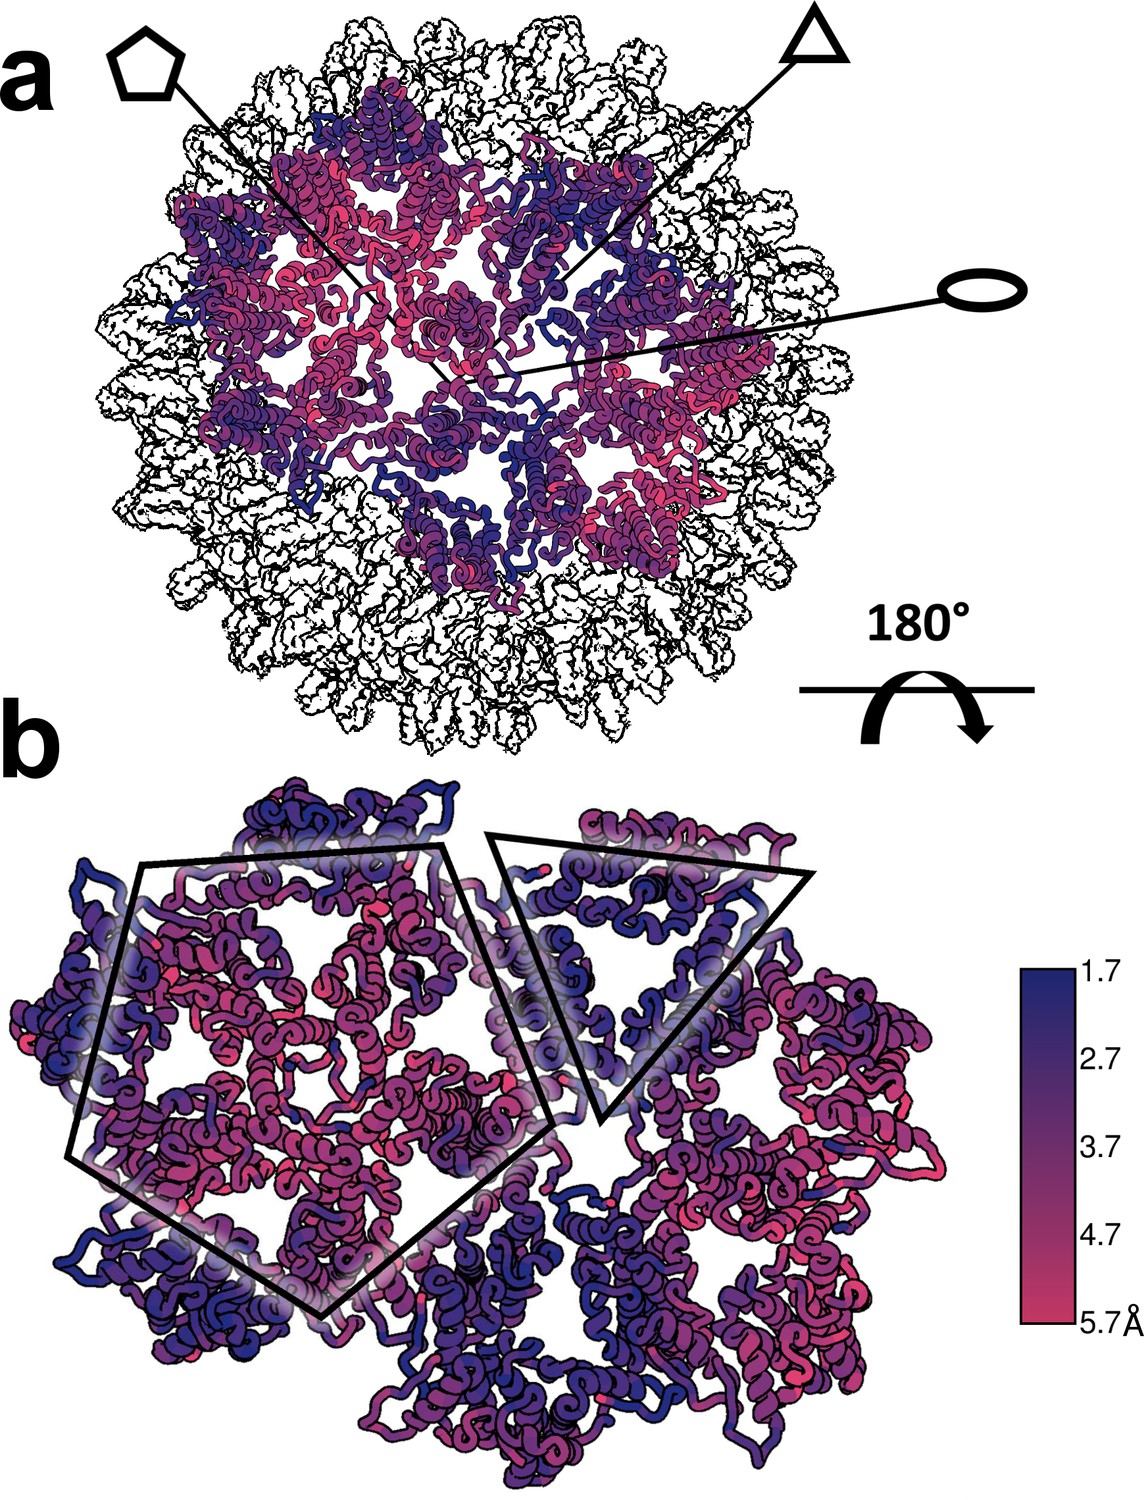
Structural defects induced by HAP-TAMRA are concentrated at icosahedral fivefold.
(a, b) Differences between the HAP-TAMRA capsid and an apo capsid (1QGT) were calculated by overlaying the two capsids based on a common center. Residues are color coded based on the displacement of the α carbons. Though the HAP-TAMRA capsids are systematically larger than the apo capsids, the smallest displacement is at the base of the CD dimers surrounding icosahedral three-fold (triangles in panel b). The A subunits surrounding the fivefold vertices (pentagons in panel b) show the greatest displacement.
Figure 11

A low resolution reconstruction of Cp149+HAP TAMRA shows that defects are concentrated at fivefold vertices.
(a) T = 4 reconstructions Cp149+HAP TAMRA show an absence of density on the fivefold. This suggests structural heterogeneity. Consistent with this, the reconstruction only achieved 22 Å resolution. (b) A density map based on the 1QGT molecular model down-sampled to 22 Å resolution shows the resolved features of a well-ordered fivefold. (c,d) Central slices through the experimental Cp149+HAP TAMRA map (c) and the 1QGT render (d). The effect of HAP-TAMRA was to angle the dimers surrounding the fivefold axis towards twofold axes. (e) 2D class averages of the particles collected for the reconstruction in panel a, sorted by descending class distribution demonstrate faceting and irregular morphology. (f) FSC for reconstruction of Cp149+HAP-TAMRA.
Videos
Video 1
A tour of a T=4 capsid (Video 1).
Intact surface-shaded capsids, contoured at 3.6 sigma, are shown with the AB dimers surrounding fivefold vertices shaded in dark grey, quasi-sixfold are alternating dark and light gray. HAP-TAMRA is red. An asymmetric unit is colored, disrupting the color scheme of one fivefold and one quasi-sixfold. For the T=4 capsid, the AB dimer is light blue and the CD dimer is dark blue. The quasi-sixfold has two B-C-D repeats. A quasi-sixfold is then extracted from the capsid and then the grey subunits and extra HAP-TAMRAs removed from the asymmetric unit. Density and then models are removed from the C HAP-TAMRA and CD dimer. The AB dimer with the B HAP-TAMRA are trimmed to show only the HAP pocket to show that density is evident for the residues that nestle the HAP moiety. Note that the linker and part of the TAMRA show clear density even at this high contour level.
Video 2
A tour of a T=3 capsid (Video 2)
As with the T=4 move, intact surface-shaded capsids, contoured at 3.6 sigma. The AB dimers surrounding fivefold vertices shaded in dark grey, quasi-sixfold are alternating dark and light gray. HAP-TAMRA is red. An asymmetric unit is colored, disrupting the color scheme of one fivefold and one quasi-sixfold. For the T=3 capsid the AB dimer is light purple and the C subunit is dark purple. The quasi-sixfold has alternating B and C subunits. A quasi-sixfold is then extracted from the capsid and then the grey subunits and extra HAP-TAMRAs removed from the asymmetric unit. Density and then models are removed from the C HAP-TAMRA and CD dimer. In the T=3 movie this operation is repeated with the C subunit. The AB dimer with the B HAP-TAMRA are trimmed to show only the HAP pocket to show that density is evident for the residues that nestle the HAP moiety. Note that the linker and part of the TAMRA show clear density even at this high contour level.
Tables
Table 1
Image reconstruction statistics.
The table summarizes the statistics for data collection, structure determination, and refinement.
| Collection/Refinement Parameters | T=3 | T=4 |
|---|---|---|
| Data Collection | ||
| Microscope | FEI Titan Krios | FEI Titan Krios |
| Voltage (kV) | 300 | 300 |
| Dose (e- / Å2) | 33 | 33 |
| Detector | Gatan K2 Summit | Gatan K2 Summit |
| Pixel size (Å) | 1.285 | 1.285 |
| Defocus range (μm) | 0.5-3.5 | 0.5-3.5 |
| Reconstruction (RELION) | ||
| Micrographs | 679 | 679 |
| Particle number (Initial) | 15,066 | 24,823 |
| Particle number (Final) | 13,746 | 16,008 |
| Symmetry | Icosahedral | Icosahedral |
| Box size (pixels) | 380 | 380 |
| Accuracy of rotations | 0.434° | 0.432° |
| Accuracy of translations (pixels) | 0.50 | 0.60 |
| Sharpening B-factor (Å2) | -140.93 | -182.60 |
| Final resolution (Å) | 3.67 | 3.97 |
| EMDB accession code | 7295 | 7294 |
| Model Refinement (PHENIX) | ||
| Cross correlation (Whole Volume) | 0.764 | 0.776 |
| Cross correlation (Masked) | 0.844 | 0.819 |
| Ramachandran Plot | ||
| Outliers | 0.00% | 0.00% |
| Allowed | 4.3% | 7.8% |
| Favored | 95.7% | 92.2% |
| PDB accession code | 6BVN | 6BVF |
Additional files
-
Transparent reporting form
- https://doi.org/10.7554/eLife.31473.017
Download links
A two-part list of links to download the article, or parts of the article, in various formats.
Downloads (link to download the article as PDF)
Open citations (links to open the citations from this article in various online reference manager services)
Cite this article (links to download the citations from this article in formats compatible with various reference manager tools)
Hepatitis B virus core protein allosteric modulators can distort and disrupt intact capsids
eLife 7:e31473.
https://doi.org/10.7554/eLife.31473


