Yeast eIF4A enhances recruitment of mRNAs regardless of their structural complexity
- Eunice Kennedy Shriver National Institute of Child Health and Human Development, National Institutes of Health, United States
Figures
Figure 1 with 1 supplement

ATP hydrolysis by eIF4A stimulates recruitment of natural mRNA RPL41A as well as a synthetic 50-mer made up largely of CAA-repeats, presumed to be unstructured, with an AUG start codon 23 nucleotides from the 5'-end (CAA 50-mer).
The concentration of ATP and analogs was 2 mM. (A) Percentage of RPL41A recruited to the PIC versus time. (B) Percentage of CAA 50-mer recruited to the PIC versus time. The larger plot shows the time-course up to 20 min. The inset shows the first 1.5 min for clarity. With the CAA 50-mer in the presence of ATP and eIF4A, reaction rates are at the limit of our ability to measure by hand but the results provide an estimate of the value. (C) Observed rate constants (kobs) and reaction endpoints from the data in panels A and B. All data in the figure are mean values (n ≥ 2) and error bars represent average deviation of the mean. With RPL41A, rates with ADPNP, ADPCP, ADP, no nucleotide, and no eIF4A could not be measured accurately due to low endpoints (‘ND’).
-
Figure 1—source data 1
Individual measurements of the percent of RPL41A and CAA 50-mer recruited to the PIC over time.
- https://doi.org/10.7554/eLife.31476.004
Figure 1—figure supplement 1
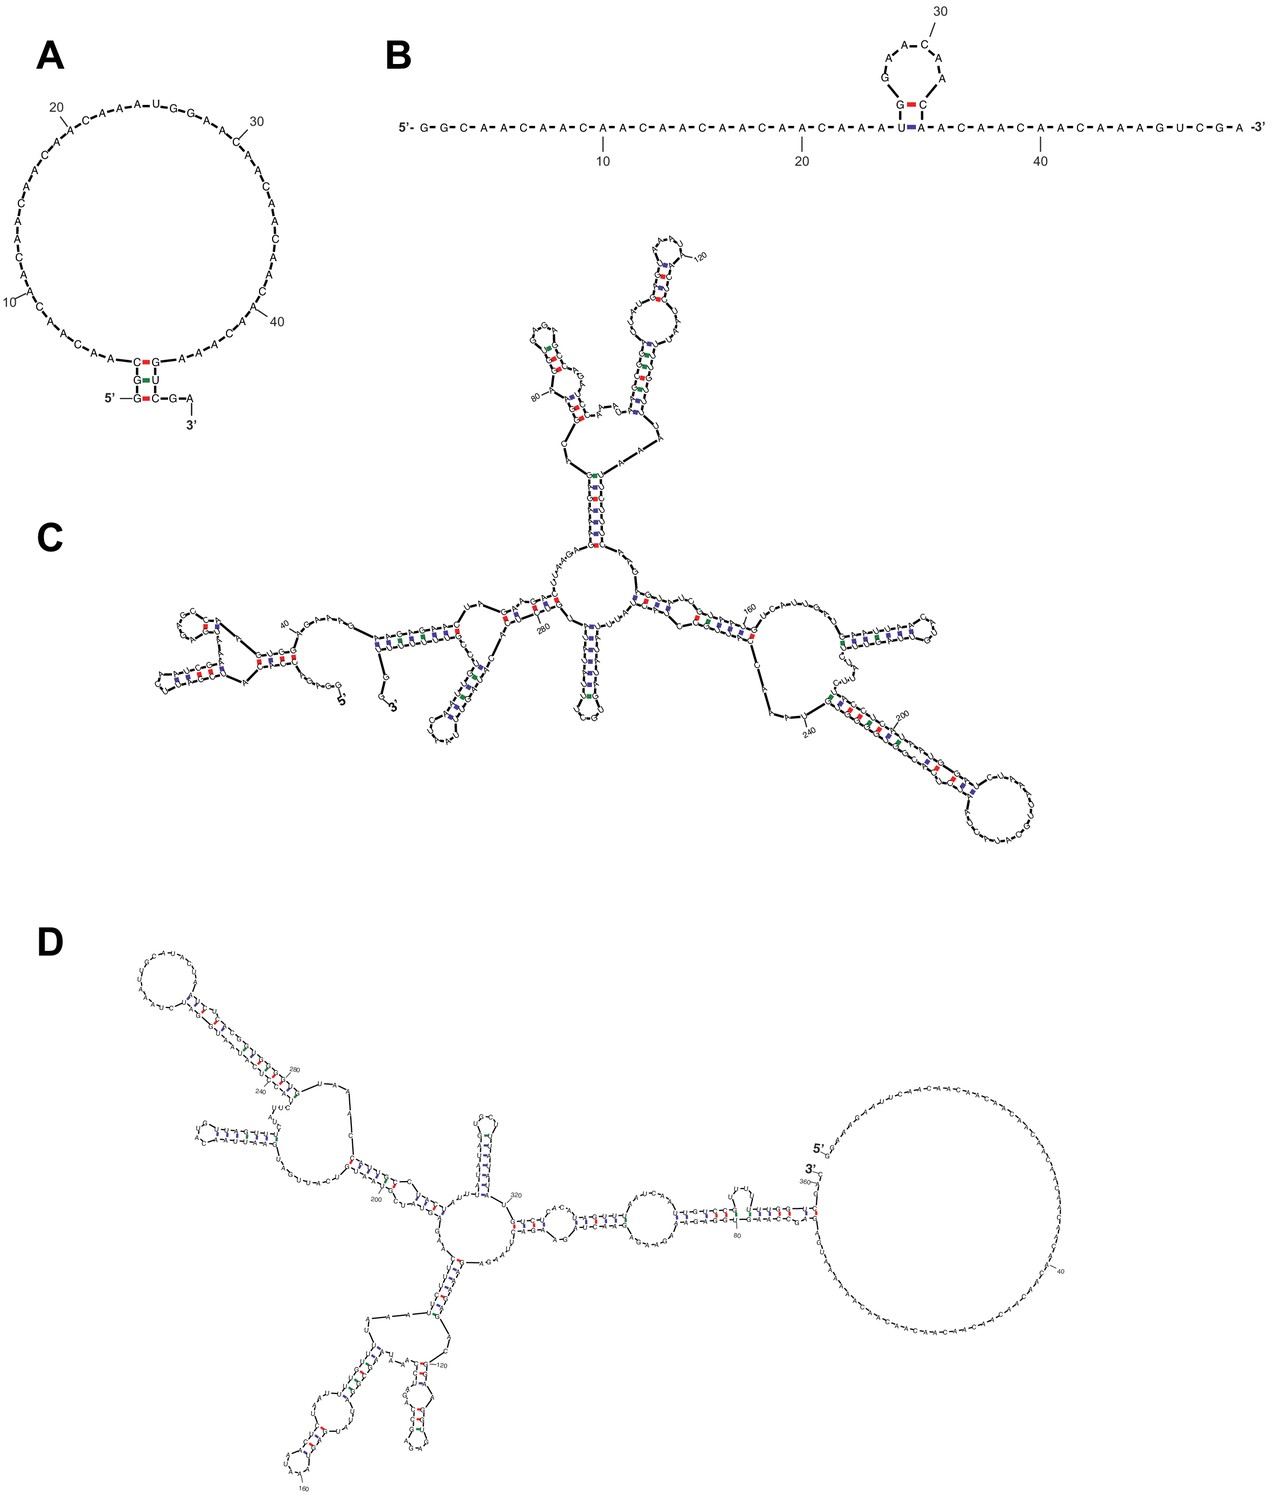
RPL41A can form structural elements throughout its length whereas the CAA 50-mer has a low propensity to form structures.
RNA folds, predicted by mfold (Zuker, 2003), that are representative of the population of conformations adopted by (A–B) CAA 50-mer, ∆G > −1 kcal/mol; (C) RPL41A, ∆G = −46 kcal/mol; (D) chimeric RNA with CAA-repeat 5’-UTR and RPL41A sequence 3’ of the AUG codon (RNA 7; Figure 3A), ∆G = −51 kcal/mol.
Figure 2 with 1 supplement
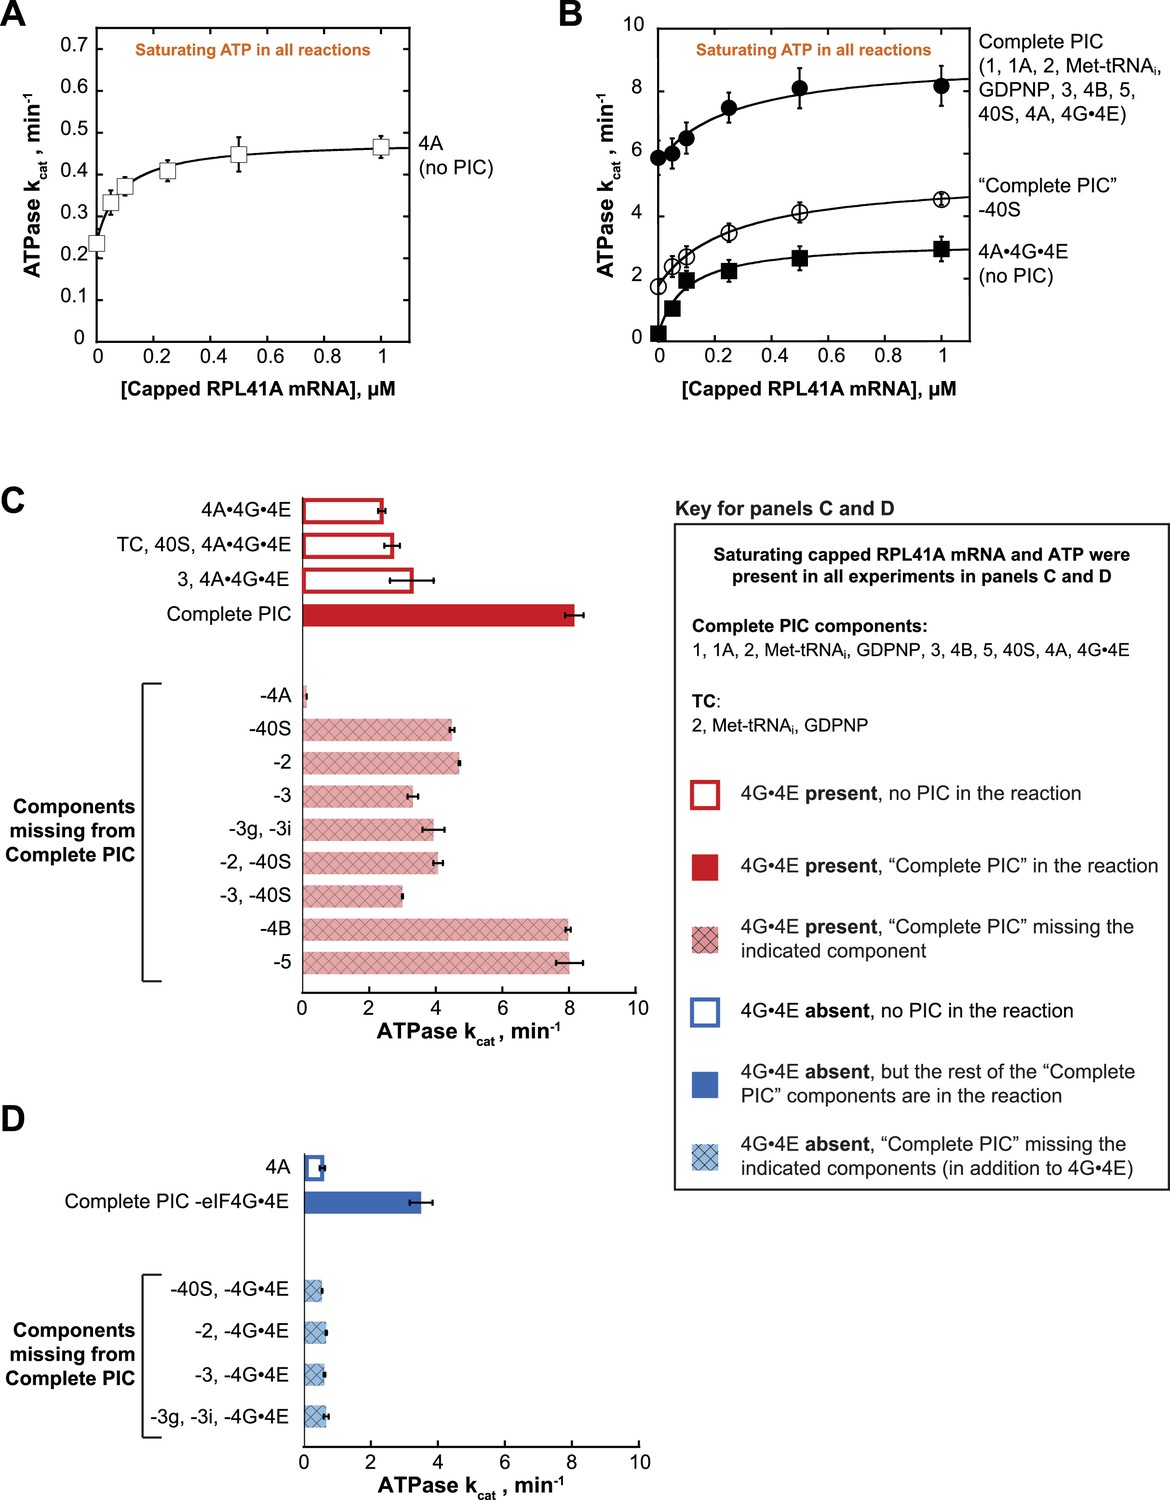
eIF4A and eIF4A•4G•4E ATPase activities are stimulated by the PIC.
ATPase activity of 5 µM eIF4A in the presence of saturating (5 mM) ATP•Mg2+ as a function of the concentration of capped RPL41A mRNA for (A) eIF4A (no PIC): kcat = 0.48 ± 0.04 min−1, = 80 nM; (B) Solid black circles: Complete PIC (contains 5 µM eIF4A, 0.5 µM eIF4G•4E, 0.5 µM eIF4B, 0.5 µM eIF2, 0.5 µM Met-tRNAi, 1 mM GDPNP•Mg2+, 0.5 µM eIF3, 0.5 µM eIF5, 1 µM eIF1, 1 µM eIF1A, and 0.5 µM 40S subunits): kcat = 9.0 ± 0.8 min−1, = 260 ± 40 nM. White circles: ‘Complete PIC-40S’ (contains all ‘Complete PIC’ components except the 40S subunit): kcat = 5.3 ± 0.1 min−1, = 270 ± 70 nM. Solid black squares: 4A•4G•4E alone (no PIC) (contains 5 µM eIF4A and 0.5 µM eIF4G•4E only): kcat = 3.2 ± 0.2 min−1, = 100 ± 10 nM. (C) kcat values for ATP hydrolysis from the experiments described in (A) and (B) plus additional drop-out experiments. In all cases, saturating (0.5 µM) capped RPL41A mRNA was present. The components present in the reactions, as indicated to the left of each bar, were at the same concentrations as in (B). (D) ATPase activity of 5 µM eIF4A alone or in the presence of a PIC missing eIF4G•4E as well as other components, as indicated to the left of each bar, all measured in the presence of saturating (0.5 µM) capped RPL41A mRNA. The concentrations of all components, when present, were the same as in (B). Note that the axis scales in panels (C) and (D) are the same for ease of comparison. All data presented in the figure are mean values (n ≥ 2) and error bars represent average deviation of the mean.
-
Figure 2—source data 1
Individual kcat measurements of ATP hydrolysis.
- https://doi.org/10.7554/eLife.31476.007
-
Figure 2—source data 2
Related to Figure 2—figure supplement 1.
Control ATPase reactions and individual measurements of ATPase activity with uncapped RPL41A.
- https://doi.org/10.7554/eLife.31476.008
Figure 2—figure supplement 1
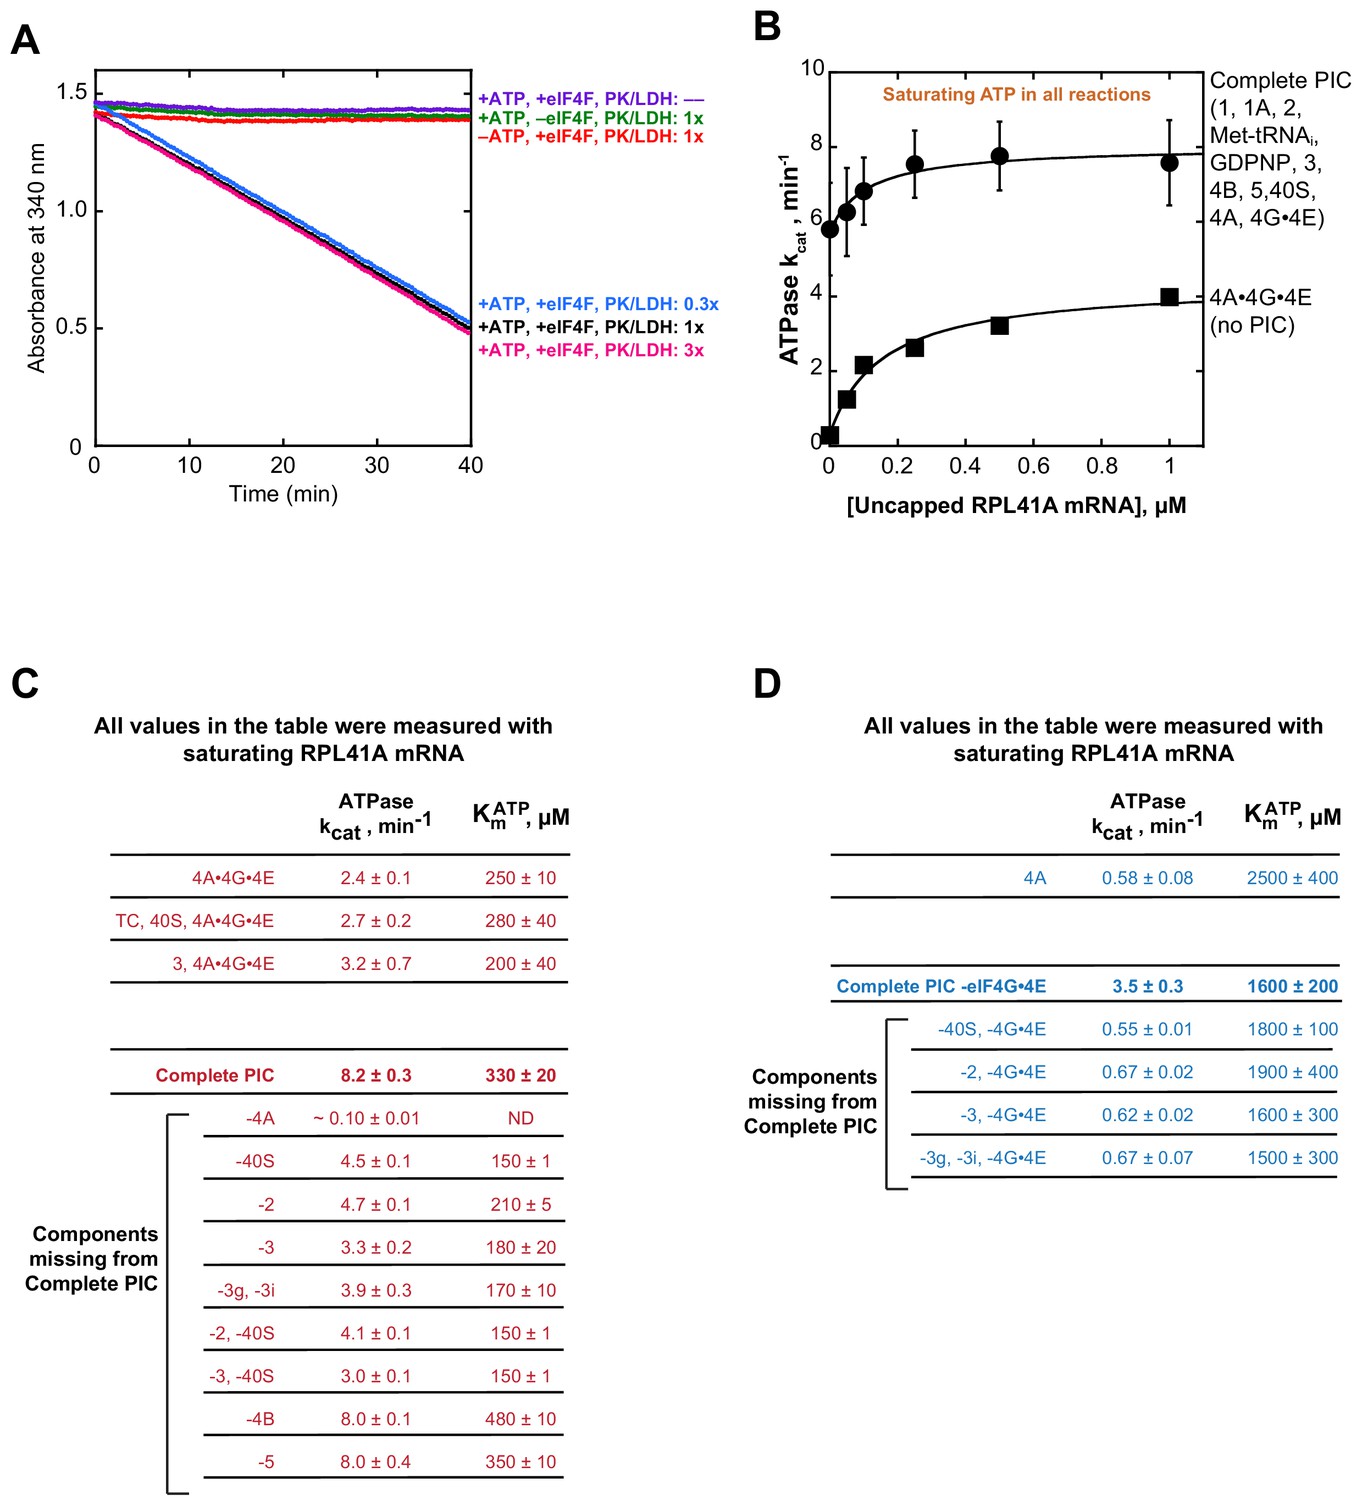
Control and data tables for the ATPase experiments.
(A) Controls for NADH enzyme-coupled microplate ATPase assay. The decrease in absorbance of 340 nm light was dependent on the presence of ATPase activity (5 µM eIF4A, 0.5 µM eIF4G•4E, together referred to as eIF4A•4G•4E or eIF4F), ATP•Mg2+, and a pyruvate kinase (900–1400 units/mL)/lactate dehydrogenase (600–1000 units/mL) mixture from rabbit muscle used as a 250x stock solution. (B) ATPase activity as a function of uncapped RPL41A mRNA. Solid, black squares: eIF4A•4G•4E (no PIC), as in Figure 2B (kcat of 4.3 ± 0.1 min−1 and of 150 ± 20 nM). Solid black circles: ‘Complete PIC,’ as in Figure 2B (kcat of 8 ± 1 min−1 and of 120 ± 40 nM). (C–D) Summary of all kcat and values in the presence of eIF4G•4E (panel C, red) and absence of eIF4G•4E (panel D, blue). Data in B-D are mean values (n ≥ 2) and error is reported as average deviation of the mean.
Figure 3 with 3 supplements
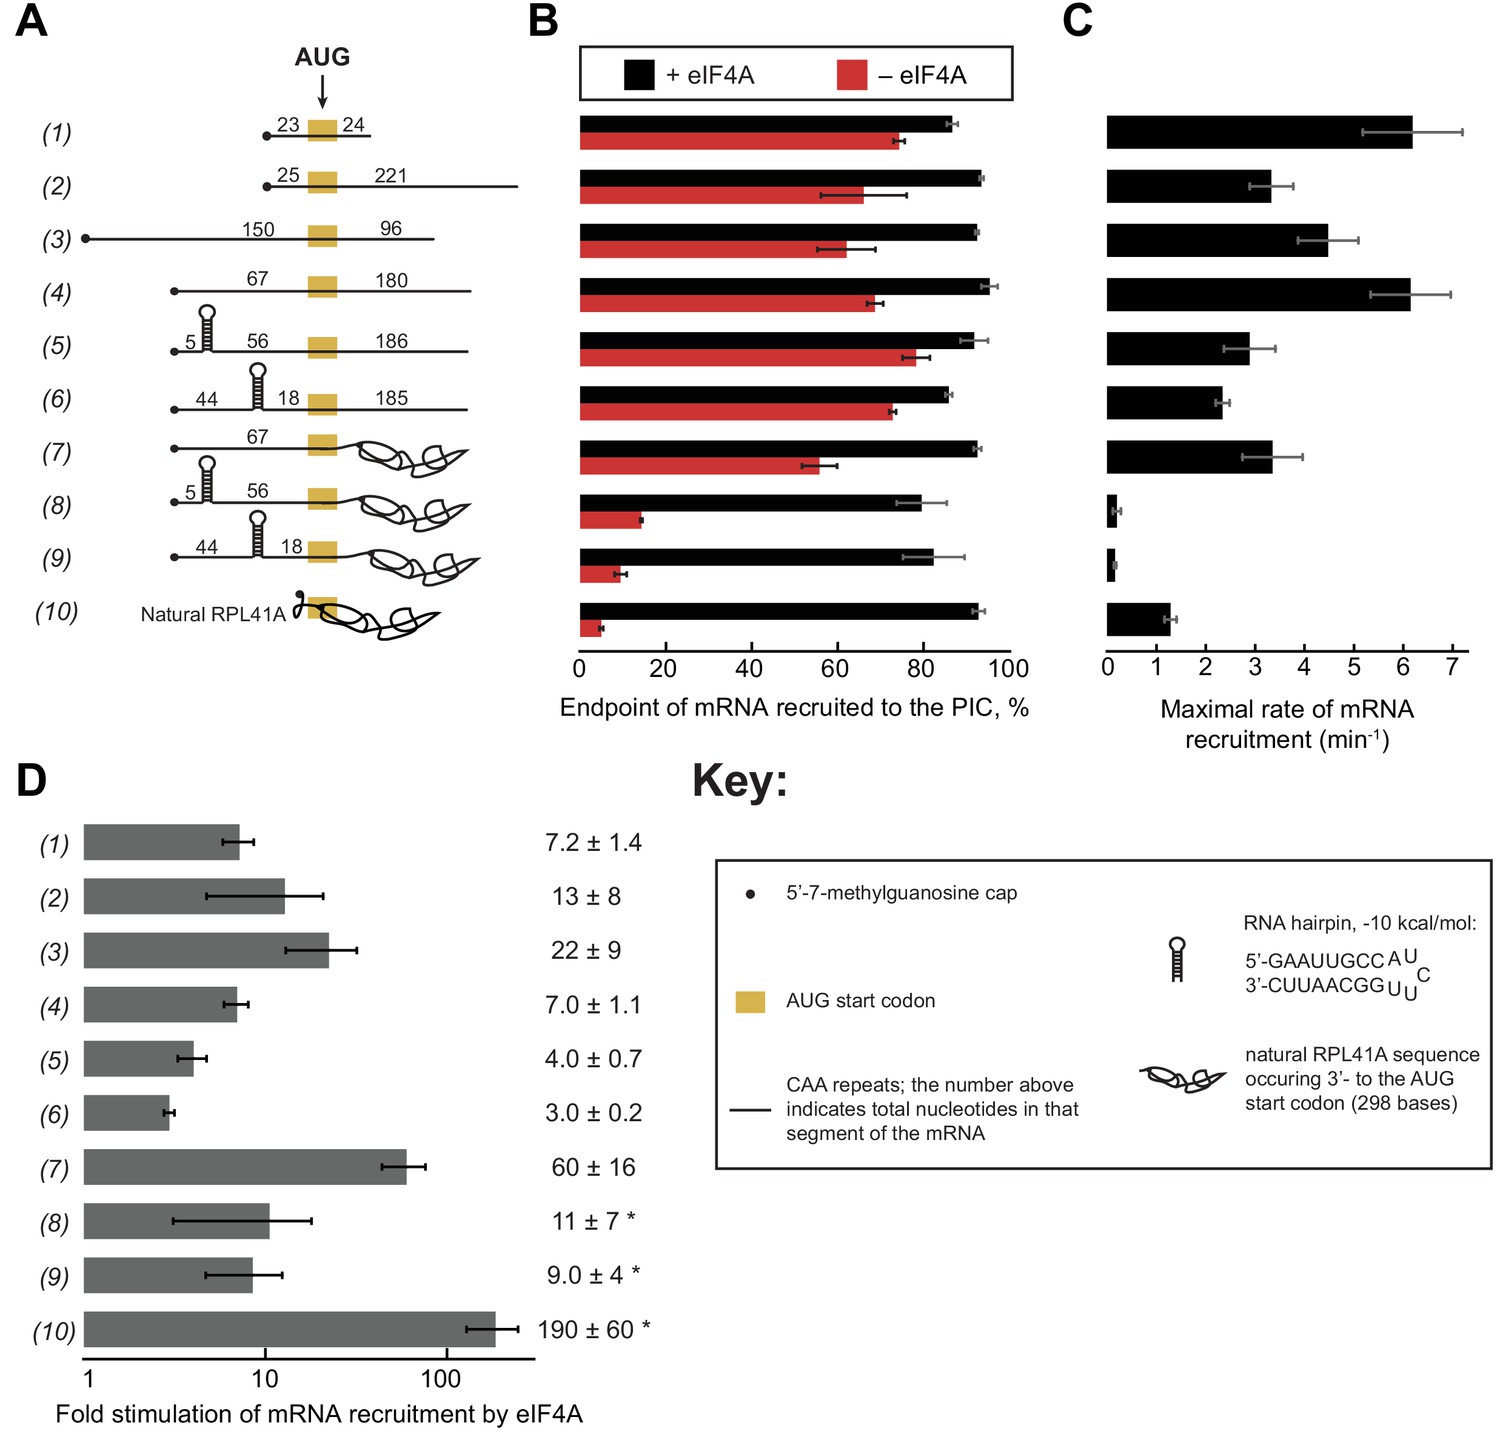
eIF4A stimulates recruitment of mRNAs regardless of their degree of structure.
(A) Schematic of mRNAs used in the study. mRNAs were capped unless otherwise noted but do not contain a poly(A) tail. Numbers on the mRNA indicate the total number of nucleotides in the corresponding segment of the RNA. (B) Endpoints of recruitment to the PIC for mRNAs in (A) in the presence (black) or absence (red) of saturating eIF4A. mRNAs are listed in the same order as in (A). (C) Maximal rates of mRNA recruitment, kmax (min−1), measured for the mRNAs in (A) (the corresponding plots are shown in Figure 3—figure supplement 1B–D) listed in the same order as in (A). (D) eIF4A-dependent stimulation of mRNA recruitment: the maximal rate of mRNA recruitment at saturating eIF4A concentration divided by the observed rate in the absence of eIF4A (calculated from data in Figure 3—figure supplement 1E). Numbers to the left correspond to the mRNAs in (A). The asterisk (*) indicates that due to low recruitment endpoints in the absence of eIF4A, data for mRNAs 8–10 could not be fit with an exponential rate equation and thus the fold stimulation by eIF4A was estimated from comparison of initial rates in the presence of saturating eIF4A versus the absence of eIF4A. All data presented in the figure are mean values (n ≥ 2) and error bars represent average deviation of the mean.
-
Figure 3—source data 1
Individual measurements of endpoints and rates of mRNA recruitmentment for mRNAs 1–10.
- https://doi.org/10.7554/eLife.31476.013
-
Figure 3—source data 2
Related to Figure 3—figure supplement 1.
Observed rates (kobs) of mRNA recruitment for mRNAs 1–10 at varying concentrations of eIF4A.
- https://doi.org/10.7554/eLife.31476.014
Figure 3—figure supplement 1
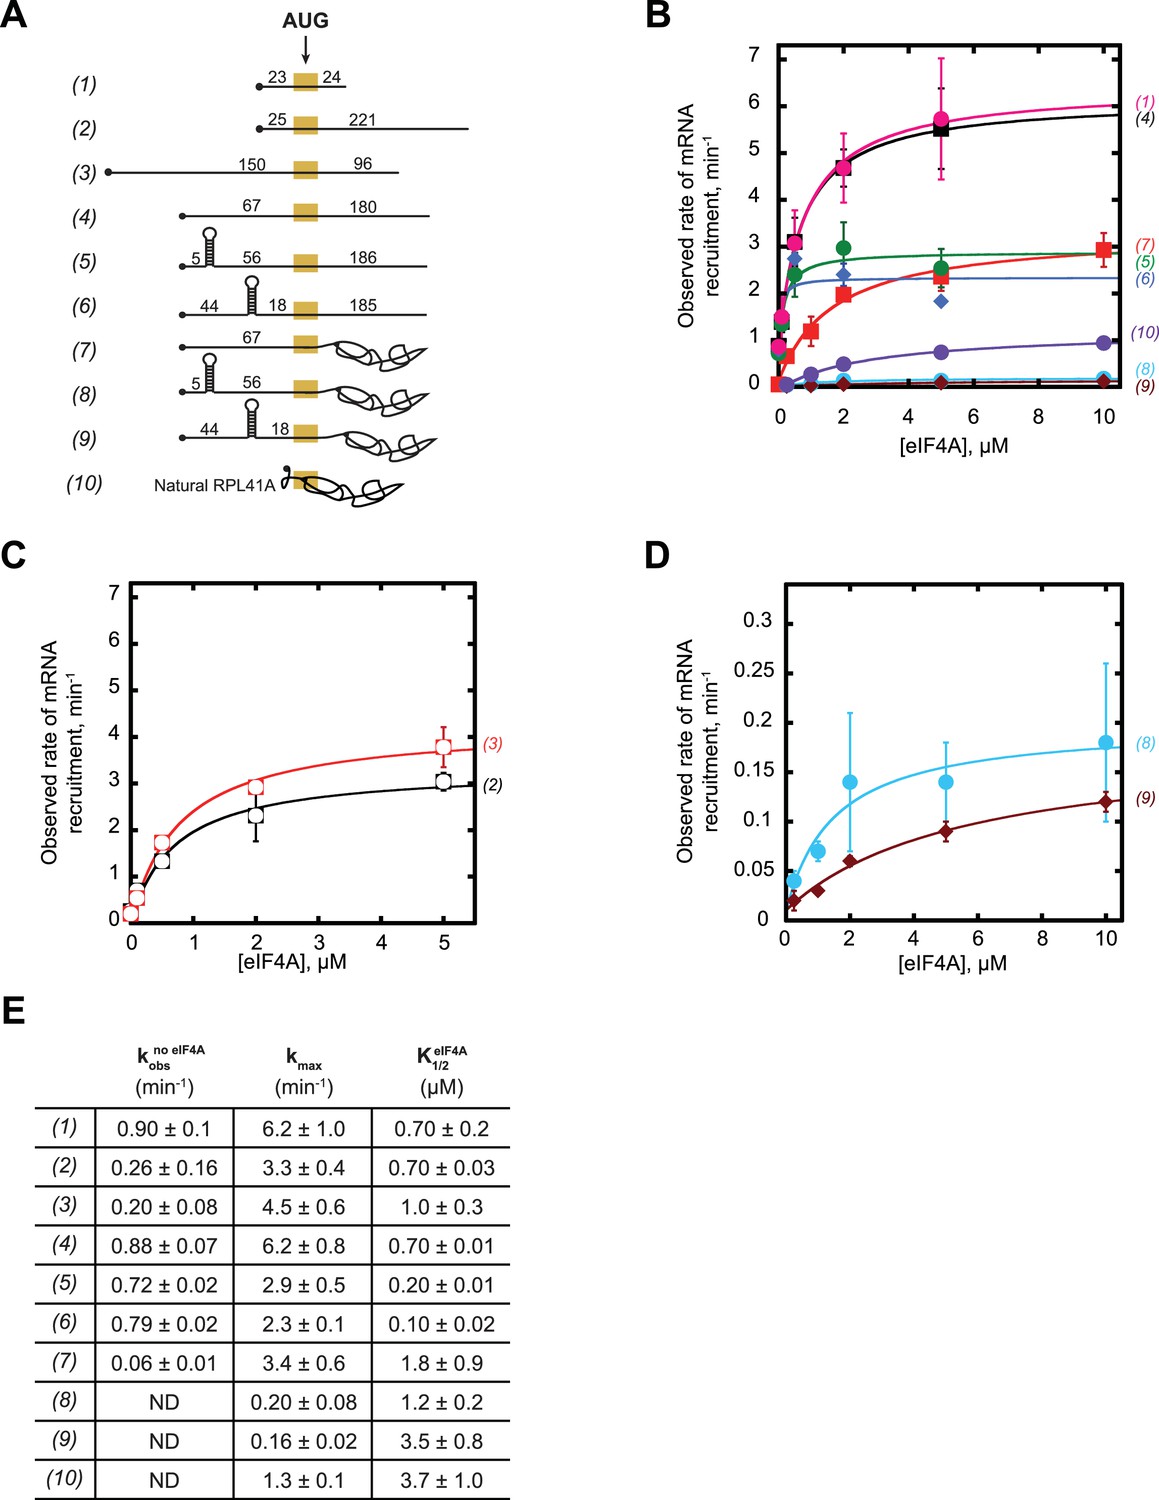
eIF4A promotes recruitment of both structured and CAA-repeats mRNAs.
(A) RNAs used in the study (same as (A) in Figure 3, shown again here for convenience). (B–C) Observed rates (kobs) min−1 of mRNA recruitment as a function of the concentration of eIF4A. Data were fit with a hyperbolic equation allowing for a y-intercept >0 (see Materials and methods). Numbers in parentheses, to the right of the coordinate plane, correspond to mRNAs in (A) and are colored for easier visualization of distinct curves. RNAs 2 and 3 are shown separately for clarity. (D) Expansion of plots for mRNAs 8 and 9 from (B) for clarity. (E) The observed rate of recruitment in the absence of eIF4A (), the maximal rate of recruitment with saturating eIF4A (kmax), and the concentration of eIF4A required to achieve the half-maximal rate of recruitment () from fits in panels B-D. ‘ND':’ the observed rate from an exponential fit could not be determined because of low reaction endpoint. All data presented in the figure are mean values (n ≥ 2) and error values are average deviation of the mean.
Figure 3—figure supplement 2
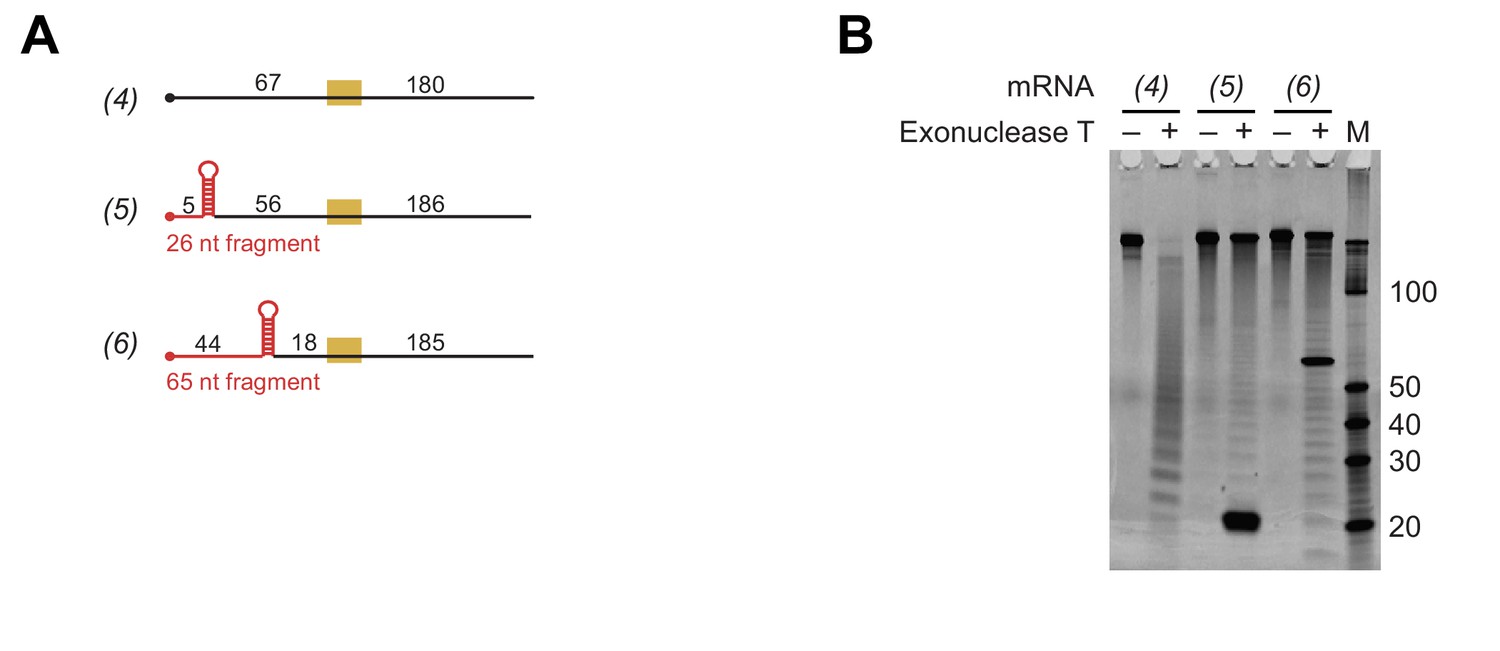
Evidence that the designed hairpins in the 5'-UTRs of mRNAs 5 and 6 are formed and that mRNA 4 lacks secondary structure.
(A) RNAs 4–6 used in the study (same as in Figure 3A; shown again here for convenience). The fragments expected to be protected from 3'−5' RNase Exonuclease T digest are indicated in red. (B) RNAs 4–6 were incubated in the presence (+) or absence (–) of the 3'−5' RNase Exonuclease T, at the same temperature (26°C) used in all experiments in this study, for 18 hr. Reactions were resolved on a 15% Tris Borate EDTA Urea gel (4 pmol of total RNA per lane) and stained with SYBR Gold nucleic acid gel stain. ‘M:’ Abnova Small RNA Marker. Marker RNA fragment sizes are indicated to the right of the gel.
Figure 3—figure supplement 3
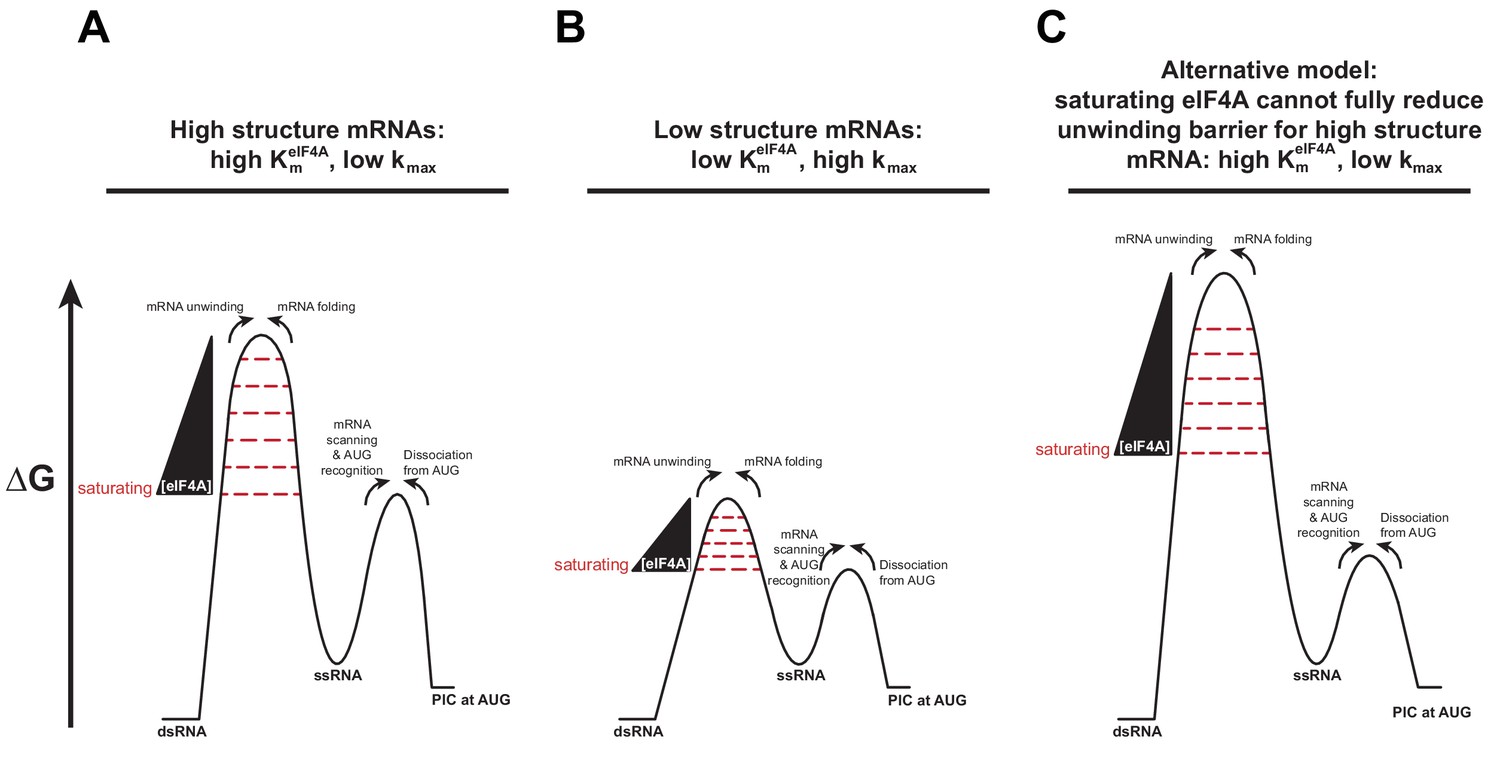
A change in the rate-limiting step for mRNA recruitment may be responsible for the effect of mRNA structure on the values.
(A) An mRNA harboring a high degree of structure has a large barrier to mRNA recruitment posed by the need to resolve those structures in order to load the mRNA onto the PIC (left-hand barrier). As the concentration of eIF4A is increased, it decreases the height of this barrier by facilitating the disruption of the structures in the mRNA (wedge and decreasing barrier height). When the barrier posed by structure has been reduced below the level of the right-hand barrier for subsequent steps (e.g., scanning, AUG recognition) the latter, which is not dependent on eIF4A, becomes rate-limiting and the rate of mRNA recruitment plateaus as a function of eIF4A. This situation leads to a high value of . (B) An mRNA with a low degree of structure has a small eIF4A-dependent barrier (left-hand barrier), which is reduced below the level of the barrier for subsequent steps (right-hand barrier) at a lower concentration of eIF4A than in (A). This situation leads to the plateau of the reaction rate occurring at a lower eIF4A concentration, which yields a lower value. To explain the different kmax values in these two situations, we posit that the barrier for the second, eIF4A-independent step is lower for mRNAs with little structure than for those with high degrees of structure. This scenario would make sense if this second step involves scanning of the mRNA, which would be inhibited by structures. (C) In an alternative model, which is also consistent with the data, eIF4A cannot lower the barrier for unwinding of mRNAs with high degrees of structure below the level of the eIF4A-indpendent barrier, even at very high eIF4A concentrations, leading to high values and low kmax values. In this case, the scenario for mRNAs with low degrees of structure could remain the same as in (B).
Figure 4 with 1 supplement

The 5'−7-methylguanosine cap inhibits mRNA recruitment in the absence of eIF4A.
Observed rates of mRNA recruitment (min−1) when eIF4A was not included in the reaction, in the presence (black bars) or absence (red bars) of the 5'-cap. (See Figure 3A Key for explanation of mRNA diagrams). (B) The observed rates of recruitment in the absence of eIF4A (), kmax, fold enhancement by eIF4A (), and fold difference in the absence of eIF4A (/). The data for the capped mRNAs are reproduced from Figure 3—figure supplement 1E for comparison purposes. All data presented in the figure are mean values (n ≥ 2) and error bars represent average deviation of the mean. Error was propagated when ratios were calculated.
-
Figure 4—source data 1
Rates of mRNA recruitment measured with capped and uncapped mRNAs in the presence of saturating eIF4A (kmax) or in the absence of eIF4A ().
- https://doi.org/10.7554/eLife.31476.017
-
Figure 4—source data 2
Related to Figure 4—figure supplement 1.
Individual measurements of the observed rate of mRNA recruitment (kobs) with uncapped mRNAs at various concentrations of eIF4A.
- https://doi.org/10.7554/eLife.31476.018
Figure 4—figure supplement 1

The 5'−7-methylguanosine cap inhibits mRNA recruitment in the absence of eIF4A.
mRNA recruitment of (A) RNA 1 (CAA 50-mer), (B) RNA 4, and (C) RNA 7 in the presence or absence of a 5'-cap, as indicated to the right of each curve. Numbers to the right of the plots correspond to RNAs in Figure 3A. Insets show the observed rates versus eIF4A concentration up to 0.5 µM to focus on the 0 µM eIF4A points. All data presented in the figure are mean values (n ≥ 2) and error bars represent average deviation of the mean.
Figure 5
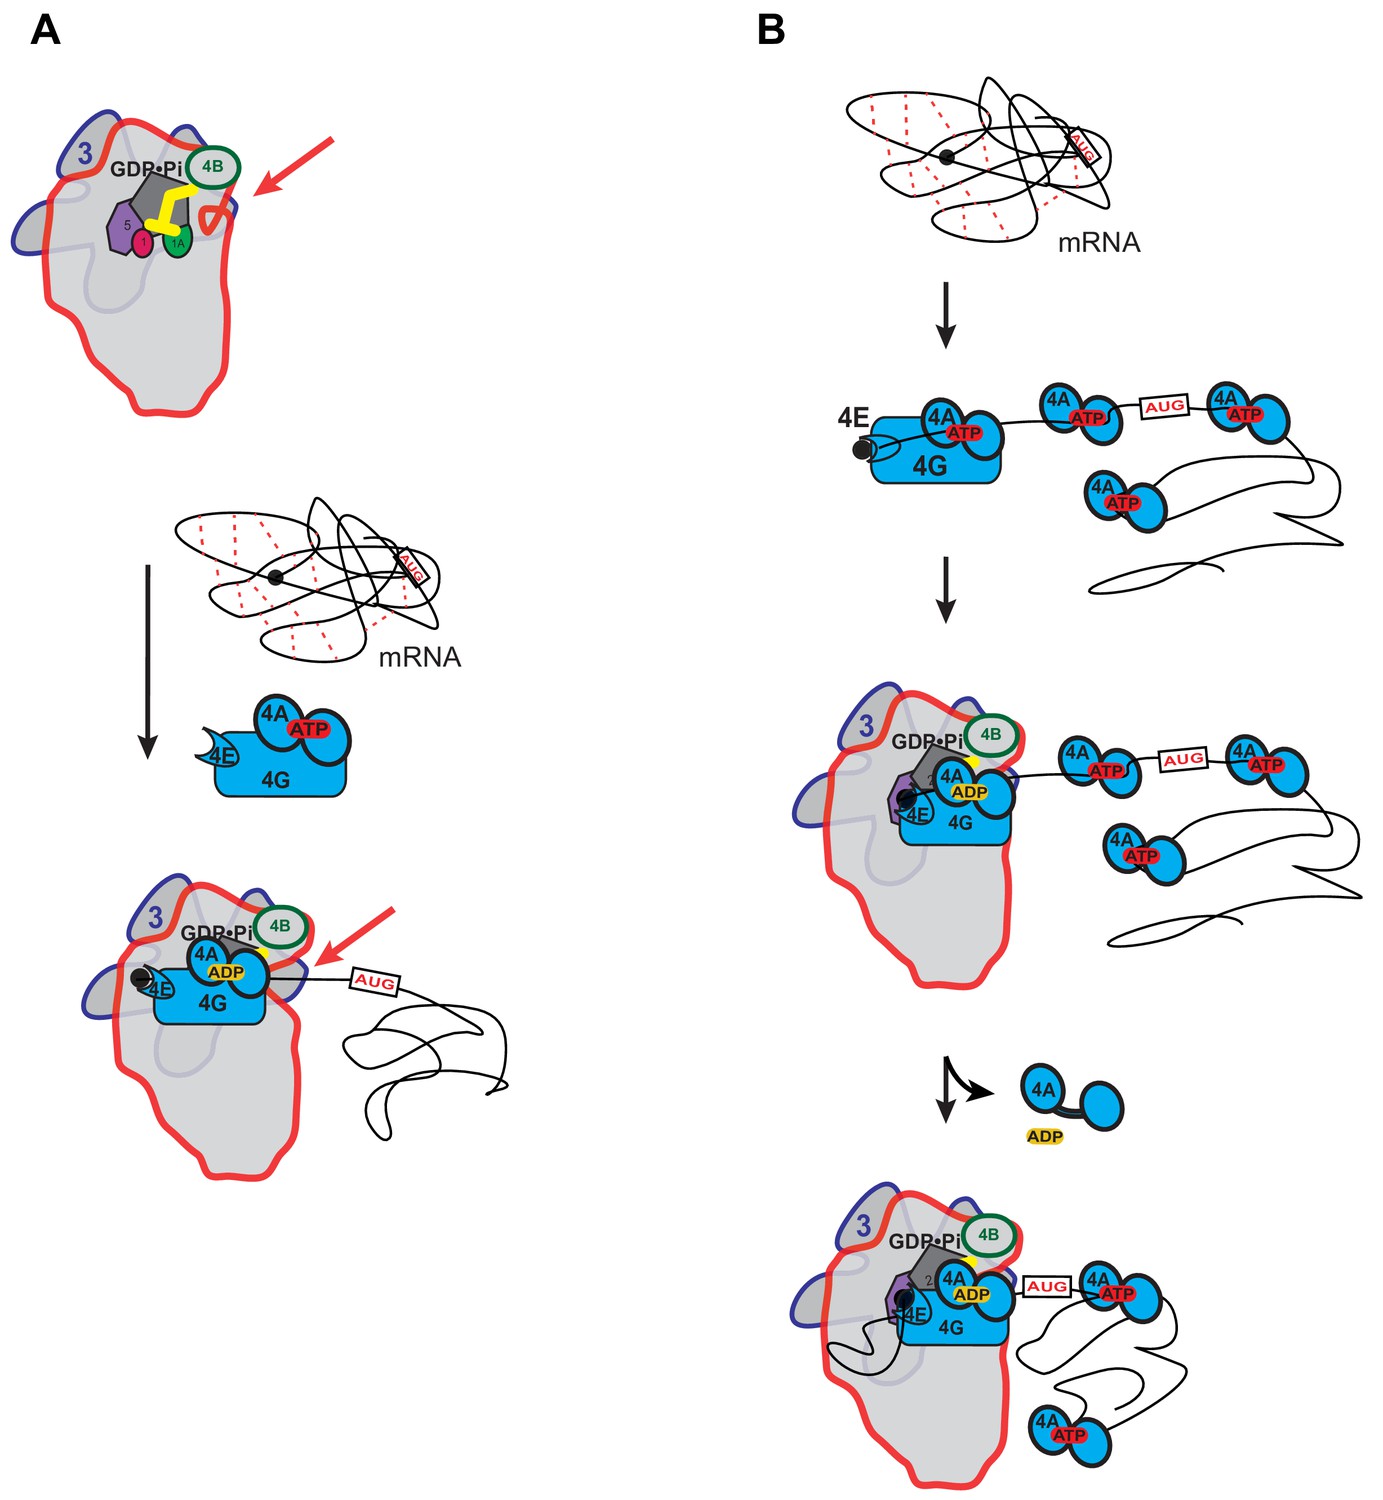
Possible models for the mechanism of action of eIF4A in promoting mRNA recruitment to the PIC.
(A) eIF4A modulates the conformation of the PIC to promote mRNA recruitment. In this model, binding of eIF4A•4G•4E to the PIC induces an opening of the mRNA entry channel of the 40S subunit (highlighted by red arrows), which enables mRNA binding. The ATPase activity of eIF4A might drive this opening. ATP hydrolysis might also promote loading of the message into the mRNA entry channel, concomitant with any necessary melting of structure. This model is consistent with our observations that the ATPase activity of eIF4A is stimulated by the PIC and that recruitment of unstructured mRNAs is accelerated by ATP hydrolysis by the factor. (B) A holistic model for the roles of eIF4A and eIF4F in mRNA recruitment. This model attempts to bring a variety of observations from the literature together with the data presented in this study. mRNAs have complex, often dynamic, structures due to numerous local and distant interactions (red dotted lines) as well as the inherent tendency of polymers longer than their persistence lengths to fold back on themselves. These complex global structures can occlude the 5'-ends of the mRNAs and the start codon, making it difficult for the PIC to bind and locate them. Individual eIF4A molecules might keep the mRNA in a partially-unwound state so that the 5’-end can be located by eIF4F and the PIC. ATP hydrolysis by the eIF4A molecule bound to eIF4F allows it to load the 5'-end of the mRNA into the entry channel of the 40S subunit. Loading might involve opening of the mRNA entry channel or another conformational change in the PIC and active transfer of the mRNA into the channel. After loading of the 5’-end, eIF4A•ADP dissociates from the complex. This allows the next (3’) eIF4A molecule on the mRNA to bind to eIF4G, which activates its ATPase, enabling loading of that mRNA segment and thus movement of the PIC down the message. This cycle repeats until the start codon is located. The two models presented in (A) and (B) are not mutually exclusive and it is possible that eIF4A, given its high cellular concentration, performs multiple tasks.
Additional files
-
Supplementary file 1
RNAs used in the study.
- https://doi.org/10.7554/eLife.31476.020
-
Transparent reporting form
- https://doi.org/10.7554/eLife.31476.021
Download links
A two-part list of links to download the article, or parts of the article, in various formats.
Downloads (link to download the article as PDF)
Open citations (links to open the citations from this article in various online reference manager services)
Cite this article (links to download the citations from this article in formats compatible with various reference manager tools)
Yeast eIF4A enhances recruitment of mRNAs regardless of their structural complexity
eLife 6:e31476.
https://doi.org/10.7554/eLife.31476


