3.3-Å resolution cryo-EM structure of human ribonucleotide reductase with substrate and allosteric regulators bound
- Howard Hughes Medical Institute, Massachusetts Institute of Technology, United States
- Massachusetts Institute of Technology, United States
- The Scripps Research Institute, United States
- The University of Texas-Houston Medical School, United States
Figures
Figure 1

Structure and regulation of ribonucleotide reductase.
(A) Reaction of class Ia RNR. (B) Diagram of allosteric regulation of activity and substrate specificity by ATP and deoxyribonucleoside triphosphate (dNTP) effectors. The blue box represents RNR catalyzing NDP reduction (black arrows). Downstream black arrows indicate further processing by other enzymes to dNTPs. The dNTP products of the pathway feed back to alter the preference of RNR toward the indicated substrate (dashed grey lines) and promote or inhibit overall activity (green and red dashed lines, respectively). (C) Schematics of human α and β subunits highlighting major structural features. Unstructured N- and C-termini are indicated by dashed lines. (D) Structures of the human α and β homodimers. Subunits of α2 (from our α6 cryo-EM structure) are colored as in panel C with one subunit in faded colors. Bound CDP substrate (orange) and dATP effectors (yellow) are shown as spheres. Subunits of β2 (PDB: 2UW2) are orange and red, iron atoms in green. Dashed lines indicate unstructured termini.
Figure 2

Comparison of mechanisms of allosteric regulation of activity for E. coli and human RNRs.
(A) The molecular basis of allosteric regulation of activity in class Ia RNR from E. coli. dATP inhibits activity by binding to the activity effector site in the cone domain (green) in α and promoting conversion of the active α2β2 complex (modeled by docking PDB: 5CNS chains A and B with PDB: 1RIB) to an inhibited α4β4 ring (PDB: 5CNS). In particular, with dATP bound to the activity effector site in α, the cone domain forms an interface with β, leading to α4β4 ring formation. ATP restores activity by displacing dATP in the activity effector site in the cone domain, which disrupts the α-β interface of the α4β4 ring, and further pushes the equilibrium toward the α2β2 complex. The molecular basis by which dATP promotes α-β interface formation and ATP disrupts it has not been established. Long-distance radical transfer between α and β is illustrated by red arrows. (B) The molecular basis of allosteric regulation of activity in human class Ia RNR (see text in Discussion). Briefly, α2 forms α6 in the presence of both ATP and dATP. The stability of the hexamer formed determines whether the enzyme is active when β2 is added. dATP-induced hexamers are stable and inactive whereas ATP-induced hexamers are unstable and activated by β2 addition. Schematic of human RNR was prepared using the same models and coloring as Figure 1.
Figure 3 with 5 supplements

Cryo-EM density map reveals cone domain motion and contacts that assemble the human α6 ring.
(A) Human α6 ring viewed along the three-fold (triangle) and two-fold (oval) symmetry axes. Dashed box in middle panel highlights cone domain interactions detailed in panel C. Insets show density (grey) and atomic model for a three strand segment of the catalytic core β-barrel (residues Phe297-Leu301, Leu328-Ile334, Tyr404-Tyr407) and two helices (residues Ile228-Ser244) that pair at the α dimer interface. Regions of the structure are colored as in Figure 1 with alternating subunits in faded colors. dATP densities in yellow. (B) Cone domain in the human α6 ring structure is ~20° away from its position in the human α2 crystal structure colored tan (PDB: 3HNC). The gray rod indicates the rotation axis. (C) Cone domain viewed along the two-fold symmetry axis (oval) and an orthogonal view showing contacting residues, which are mostly hydrophobic. (D) dATP in the cone domain of the cryo-EM structure makes hydrogen bonds through its base, sugar, and phosphates indicated by dashed lines. Nucleotide density is shown in yellow mesh with dATP carbon yellow, oxygen red, phosphorus gold, and nitrogen blue. (E) The dATP-inhibited α4β4 ring of E. coli (PDB: 5CNS) uses the same face (helices 1 and 2) of the cone domain to contact the β subunit (orange). For comparison, the cone domain of E. coli α is oriented as in panel (C).
Figure 3—figure supplement 1
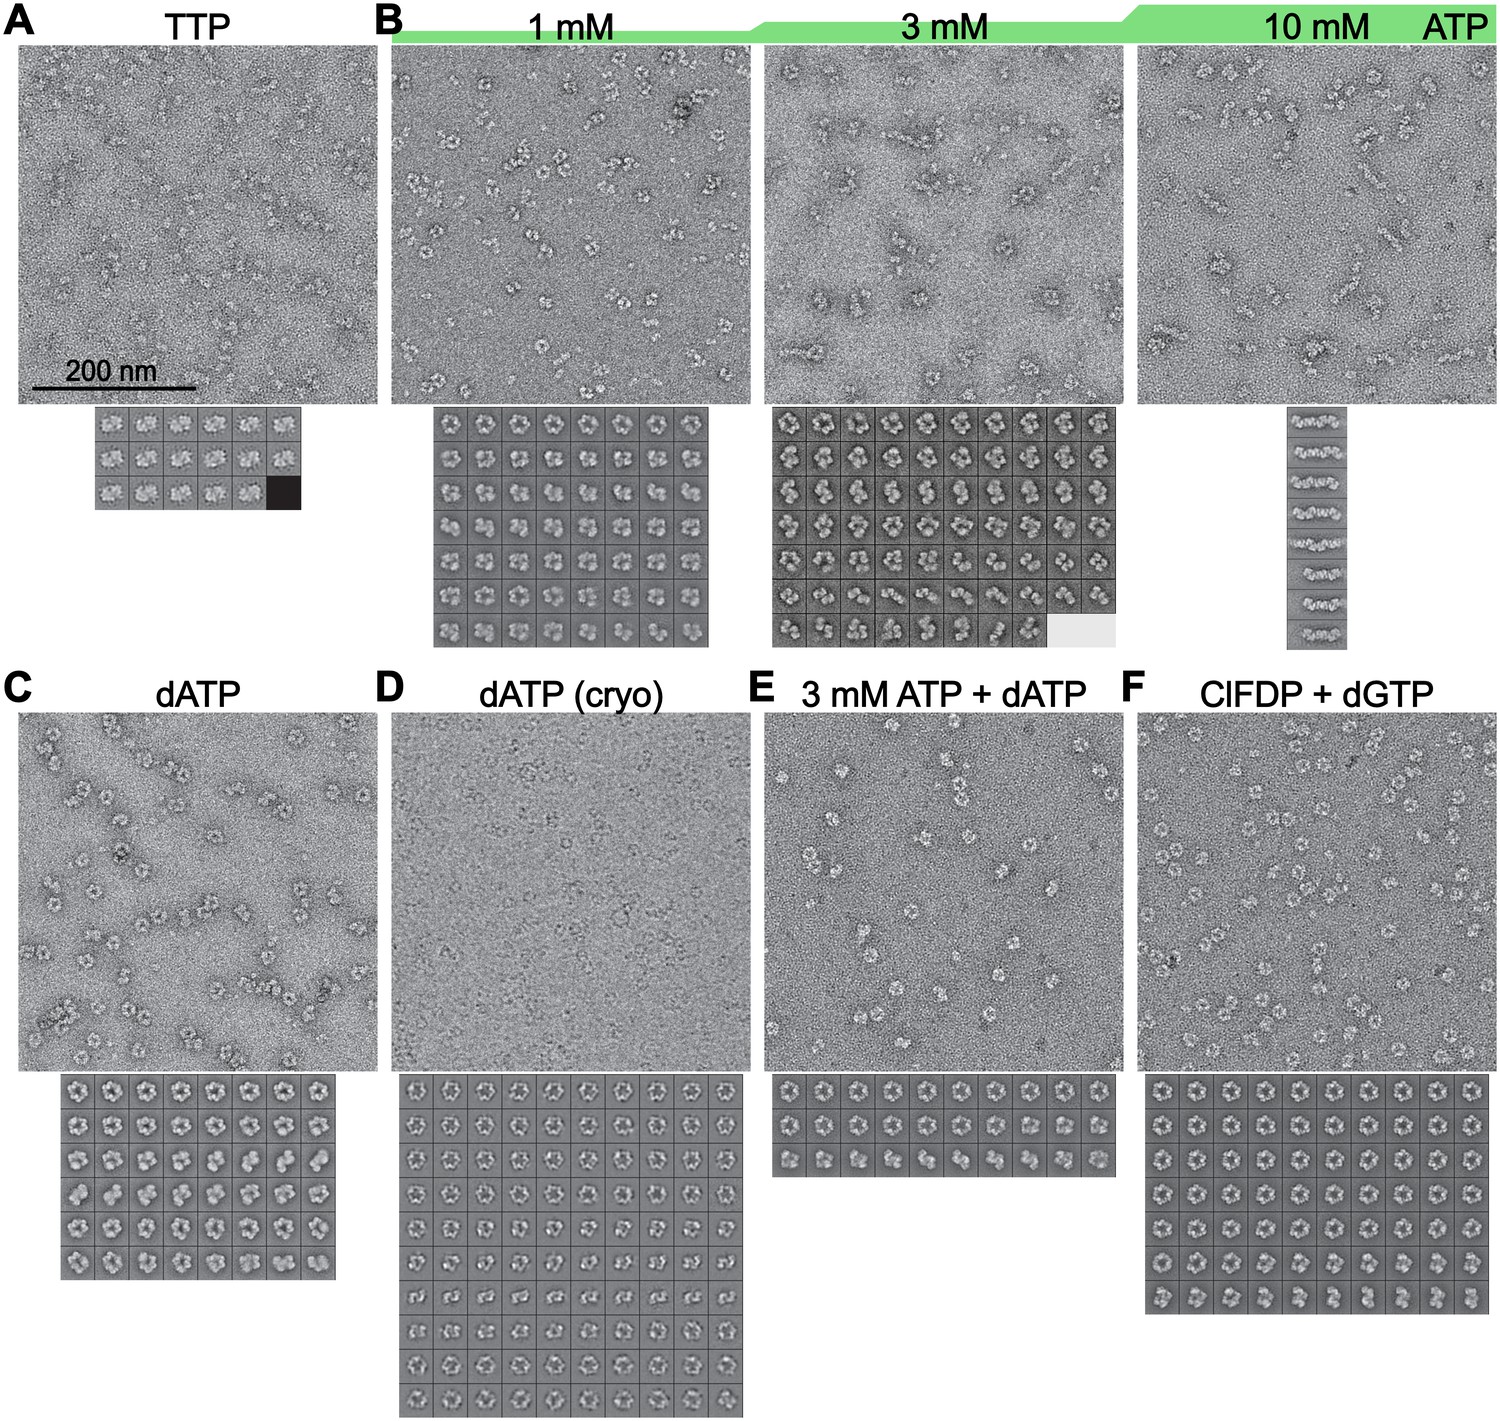
Abundance and definition of human α6 rings depends on identity and concentrations of nucleotides used.
Micrographs and 2D class averages from negative stained specimen (A–C,E,F) or a cryo-EM specimen (D) of α prepared with the indicated nucleotides: (A) 0.1 mM TTP, (B) ATP at concentrations ranging from 1.0 to 10 mM (specimen also described in [Ando et al., 2016]), (C) 0.05 mM dATP, (E) 3 mM ATP and 0.05 mM dATP, or (F) 1 μM ClFDP (5 equivalents per α) and 0.1 mM dGTP (specimen also described in [Aye et al., 2012]). A cryo-EM specimen of α with 0.05 mM dATP was also prepared (D) and the resulting averages match well with those from the negative stain specimen with the same concentration of dATP (compare with panel C). The human RNR samples prepared under inhibiting conditions (dATP, 3 mM ATP + 0.05 mM dATP, ClFDP + dGTP) show more well defined α6 rings than do the samples with ATP under active conditions. The sample with the mixture of dATP and ATP that yielded inactive human RNR (see Figure 3—figure supplement 2) also gave the highest resolution averages of the α6 rings. Scale bar in (A) applies to all micrographs. Averages in (A) are twice the scale of the micrographs and averages in (B–F) are shown on a scale 33% larger than the micrographs.
Figure 3—figure supplement 2
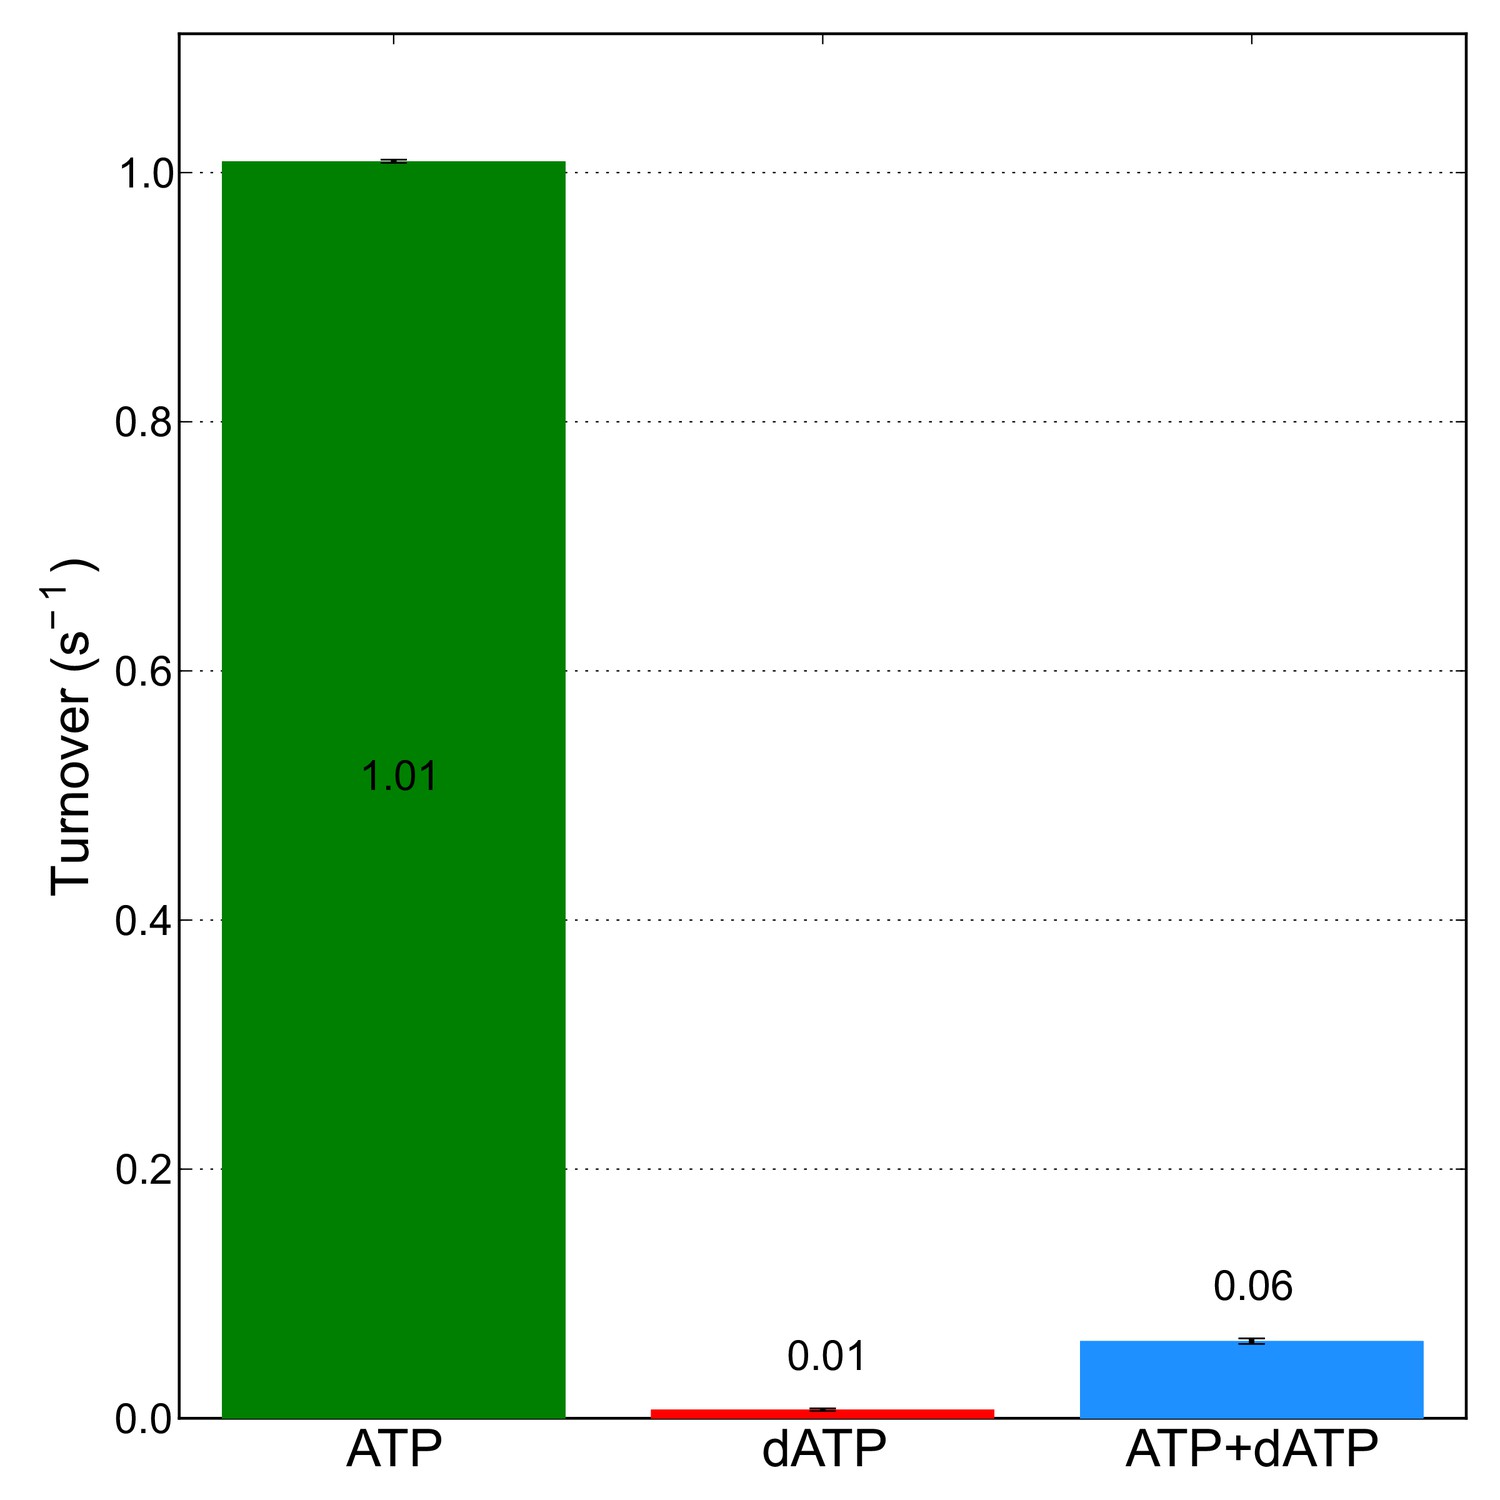
0.05 mM dATP is sufficient to almost completely eliminate CDP reductase activity in the presence of 3 mM ATP.
CDP reductase activity was measured for 14 μM α in the presence of 3 mM ATP, or 0.05 mM dATP, or both. Activity measurements are the average of assays performed in duplicate with error bars indicating the standard deviation. A mixture containing α, ATP, and dATP at the same concentrations used in these activity assays was used to prepare cryo-EM specimens of inhibited α6 rings that resulted in the 3.3-Å resolution reconstruction.
Figure 3—figure supplement 3
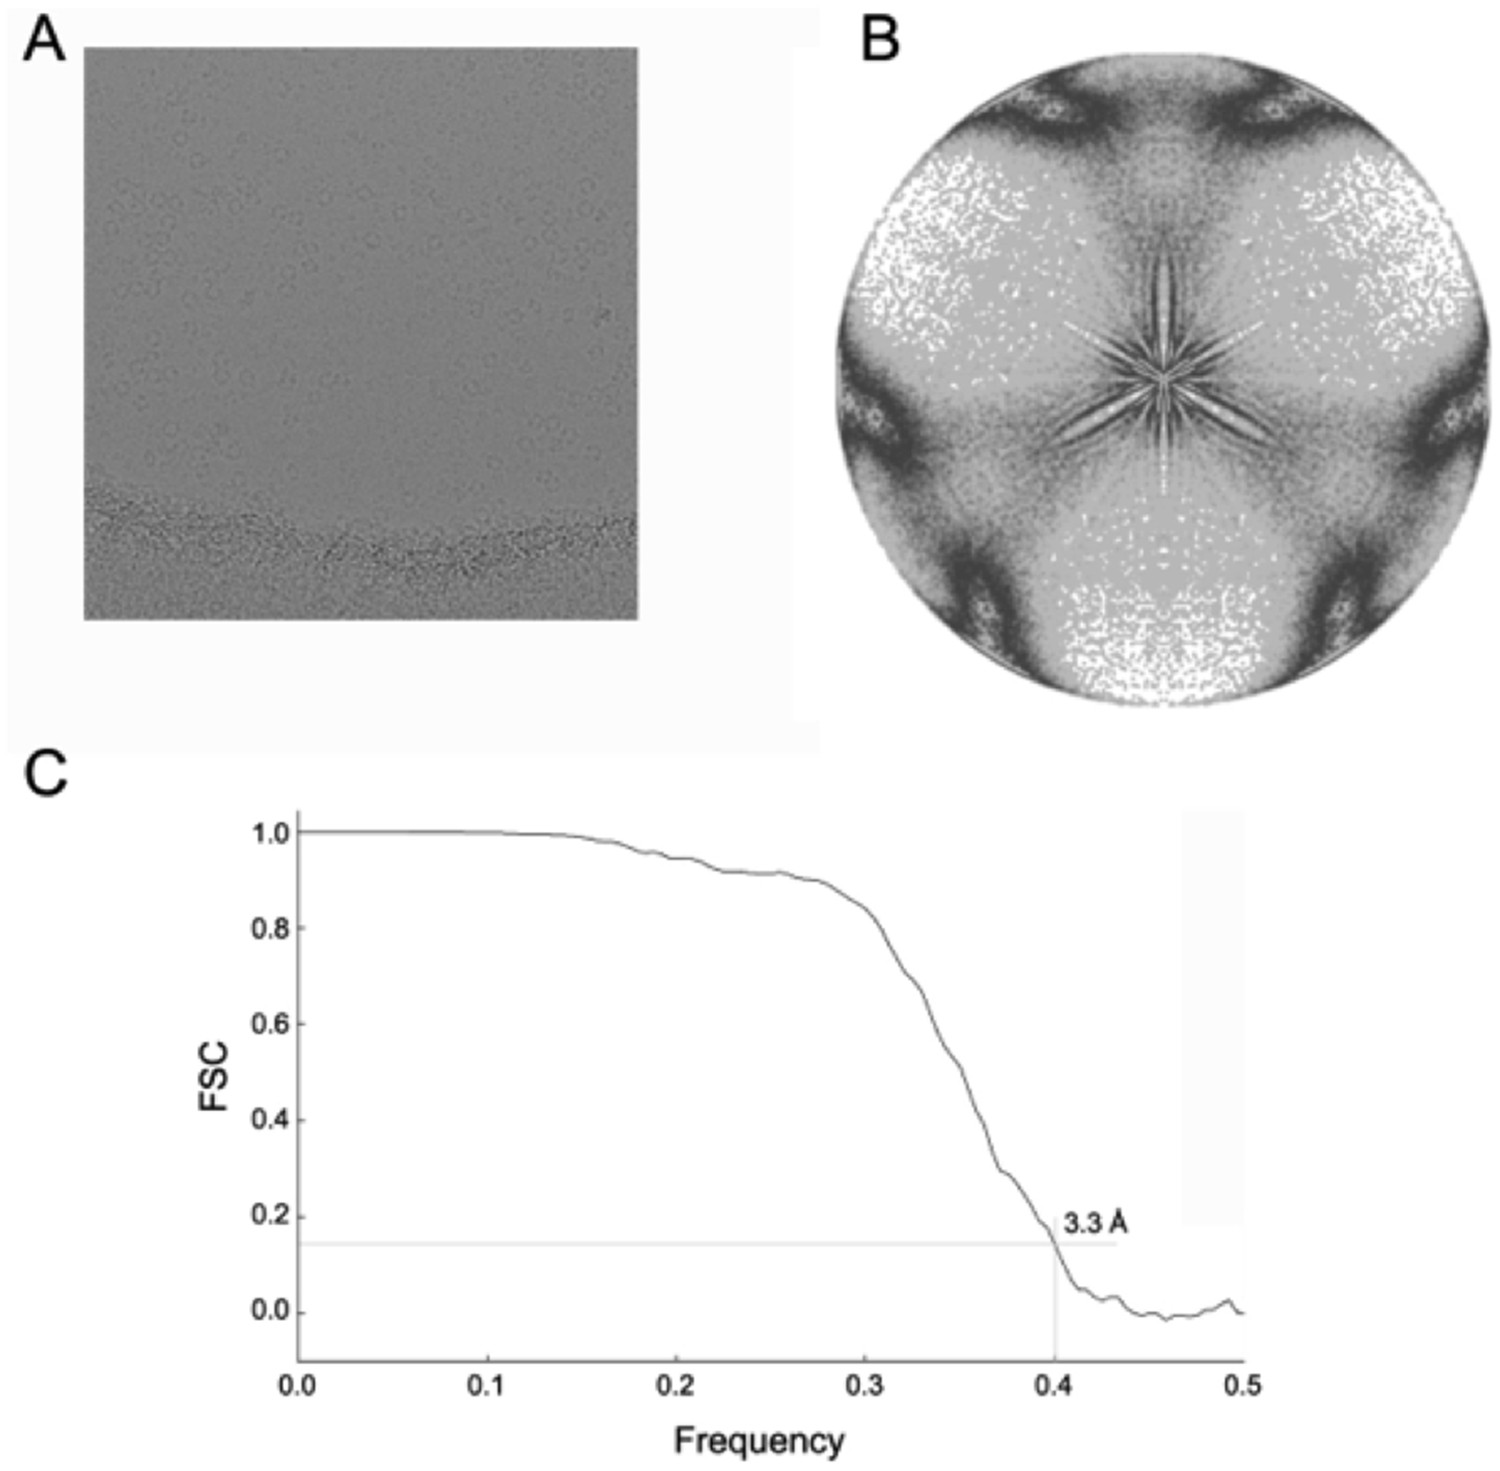
Cryo-EM analysis of the dATP-inhibited α6 ring.
(A) Aligned frame sum showing α6 ring particles preserved in amorphous ice. (B) Plot showing distribution of symmetrized projection directions of particles used to calculate the cryo-EM map of the dATP-inhibited rings. (C) Fourier shell correlation plot measuring the resolution of the cryo-EM map at ~3.3 Å.
Figure 3—figure supplement 4
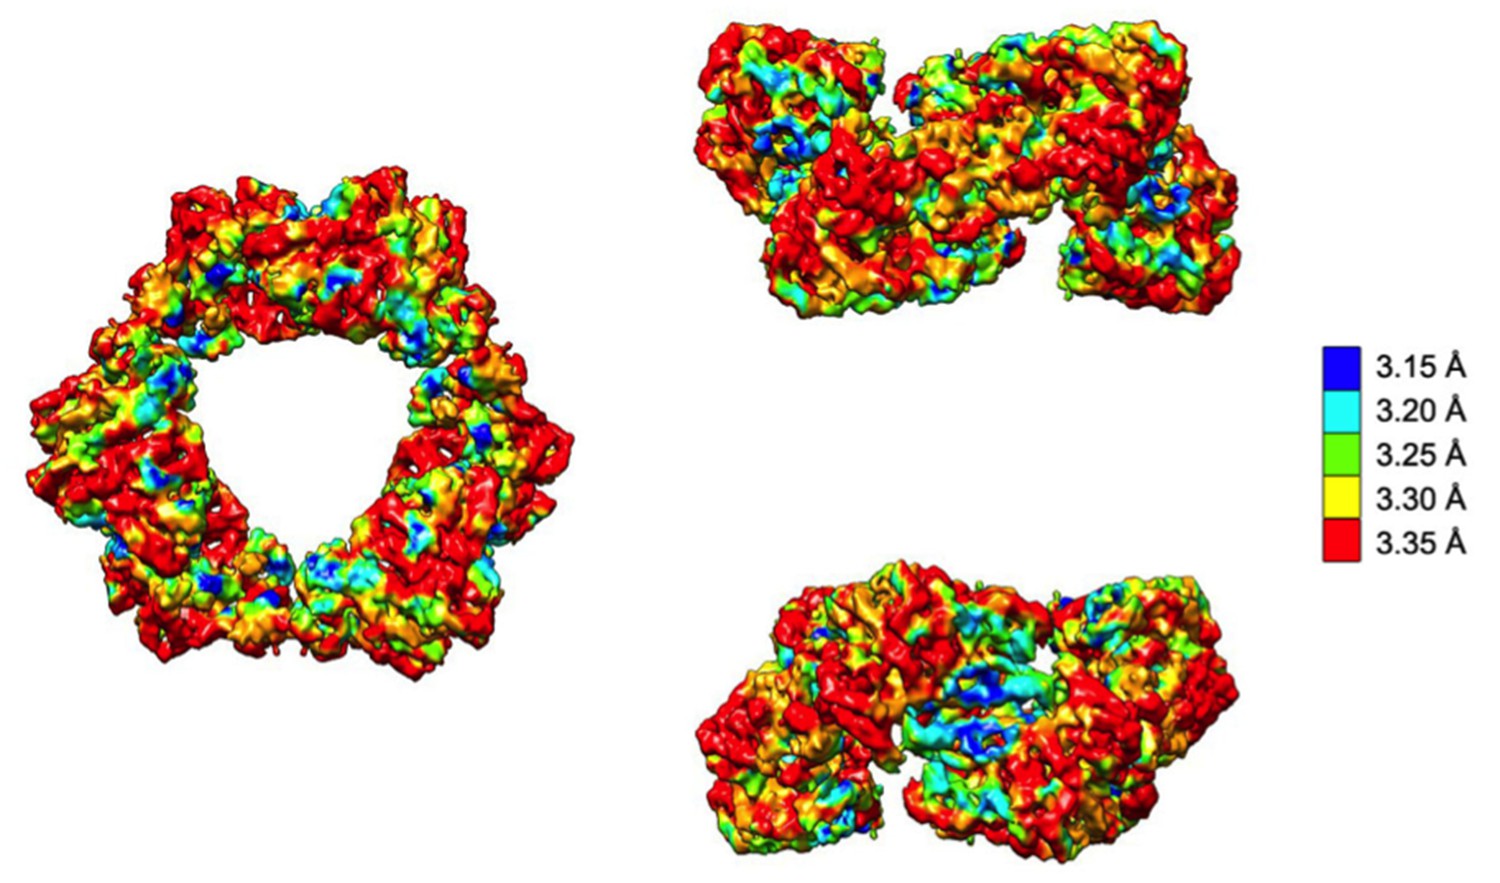
Local resolution analysis of the cryo-EM map of dATP-inhibited α6 ring.
The density map is shown in the same orientations depicted in Figure 3A colored according to local resolution, which is relatively uniform throughout but highest at the α-α dimer interface.
Figure 3—figure supplement 5
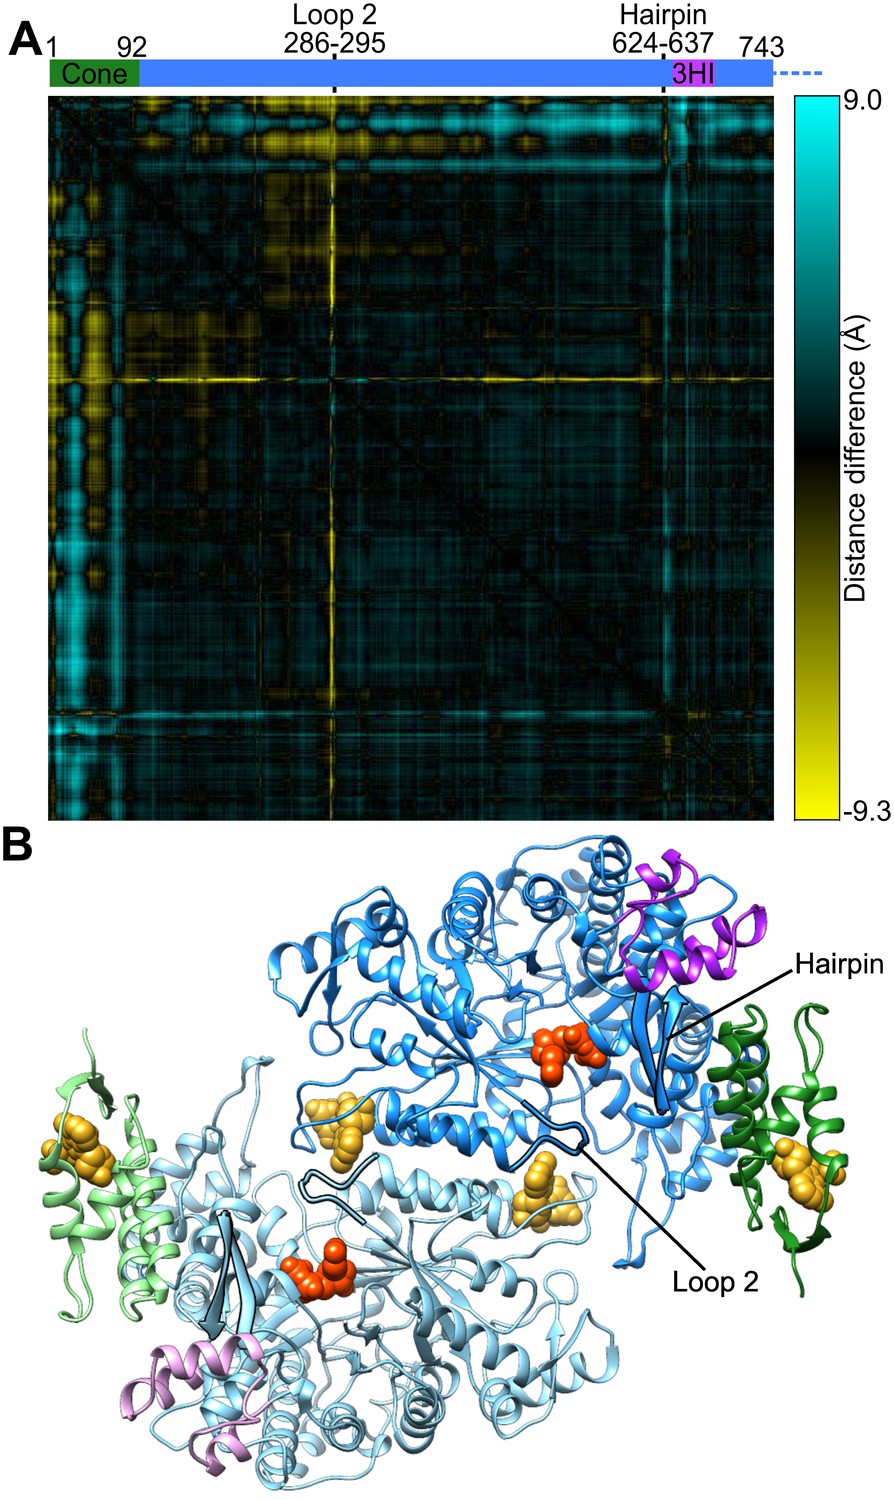
Cone domain, loop 2, and a hairpin loop have moved between human α2 and α6 ring structures.
(A) Difference between pairs of Cα-Cα distances in the human α6 cryo-EM structure and the 2.4-Å resolution crystal structure of α2-TTP (PDB: 3HNC chain B) are plotted. Residue pairs that are closer in the α2 structure are yellow, those that are closer in the α6 ring structure are blue. The cone domain (residues 1–92) has undergone a substantial rotation coupled with motion of an adjacent β-hairpin (residues Ile624–Val637). In this crystal structure loop 2 (residues Val286–Gly295) is partially disordered (Lys292 and Arg293 were not modeled) but the observed residues have changed conformation. (B) Structure of an α dimer extracted from the α6 ring cryo-EM structure indicating the locations of loop 2 and the β-hairpin highlighted with silhouettes. The cone domain is in green and the three-helix insert (3HI) is in magenta.
Figure 4

Interaction of β2 with α6 rings.
(A) ISAC averages of negatively stained α with β in the presence of both 3 mM ATP and 0.05 mM dATP (same concentrations used for cryo-EM structure) reveal variability in both occupancy and location of β. Bottom row presents corresponding views of the α6 ring as a low-resolution surface with circles highlighting the position of β2 in the averages. (B) Similar views seen in ISAC averages from cryo-EM specimens of α with β and ClFTP. (C) 3D cryo-EM reconstruction of α with β and ClFTP. (D) Model of β2 docked with an α2 in the α6 ring is tightly constrained by proximity of cone domains (green) and the three-helix insertion (purple) of α2 and adjacent α subunits in the ring. (E) Variance map shows additional partially ordered density for C-terminal tails of α protruding into the central opening of the α6 ring.
Figure 5
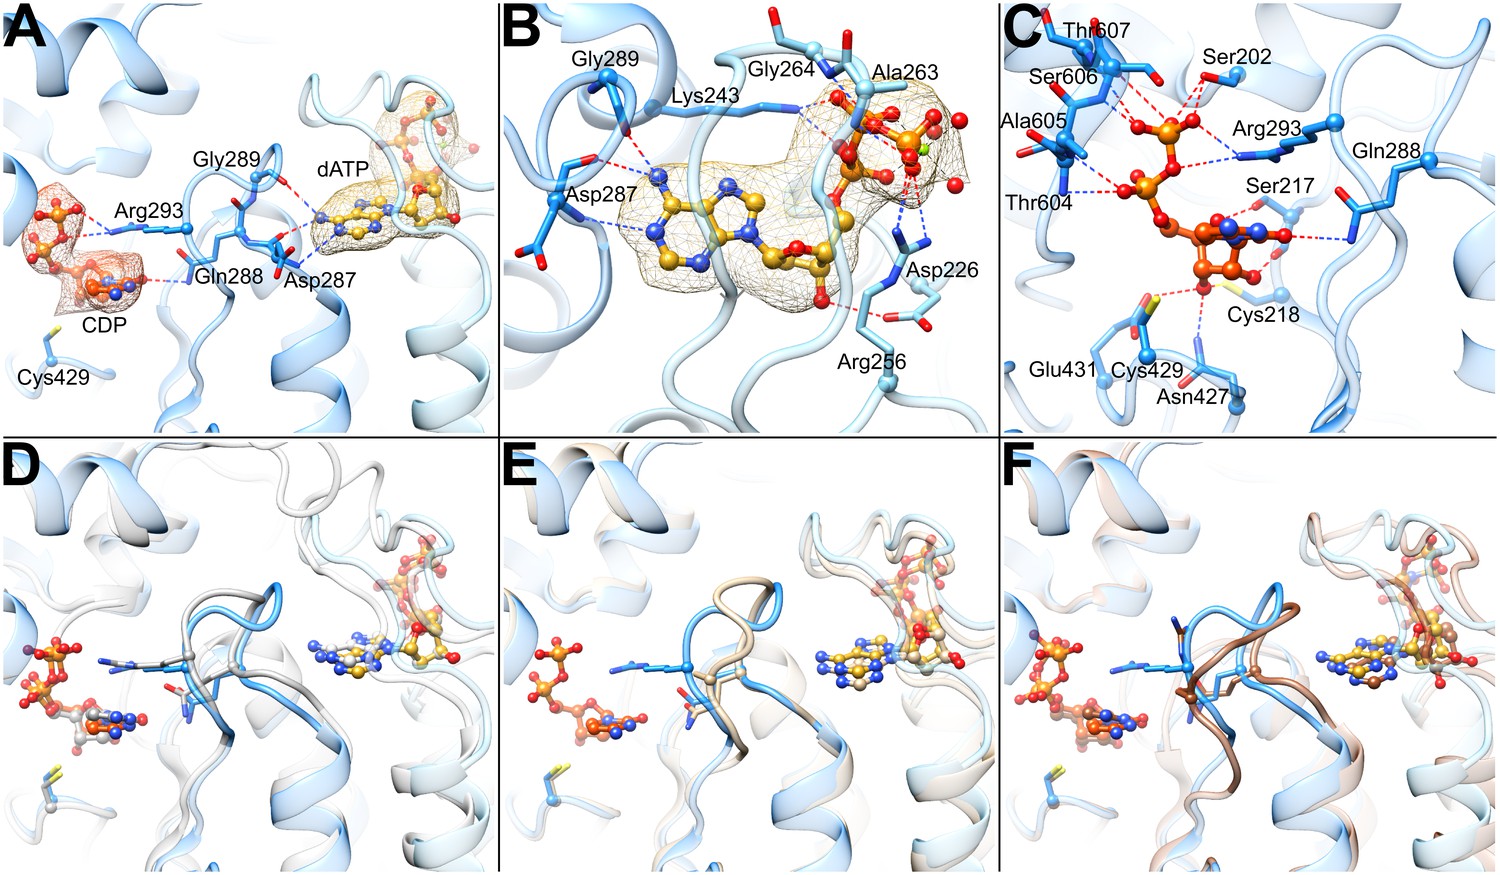
Determinants of substrate specificity are conserved from E. coli to human.
(A) Residues of human α (blue) interacting with CDP (carbons in orange) in the active site and dATP (carbons in yellow) in the specificity site. Density for CDP in orange mesh and for dATP in yellow mesh. (B) Zoom in on dATP in the specificity site. Water molecules and oxygen atoms are in red, nitrogen in blue, magnesium in green, and phosphate in gold. (C) Zoom in on CDP in the active site. (D) Overlay of human α from the α6 EM structure in blue with E. coli α from the α4β4-CDP-dATP cocrystal structure in gray (PDB: 5CNS) shows a nearly identical loop 2 conformation positioning Gln288 and Arg293 (Gln294 and Arg298 in E. coli). (E) Overlay of human α from the α6 EM structure in blue with crystal structure of human α with N- and C-termini truncated (residues 77–742) cocrystallized with dATP in tan (PDB: 2WGH) shows similar positioning of dATP but an altered conformation of loop 2 in the absence of bound CDP. The CDP shown is from the α6 EM structure. (F) Overlay of human α from the α6 EM structure in blue with equivalent residues of yeast α structure with CDP and AMPPNP in brown (PDB: 2CVU) shows a conformation of loop 2 that is distinct from that seen in structures of E. coli and human α.
Videos
Video 1
Overview of the cryo-EM density and detail of the intersubunit contacts made by the cone domain to stabilize the α6 ring.
Starting from a view down the three-fold symmetry axis, the structure rotates to a view of the cone domains on the two-fold symmetry axis, zooms into the intersubunit interface as seen in Figure 3C, and then rocks back and forth over a range of 30°. Density is shown as mesh colored according to regions of the structural model as in Figure 1.
Video 2
Overview of the cryo-EM density and detailed view of the bound CDP substrate, dATP specificity effector, and loop 2 conformation.
Starting from a view down the three-fold symmetry axis, the structure rotates while zooming through the center of the ring for a view of the loop 2 region that confers substrate preference as seen in Figure 5A, and then rocks back and forth over a range of 30°. Density is shown as mesh colored according to regions of the structural model as in Figure 1.
Tables
Table 1
Summary of single-particle data collection, 3D reconstruction, and model refinement
https://doi.org/10.7554/eLife.31502.011| Imaging parameters and 3D reconstruction | |
| Acceleration voltage (kV) | 300 |
| Magnification (X) | 22,500 |
| Pixel size (Å) | 1.315 |
| Frame rate (s−1) | 5 |
| Exposure time (s) | 7.6 |
| Total exposure (e- / Å) | 44 |
| Particles Micrographs used for selection Defocus range (μm) Windowed In final 3D reconstruction | 2144 0.7–3.5 ~150,000 43,885 |
| Resolution ‘Gold-standard’ at FSC 0.143 (Å) | 3.3 |
| Model refinement | |
| Resolution in phenix.real_space_refine (Å) | 3.0 |
| Number of atoms/residues/molecules NCS restrained chains Protein atoms, residues per chain Nucleotide atoms, molecules per chain Mg2+ atoms per chain Water molecules per chain | 6 5958, 745 85, 3 2 6 |
| Secondary structure restraints (per chain) Helices Sheets Ramachandran Hydrogen bonds C-beta torsion restraints (per chain) | 29 7 743 252 1404 |
| Ramachandran angles Favored Allowed Outliers | 94.3 5.7 0.0 |
| r.m.s. deviations Bond lengths (Å) Bond angles (°) | 0.01 1.28 |
| Molprobity Score Clashscore Omegalyze outliers (residues per chain) | 1.76 6.89 1 |
| EMRinger score | 3.09 |
Additional files
-
Transparent reporting form
- https://doi.org/10.7554/eLife.31502.016
Download links
A two-part list of links to download the article, or parts of the article, in various formats.
Downloads (link to download the article as PDF)
Open citations (links to open the citations from this article in various online reference manager services)
Cite this article (links to download the citations from this article in formats compatible with various reference manager tools)
3.3-Å resolution cryo-EM structure of human ribonucleotide reductase with substrate and allosteric regulators bound
eLife 7:e31502.
https://doi.org/10.7554/eLife.31502


