Spatial structure of disordered proteins dictates conductance and selectivity in nuclear pore complex mimics
- Delft University of Technology, Netherlands
- University of Groningen, Netherlands
- Max Planck Institute for Biophysical Chemistry, Germany
Figures
Figure 1 with 7 supplements
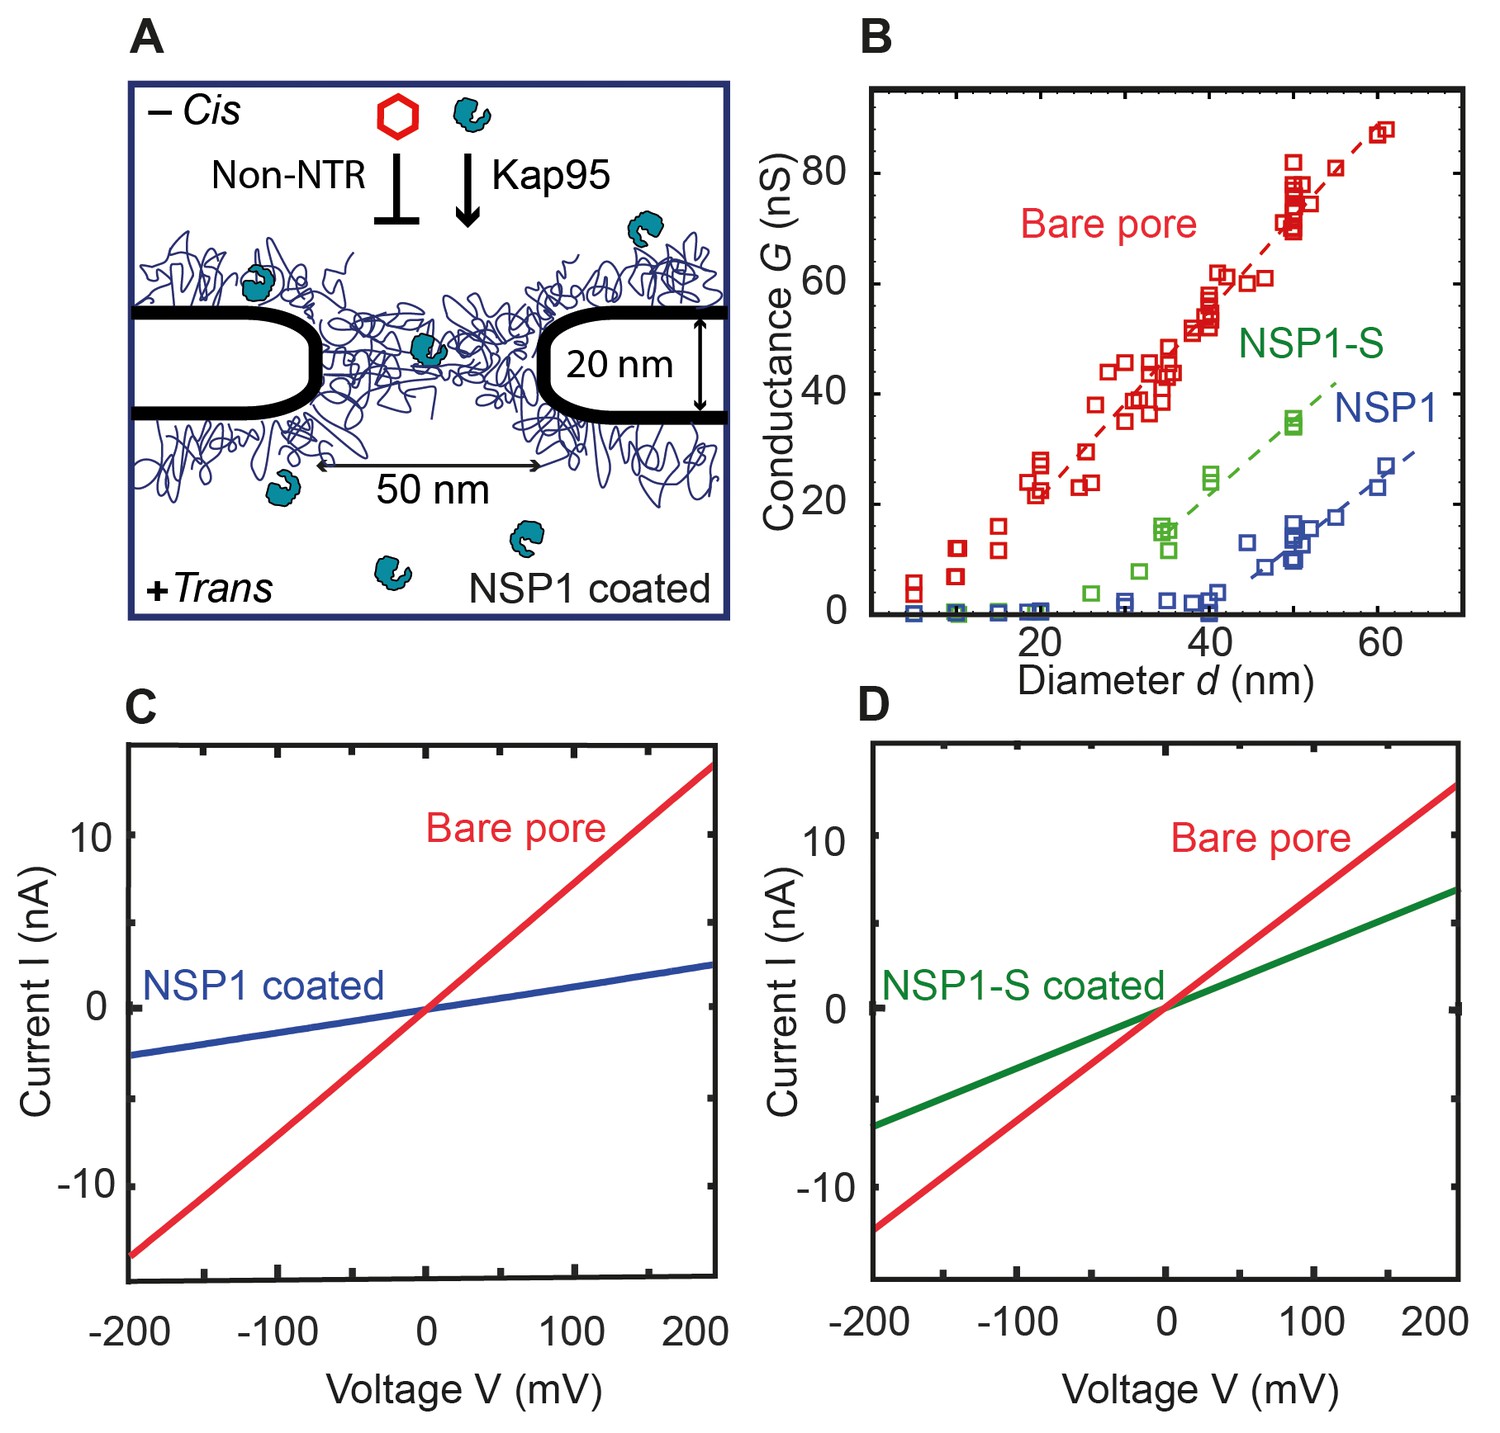
Coating a nanopore with FG-Nups reduces the pore conductivity.
(A) Schematic of the biomimetic NPC where yeast FG-Nup Nsp1 is coated onto a solid-state nanopore of diameter 50 nm and thickness of 20 nm. Kap95, a yeast importer, can pass through the barrier, whereas most other proteins such as tCherry fail to pass through the pores. (B) Conductance versus pore diameter for bare pores (red), Nsp1-coated pores (blue), and Nsp1-S-coated pores (green). The conductance is low (<4 nS) for small-diameter biomimetic pores, below a threshold diameter 41 ± 2 nm and 26 ± 3 nm, for Nsp1 and Nsp1-S respectively. Above this threshold diameter, the conductance increases linearly with slope similar to that of the bare pore conductance. Dashed lines are linear guides to the eye. (C and D) Current vs voltage curves for a 50 nm pore before (red) and after Nsp1 coating (blue). The conductance drops by about 80% after coating, confirming a high density of Nsp1 inside the nanopore. (D) Current vs voltage curves for a mutant Nsp1-S-coated (green) 50 nm pore. Here the conductance drops by about 50% compared to the bare pore (red).
Figure 1—figure supplement 1
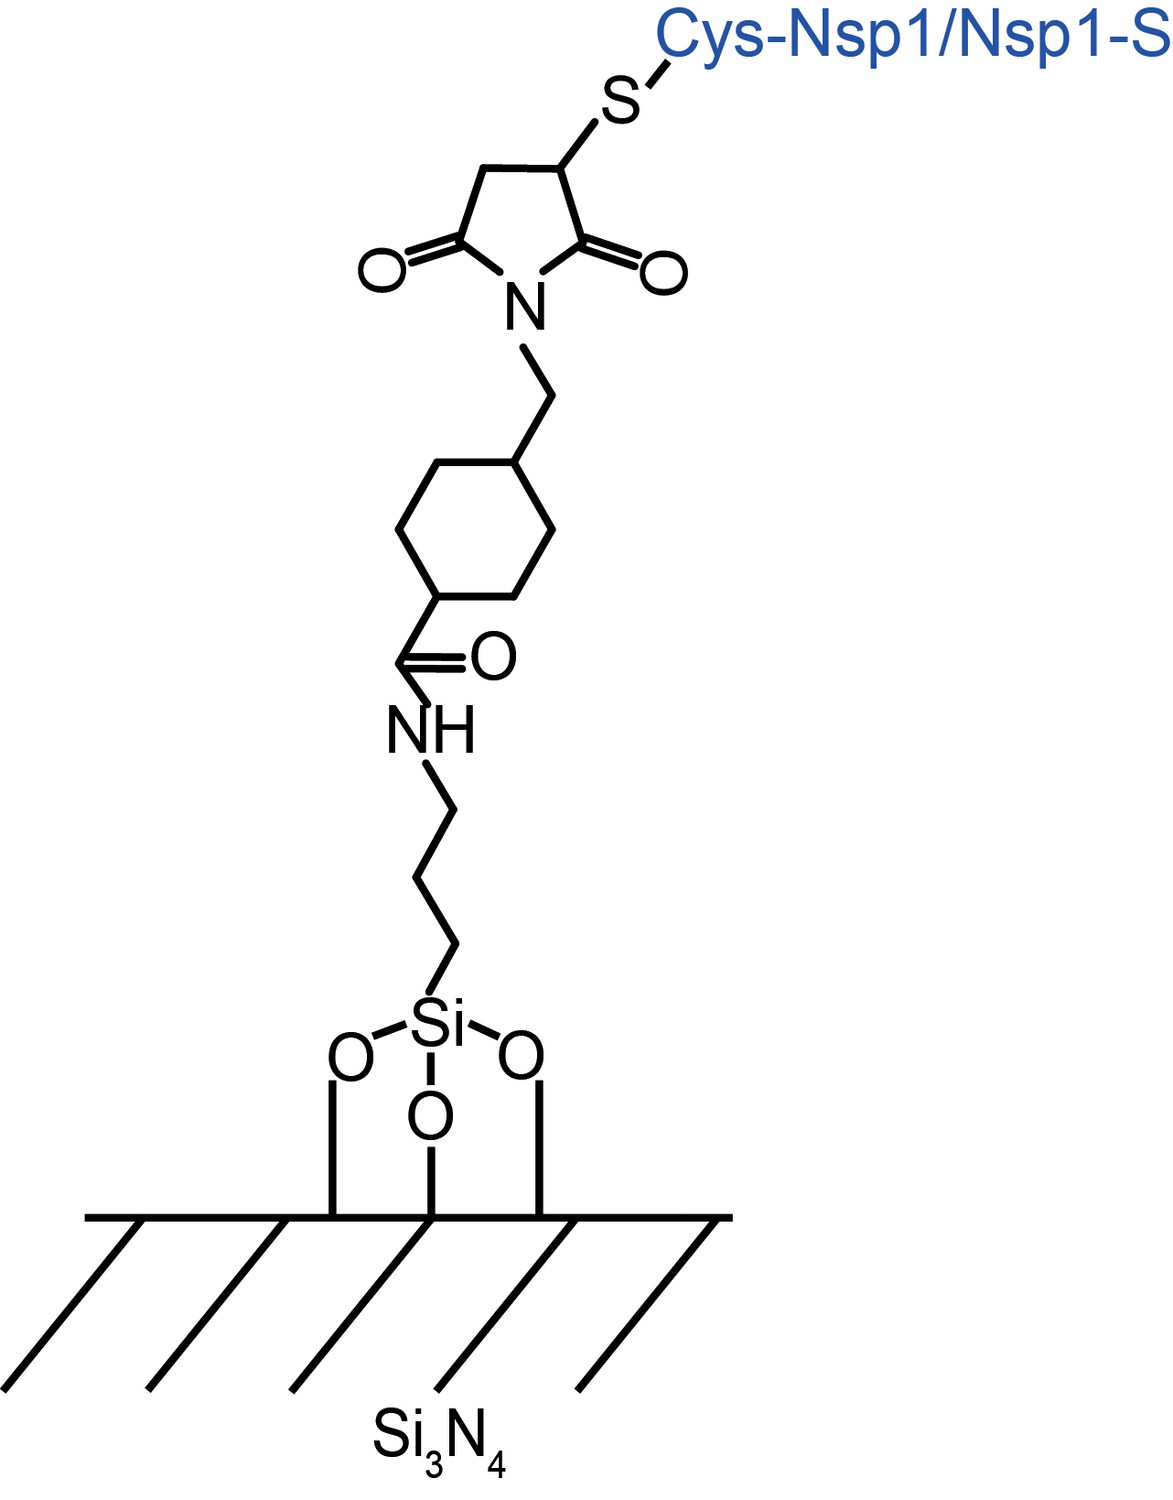
Self-assembled monolayer surface chemistry for covalently attaching Nsp1 and Nsp1-S to Silicon Nitride membrane.
The APTES layer was used as a primary monolayer through silanization. Next, the NHS-ester with a maleimide reactive group (Sulfo-SMCC) was coupled to the APTES monolayer. The exposed maleimide functioned as a binding group to C-terminal cysteine.
Figure 1—figure supplement 2

Current power spectral density of a bare pore and nanopores coated with Nsp1 and Nsp1-S, versus frequency.
From the spectrum of the Nsp1 pore it is evident that the 1/f noise increases drastically compared to the bare pore (Smeets et al., 2008). This is a clear indication of the fluctuations of Nsp1. A similar trend is observed for Nsp1-S coated pores.
Figure 1—figure supplement 3
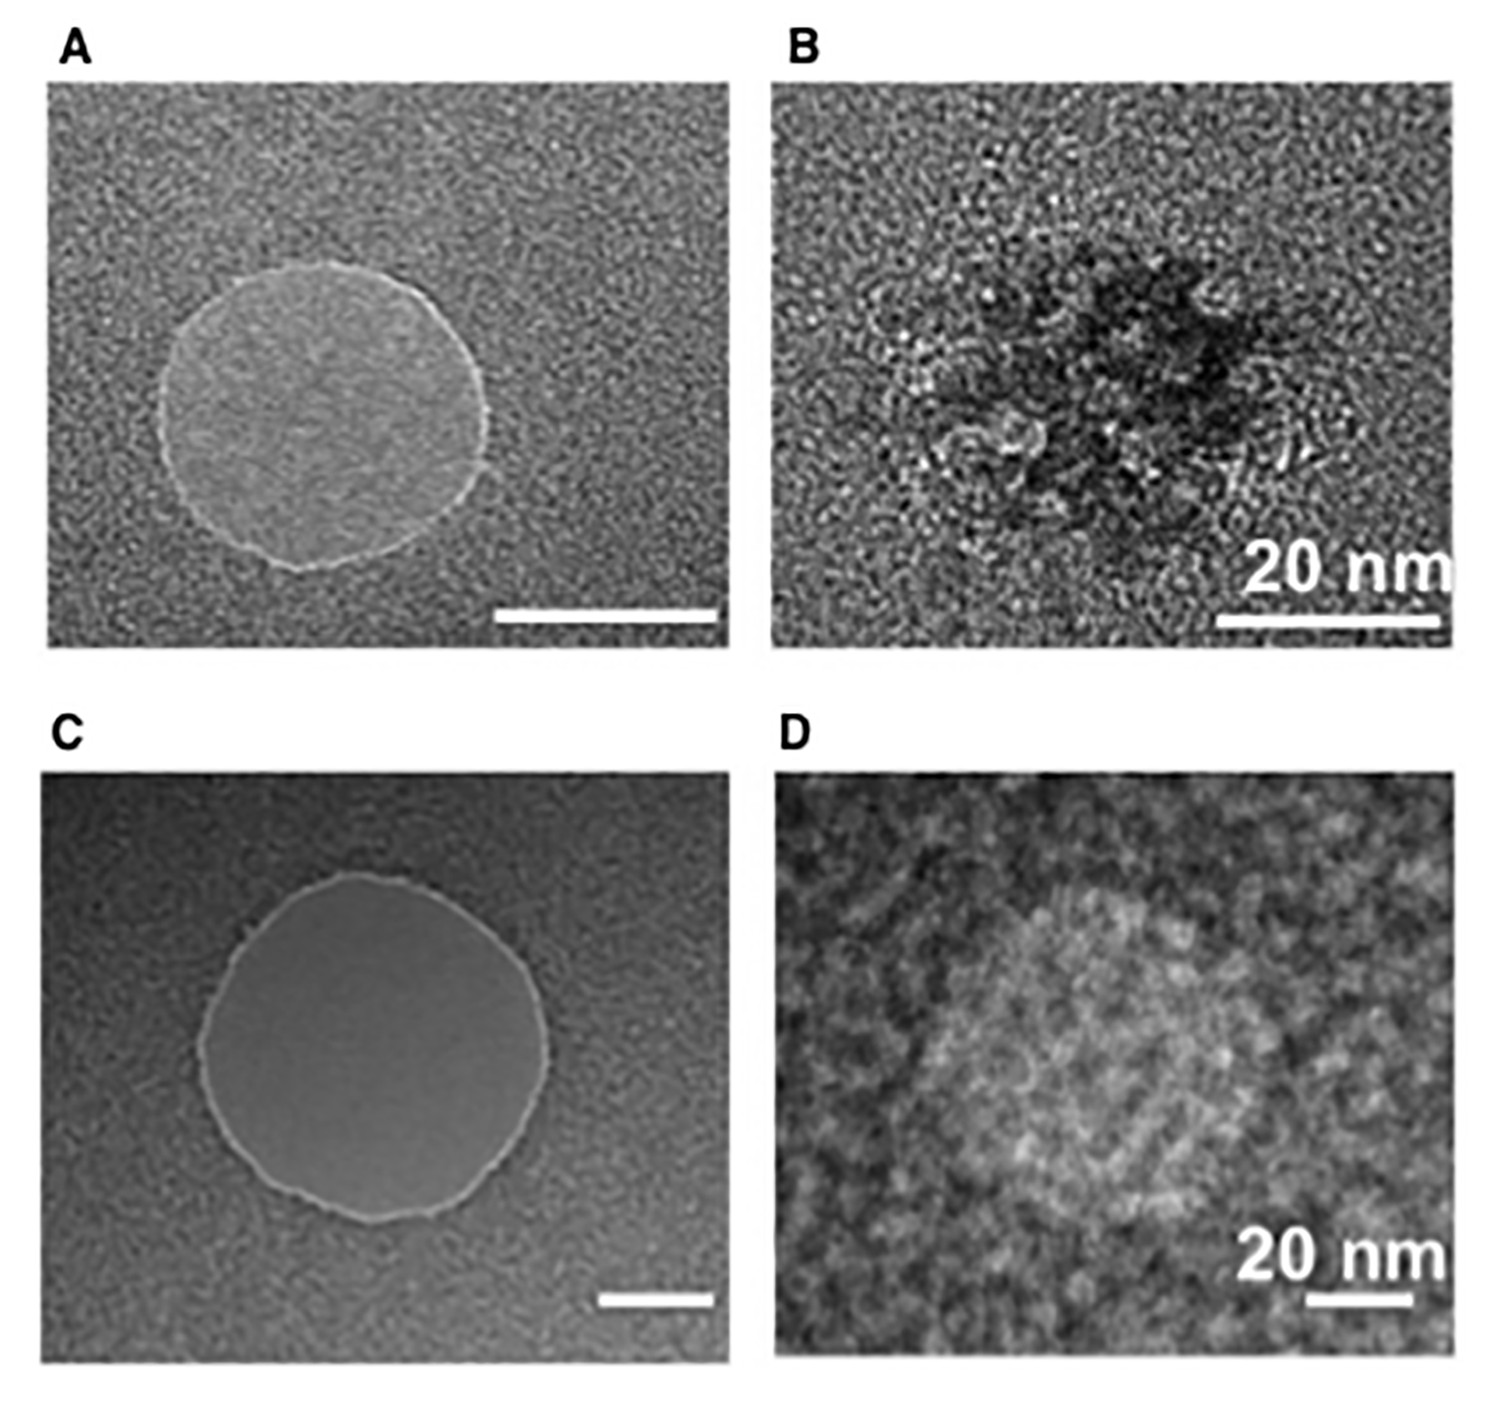
Transmission electron microscopy (TEM) images of bare and Nsp1-coated pores.
(A, B) 30 nm pores and (C,D) 50 nm pore before and after Nsp1 coating respectively. While these images of dried pores do not necessarily represent the intrinsic mass distribution, they serve to deduce the presence of Nsp1 in both (B) and (D). These TEM images show a higher density of Nsp1 in the 30 nm nanopores, which is in agreement with the conductance measurement with nanopore.
Figure 1—figure supplement 4
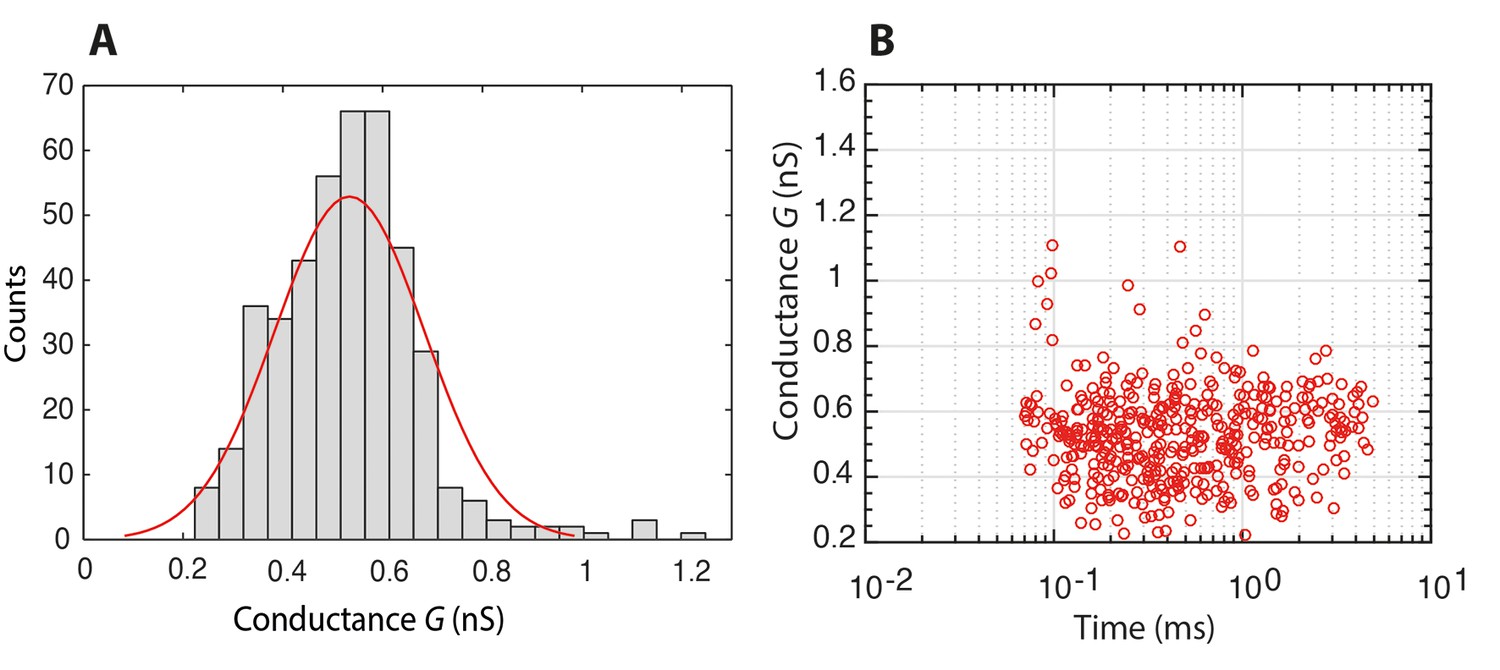
Histogram of the conductance of individual Nsp1 molecules translocating through a bare pore, and the associated scatter plot of conductance versus translocation time.
https://doi.org/10.7554/eLife.31510.006
Figure 1—figure supplement 5
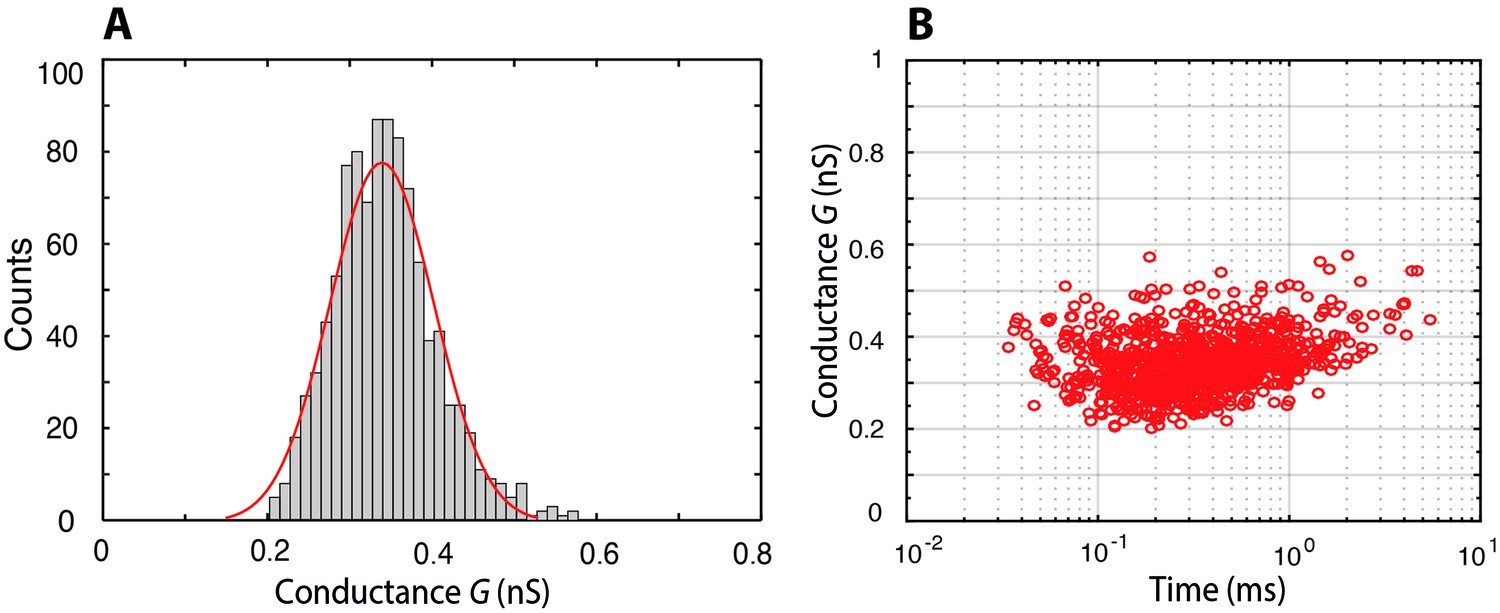
Histogram of the conductance of individual Nsp1-S molecules translocating through a bare pore, and the associated scatter plot of conductance versus translocation time.
https://doi.org/10.7554/eLife.31510.007
Figure 1—figure supplement 6
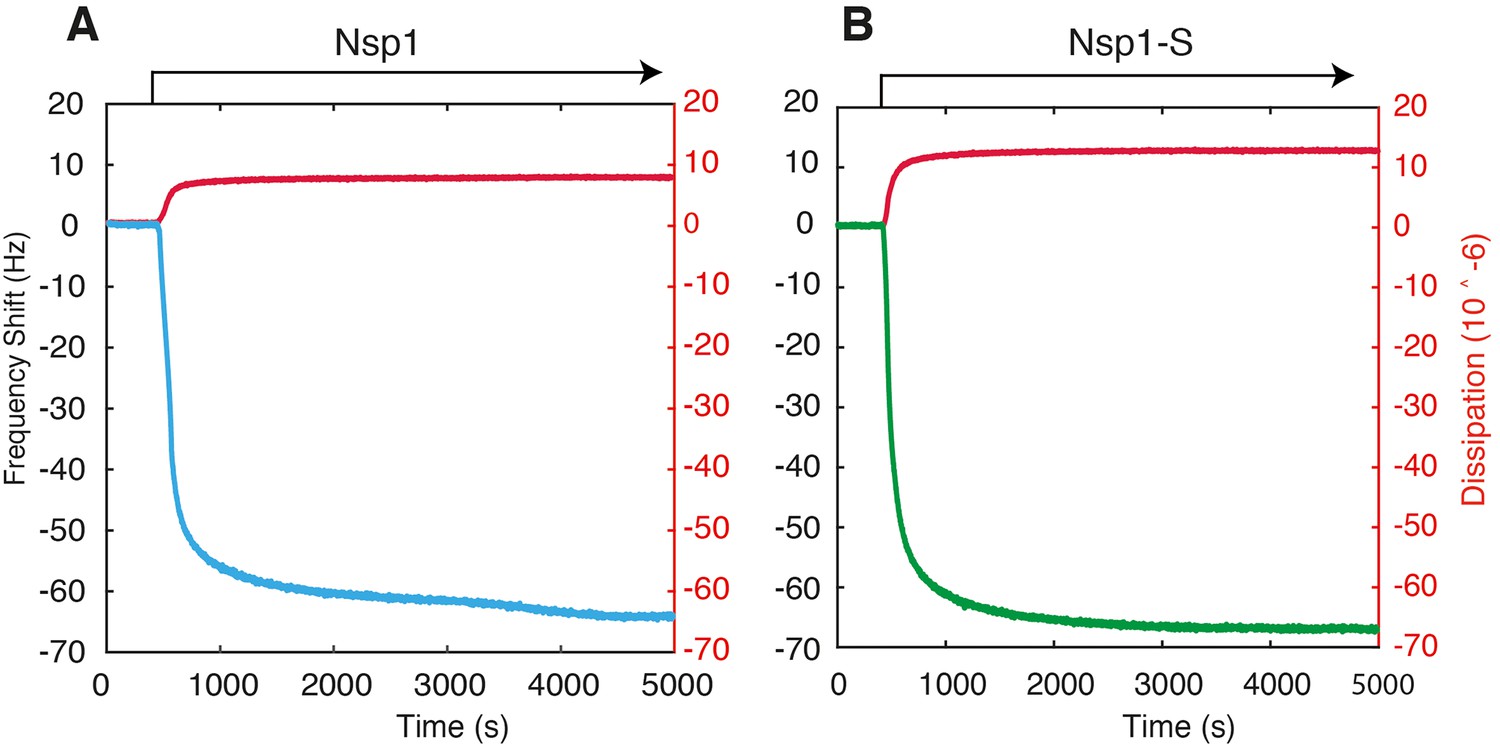
Example QCM-D traces for the surface functionalization of Nsp1 (A) and Nsp1-S (B) on silicon nitride coated with APTES and Sulfo-SMCC.
https://doi.org/10.7554/eLife.31510.008
Figure 1—figure supplement 7
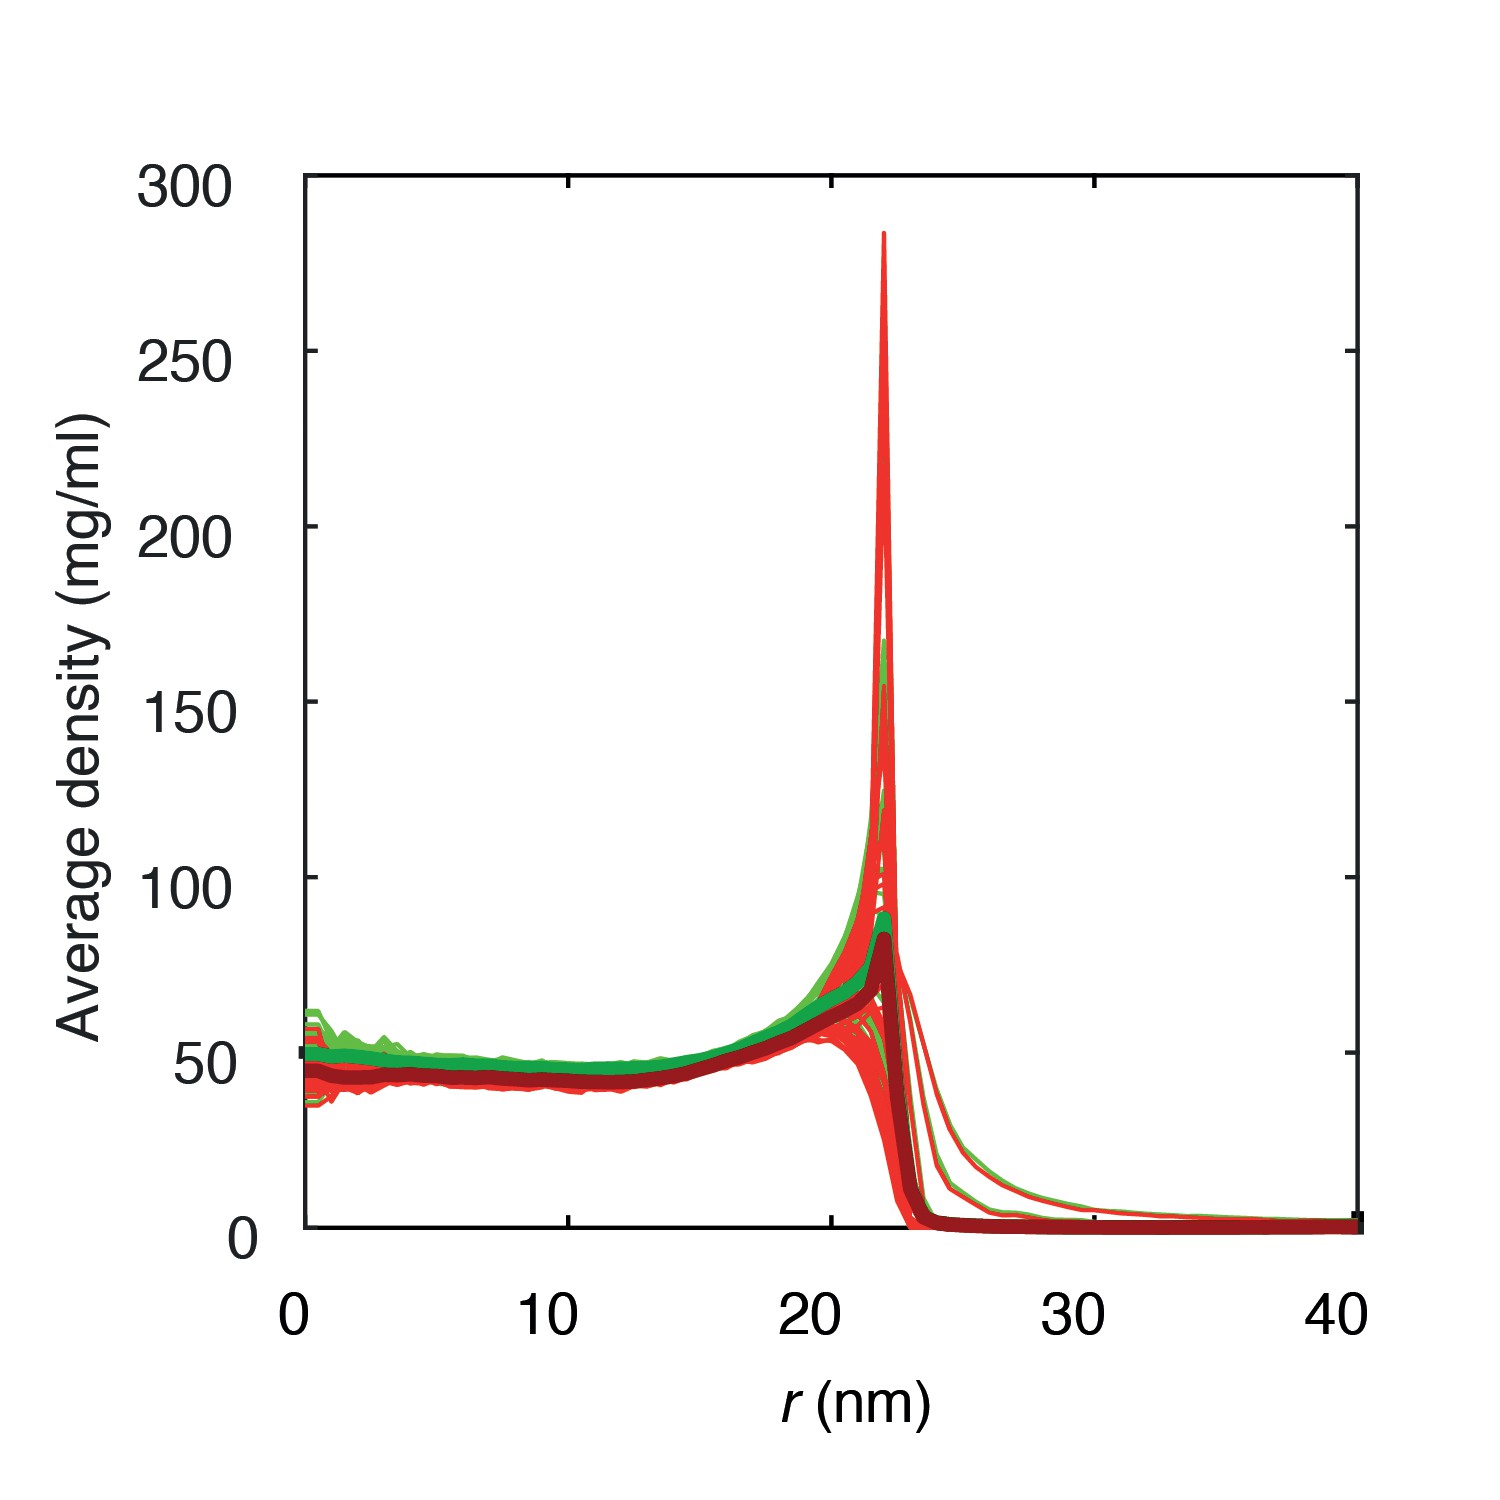
Average protein densities of a Nsp1-S coated solid-state nanopore of diameter 45 nm with grafting distance 5.7 nm (green) and 5.9 nm (red).
https://doi.org/10.7554/eLife.31510.009
Figure 2 with 2 supplements
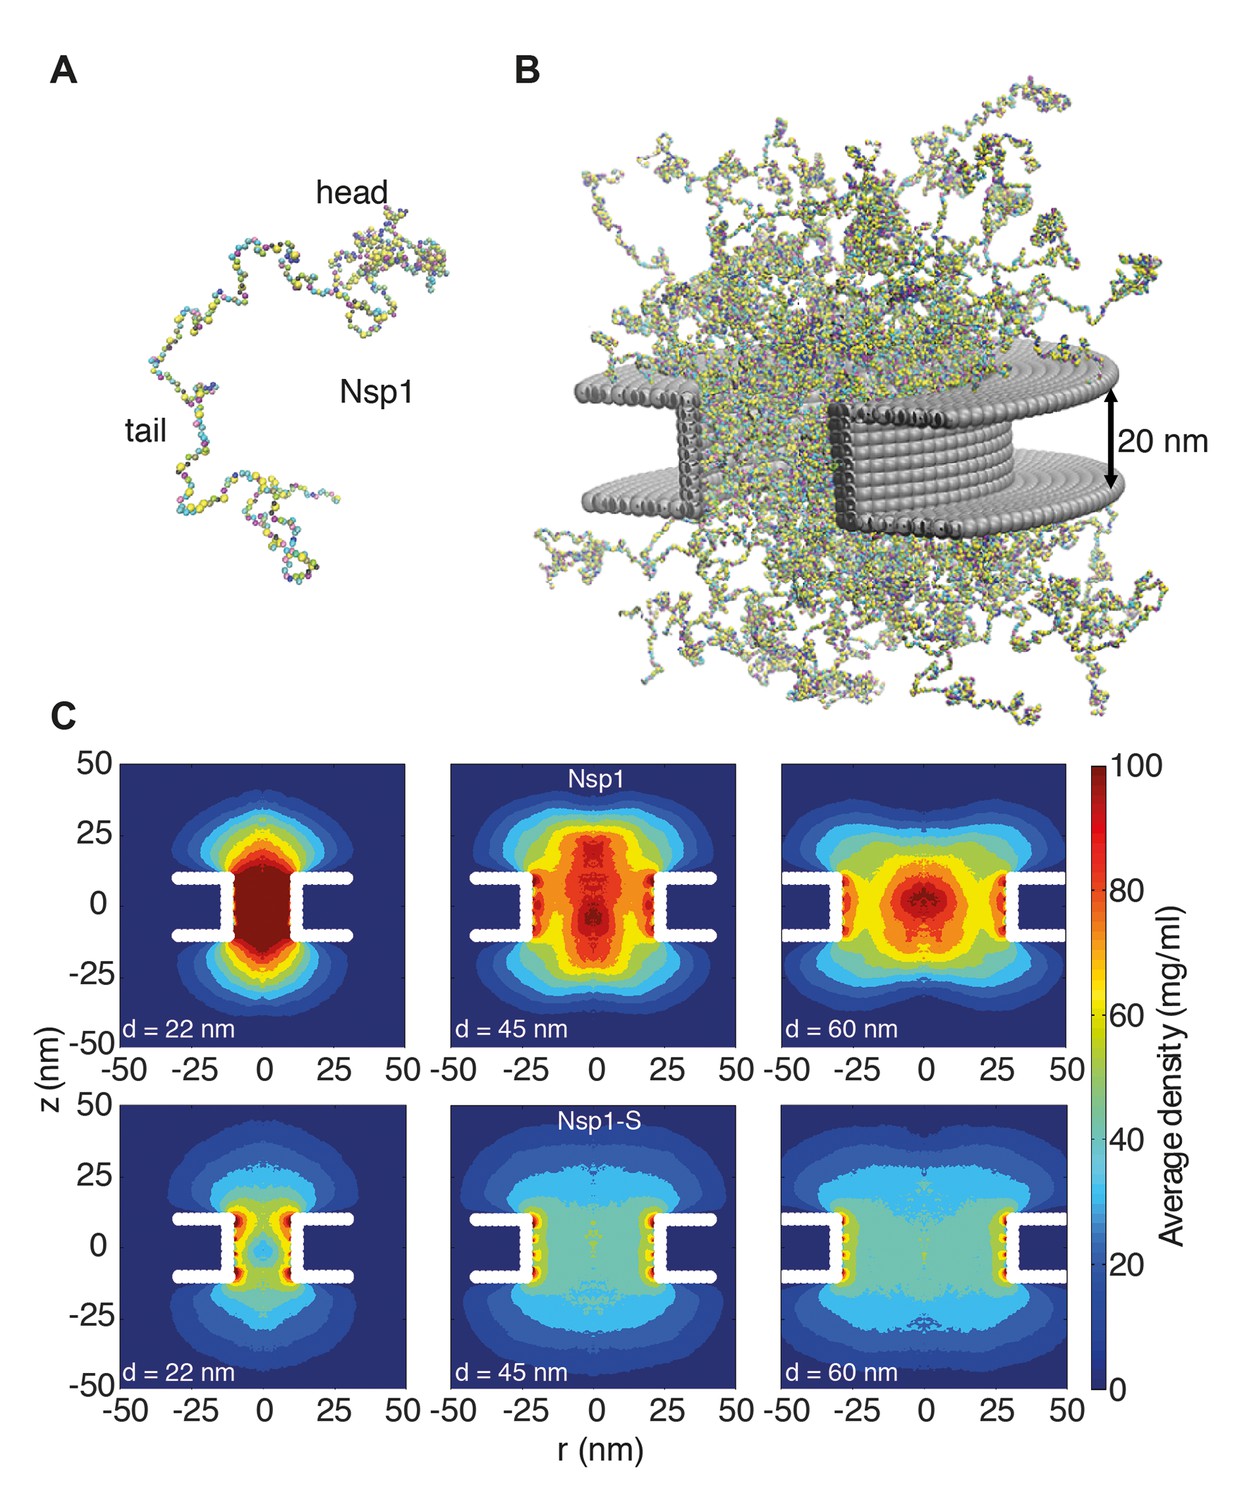
Coarse-grained molecular dynamics results of Nup density distributions in Nsp1 and Nsp1-S pores of varying diameter.
(A) Coarse-grained one-bead-per-amino-acid representation of Nsp1; the different colors of the beads represent the 20 different amino acids. The collapsed-coil N-terminal ‘head’ region is visible at the top right. (B) Multiple Nsp1s tethered inside a cylindrical pore of height 20 nm and a diameter of 45 nm with anchor points spaced according to a fully triangulated (close-packed) distribution with a spacing of 5.7 nm. (C) Time-averaged r-z density distribution of Nsp1-coated nanopores (top row) with diameters 22 nm, 45 nm and 60 nm; and similarly for Nsp1-S (bottom row). These data show denser structures for the smaller pores and much lower densities for Nsp1-S compared to the wildtype Nsp1. The nups are coated on the inner surface of the cylindrical nanopores at a close-packed triangular spacing of 5.7 nm.
Figure 2—figure supplement 1
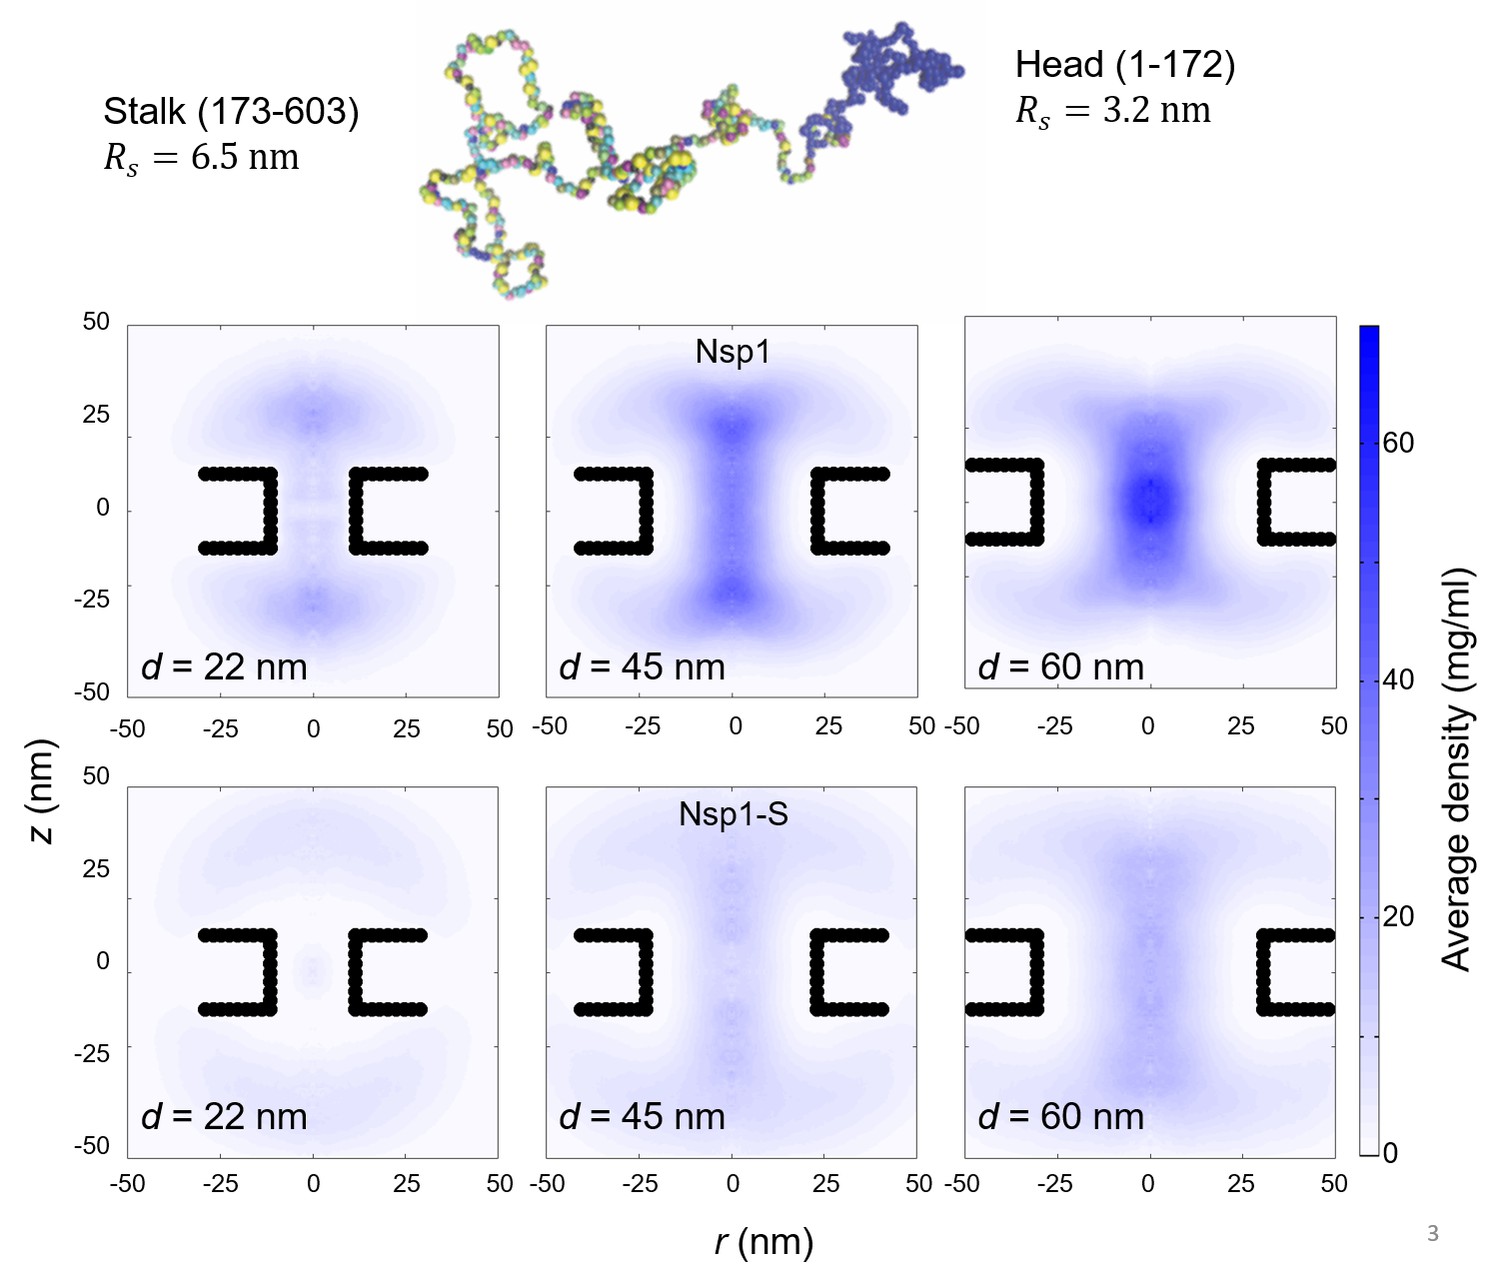
Top: The configuration of Nsp1 consists of a ‘collapsed coil’ head (in blue) and a ‘extended coil’ stalk region (multi-colored; each color represents a different amino acid).
Bottom: Two-dimensional r-z density distribution of the mass density of the head-region (1-172) of Nsp1, for nanopores with diameters 22 nm, 45 nm and 60 nm (first row). The second row shows the same pores but coated with the Nsp1-S mutant. These data show the much more center-pore localized mass density for the wildtype Nsp1 compared to the Nsp1 mutant.
Figure 2—figure supplement 2
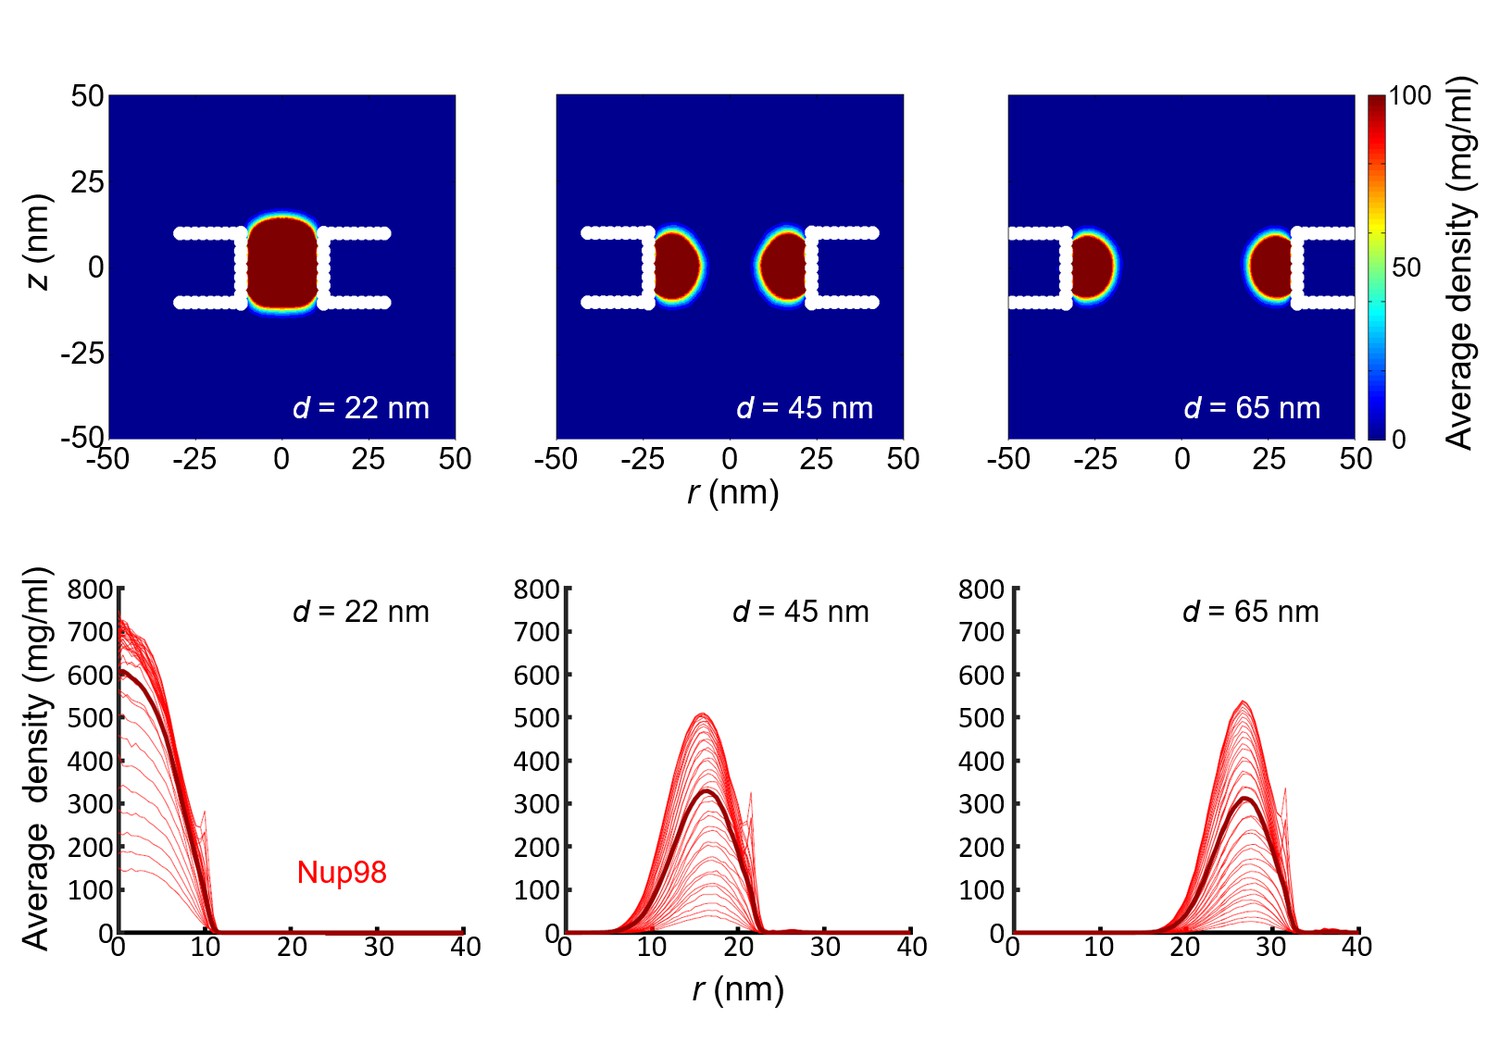
Simulation results for the density distribution in Nup98-coated biomimetic pores.
Top panel: Two-dimensional r-z density distribution of Nup98-coated pores with diameters 22 nm, 45 nm, and 65 nm. Bottom panel: the corresponding radial density distributions. All data are taken within the height of the cylinder (20 nm; −10 nm <z < 10 nm) that is divided into 20 equally spaced discs of thickness 1 nm each. Each of the 20 curves represented in each panel shows the radial density distribution for that specific z location.
Figure 3 with 4 supplements
Radial density distribution and conductance data for Nsp1 and Nsp1-S biomimetic pores.
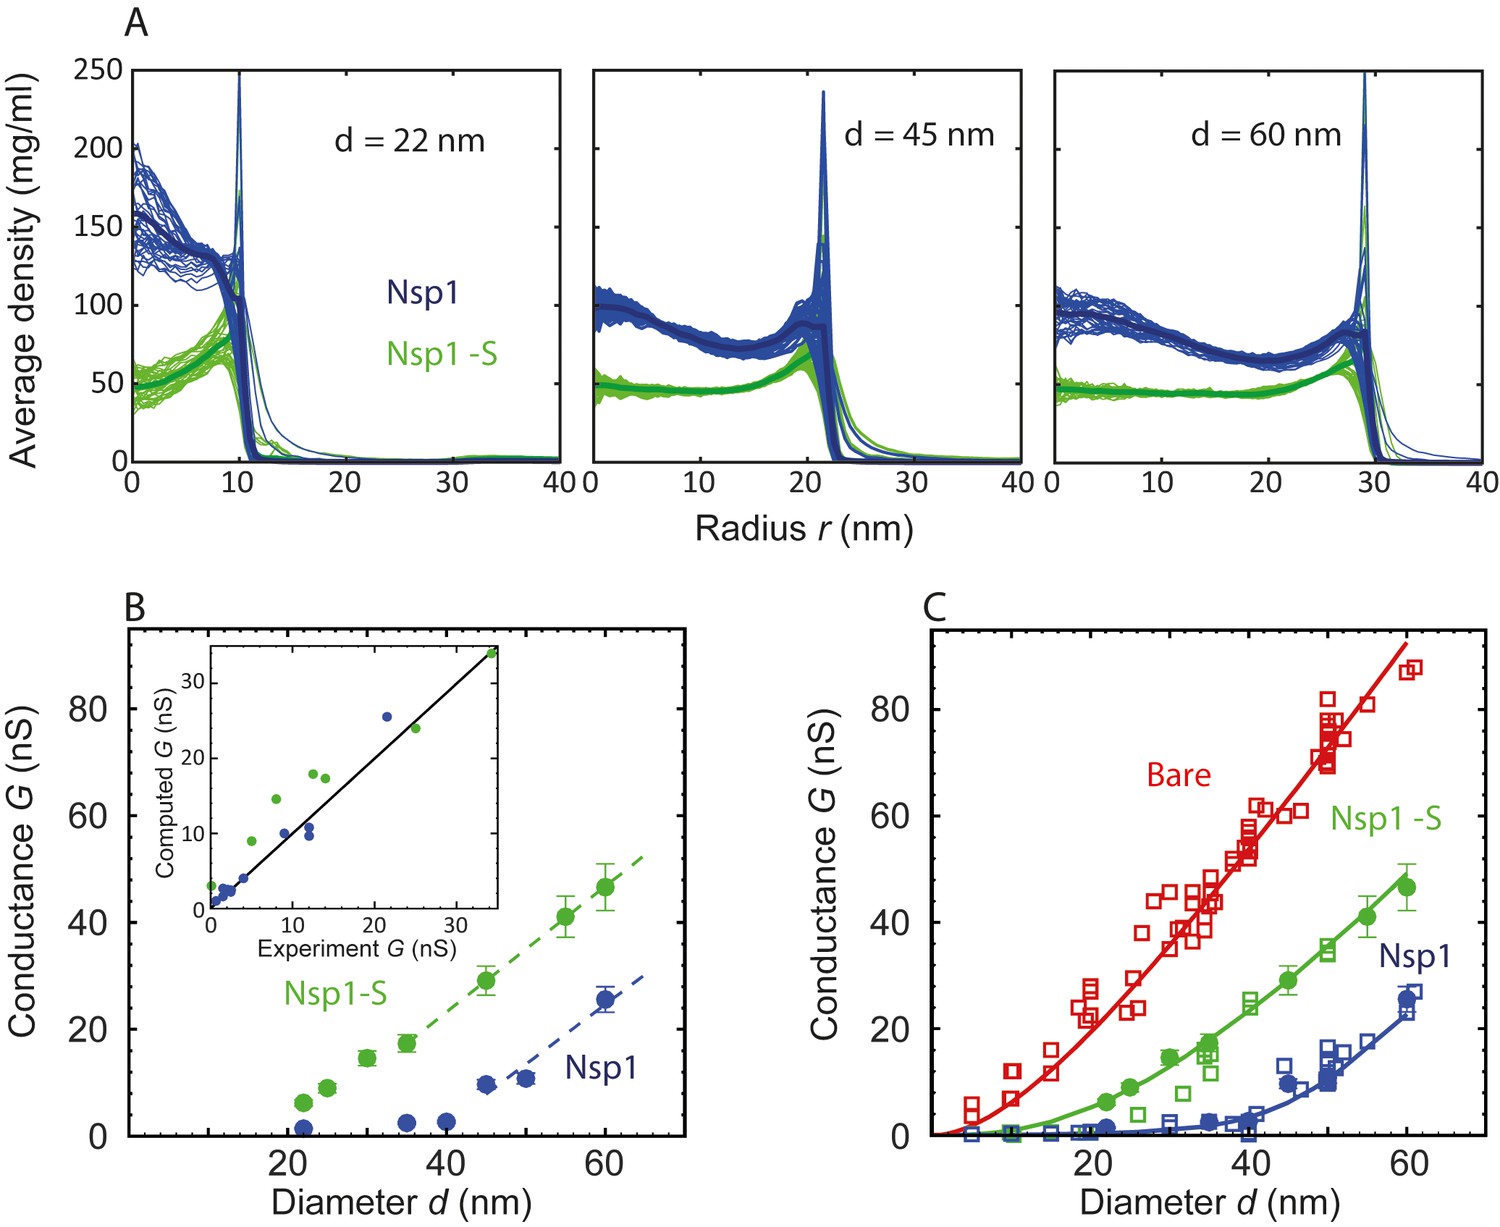
(A) Radial protein density distribution for biomimetic nuclear pores with pore diameters of 22 nm, 45 nm, and 60 nm, for pores coated with Nsp1 (blue) and Nsp1-S (green). All data are taken within the height of the cylinder (20 nm; −10 nm <z < 10 nm) that is divided into 20 equally spaced discs of thickness 1 nm each. Each of the 20 curves represented in each panel shows the radial density distribution for that specific z location. (B) Modeling results for the conductance as a function of pore diameter for Nsp1-coated pores (blue) and Nsp1-S-coated pores (green). The dashed lines are linear guides to the eye. The inset shows a comparison between the computed and the experimental conductance. (C) Conductance versus pore diameter for the experimental (open symbols) and modeling data (closed symbols). For Nup-coated pores, the conductance is low (G < 4 nS) for small diameters, but it increases strongly with a non-linear dependence on pore diameter beyond ~40 nm for Nsp1 and beyond ~20 nm for Nsp1-S. At larger diameters the conductance increases almost linearly with a slope slightly smaller than that of the bare pore, with G-values of tens of nS. The red solid line corresponds to Equation (1) for the bare pore and the green and blue solid lines correspond to Equation (2) with the conductivities for the access and pore regions obtained by fitting the numerical results using sigmoidal functions (see Figure 3—figure supplement 2 ).
Figure 3—figure supplement 1
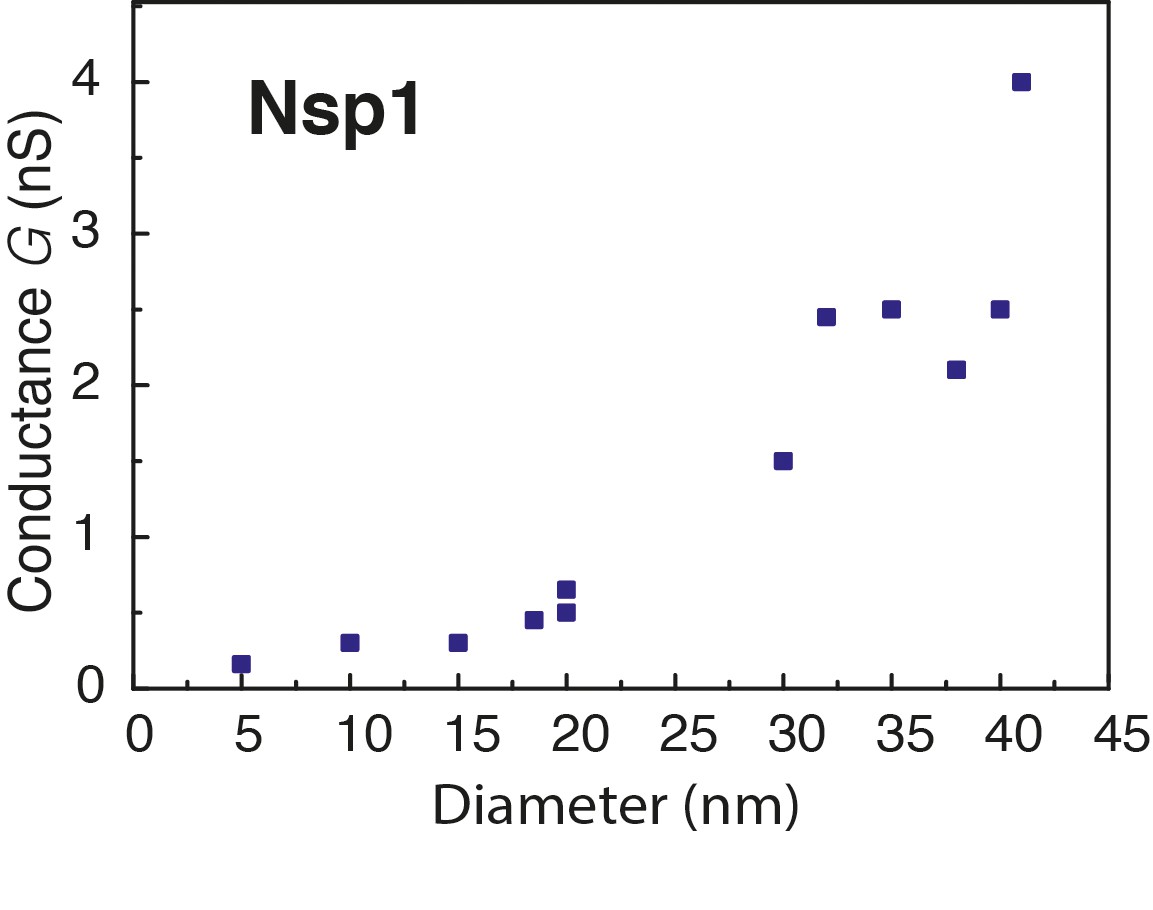
Conductance as a function of pore diameter below 40 nm.
The conductance change is plotted versus the diameter of Nsp1 coated pores. The measured conductance of the NPC falls in the range of 0.3–2 nS for monovalent salt (Bustamante et al., 1995; Tonini et al., 1999), which is comparable to the values measured here (0.2–4 nS) for pore sizes in the range from 5 to 40 nm.
Figure 3—figure supplement 2

The conductivity in the pore region () and access region () for the simulated nanopores lined with Nsp1 (blue circles; panel A) and Nsp1-S (green circles; panel B) plotted as a function of pore diameter.
For the density distribution is integrated over the pore region |z| < 10 nm according to Equation 3 in the main text. For the conductivity in the access region the density distribution in the range 10 nm < |z| < 40 nm is considered, as the l/d ratio for the nanopore is comparable to 1.5 (Hyun et al., 2012). These serve as input to the conductance relation G(d) in Equation 2 of the main text. The solid lines are sigmoidal fits to the data. The sigmoid function is of the form . The R2 values of and are 0.85, 0.96 in Nsp1 and 0.98, 0.99 for Nsp1-S.
Figure 3—figure supplement 3

The conductivity and conductance for the simulated nanopores lined with Nup98 as a function of pore diameter.
(A) Based on the radial density distributions of the Nup98 pore (Figure 2—figure supplement 2, bottom row), we calculated the pore conductivities and (black circles) for each diameter using Equation 3 of the main text, with =85 mg/ml as fitted to the Nsp1 and Nsp1-S data. For the access region the density distribution in the range 10 nm < |z| < 40 nm is considered, as the l/d ratio for the nanopore is comparable to 1.5 (Hyun et al., 2012). The solid lines are sigmoidal fits to the data. The sigmoid function is of the form . The R2 values of and are both equal to 0.99. (B) The conductance G of the Nup98-coated pores (black) and bare pores (red) plotted as a function of the pore diameter. The open squares represent experimental data (Kowalczyk et al., 2011b), while the closed circles represent the results of the MD simulations. The solid lines are predictions of the conductance relation that describes the conductance G as a function of diameter d for the bare pore (red, see Equation 1 in the main text with l = 20 nm), resulting in a fitted value of = 2.13 ± 0.05 nS/nm (with an R2 value of 0.93). The conductivity results from panel A ( and are taken as input for the conductance relation of Equation 2 resulting in the solid black line for the Nup98-coated pores in panel B, showing excellent agreement with the experiments (R2 = 0.93).
Figure 3—figure supplement 4
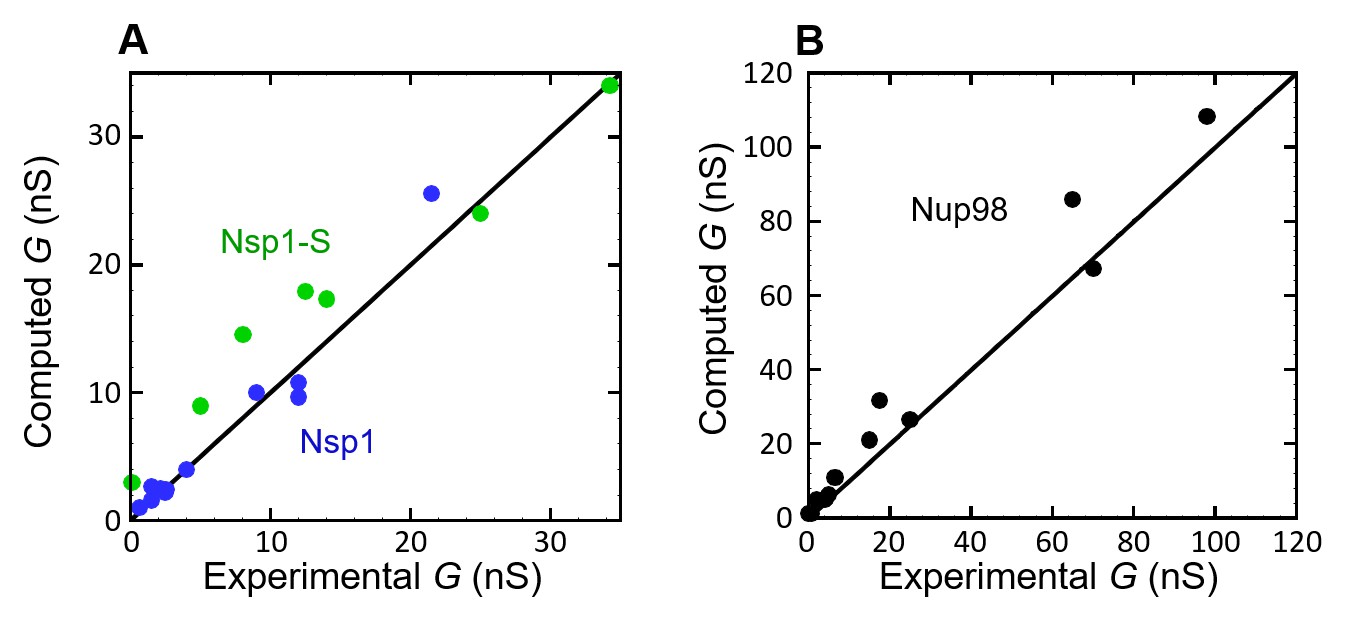
Computed conductance vs the experimentally measured conductance, for (A) Nsp1 (blue circles) and Nsp1-S (green circles), and (B) Nup98 (black circles).
The solid lines have a slope of 1, representing a perfect match between experiment and model.
Figure 4
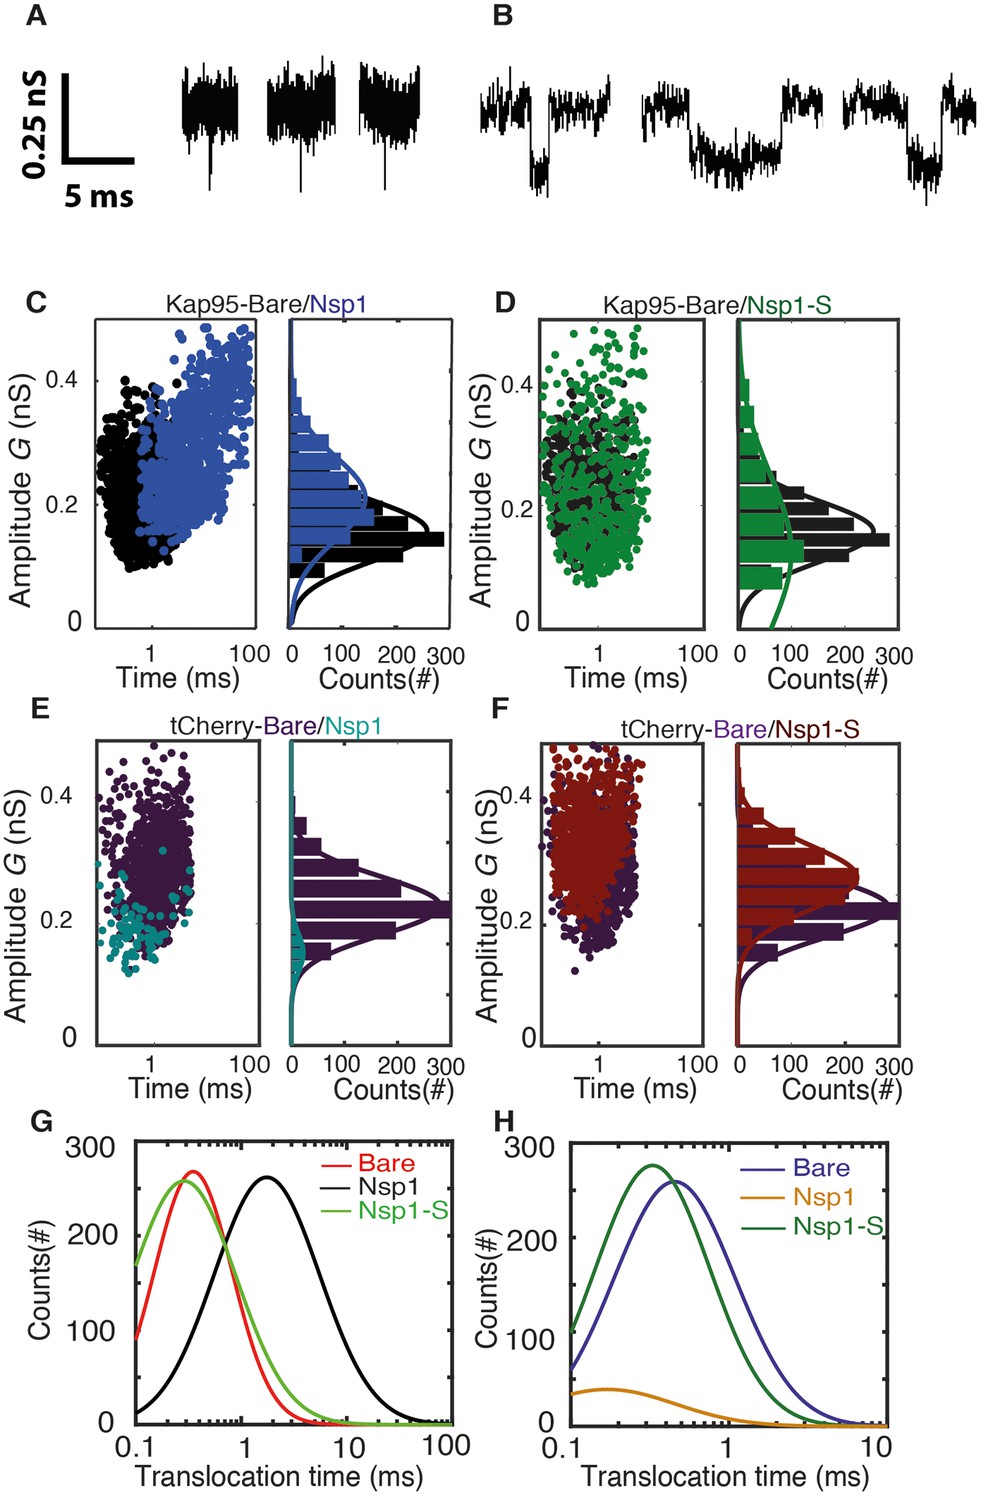
Transport and selectivity of the biomimetic NPCs.
(A) Typical translocation event of Kap95 through a bare pore. Each spike signals a single kap95 that translocate the pore. (B) Examples of translocation events through the Nsp1-coated pores. Note that the events in panel B show translocation times of a few ms, in contrast to the sub-ms events of panel A. (C) Scatter plot comparing the translocation events of Kap95 through a bare pore (black; N = 1193) and through Nsp1-coated pores (blue; N = 917). The larger dwell time through the Nsp1-coated pore indicates a much slower transport than that through the bare pore. In C-F, the panels on the right show histograms of the conductance blockade. (D) Scatter diagram for Kap95 translocating through mutant Nsp1-S pores (green) (N = 505). The conductance blockade histograms show that the average conductance blockade level after Nsp1-S modification is comparable to that of bare pores. (E) Scatter plot comparing the translocation events of tCherry through a bare pore (Purple; N = 1000) and Nsp1 (Cyan; N = 90) coated pores. Note the low number of translocations of tCherry through Nsp1-coated pores. (F) Scatter plot comparing the translocation events of tCherry through a bare pore (Purple; N = 1000) and Nsp1-S (Red; N = 1000)-coated pores. (G) Translocation time distribution in lognormal format for translocation of Kap95 through bare, Nsp1-coated, and Nsp1-S-coated pores. (H) Same as (G) but for tCherry translocations through bare pore, Nsp1-, and Nsp1-S coated pores. Kap95 and tCherry concentrations were 100 nM.
Figure 5 with 3 supplements
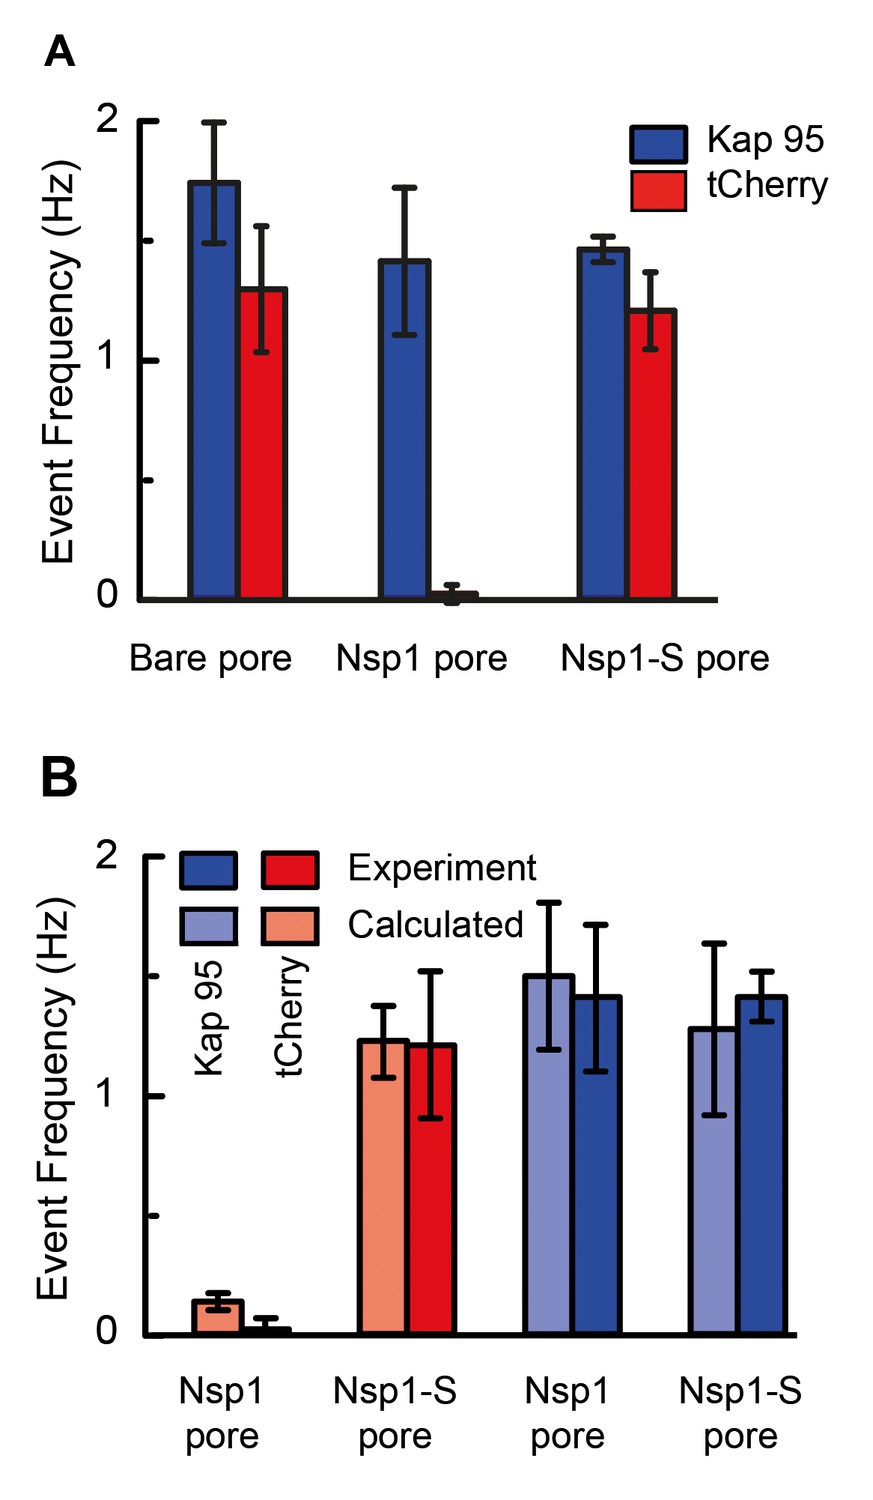
Selectivity for Nsp1, but not for Nps1-S biomimetic NPCs.
(A) Event frequencies for Kap95 (blue) and tCherry (red) through bare pores, Nsp1-coated pores , and Nsp1-S-coated pores. The data show an NPC-like selectivity for Nsp1-coated pores where the passage of tCherry is inhibited whereas Kap95 can pass well through the pore, with an event frequency that is similar to the case of bare pore. Note that the Nsp1-S mutant pores allow both Kap95 and tCherry to pass through with a similar rate. The pore diameter was in all cases 48 ± 2 nm. Kap95 and tCherry concentrations were 100 nM. (B) A comparison between experimental event rate and calculated event rate using Equation 4. The error bar in the calculated event rate is computed based on the error in the energy barrier for the respective particle and pore combination.
Figure 5—figure supplement 1
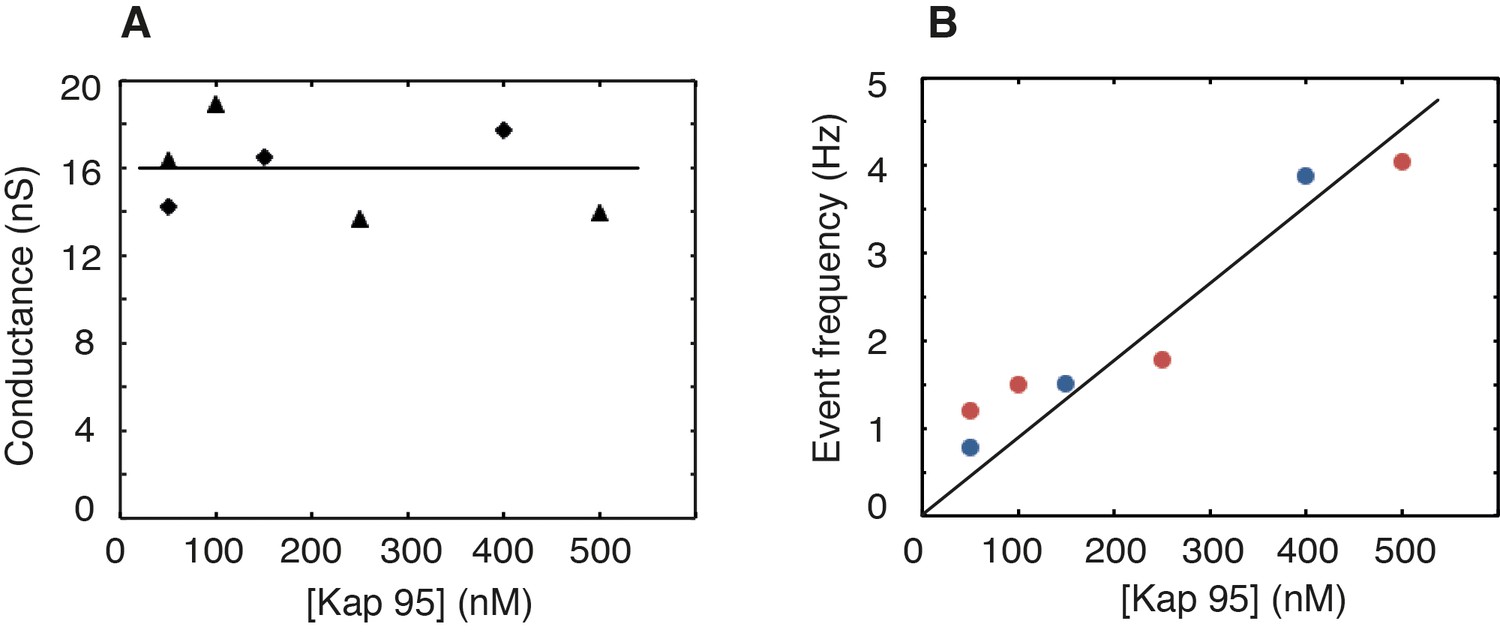
Stable baseline conductance and increase of the event rate with Kap95 concentration for an Nsp1-coated pore.
These experiments were carried out on Nsp1-coated pores with a varying Kap95 concentration in the buffer. (A) Baseline ionic conductance versus Kap95 concentration. Triangles and diamonds denote two independent measurements performed on two different pores. The pore diameter was 49 ± 1 nm. The solid line denotes the average conductance of 16 nS. Notably, these data show that the baseline conductance does not vary with increasing Kap95 concentration, in contrast to what would be expected if large numbers of Kap95 would accumulate within the pore (Lim et al., 2015; Kapinos et al., 2017). (B) Event frequency versus Kap95 concentration. Blue and red data markers denote two independent measurements performed on two different pores. The solid line denotes a linear fit (R2 = 0.89) to all data points. The event frequency measured for single Kap95 translocations through a Nsp1-coated pore exhibits a (trivial) linear increase of the event rate, as more Kap95 proteins traverse the pore for higher concentrations.
Figure 5—figure supplement 2
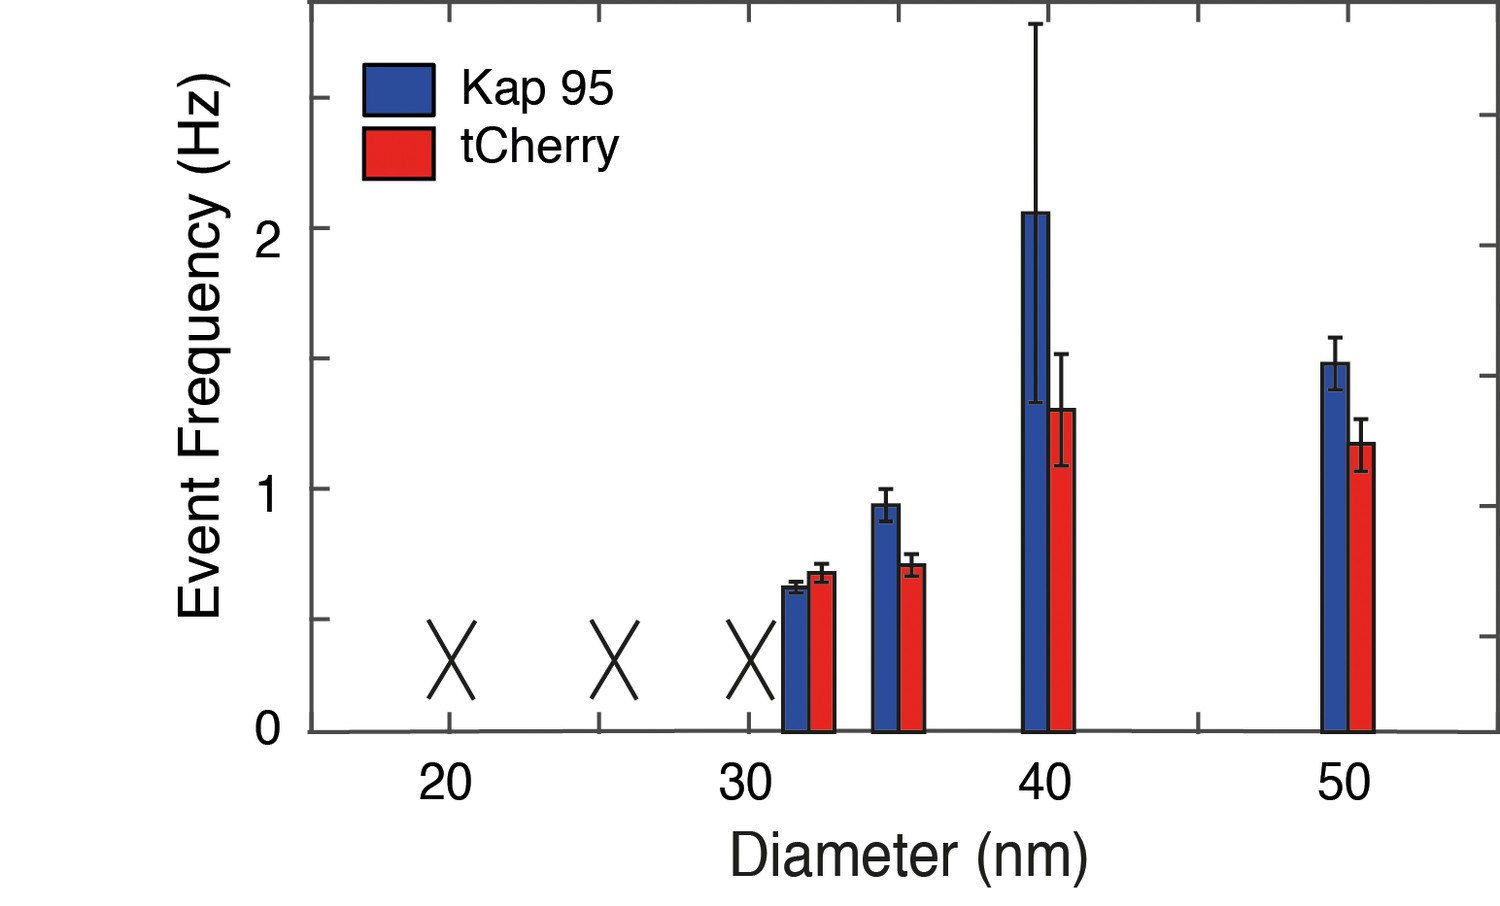
Event frequency versus diameter for Kap95 and tCherry through Nsp1-S coated nanopores.
The event frequencies are averaged over different pores (n = 3). The error bars indicate standard deviations. A black cross is shown when no translocation events could be measured (e.g. because the nanopore clogged upon addition of Kap95 or tCherry). No clear differences in selectivity are observed between the smaller and larger pores.
Figure 5—figure supplement 3

Experimental event rate versus the computed energy barrier ∆E, for tCherry and Kap95 in Nsp1 and Nsp1-S pores.
The data points are plotted as black circles and fitted using the Arrhenius relation (see Equation 4 in the main text). From the fitting we obtain = 16.4 Hz with an R2 value of 0.96.
Figure 6
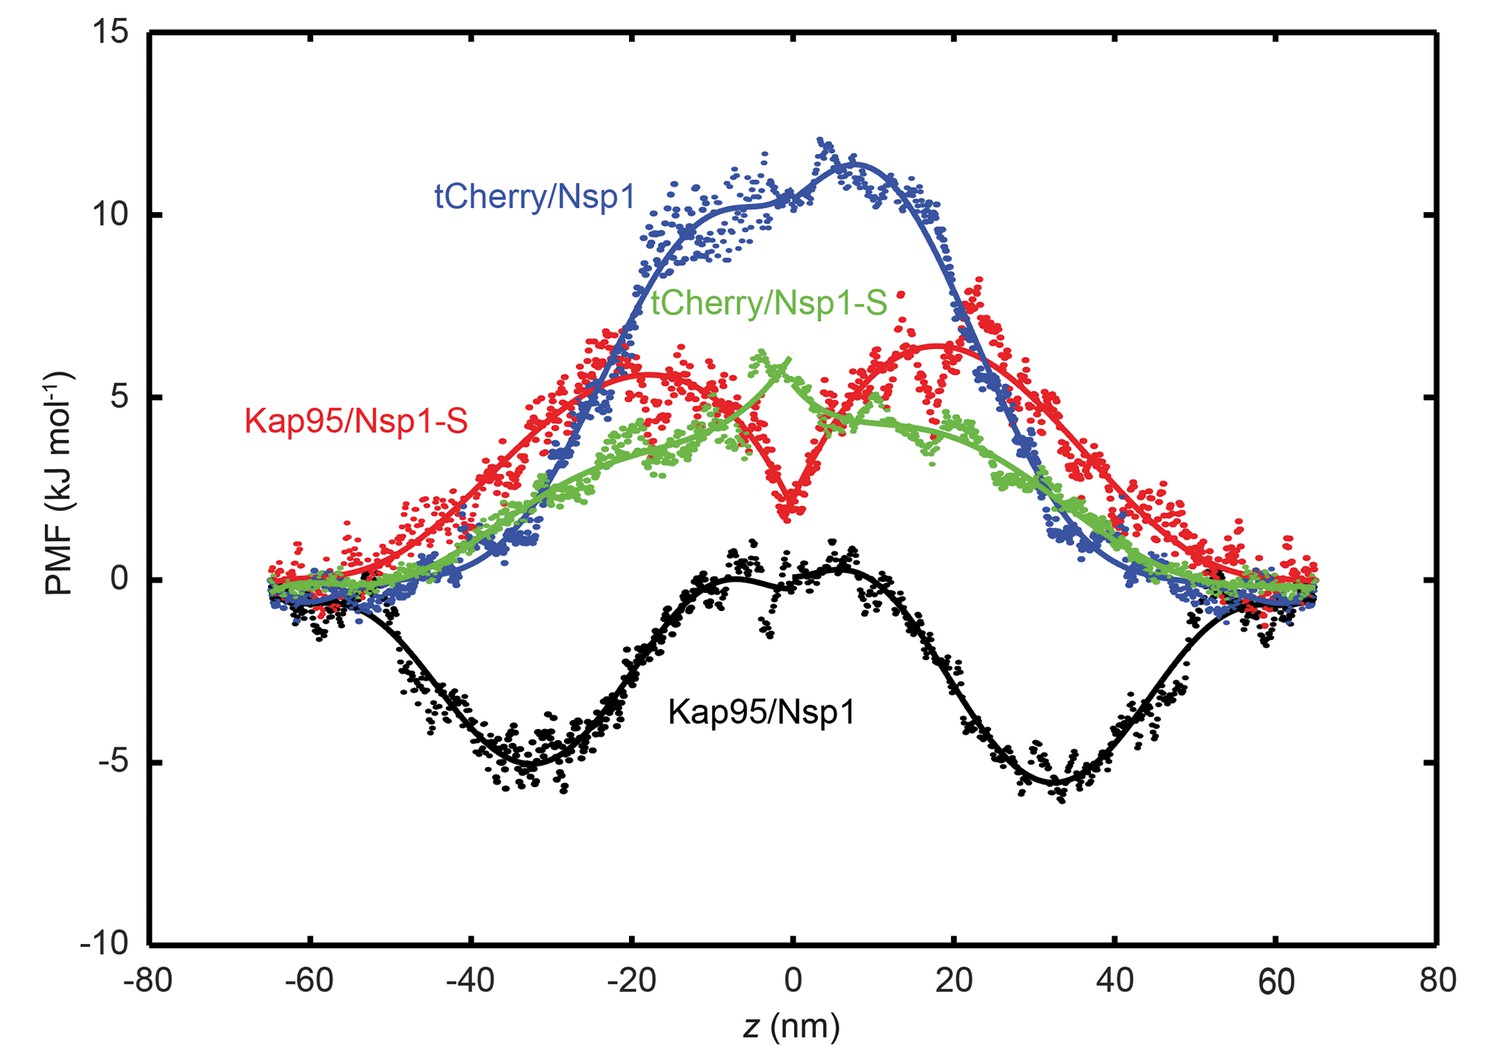
Potential of mean force (PMF) curves associated with transport of tCherry and Kap95 through Nsp1 and Nsp1-S coated pores.
PMF values for tCherry and Kap95 particles at different positions along the central axis (r = 0). Kap95 in the Nsp1 and in Nsp1-S pore is represented in black and red, respectively, and tCherry in Nsp1 and Nsp1-S is shown in blue and green, respectively. Solid lines represent polynomial fits of 6th order for z < 0 and z > 0. The data show that the energy barrier that tCherry needs to overcome to move across the Nsp1-lined pore is approximately 12 kJ/mol, while for Kap95, it is much lower, 6 kJ/mol. For the Nsp1-S pore however, the barriers are very similar for Kap95 and tCherry, viz., 6.5 kJ/mol and 6.4 kJ/mol, respectively.
Videos
Video 1
A short trajectory of a coarse-grained one-bead-per-amino-acid molecular dynamics simulation of a biomimetic nanopore with a diameter of 45 nm coated with Nsp1, corresponding to Figure 2C (top row) of the main manuscript.
Only half the simulation box is shown for better visibility. The movie is prepared with the Visual Molecular Dynamics (VMD) software.
Video 2
A short trajectory of a coarse-grained one-bead-per-amino-acid molecular dynamics simulation of a biomimetic nanopore with a diameter of 45 nm coated with the mutant Nsp1-S, corresponding to Figure 2C (bottom row) of the main manuscript.
Only half the simulation box is shown for better visibility The movie is prepared with the Visual Molecular Dynamics (VMD) software.
Video 3
A short trajectory of a coarse-grained one-bead-per-amino-acid molecular dynamics simulation of an isolated Nsp1.
The cohesive head group at the N-terminus is located at the right. The movie is prepared with the Visual Molecular Dynamics (VMD) software.
Video 4
A short trajectory of a coarse-grained one-bead-per-amino-acid molecular dynamics simulation of an isolated mutant Nsp1-S.
The C-terminus is located at the top. The movie is prepared with the Visual Molecular Dynamics (VMD) software.
Additional files
-
Supplementary file 1
Measured hydrodynamic diameters (nm) of proteins from dynamic light scattering (DLS) experiment.
- https://doi.org/10.7554/eLife.31510.028
-
Supplementary file 2
Molecular characteristics of Nsp1 (see Video 3), Nsp1-S (see Video 4) and Nup98 and the computed Stokes radii (in isolation).
- https://doi.org/10.7554/eLife.31510.029
-
Transparent reporting form
- https://doi.org/10.7554/eLife.31510.030
Download links
A two-part list of links to download the article, or parts of the article, in various formats.
Downloads (link to download the article as PDF)
Open citations (links to open the citations from this article in various online reference manager services)
Cite this article (links to download the citations from this article in formats compatible with various reference manager tools)
Spatial structure of disordered proteins dictates conductance and selectivity in nuclear pore complex mimics
eLife 7:e31510.
https://doi.org/10.7554/eLife.31510


