MukB ATPases are regulated independently by the N- and C-terminal domains of MukF kleisin
- University of Oxford, United Kingdom
Figures
Figure 1
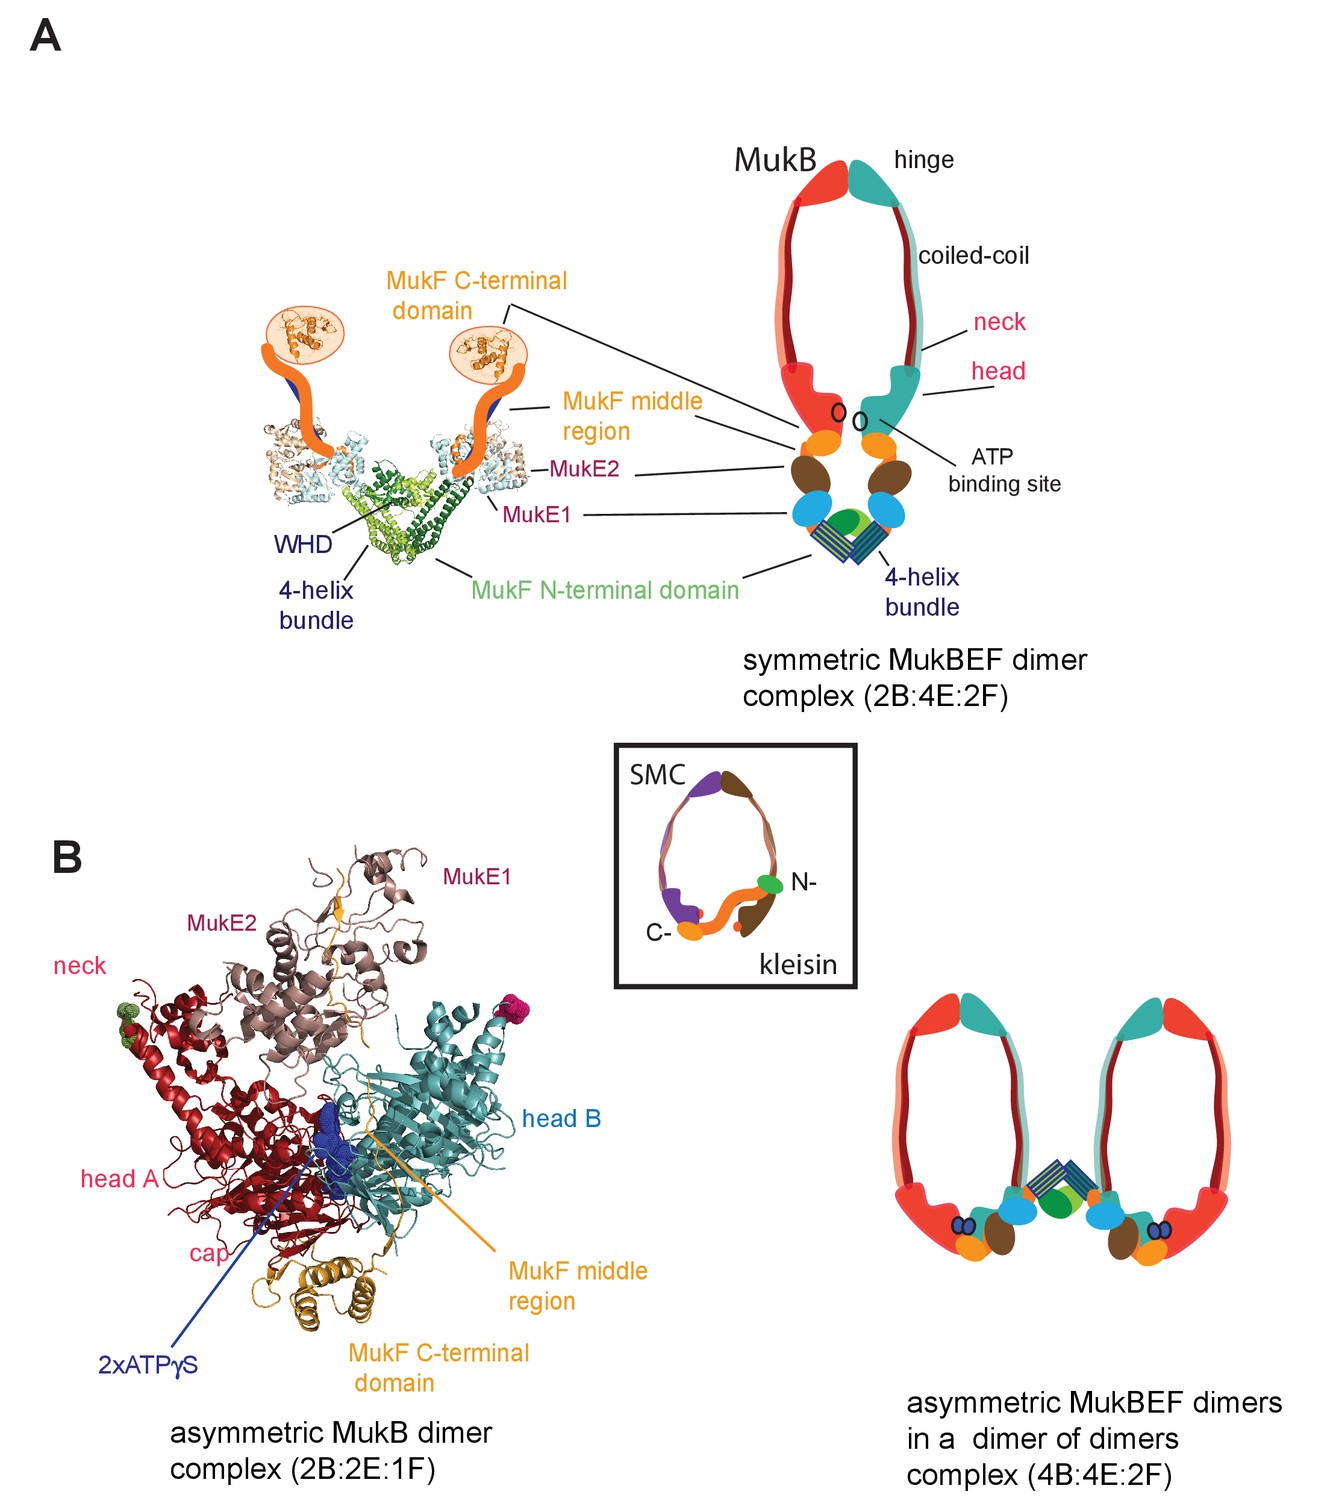
MukBEF complexes.
(A) Left panel; Schematic of a MukF dimer based on the structure of the MukF N-terminal region bound by MukE (pdb, 3EUH; Woo et al., 2009) and the C-terminal domain (pdb 3EUK, Woo et al., 2009), with a cartoon of the intervening middle region. Right panel; cartoon of a ‘classical’ view of the proposed symmetric complex of MukBEF in the absence of ATP, with a molecular ratio of 2B:4E:2F. Inset centre; schematic of a typical SMC-kleisin tripartite ring. (B) Left panel; crystal structure of H.ducreyi hMukE-hMukF(M + C)-hMukBhdEQ-ATP-γS asymmetric complex (pdb 3EUK, Woo et al., 2009). The asymmetric complex is formed by ATP-γS-mediated head engagement; the molecular ratio is 2B:2E:1F; the residues at the coiled-coil exit points are indicated on each head by green and pink dots, respectively. Right panel; cartoon of MukBEF dimer of dimers with stoichiometry of 4B:4E:2F, inferred from in vivo stoichiometry measurements (Badrinarayanan et al., 2012a).
Figure 2
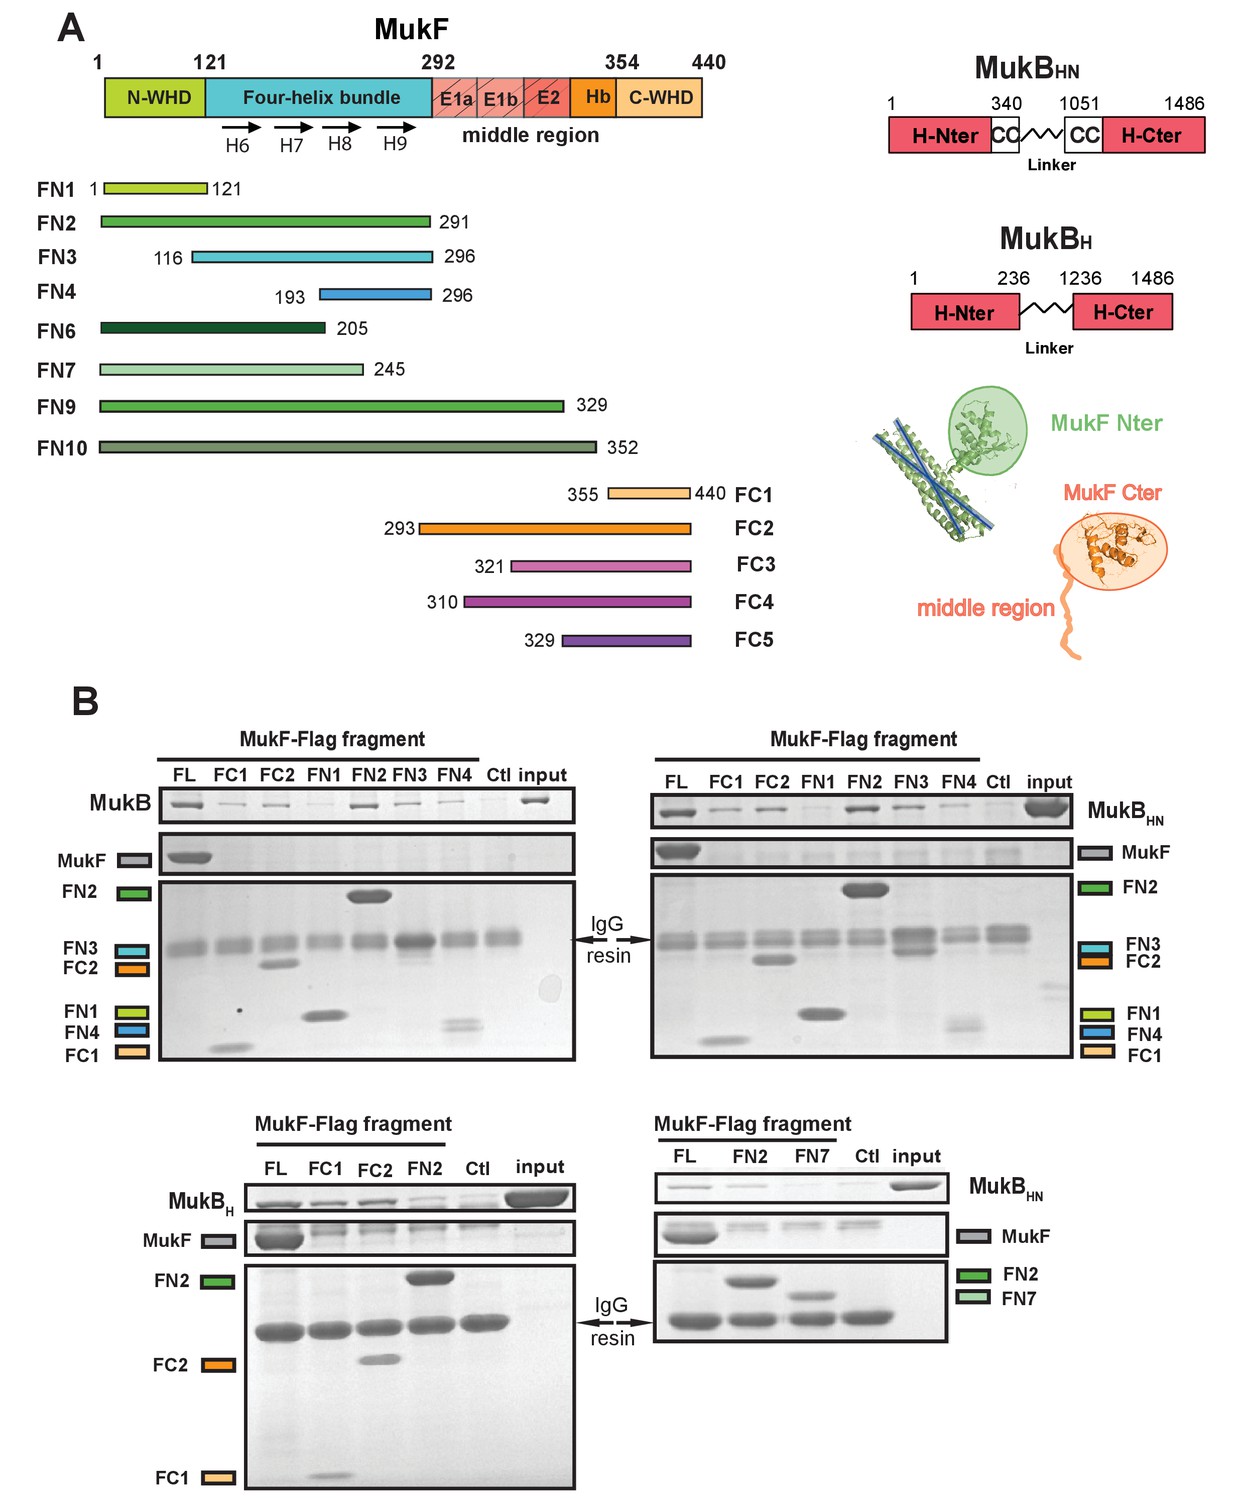
The MukF N-terminal domain interacts with MukB neck.
(A) Left panel; schematics of MukF truncations. The MukF N-terminal WHD is responsible for MukF dimerisation, while the C-terminal WHD interacts with the MukB head (Fennell-Fezzie et al., 2005; Woo et al., 2009) The middle region contains binding sites for the MukE dimer (E1, E2,) and the C-terminal part of the extended polypeptide that interacts with the MukB engaged head (Hb; Woo et al., 2009). Right panel; the MukB head variant (MukBH) carries N- and C-terminal regions that together constitute head domain, joined by 18 aa residue flexible linker, while the MukB ‘head and neck’ variant (MukBHN) in addition carries the predicted, head proximal coiled-coil segment (CC) with 104/185 amino acid residues adjacent to the MukB N- and C-terminal domains, respectively (Li et al., 2009; Weitzel et al., 2011). Cartoons of MukF N- and C-terminal domain structures are included. (B) Pull-down assay using MukF-FLAG tagged fragments as baits for the indicated MukB derivatives. The amounts of recovered MukB, MukBHN or MukBH are shown within the top boxed portion of the gel in each panel, alongside the MukB derivative input and Ctl., a control with no added bait. Note, that the reduced pull-downs with FN3 and FN4 as compared to FN2, are likely a consequence of reduced concentrations of these baits in extracts.
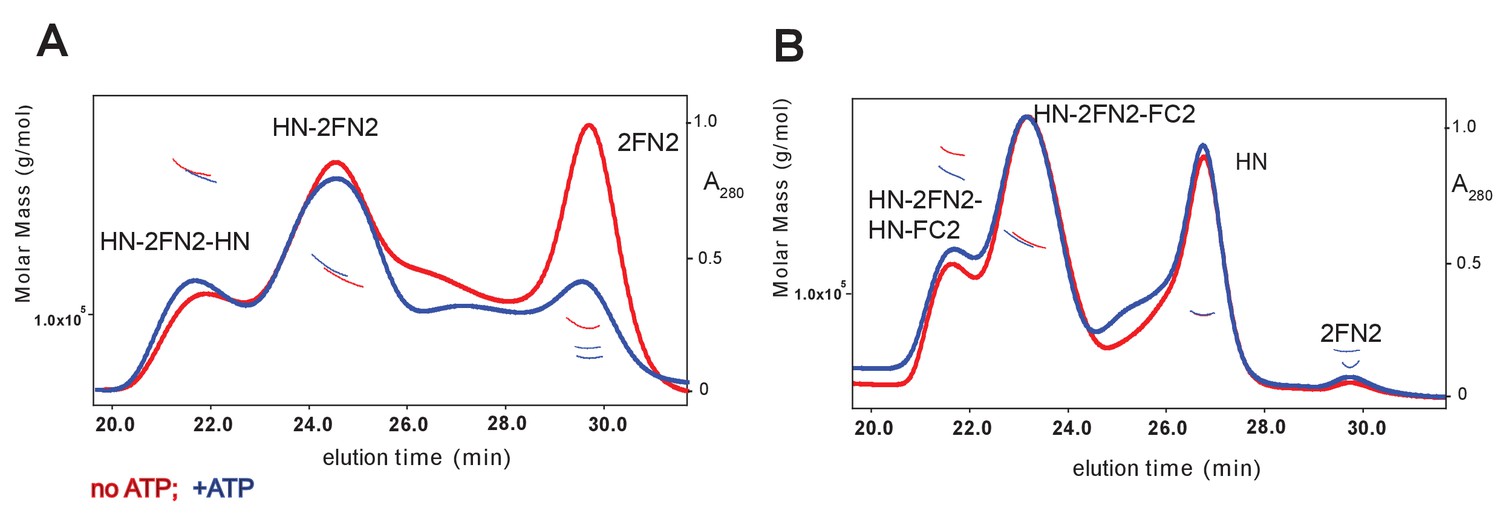
Figure 3 with 3 supplements
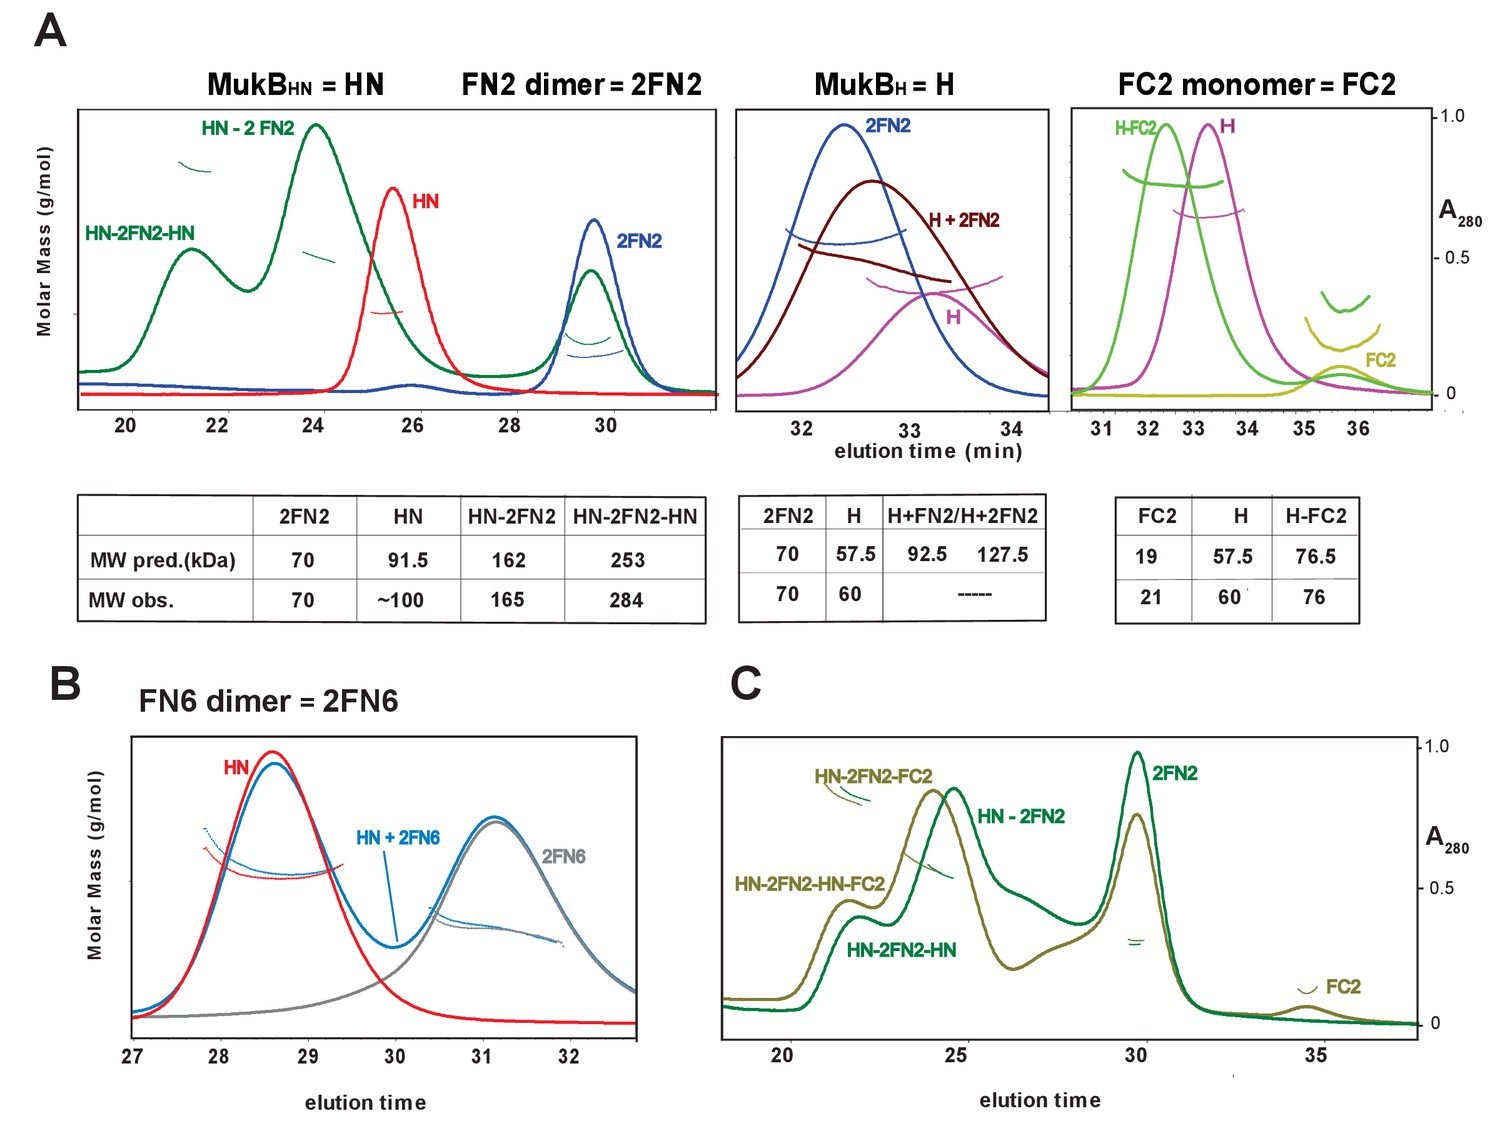
Complexes of MukF N- and C-terminal domains with MukB head variants.
Binding and stoichiometry of complexes was determined by SEC-MALS. (A) Left panel; MukBHN (red), 2FN2 (blue), and MukBHN + 2FN2 (green) at a 1:1.25 monomer:dimer molar ratio. Middle panel; MukBH (pink), 2FN2 (blue), and MukBH + 2FN2 (brown) at 1:0.25 m:d ratio. Right panel; MukBH (pink), FC2 (lime green), and MukBH + FC2 (green) at a 1:1 m:m ratio. (B) MukBHN (red), 2FN6 (grey), and MukBHN + 2FN6 (blue) at a 1:0.25 m:d ratio. (C) MukBHN + 2FN2 at a1:1 m:d ratio (dark green), and MukBHN + 2FN2 + FC2 at a 1:1:1 m:d:m ratio (olive green).
Figure 3—figure supplement 1
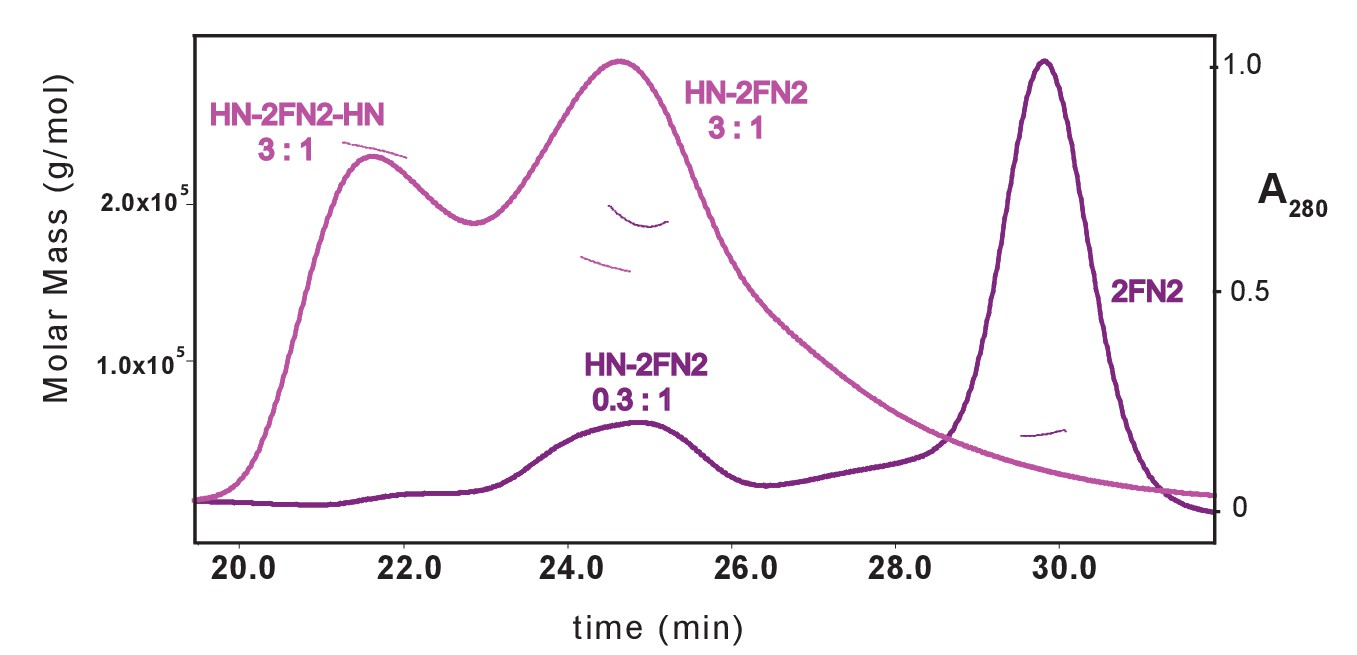
SEC-MALS analysis of MukBHN-2FN2 complexes.
The samples contained a mixture of MukBHN and FN2 at ratios of; 3:1 m:d, pink; and 0.3:1 m:d, purple.
Figure 3—figure supplement 2
SEC-MALS analysis of MukBHN–2FN2 and MukBHN–2FN2–FC2 complexes in the absence and presence of ATP (1 mM).
https://doi.org/10.7554/eLife.31522.007
Figure 3—figure supplement 3
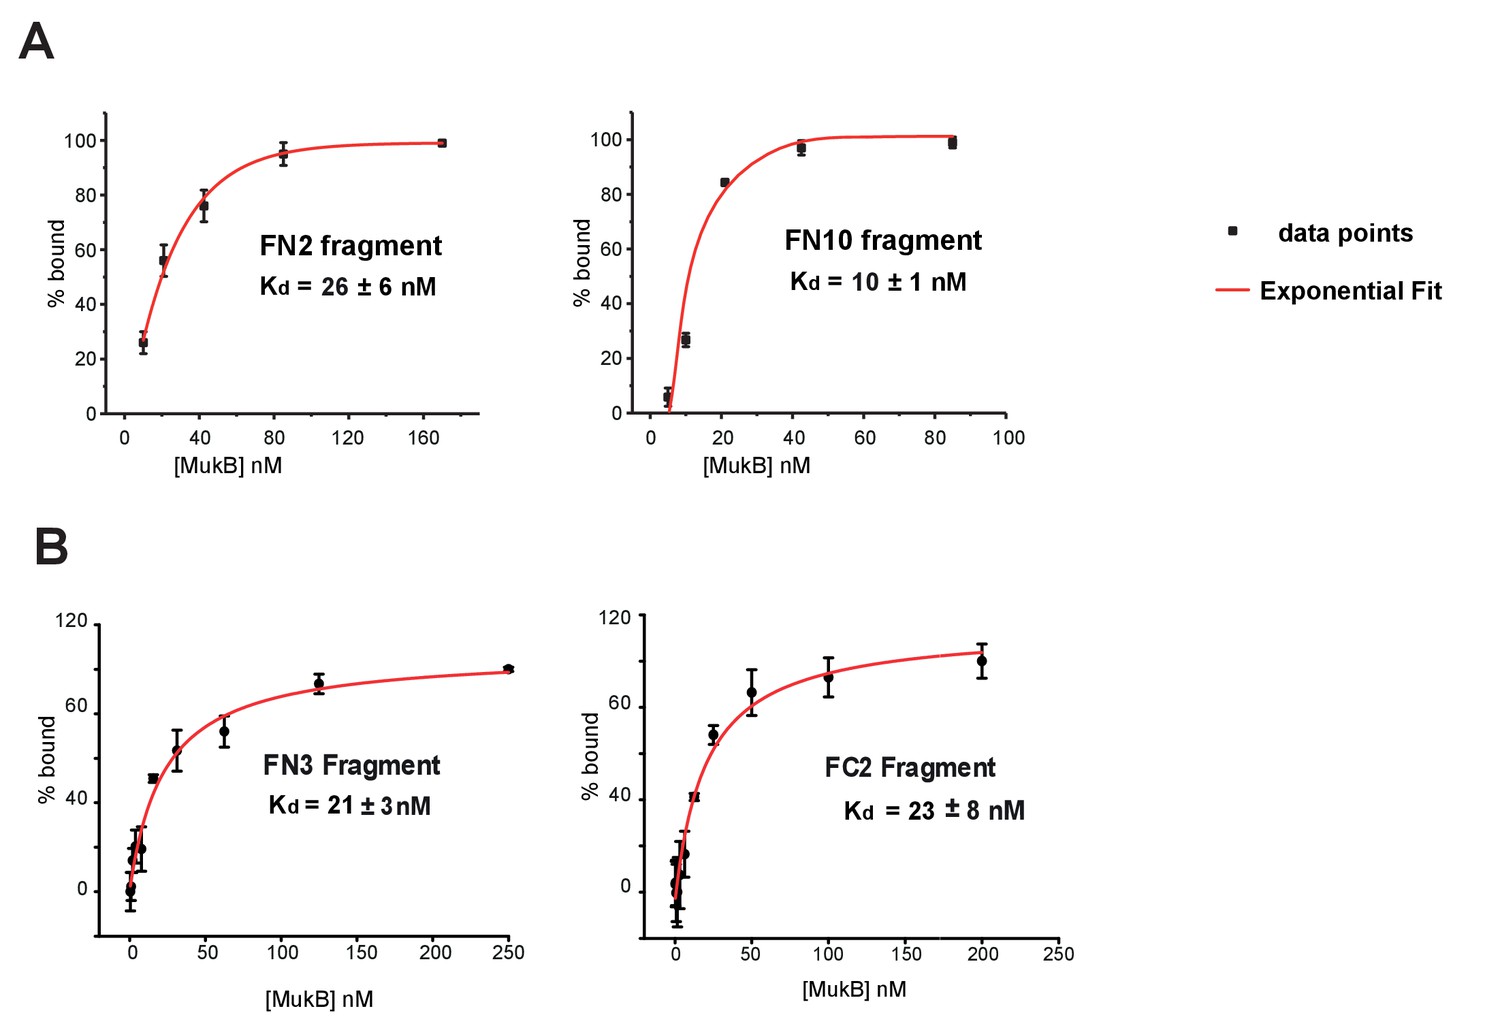
Binding affinities of MukF fragments to MukB.
(A) FCS measurements of FN2 and FN10 binding to MukB. Cy5 labelled fragments were at a fixed ~10 nM concentration; exponential fits to data points were used to extract Kds. Error bars represent S.D. of three independent experiments. (B) FPA measurements of FN3 and FC2 binding to MukB. Cy5 labelled FN3 and FC2 fragments were at concentrations 5 nM and 9 nM, respectively.
-
Figure 3—figure supplement 3—source data 1
Binding affinities of MukF fragments to MukB.
- https://doi.org/10.7554/eLife.31522.009
Figure 4 with 1 supplement
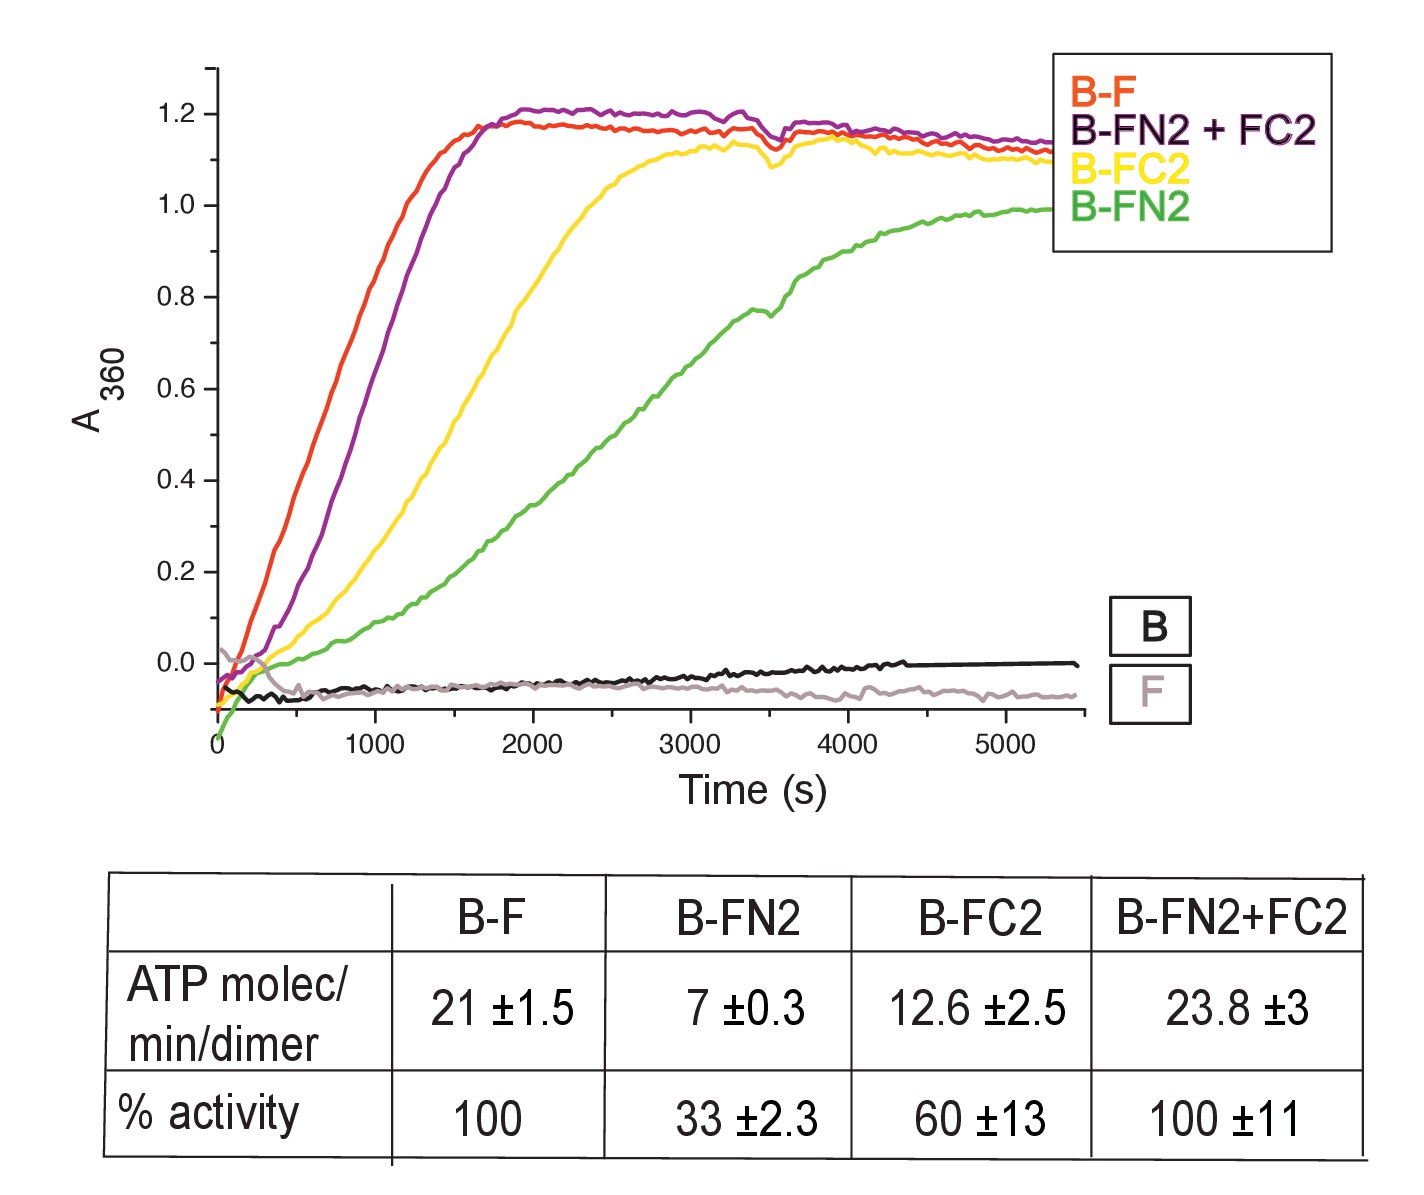
MukF N- and C-terminal domains stimulate MukB ATPase.
Concentrations in the assays were: MukB, 0.5 μM, MukF/FN2/FC2 1.25 μM, that is, at molar ratio of B:F, 0.5:1.25 monomer equivalent. The curves in the graph represent a single experiment; averages of initial rates ± SD from three experiments are tabulated beneath.
-
Figure 4—source data 1
MukF N- and C-terminal domains stimulate MukB ATPase.
- https://doi.org/10.7554/eLife.31522.013
Figure 4—figure supplement 1

MukF stimulated MukB ATPase.
(A, B, C) MukB ATPase activity at a range of concentrations of MukF/FN2/FC2. MukB was present at 0.5 μM, MukF/FN2/FC2 at following concentrations: 0.25 μM pink, 0.5 μM black, 1.25 μM blue, 2.5 μM red, and 5 μM green (in B and C 0.6 μM black). (D) MukF FN6 failed to stimulate MukB ATPase.
-
Figure 4—figure supplement 1—source data 1
MukF stimulated MukB ATPase.
- https://doi.org/10.7554/eLife.31522.012
Figure 5 with 6 supplements
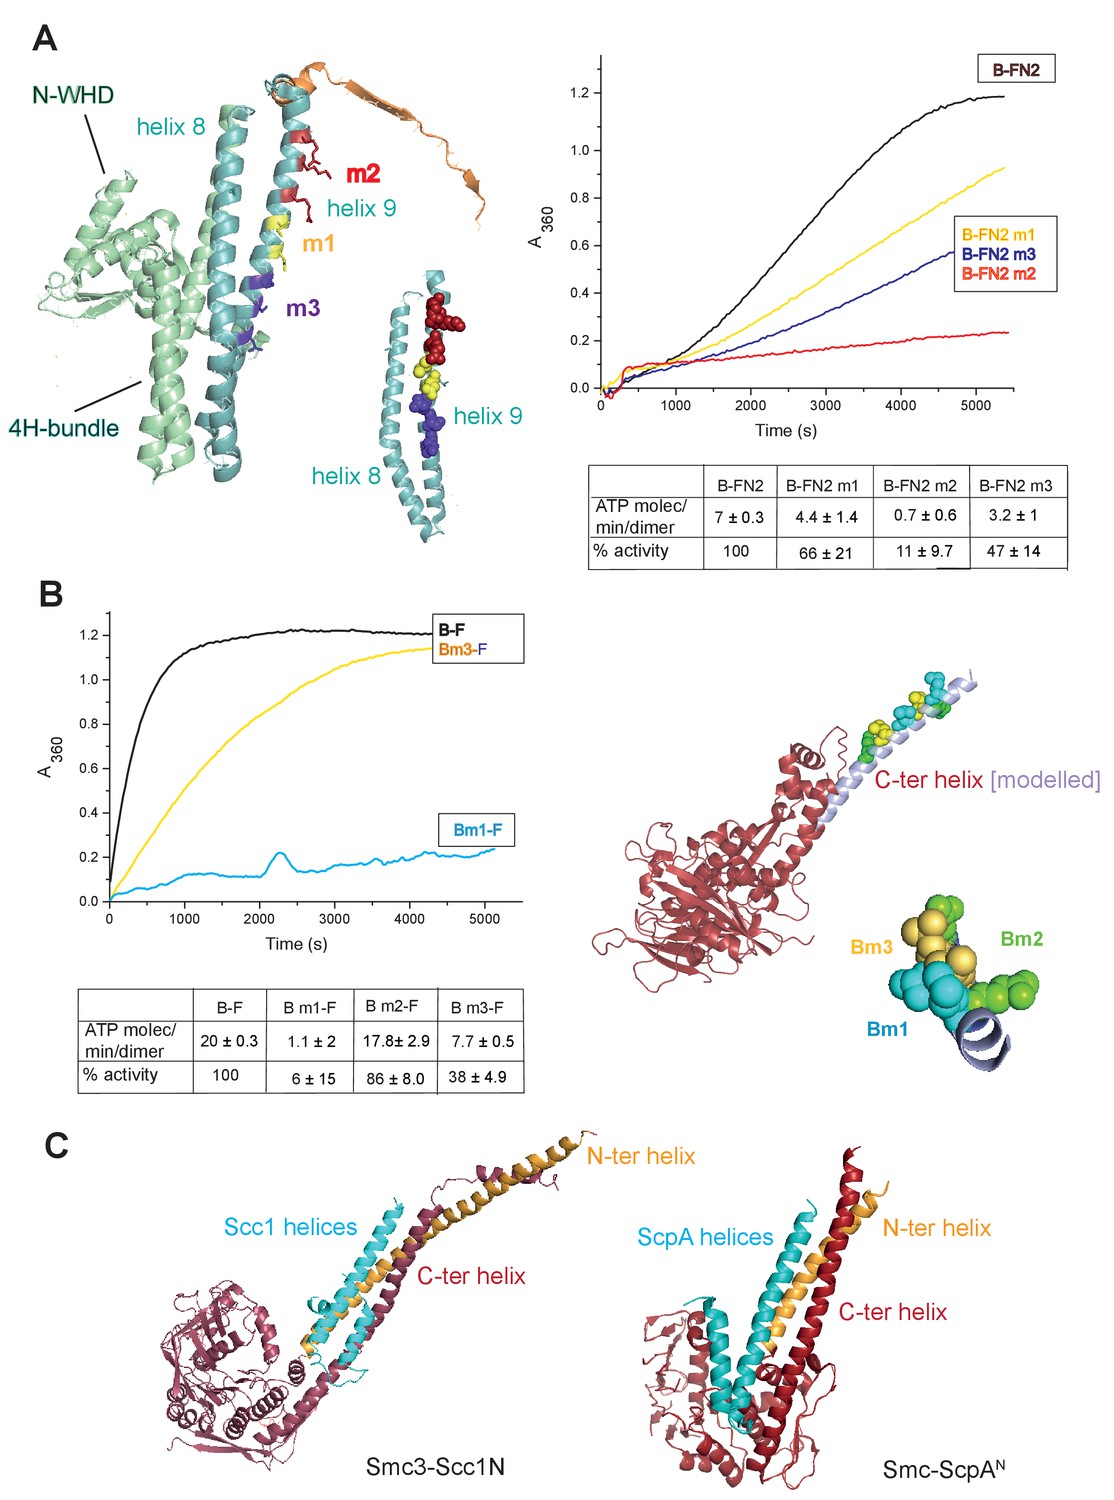
Interface between the MukB neck and the MukF four-helix bundle.
(A) Left panel; cartoon of MukF N-terminal domain fragment carrying the N-terminal dimerisation domain (green) and part of the middle region (orange). Helices 8 and 9 are indicated in cyan. The mutated amino acid residues in variants FN2m1, FN2m2 and FN2m3 are indicated in yellow, red and purple, respectively, (residue R279 was altered in both m1 and m2, but is shown only in m2); views of helices 8 and 9 from different angles are shown separately. Right panel; ATPase activities of the mutated variants; means of initial rate measurements from three experiments are tabulated below. (B) Left panel; ATPase activities in the presence of MukF, of MukB and MukB variants mutated at the neck, MukBm1, blue, and MukBm3, yellow. Averages of initial rates from three experiments are tabulated underneath. Right panel; monomer of the MukB head (pdb 3EUK, Woo et al., 2009); the helix that emerges from the C-terminal subdomain of the head (C-ter helix) and forms the head-adjacent segment of the coiled-coil has been extended by modelling (shown in lilac). Right; enlarged view of the C-ter neck helix from the top with mutated residues shown. (C) Interactions of kleisin N-terminal domains with SMC necks. Left panel; Smc3-Scc1N; Gligoris et al. (2014). Right panel; B. subtilis SMC-ScpAN; Bürmann et al. (2013). The coiled-coil neck consists of two helical regions protruding from the SMC N-terminal head subdomain (N-ter helix; yellow), and from the C-terminal head subdomain (C-ter helix; red). Kleisin helices are shown in cyan.
-
Figure 5—source data 1
Interface between the MukB neck and the MukF four-helix bundle.
- https://doi.org/10.7554/eLife.31522.023
Figure 5—figure supplement 1
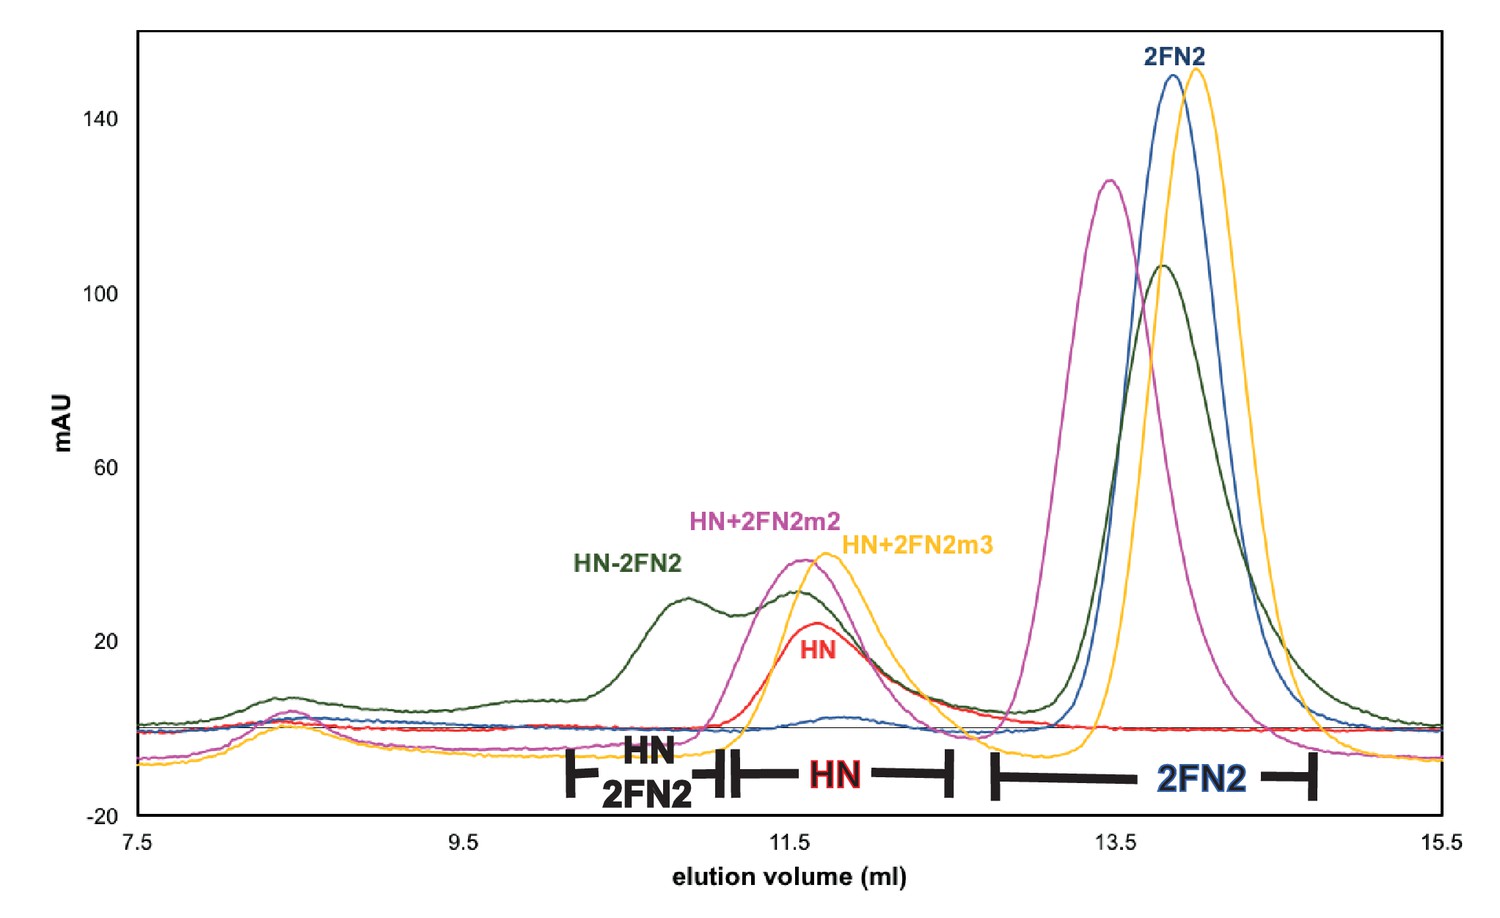
Mutated FN2 fragments were defective in binding to MukBHN.
Binding of FN2 (dark grey trace), FN2m2 (R279E K283A R286A, pink trace), and FN2m3 (D261K S265K Q268A, yellow trace) to MukBHN was analysed by SEC on Sephadex 200 column using MukBHN (red trace) and FN2 (navy blue trace) as reference. The protein concentrations were: MukBHN - 3.7 μM (monomer) and FN2 variant - 4.6 μM (dimer). The ranges of elution volumes for HN-2FN2, HN and 2FN2 in various SEC runs are indicated below the traces.
Figure 5—figure supplement 2
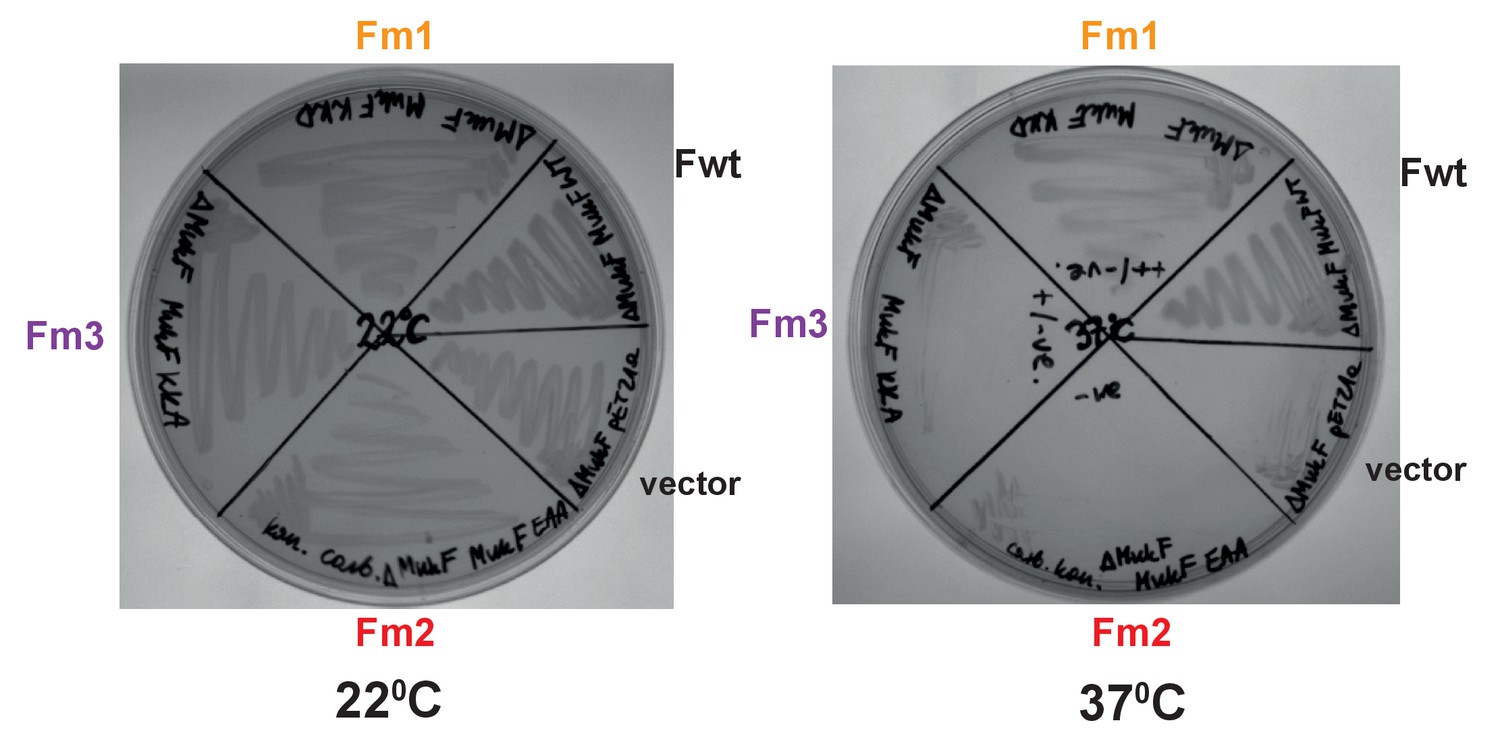
Functional analysis of mutated MukF helix9 variants.
in vivo complementation in strain lacking chromosomal mukF gene by variants expressed from pET21 was assessed in the absence of IPTG (constitutive leaky expression). Growth material from colonies of each variant and MukF was streaked on LB and incubated at permissive, 22°C, and non-permissive, 37°C temperature and compared to negative control, empty vector.
Figure 5—figure supplement 3

Stimulation of the MukB neck variants, MukBm1 and MukBm3, ATPase by MukF, FN2 and FC2.
ATPase activity was measured at concentrations of MukB variant, 0.5 μM; MukF/FN2/FC2, 1.25 μM. The traces represent a single experiment.
-
Figure 5—figure supplement 3—source data 1
Stimulation of the MukB neck variants, MukBm1 and MukBm3, ATPase by MukF, FN2 and FC2.
- https://doi.org/10.7554/eLife.31522.018
Figure 5—figure supplement 4
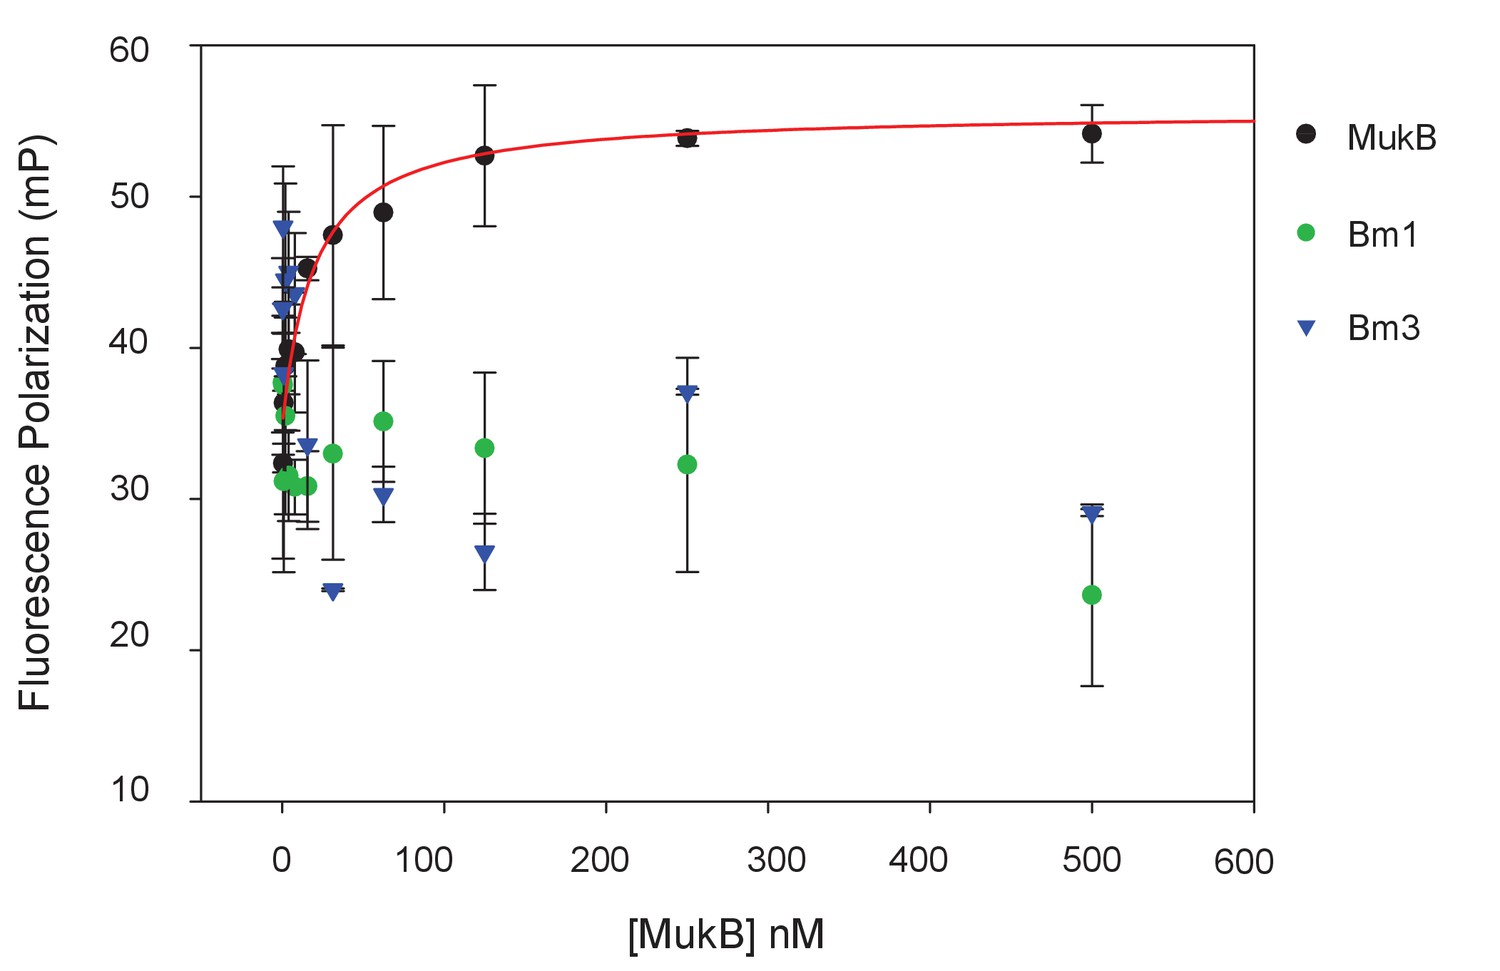
MukBm1 and MukBm3 fail to bind MukF N-terminal fragment.
Binding of Cy5-labelled FN3 (at concentration of 5 nM) was assessed by FPA.
-
Figure 5—figure supplement 4—source data 1
MukBm1 and MukBm3 fail to bind MukF N-terminal fragment.
- https://doi.org/10.7554/eLife.31522.020
Figure 5—figure supplement 5
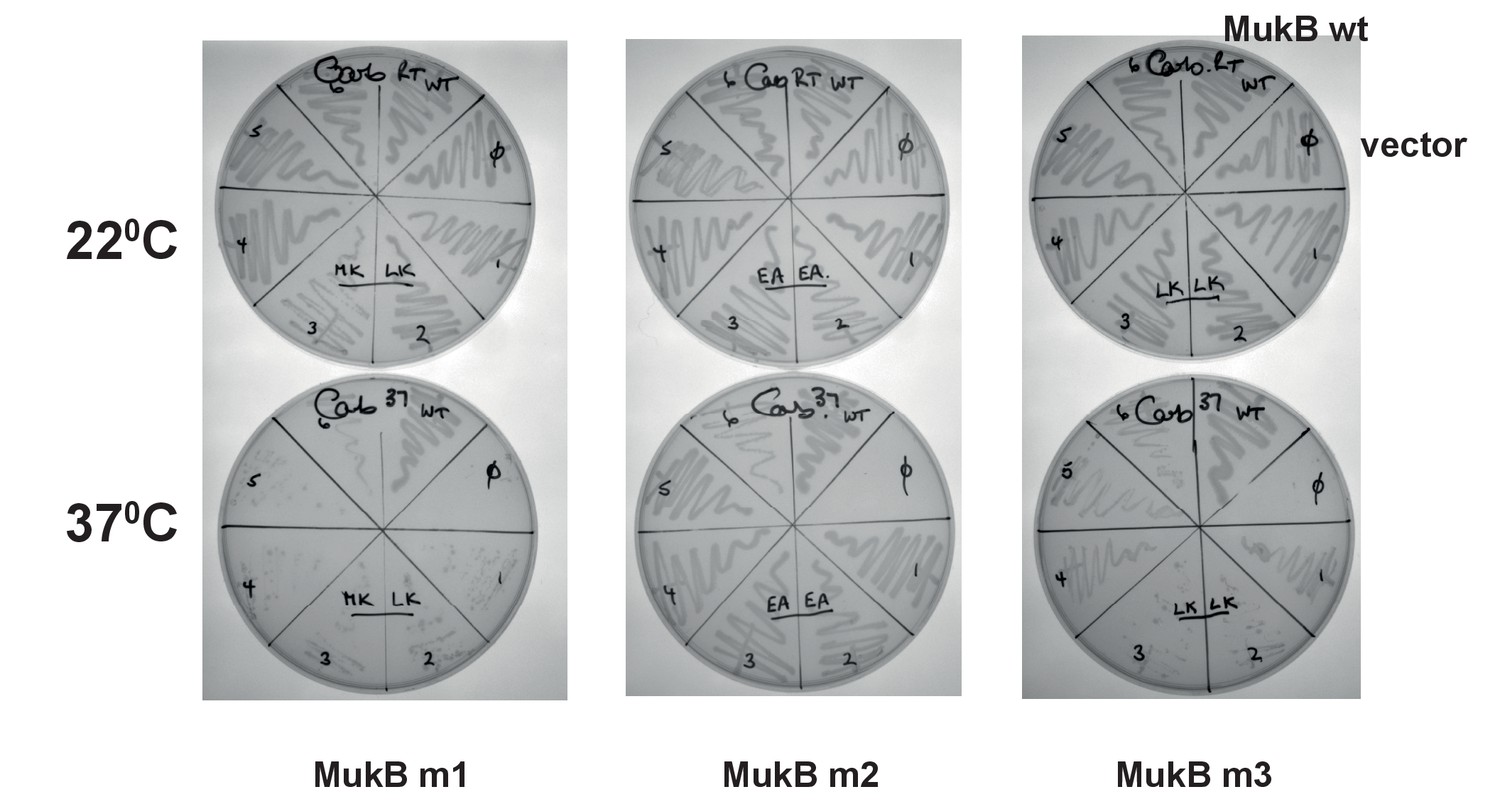
Functional analysis of mutated MukB neck variants.
in vivo complementation in cells lacking chromosomal mukB gene by variants expressed from pET21 plasmid. Growth of material streaked from 6 colonies of each variant was compared to growth of cells carrying WT MukB construct at permissive, 22°C, and non-permissive, 37°C; ϕ - a negative control, empty vector.
Figure 5—figure supplement 6
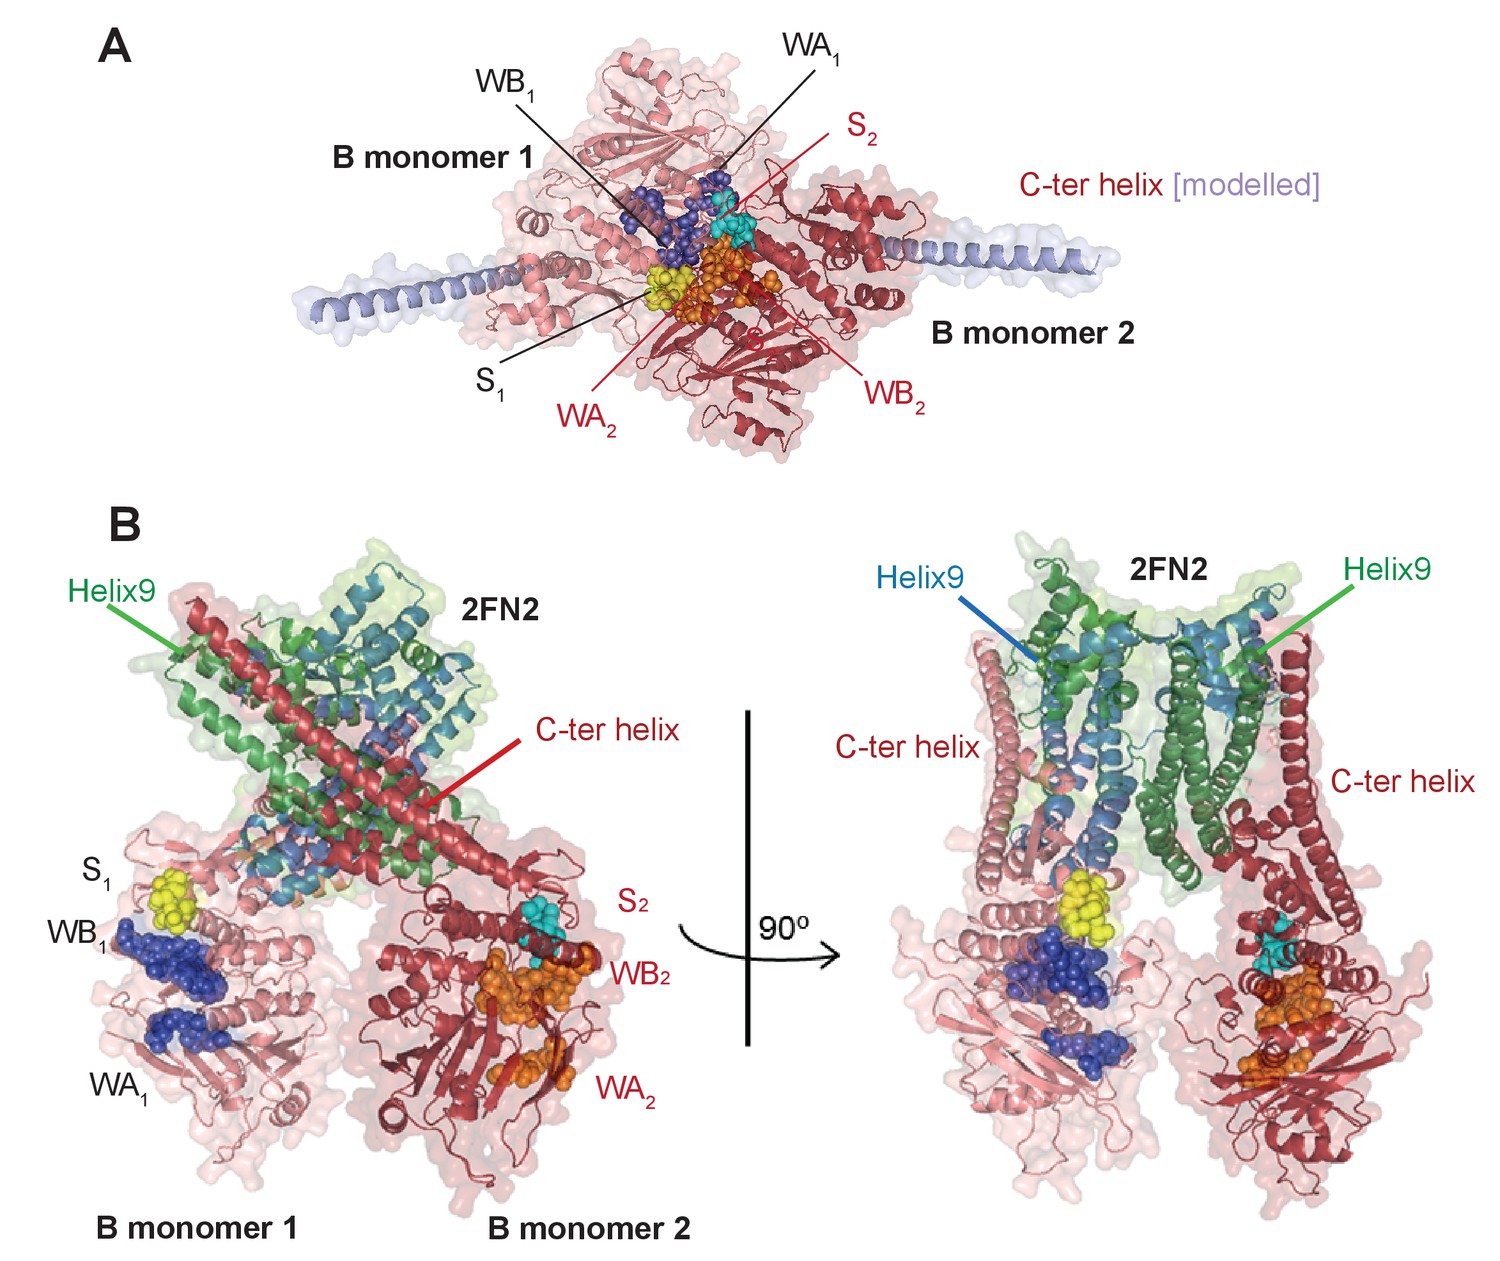
Model of the complex made by FN2 dimer binding two monomers of MukBHN.
(A) Pymol cartoon of MukBHN complex based on the asymmetric complex structure from Woo et al. (2009), as shown in Figure 1B, but viewed from the top. ‘B monomer 1’, is coloured salmon pink, ‘B monomer 2’, intense red. The residues that make the motifs of ATPase catalytic binding sites are shown as spheres and indicated as follows: in monomer 1, Walker A and Walker B are coloured blue and signature loop in yellow; while in monomer 2, Walker A and Walker B are orange and the signature loop is in cyan; the modelled C-ter helices of the necks are shown in lilac. In this conformation, two assembled active sites, WA1 + WB1 + S2 and WA2 + WB2 + S1, bind two nucleotide molecules (not shown here). (B) A model of the MukBHN-2FN2-MukBHN complex inferred from the studies presented here shown in two views; the model assumes that FN2 dimer retains the conformation as seen in MukFE complex in the absence of MukB (Woo et al., 2009). Interactions between the two independently bound MukBHN necks and the helices of four-helix bundle of MukF N-terminal domain impose a conformation, in which the heads are turned around with respect to one another separating the catalytic active sites motifs.
Figure 6 with 1 supplement
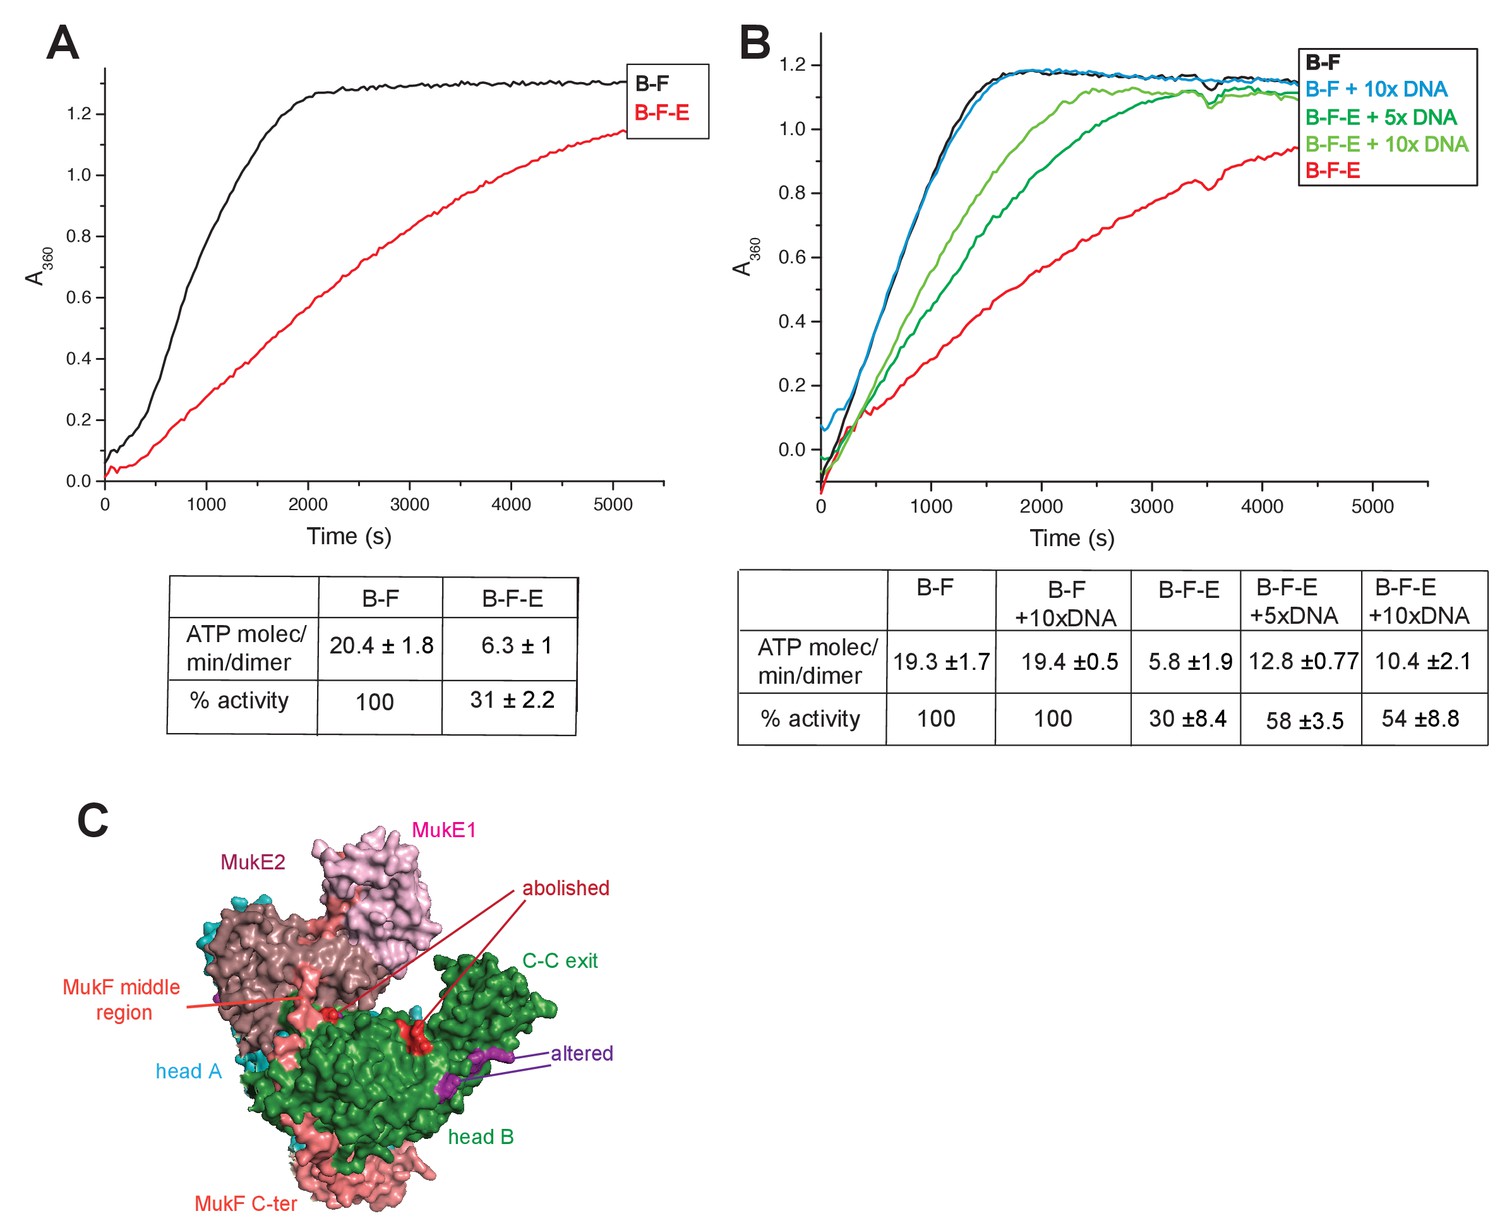
Regulation of MukB ATPase.
(A) MukE inhibits MukBF ATPase. Concentrations: MukB, 0.5 μM, MukF 1.25 μM, and MukE 5.0 μM. (B) DNA alleviates MukE-mediated inhibition. ATPase was measured in the presence/absence of 53 bp linear ds DNA fragment at 5x or 10x molar excess over MukB. The average values of the initial rates ± SD from three experiments are tabulated beneath the graphs. (C) Surface representation of the MukBEF asymmetric complex with amino acids, whose substitution abolished (red) or altered interactions with DNA (Woo et al., 2009).
-
Figure 6—source data 1
Regulation of MukBF ATPase.
- https://doi.org/10.7554/eLife.31522.027
Figure 6—figure supplement 1

Inhibition of MukBF ATPase by MukE.
(A) ATPase activity was measured at constant concentrations of MukB, 0.5 μM and MukF 1.25 μM and a range of concentrations of MukE from 0.25 μM - 5 μM. (B) Inhibition of MukBF ATPase by MukE was dependent on the concentration of MukF. Concentrations of MukB and MukE were constant with MukB, 0.5 μM, MukE 2.5 μM while concentration of MukF ranged between 0.25 μM and 5 μM.
-
Figure 6—figure supplement 1—source data 1
Inhibition of MukBF ATPase by MukE.
- https://doi.org/10.7554/eLife.31522.026
Figure 7 with 1 supplement
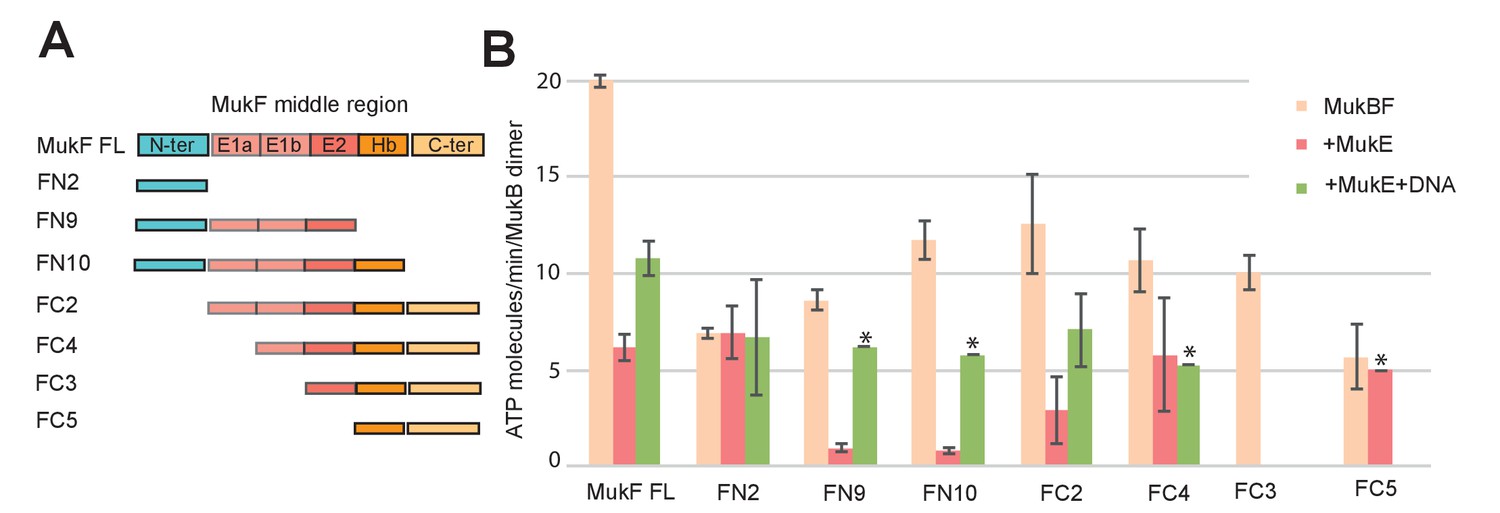
Influence of the MukF middle region on the modulation of MukB ATPase by MukE and DNA.
(A) One monomer of a MukE dimer binds helical region E1a and part of the acidic linker E1b, while the second MukE monomer binds E2. Hence, MukE binds FC2, containing the entire middle region, but not FN2, which lacks the middle region (Figure 7—figure supplement 1). The C-terminal part of the MukF middle region forms an extended polypeptide that binds the MukB head in the asymmetric complex (Hb; Woo et al., 2009). (B) Stimulation of MukB ATPase by MukF variants in the presence and absence of MukE and DNA (53nt ds fragment at 10-fold molar excess over MukB). The bars show means of the initial rates ± SD from three independent experiments.
-
Figure 7—source data 1
Influence of the MukF middle region on the modulation of MukB ATPase by MukE and DNA.
- https://doi.org/10.7554/eLife.31522.030
Figure 7—figure supplement 1
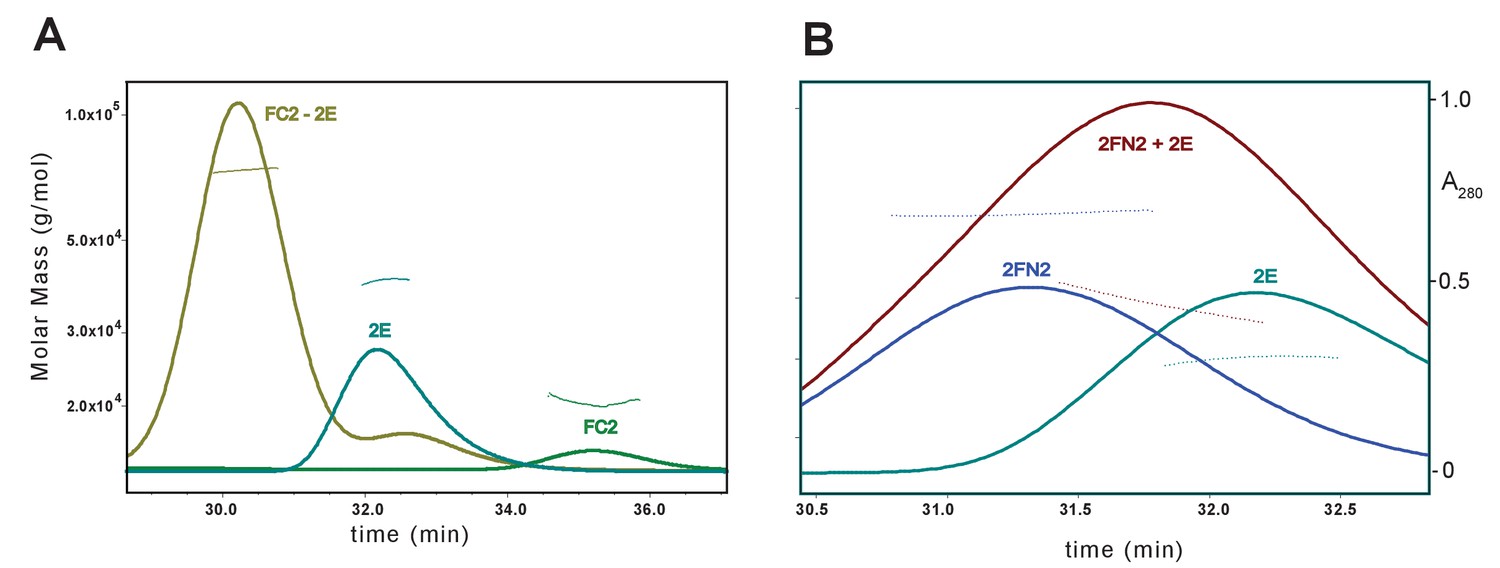
SEC-MALS analysis of MukE binding to FC2 and FN2.
The samples contained a mixture of (A) FC2 and MukE at molar ratio of 1:1, monomer to dimer, (B) FN2 and MukE at ratio 1:1.5 dimer:dimer.
Figure 8 with 2 supplements
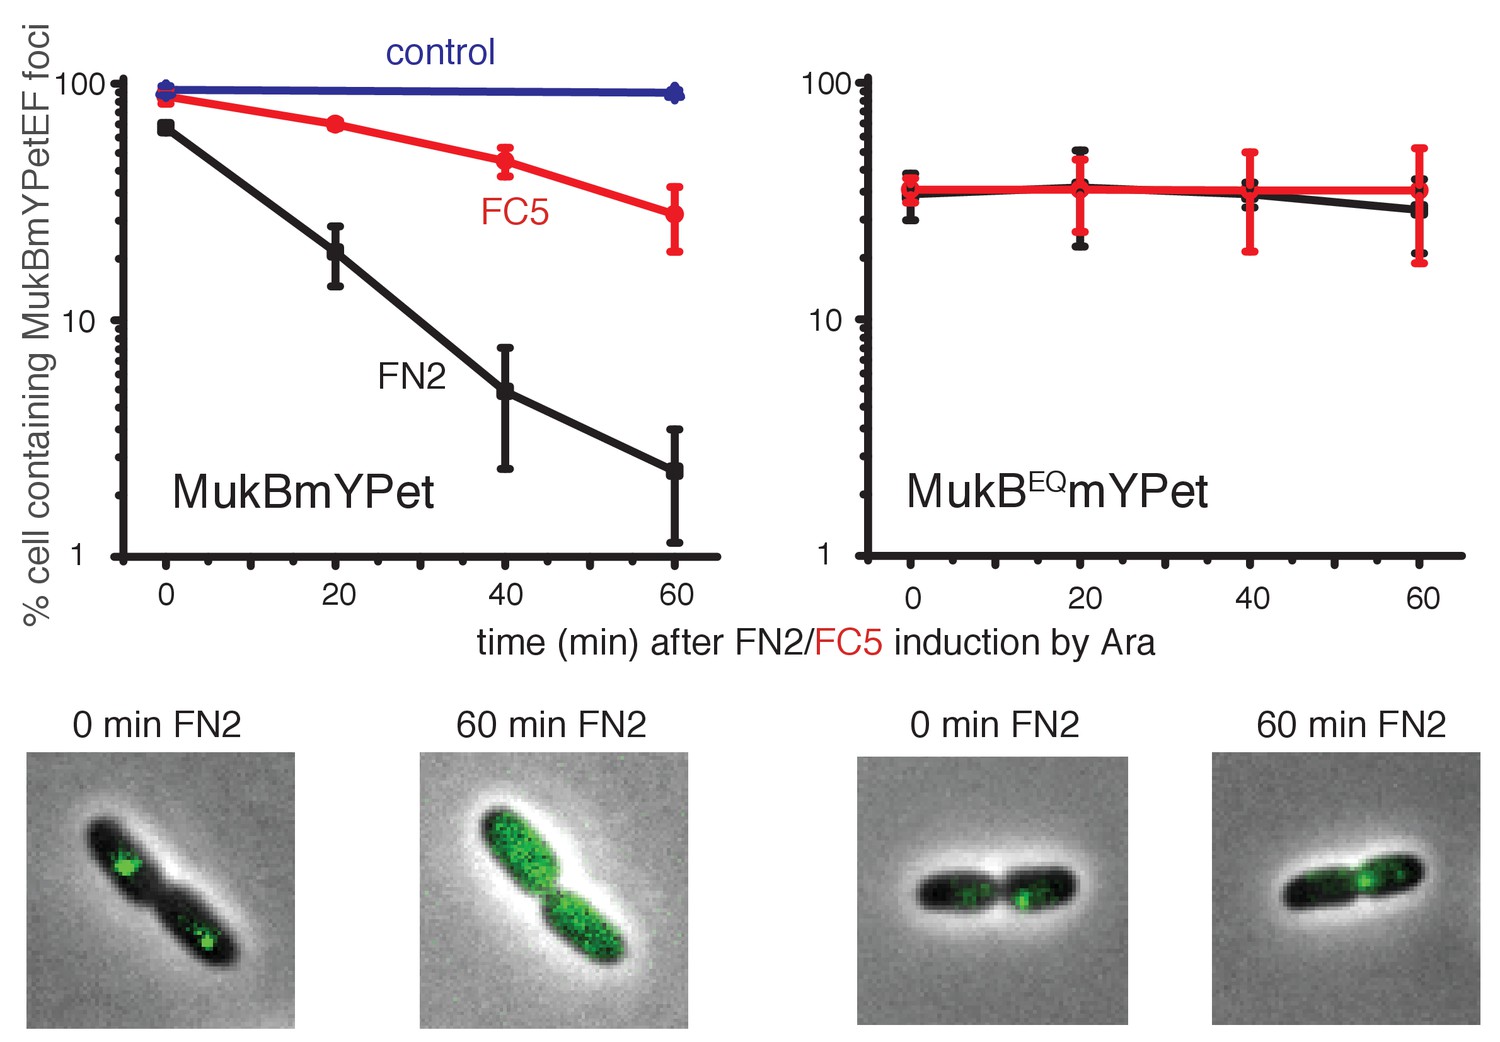
Overexpression of MukF N-terminal and C-terminal domains fragments leads to an ATP hydrolysis cycle-dependent release of MukBEF complexes from DNA in vivo.
MukF FN2 and FC5 fragments were overexpressed from para promoter in pBAD24 by addition of arabinose. MukBmYPetEF and MukBEQmYPetEF complexes were visualised in the absence of arabinose and at every 20 min after induction. More than 500 cells were analysed for each condition. Experiment was repeated three times; error bars show standard deviation of 3 repeats. Bottom panel; images of FN2 overexpressing cells taken at time 0 and 60 min in MukBmYPetEF and MukBEQYPetEF strains (SN182 and SN311, Nolivos et al., 2016).
-
Figure 8—source data 1
Overexpression of MukF N-terminal and C-terminal domains fragments leads to an ATP hydrolysis cycle-dependent release of MukBEF complexes from DNAin vivo.
- https://doi.org/10.7554/eLife.31522.034
Figure 8—figure supplement 1
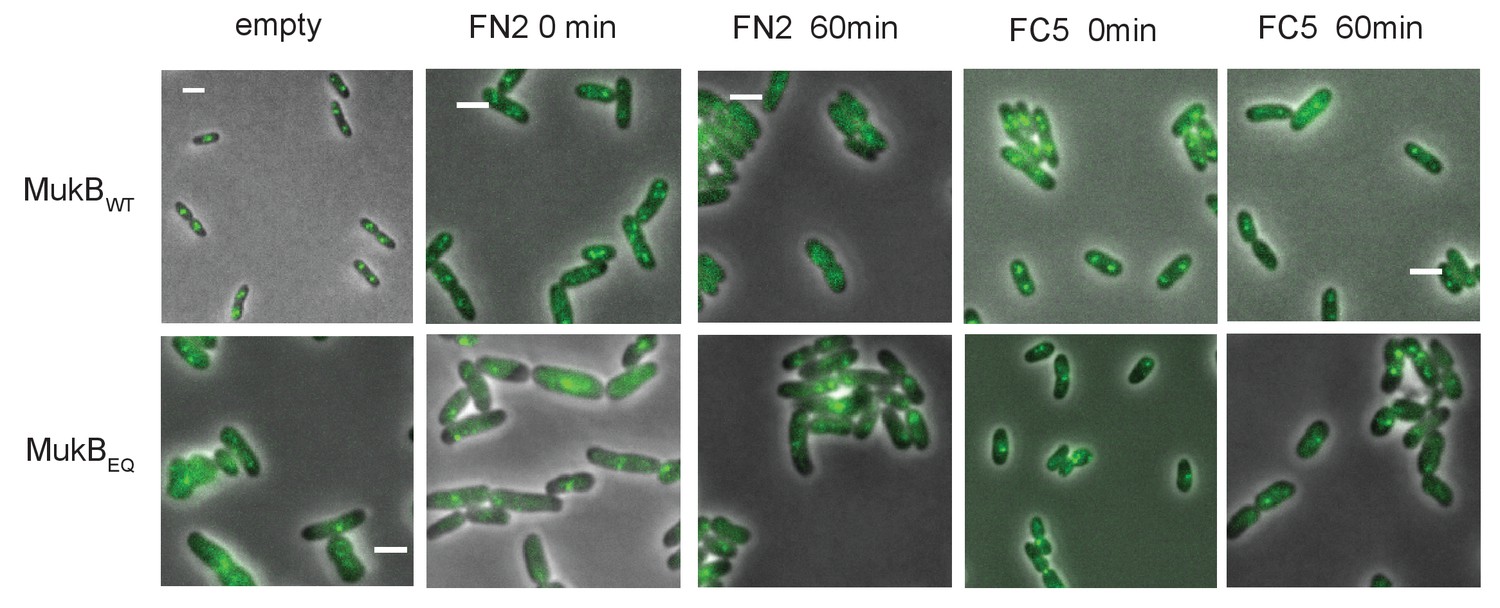
MukBEF foci in cells carrying either mukB wt or mukBEQmYPet chromosomal genes, before and after 1 hr arabinose induced overexpression of MukF N- and C-terminal domain fragments, FN2 and FC5.
https://doi.org/10.7554/eLife.31522.032
Figure 8—figure supplement 2
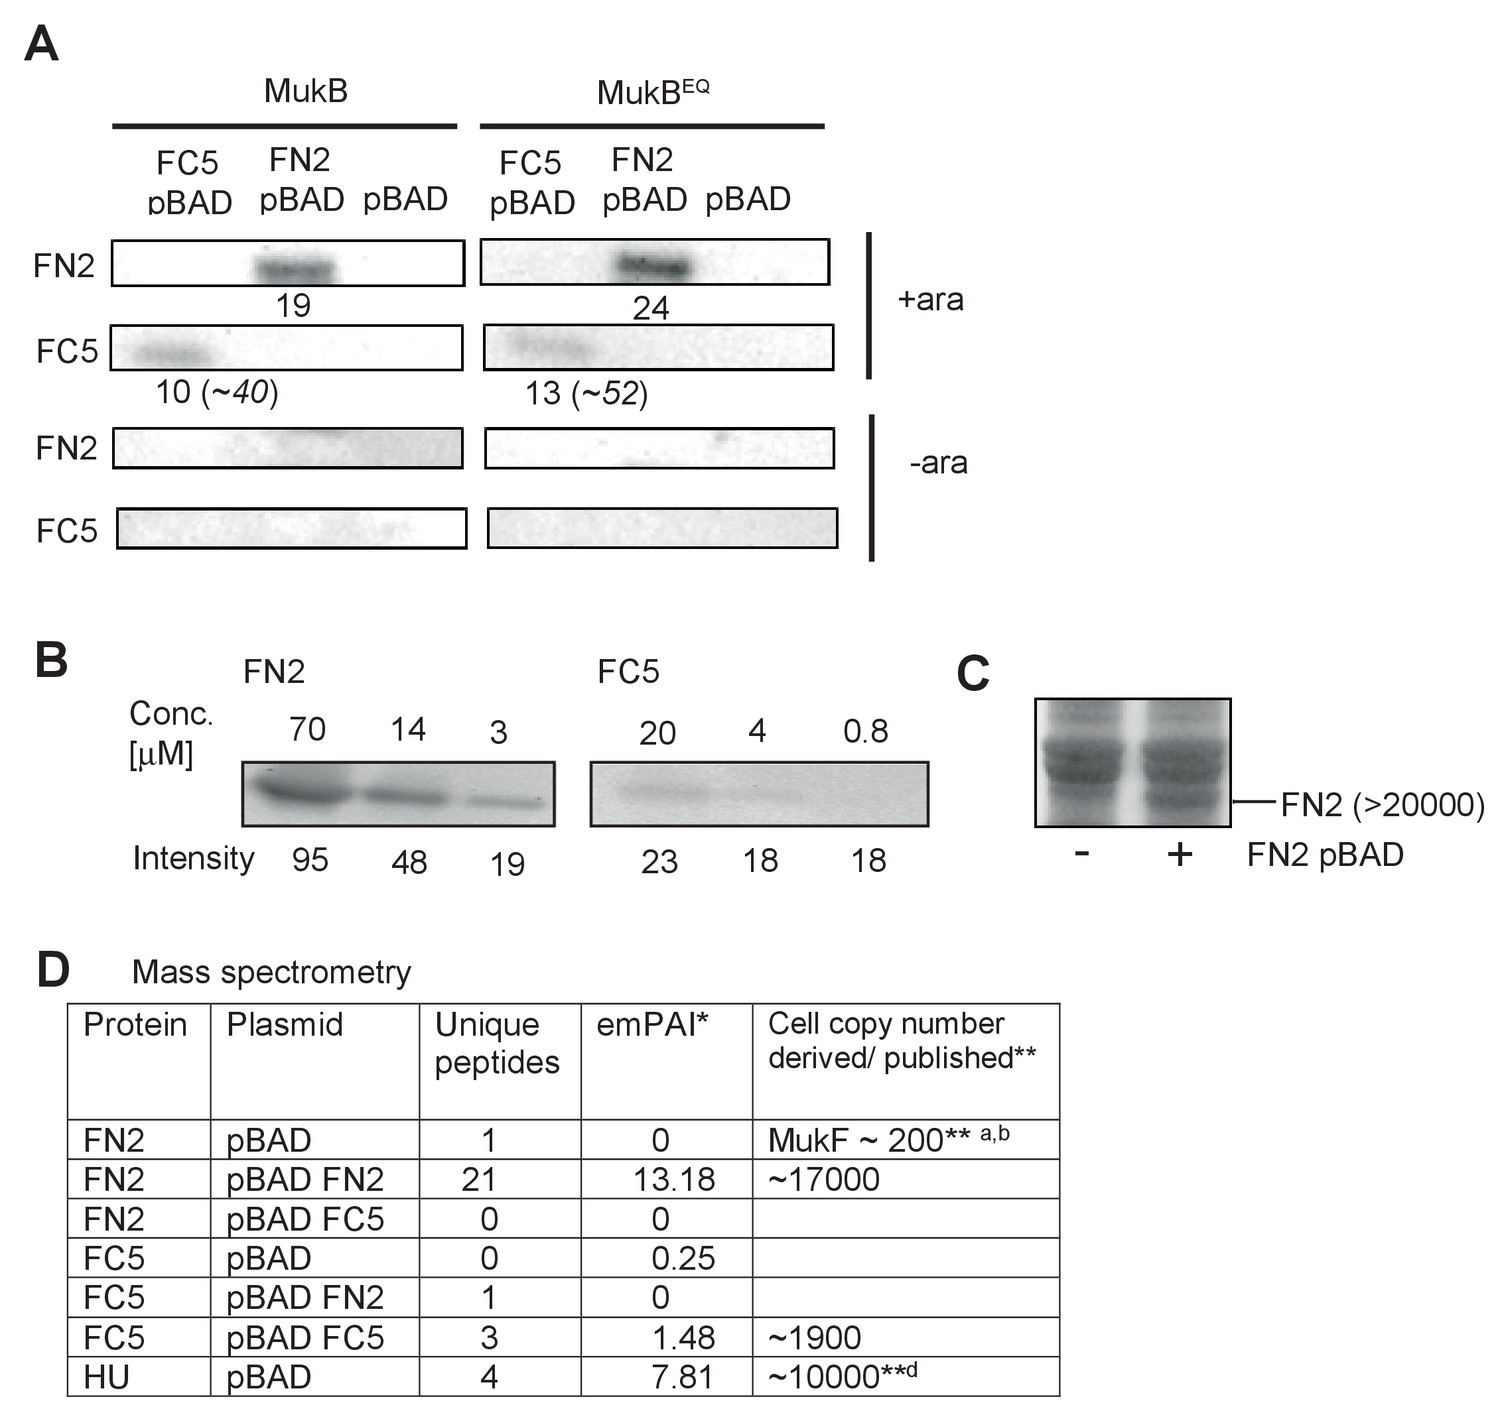
Expression levels of FN2 and FC5 after arabinose-induced induction.
(A) Western blot analysis of overexpression levels of MukF fragments FN2/FC5 in whole cell protein samples from arabinose induced and uninduced mukB and mukBEQ cells, as above. Relative intensities of bands (after background subtraction) are shown under the bands. In italics (parentheses) are the corrected intensities for FC5 after taking into account the different specific binding activities of FN2 and FC5 to the MukF antibody (B). We therefore estimate a ~2 fold excess of FC5 monomers over FN2 dimers in both mukB and mukBEQ cells. (B) Titration of purified FN2 and FC5 proteins against the same MukF antibody to determine the relative specific activity of detection of FC5/FN2. We estimate that the signal is ~4 fold less per FC5 monomer than a FN2 dimer. (C) SDS PAGE of proteins from lysates produced from induced cells lacking or carrying induced pBAD FN2. Since E. coli contains >1×10⁶ protein molecules and semiquantitative scans of the gel lanes showed FN2 to represent ~2% of cell protein after arabinose induction, we estimate the copy number of FN2 dimers to be >20000 (parentheses), with none detectable before induction. (D) Quantitative mass-spectroscopy analysis of overexpression levels of MukF FN2 and FC5 fragments. The values represent two replicates from a single representative experiment. emPAI was used to estimate copy number/cell with HU alpha as a standard. The low relative value here for FC5 compared to FN2 in relation to the values in panel A is likely a consequence of FC5 yielding few peptides; we therefore conclude that the values in panel A are more robust. Nevertheless, the value here for FC5 is still in ~10 fold excess of endogenous MukF. *emPAI - Exponentially Modified Protein Abundance Index (Ishihama et al., 2005); a microscopic determination in live cells (Badrinarayanan et al., 2012a); b Western blot analysis (Petrushenko et al., 2006b); dhttps://pax-db.org/protein/6884531.
Figure 9
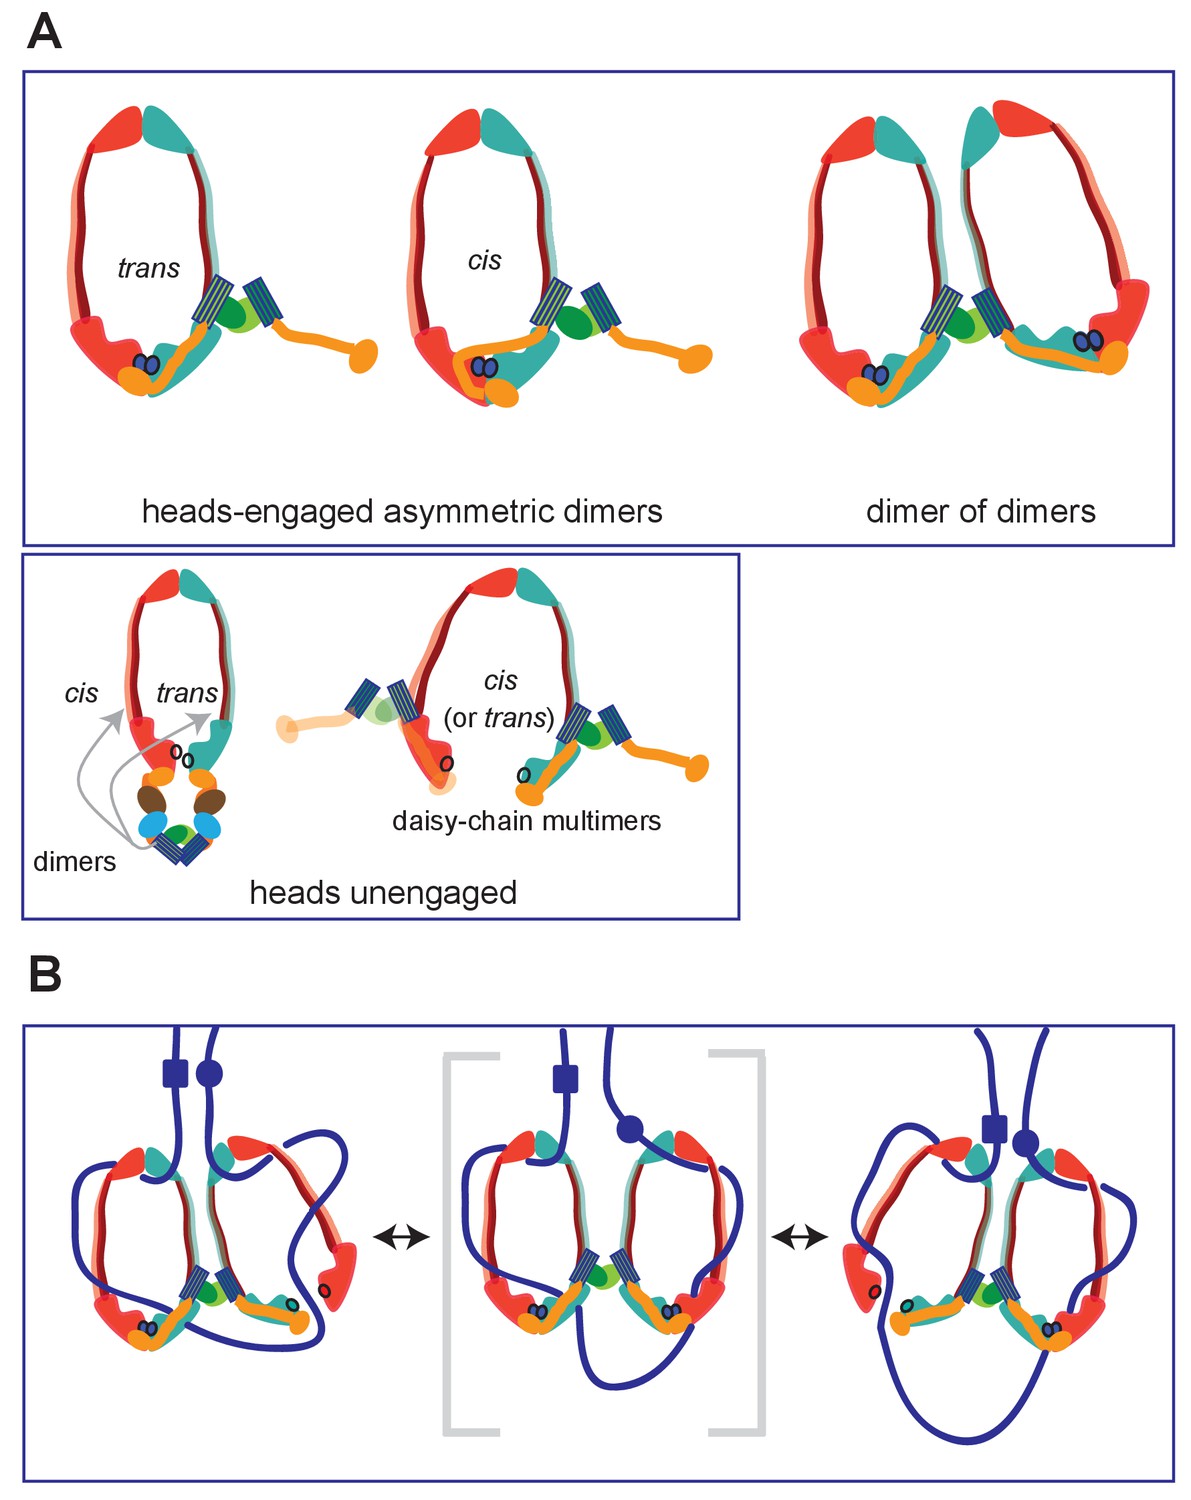
Summary of MukBF interactions and a model for DNA transport.
(A) Top panel; Schematics of possible configurations of MukB and MukF interactions in ATP-bound head-engaged asymmetric complexes of MukBEF. We favour the trans-configuration, identical to those of other SMC complexes. Bottom panel; possible unengaged head complexes. The cartoon on the left is a repeat of that in Figure 1, but additionally indicating that the MukF 4-helix bundles may interact with the same MukB molecule as its C-terminal domain (cis), or the partner MukB molecule (trans). On the right, is a cartoon indicating how daisy-chained multimers could form; these have not been detected in the studies here. (B) Rock- (or rope-) climber model for DNA transport and loop extrusion by MukBEF, modified from (Badrinarayanan et al., 2012a). For clarity only MukBF is shown. The paths of DNA (blue lines; not to scale) are hypothetical, although DNA interactions with the MukB head and hinge have been demonstrated (Kumar et al., 2017; Woo et al., 2009). The state shown in the middle panel (parentheses) could rarely exist if ATP binding and hydrolysis were to be coordinated between the two MukBEF dimers. For presentational simplicity, we have shown MukBEF ring opening through head disengagement, by release and transfer of the MukF C-terminal domain to the ‘cis-configuration’, although results here and elsewhere provide stronger support for ring opening through release of the MukF N-terminal domain from the MukB neck. In reality, the patterns of DNA binding and release, and the conformational changes in the complexes are likely to be more complicated, with both an upper and a lower chamber in each dimeric complex (for example, see Diebold-Durand et al., 2017; Uhlmann, 2016).
Tables
Key resources table
| Reagent type (species) or resource | Designation | Source or reference | Identifiers |
|---|---|---|---|
| strain, strain background (E.coli K12 AB1157) | mukBmYPetEF | SN 182 Nolivos et al.; DOI:10.1038/ncomms10466 | |
| strain, strain background (E.coli K12 AB1157) | mukB EQ mYPetEF | SN 182 Nolivos et al.; DOI:10.1038/ncomms10466 | |
| Strain, for protein expression (E.coli C3013I) | NEB | ||
| strain, for MukB protein expression (E.coli C3013I) C3013I - mukB 3xflag tag | mukB 3xFLAG C3031 | FLOI - this work; derivative of SN 54; Nolivos et al; DOI:10.1038/ncomms10466 | |
| strain, strain background (E.coli K12 AB1157) | RRL 149; Δ mukB | Nolivos et al.; DOI:10.1038/ncomms10466 | |
| strain, strain background (E.coli K12 AB1157) | Ab 233; Δ mukF mukBGFP | Nolivos et al.; DOI:10.1038/ncomms10466 | |
| antibody | anti MukF- (mouse polyclonal) | gift from Kenneth Marians, Memorial Sloan Kettering Center, New York | |
| antibody | Anti-Mouse IgG (whole molecule)– Peroxidase antibody produced in goat | SIGMA | RRID: AB_258167 |
| commercial assay or kit | ENZCheck Phosphate Assay | Life Technologies | |
| software, algorithm | ASTRA 6 | Wyatt Technologies | |
| software algorithm | MicrobTracker-Matlab | Sliusarenko et al. (2011) | RRID:SCR_001622 |
| software, algorithm | Pymol | https://pymol.org/2/ | RRID:SCR_000305 |
| software, algorithm | Methamorph - Ni elements | Nikon | |
| software, algorithm | Modeller | RRID:SCR_008395 | |
| software algorithm | MARS data analysis | BMG Lagtech |
Additional files
-
Transparent reporting form
- https://doi.org/10.7554/eLife.31522.036
Download links
A two-part list of links to download the article, or parts of the article, in various formats.
Downloads (link to download the article as PDF)
Open citations (links to open the citations from this article in various online reference manager services)
Cite this article (links to download the citations from this article in formats compatible with various reference manager tools)
MukB ATPases are regulated independently by the N- and C-terminal domains of MukF kleisin
eLife 7:e31522.
https://doi.org/10.7554/eLife.31522


