Novel ATP-cone-driven allosteric regulation of ribonucleotide reductase via the radical-generating subunit
- Stockholm University, Sweden
- Lund University, Sweden
- Swedish Orphan Biovitrum AB, Sweden
- Umeå University, Sweden
- Malvern Instruments Inc., Sweden
- Tel-Aviv University, Israel
- Uppsala University, Sweden
Figures
Figure 1

Unrooted phylogenetic tree of NrdB sequences and genome arrangements of NrdB sequences with ATP-cones.
(a) Maximum likelihood phylogeny of class I RNR radical generating subunit with subclasses in color, names to the left and organism distributions to the right (see inset legend; sizes of circles are proportional to the number of sequences found in each taxon). Bootstrap support values greater than 0.7 are shown with colored diamonds. NrdBs with ATP-cones were discovered in two subclasses: NrdBi and NrdF (formerly class Ib). Neither of the two subclasses have corresponding catalytic subunits, NrdAi and NrdE respectively, with ATP-cones. In both subclasses, NrdB sequences with ATP-cones were rare and phylogenetically limited, see inset arrows. (b) Arrangement of class I RNR genes in three genomes encoding NrdB proteins with ATP-cones (green borders, NrdAi/NrdBi; purple borders, NrdE/NrdF). Genes are shown 5’ to 3’, so that ATP-cones in the N-terminus are to the left in the gene.
Figure 2
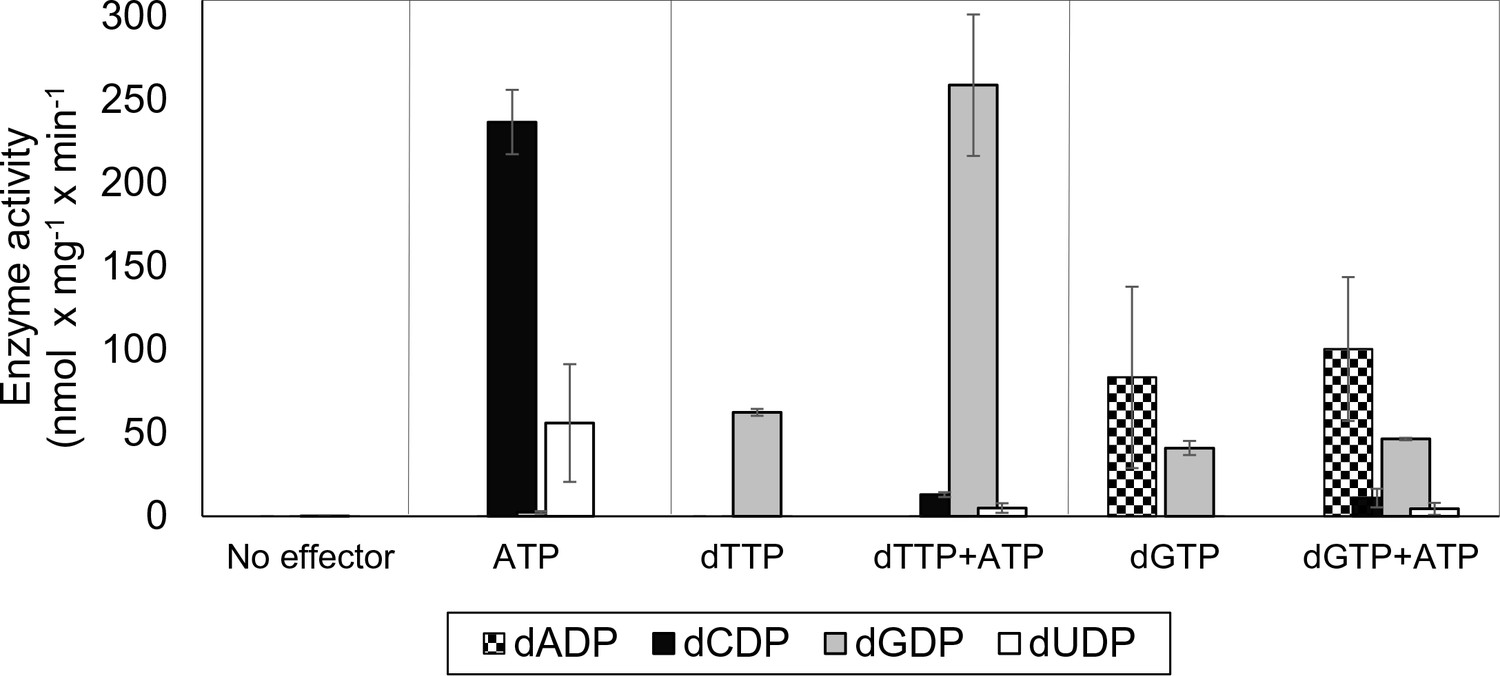
Allosteric specificity regulation of the L. blandensis class I RNR.
Enzyme activity was measured after 10 and 30 min in the presence of all four substrates (0.5 mM each) and with the indicated allosteric effectors (2 mM of each). Error bars indicate the extremes of two measurements. Protein concentrations were 1 µM NrdB and 4 µM NrdA.
Figure 3
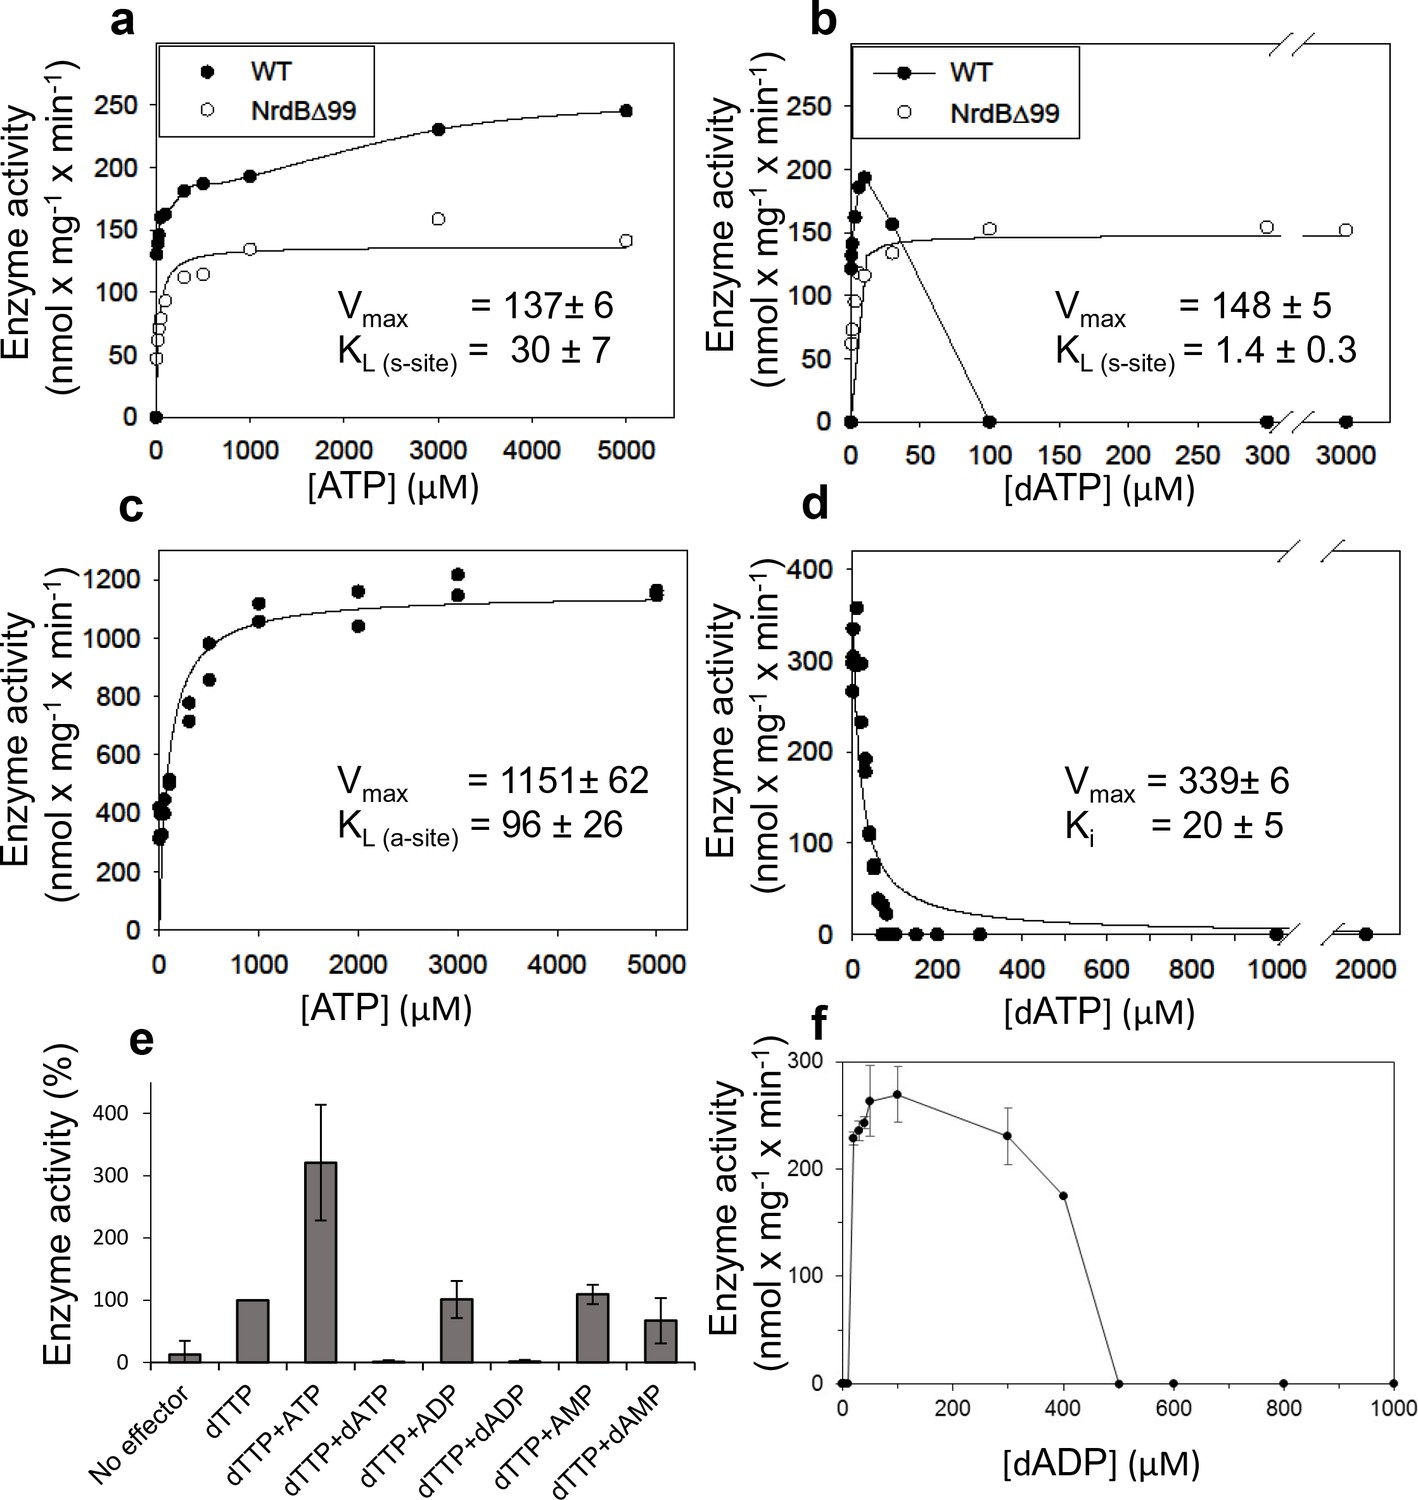
Activity of L. blandensis RNR with wild type NrdB or NrdB∆99 in the presence of allosteric effectors.
NrdB was used in excess over NrdA when studying the s-site and NrdA was used in excess when studying the a-site. (a–b) CDP reduction assayed in mixtures of 0.5 µM NrdA and 2 µM of either wild type NrdB (black circles) or NrdB∆99 (white circles), titrated with ATP (a) or dATP (b). (c) GDP reduction assay mixtures with 2 µM NrdA and 0.5 µM wild type NrdB titrated with ATP in the presence of an s-site saturating concentration of dTTP (2 mM). (d) Reduction of GDP assayed with 2 µM NrdA and 0.5 µM wild type NrdB, titrated with dATP in the presence of an s-site saturating concentration of dTTP (2 mM). (e) GDP reduction in presence of s-site saturating dTTP (2 mM) and 2 mM of the indicated adenosine nucleotides. Assay mixtures contained 4 µM NrdA and 1 µM NrdB. 100% activity corresponded to 639 nmol x mg−1 x min−1. (f) CDP reduction assays titrated with dADP. Assay mixtures contained 2 µM NrdA and 0.5 µM NrdB. Error bars in panels E and F indicate the standard deviation of three measurements.
Figure 4 with 1 supplement

GEMMA analysis of the L. blandensis RNR subunits α, β and their combinations in the presence and the absence of allosteric effectors.
(a) 0.1 mg/ml NrdB (~2 µM) analyzed in the absence and presence of 50 µM dATP or dADP. (b) The NrdB∆99 mutant analyzed in the absence and the presence of 50 µM dATP. (c) In the top two traces 0.1 mg/ml NrdA (~1.4 µM) is analyzed in the absence or presence of 100 µM dATP. In the third trace, 0.1 mg/ml NrdB is added to the mixture. The last trace is similar to the third trace, but the concentration of NrdA and NrdB is increased to 0.4 mg/ml NrdA and 0.3 mg/ml NrdB (~6 µM of each). The analyses of NrdA-NrdB complexes were performed at a very low pressure (1.4 Psi) to avoid the influence of magnesium-nucleotide clusters on the measurement and to minimize the risk of false protein-protein interactions. The baselines of the individual experiments are distributed in the vertical direction to be able to fit many traces in each panel.
Figure 4—figure supplement 1
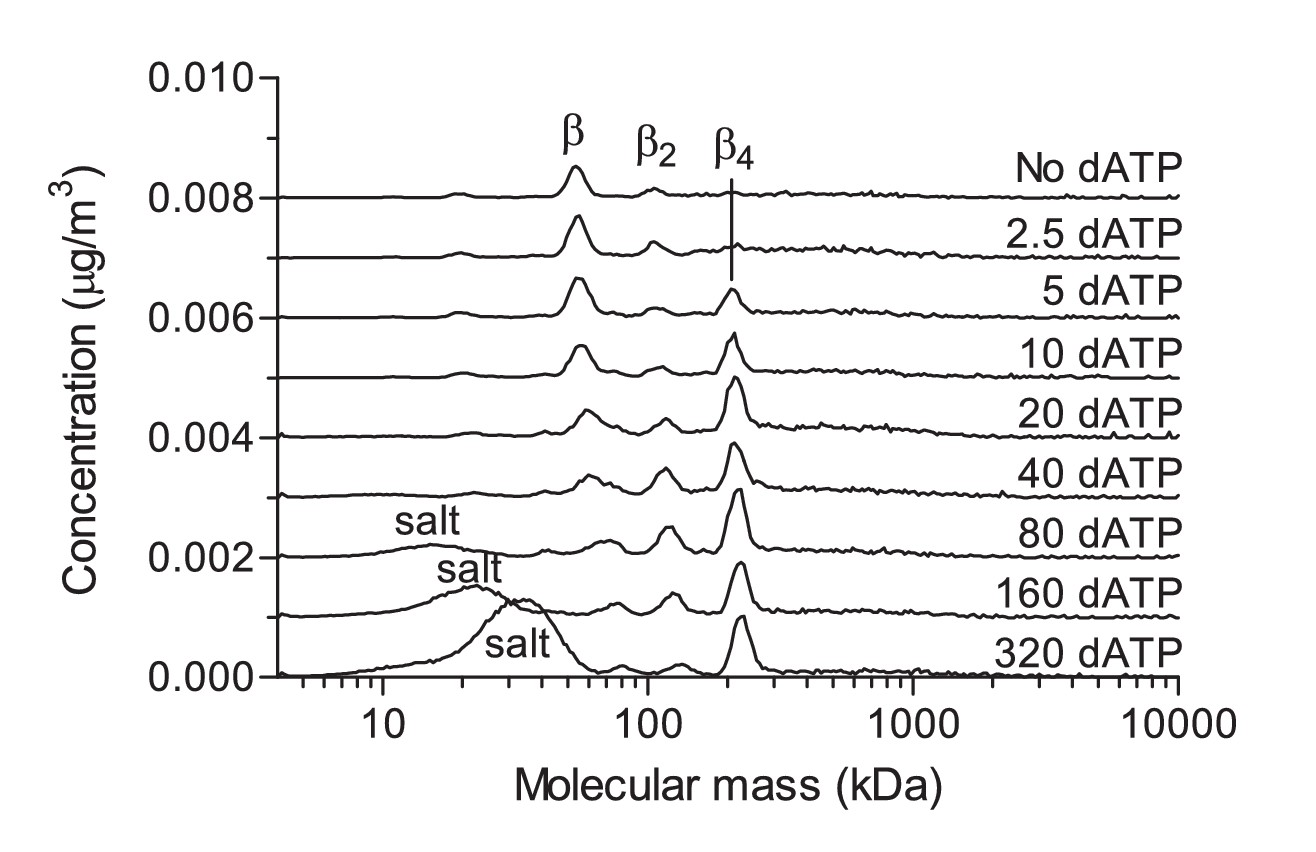
GEMMA measurements showing the dependence of NrdB tetramerization on the dATP concentration.
The indicated concentrations are in µM and the measurements were performed at reduced pressure (2 Psi) to minimize the formation of Mg2+-dATP clusters (salt peak in the lower traces). The shift of the β peak is due to bound salt clusters (larger particles is much less affected). At dATP concentrations below 80 µM, the effect of salt clusters on the measurements became negligible. The measurement was performed with 0.5 mg/ml NrdB (~1 μM). The traces are distributed in the vertical direction to fit many experiments in the same panel.
Figure 5 with 1 supplement
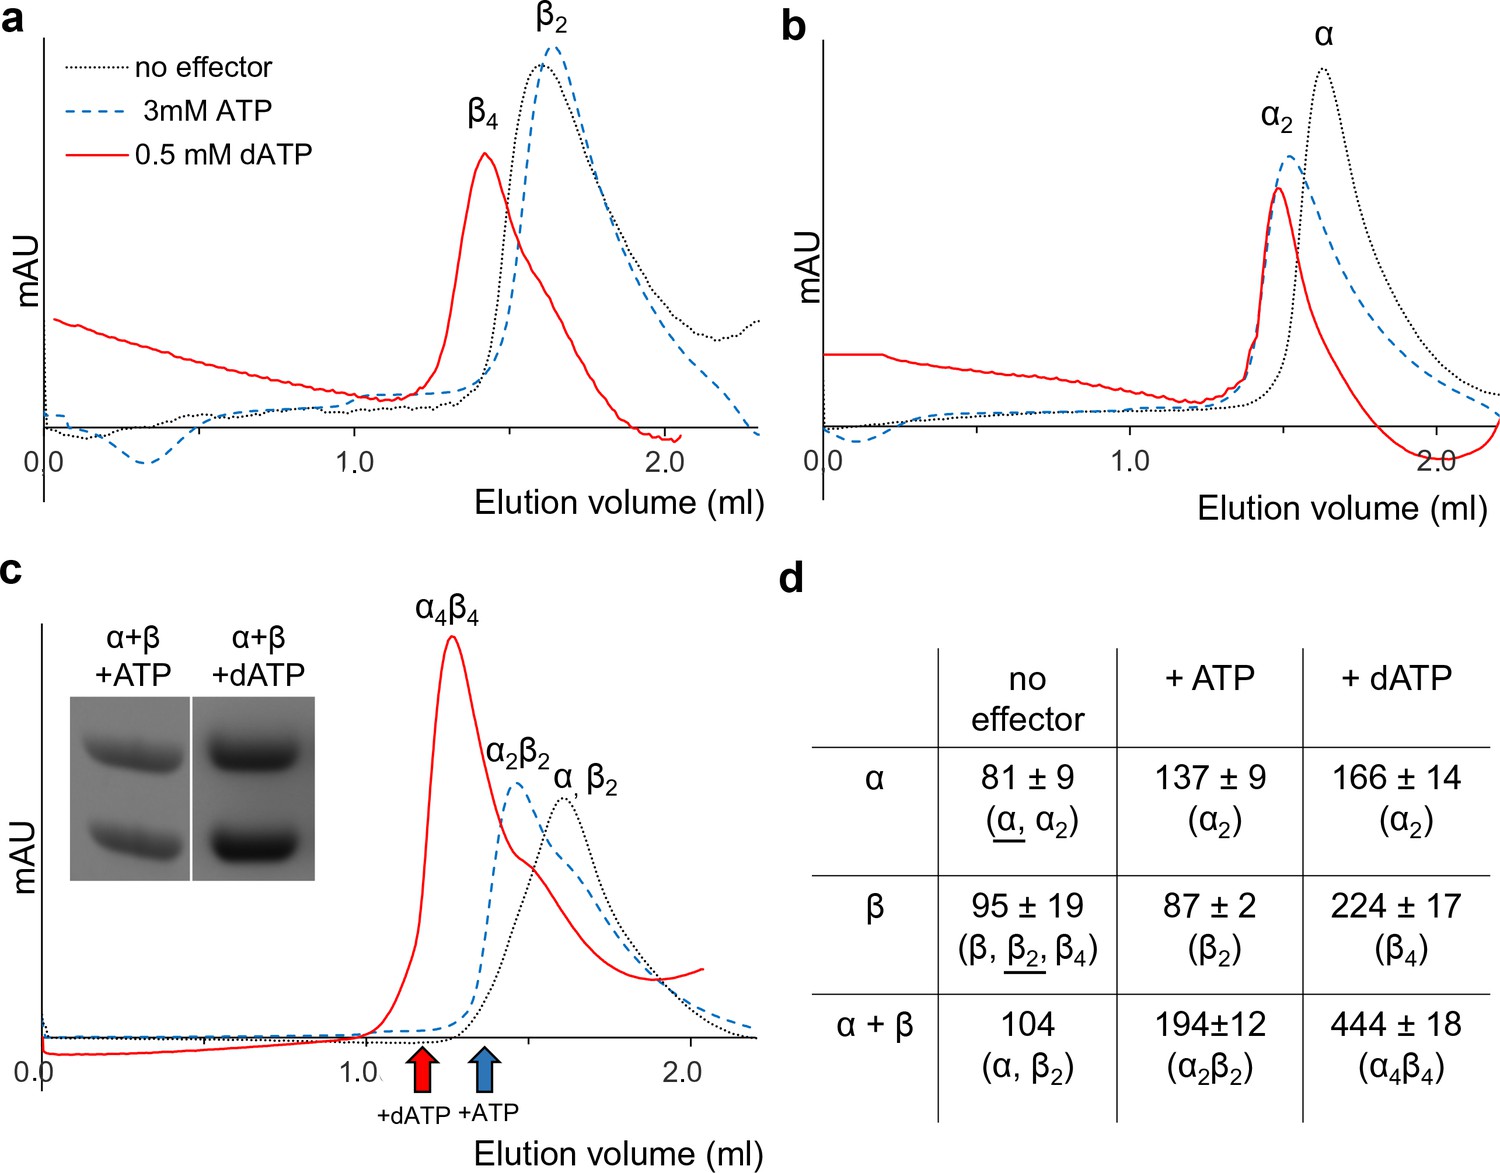
Size exclusion chromatography of L. blandensis RNR in the absence and presence of 3 mM ATP or 0.5 mM dATP.
Proteins at concentrations of 20 μM each were pre-incubated separately or mixed together for 10 min at room temperature in the absence (black dotted line) or presence of ATP (blue dashed line) or dATP (red solid line), centrifuged and applied to the column equilibrated with SEC buffer at 7°C. Panels show NrdB (a), NrdA (b), and an equimolar mixture of NrdA and NrdB (c). C Insert: SDS PAGE of the eluted proteins run in the presence and absence of the indicated effectors. Elution positions of fractions applied to gel are indicated by red (in the presence of dATP) and blue (in the presence of ATP) arrows, respectively. (d) Summary of multiple SEC experiments varying protein concentrations of NrdA (10–113 μM), NrdB (5–150 μM) and mixtures of NrdA and NrdB at ratios of 1:1 or 1:2. Molecular masses and standard deviations are calculated for 3–5 experiments, and closest estimated complex stoichiometry are shown in parenthesis, with major species underlined when appropriate (see Figure 5—figure supplement 1 for details).
Figure 5—figure supplement 1
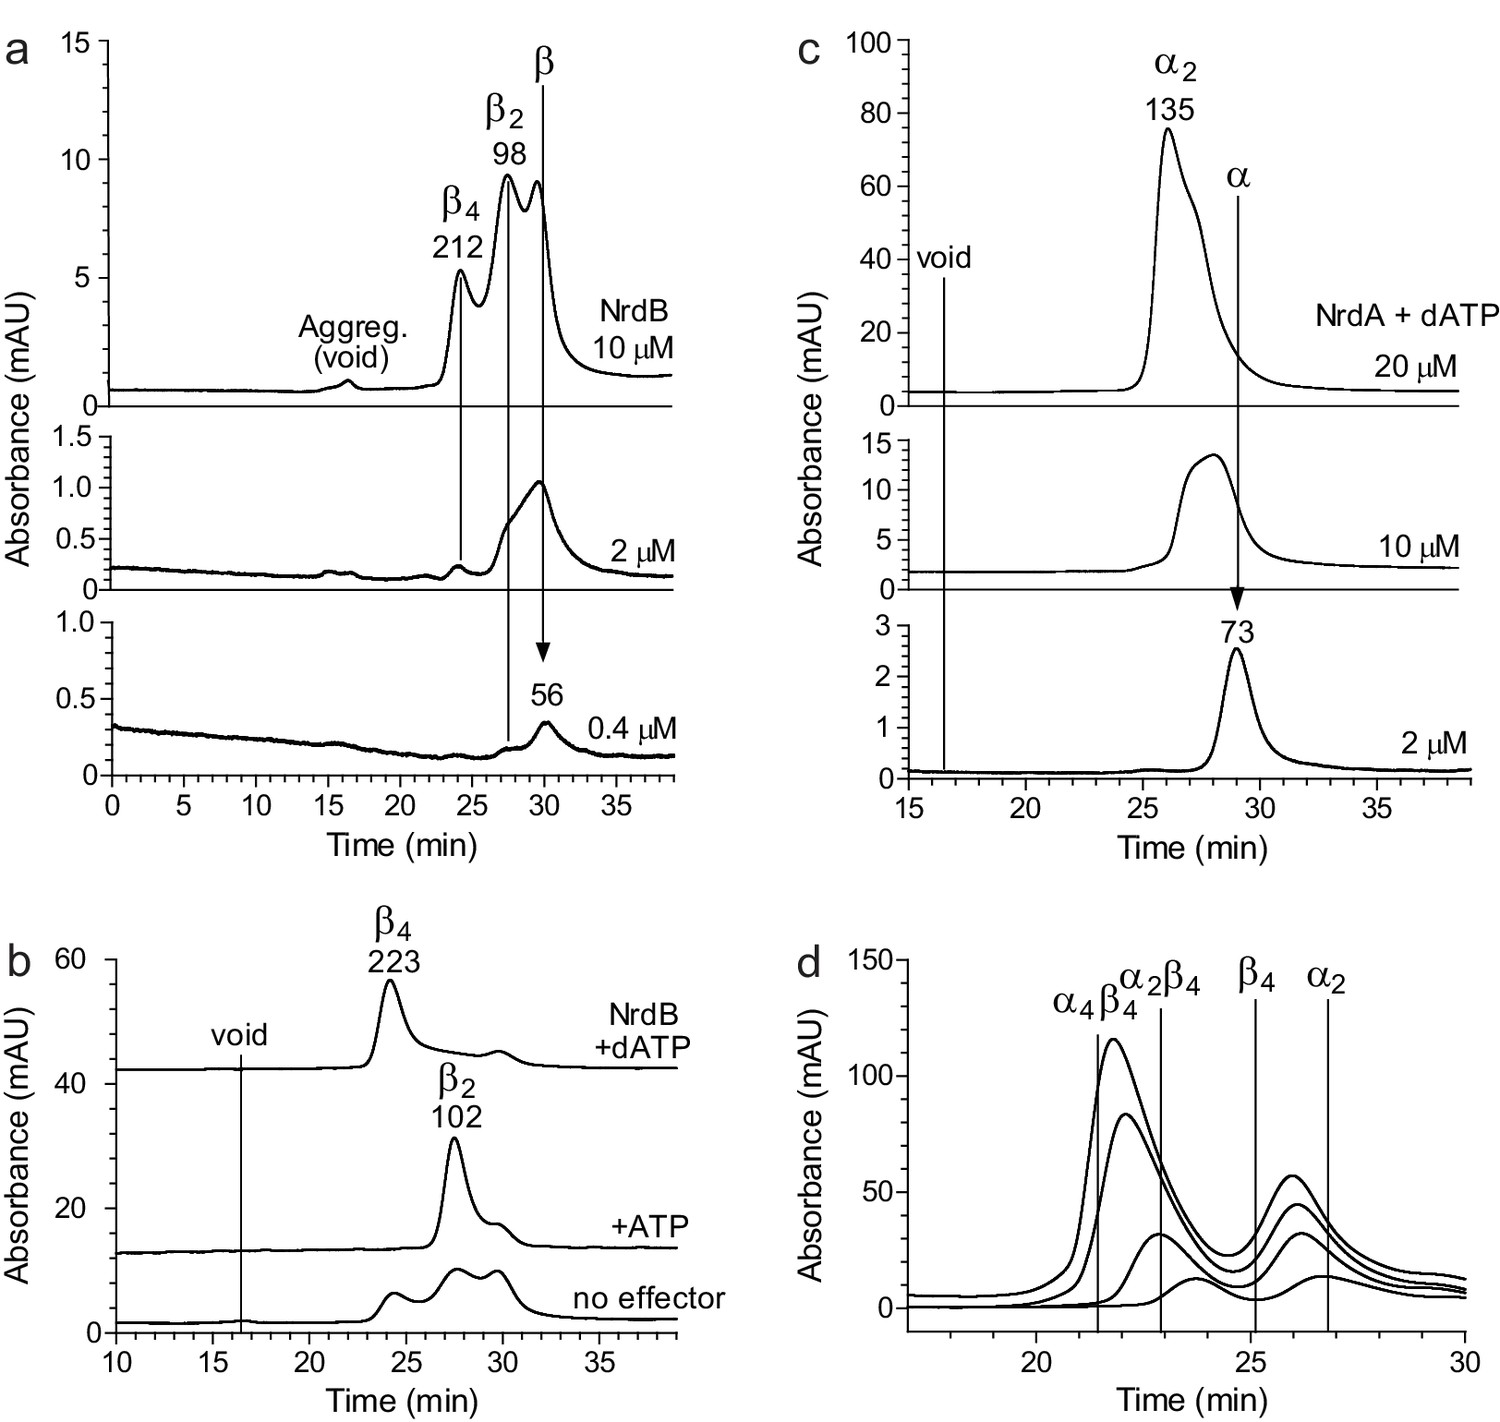
Size exclusion chromatography studies of the L. blandensis NrdA and NrdB at low protein concentration.
(a) NrdB analyzed at different protein concentrations (in µM) shows that the protein gradually changes from monomers to dimers and to some extent tetramers. (b) NrdA analyzed in the presence of 100 µM dATP gradually changes from monomers to dimers when the protein concentration increases. At the intermediate protein concentrations, the protein peak is between monomers and dimers due to the equilibration between the two forms. (c) NrdB (10 µM) forms a tetramer in the presence of 100 µM dATP, dimer in the presence of ATP and a mixture of monomers, dimers and tetramers in the absence of allosteric effectors. The experiment without allosteric effectors is the same as the top spectrum in (a). (d) Mixtures of NrdA and NrdB were analyzed at different protein concentrations (5, 10, 20 and 30 µM of each subunit) in the presence of 100 µM dATP. The experiments were performed on a Superdex 200 10/300 GL column (GE Health Care) at room temperature with a running buffer consisting of 150 mM KCl, 10 mM MgCl2 and 50 mM Tris-HCl pH 7.6. The KCl concentration was kept at 150 mM except in (d), where the concentration needed to be reduced to 50 mM to avoid inhibition of the NrdA-NrdB interaction.
Figure 6 with 3 supplements

Structure of tetrameric L. blandensis NrdB in complex with dATP.
(a) Overall structure of the NrdB tetramer. The two monomers of each dimer are colored in different shades of gray, while the N-terminal ATP-cones are colored orange and light blue respectively. The dATP molecules are shown in CPK representation. The curved lines at the top and bottom of each dimer core indicate the proposed binding area in the active α2β2 complex of RNRs. (b) Surface representation of an NrdB dimer extracted from the tetramer structure, showing the presumably flexible nature of the ATP-cones in solution. The color scheme is as in panel a). (c) Binding of two dATP molecules to the ATP-cone. The dATP molecules are shown as sticks. Residues involved in binding the two dATP molecules are labeled in blue and red respectively. Polar contacts are shown as dotted yellow lines. (d) The interface between ATP-cones in the NrdB tetramer. Chains A and D are shown in light blue and orange respectively. Side chains of residues involved in the interface are labeled. The two dATP molecules closest to the interface are shown as sticks. Polar contacts are shown as yellow dotted lines. (e) Structure of the metal site in chain C, which is representative of the others. Metal ions are shown as purple spheres. 2 m|Fo|-D|Fc| electron density is shown as a grey mesh, contoured at 1.4 σ. Asn m|Fo|-D|Fc| OMIT map for the metal ions is shown in purple, contoured at 4.0 σ.
-
Figure 6—source data 1
Data quality statistics for the anomalous data used for metal identification.
Figures in parentheses are for the highest resolution shell.
- https://doi.org/10.7554/eLife.31529.014
-
Figure 6—source data 2
Peak heights of metal ions in anomalous difference maps calculated at three different wavelengths after refining the same structure against data at each wavelength.
The peak heights are given in standard deviations above the mean. For reference, the anomalous difference map peak heights are also given for two of the most well-ordered sulfur atoms in the structure, in Met A80 and Met D32. It can be seen that the average peak heights for the metal ions vary little with wavelength and are at most only about twice the height of those for the sulfur atoms, which is most consistent with them being Ca2+, whose f’ component is about twice that of sulfur at all three wavelengths, whereas that of Mn2+ or Fe2+/3+ is more than four times higher at 1.72 Å and 1.87 Å.
- https://doi.org/10.7554/eLife.31529.015
Figure 6—figure supplement 1
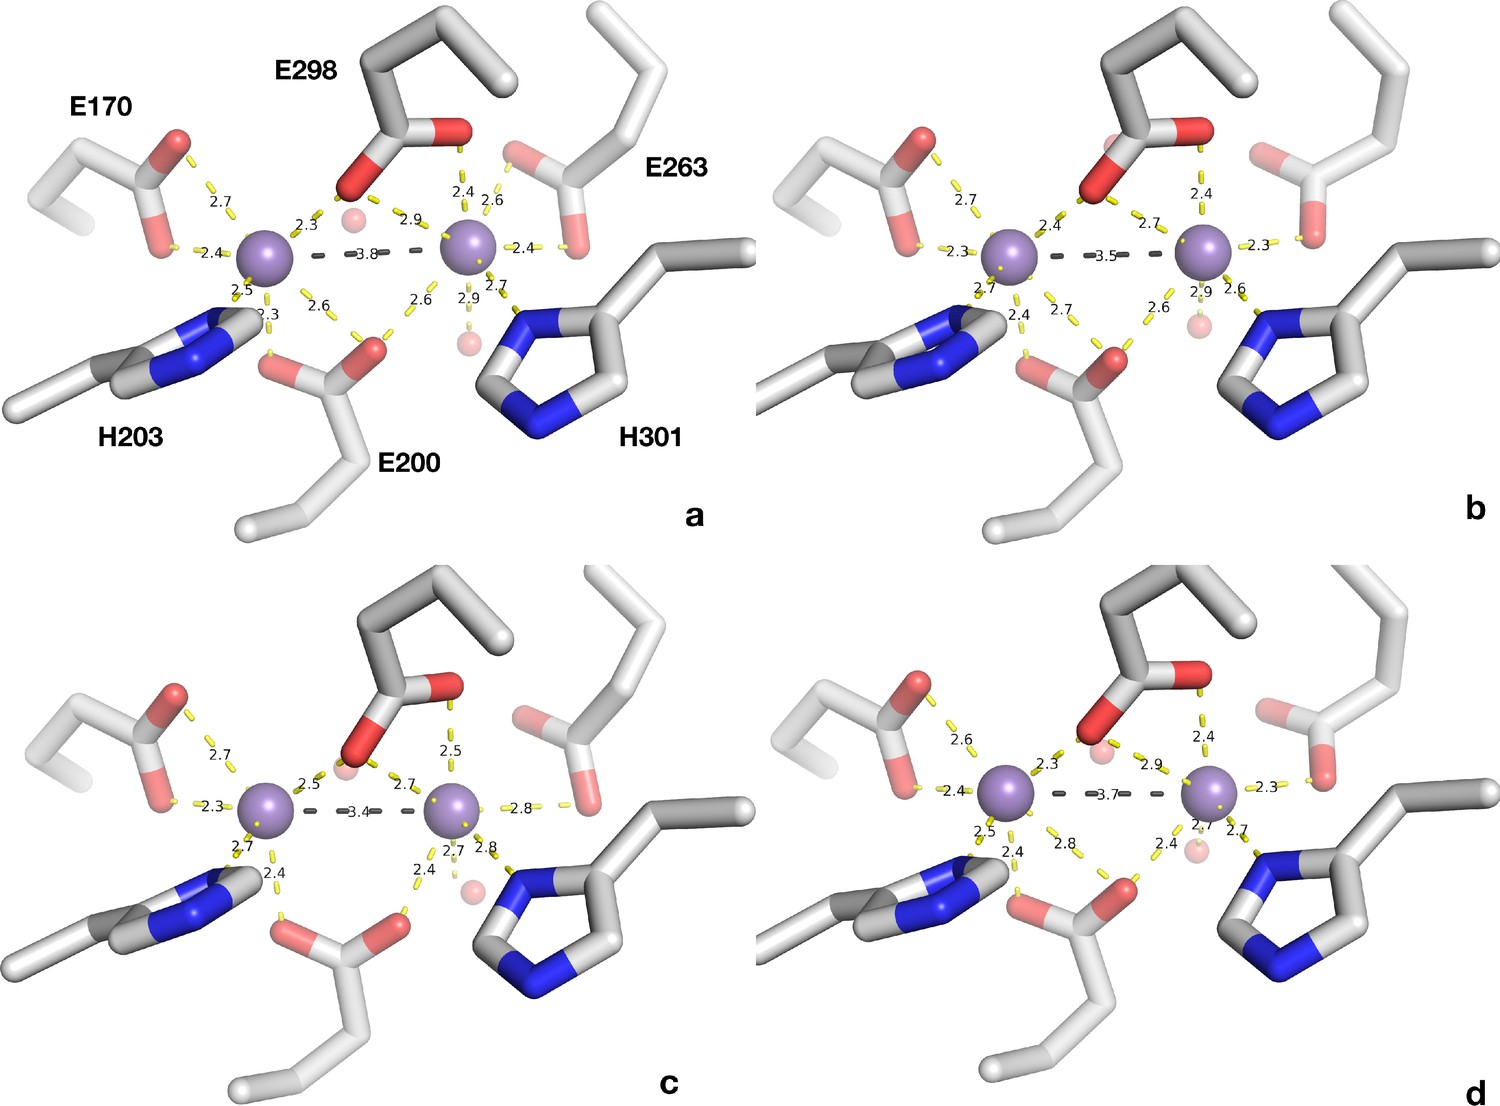
The ligands of the metal center in the four non-crystallographically related monomers of L. blandensis NrdB.
The metal ions are shown as small purple spheres and the ligands as sticks. Coordination distances are shown by yellow dotted lines and the metal-to-metal distances are shown as black dotted lines. Two water molecules are shown, one coordinated to the right-hand metal and one that is consistently found in all centers but which is outside of coordination distance.
Figure 6—figure supplement 2

NrdBi HMMER sequence profile logo.
Residues discussed in the results are marked in the figure with numbering according to L. blandensis NrdBi. Letter heights are proportional to probabilities for each amino acid at a given position, disregarding background probabilities. Total height of letters is proportional to information content in a given position. Generated with Skylign(Wheeler et al., 2014).
Figure 6—figure supplement 3
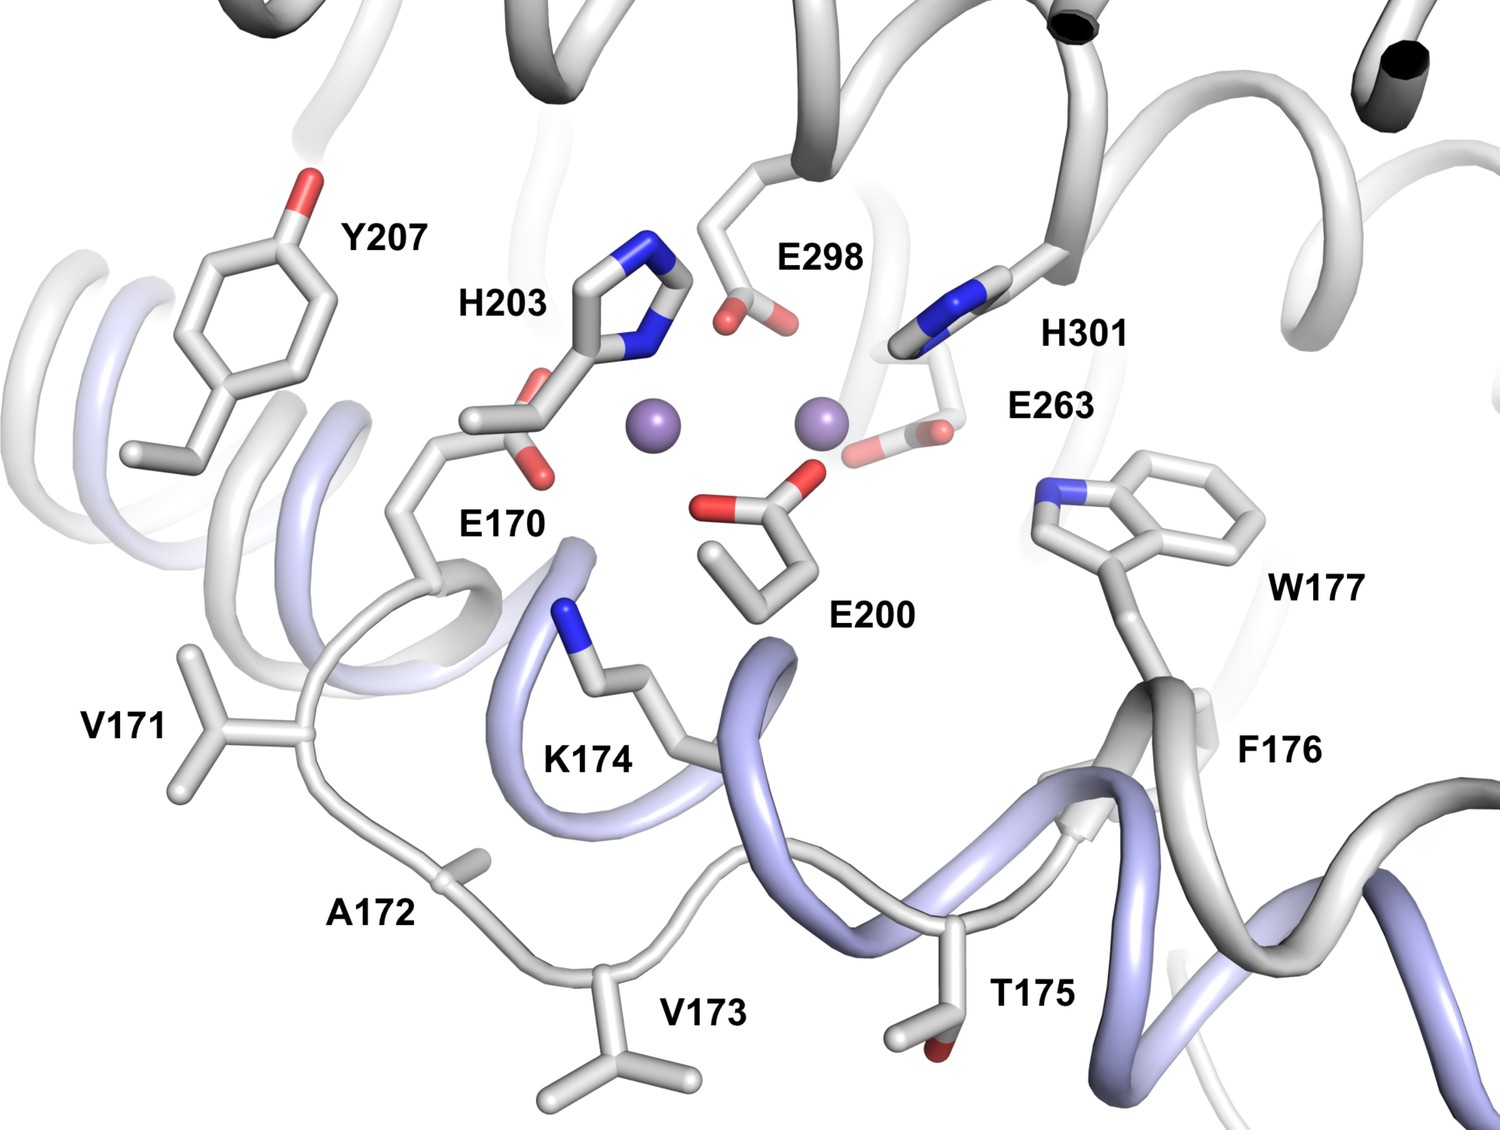
Distortion of the first helix of the metal-coordinating 4-helix bundle in L. blandensis NrdB.
The structure of E. coli NrdB (represented by PDB entry 2XOF) was superimposed using all Cα atoms in the same monomer. L. blandensis NrdB is shown as a gray cartoon with the metal coordinating side chains, as well as those of Tyr207 and all residues from 171 to 176 shown as sticks. Metal ions are shown as small purple spheres. For clarity, the cartoon for the second helix of the bundle (containing residues Glu200, His203) is not shown. The corresponding undistorted helix from E. coli NrdB is shown as a blue cartoon.
Figure 7 with 1 supplement
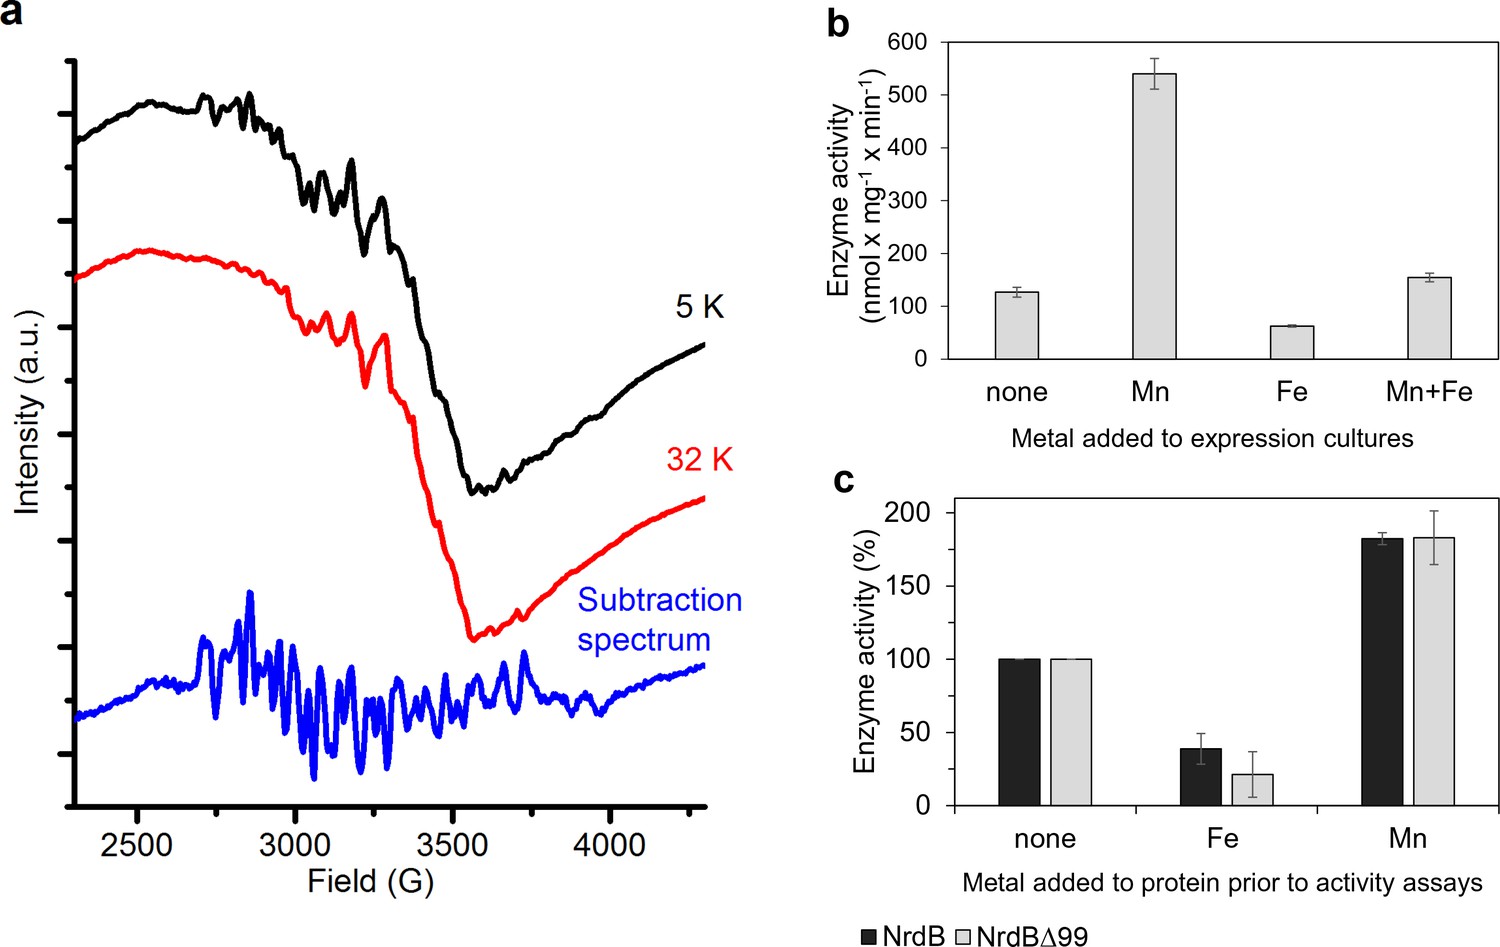
Type of dinuclear metal center of L. blandensis NrdB and metal-dependency of enzyme activity.
(a) X-band EPR spectra of catalytically active, non-reconstituted, samples recorded at 5 K (black, top); 32 K (red, middle) (signal intensity multiplied by 3.7 for clarity; multiline spectrum obtained by subtraction of a scaled 32K spectrum from the 5K spectrum (blue, bottom) (signal intensity multiplied by three for clarity). Instrument settings: microwave frequency = 9.28 GHz; power = 1 mW; modulation amplitude = 10G; modulation frequency = 100 kHz. (b) Enzyme activity of NrdB∆99 purified from heterologously expressed cultures grown with addition of different divalent metal ions as indicated; the Mn-sample was used for the EPR analysis. (c) Enzyme activity was measured after addition of a total concentration of 20 µM divalent metal ions to 10 µM of wild-type or NrdB∆99 protein as indicated. Enzyme activity without addition of metals was set as 100% and corresponded to 592 and 217 nmol mg−1 min−1 for wild type and NrdB∆99 enzymes respectively. Error bars indicate the standard deviation of three measurements.
Figure 7—figure supplement 1
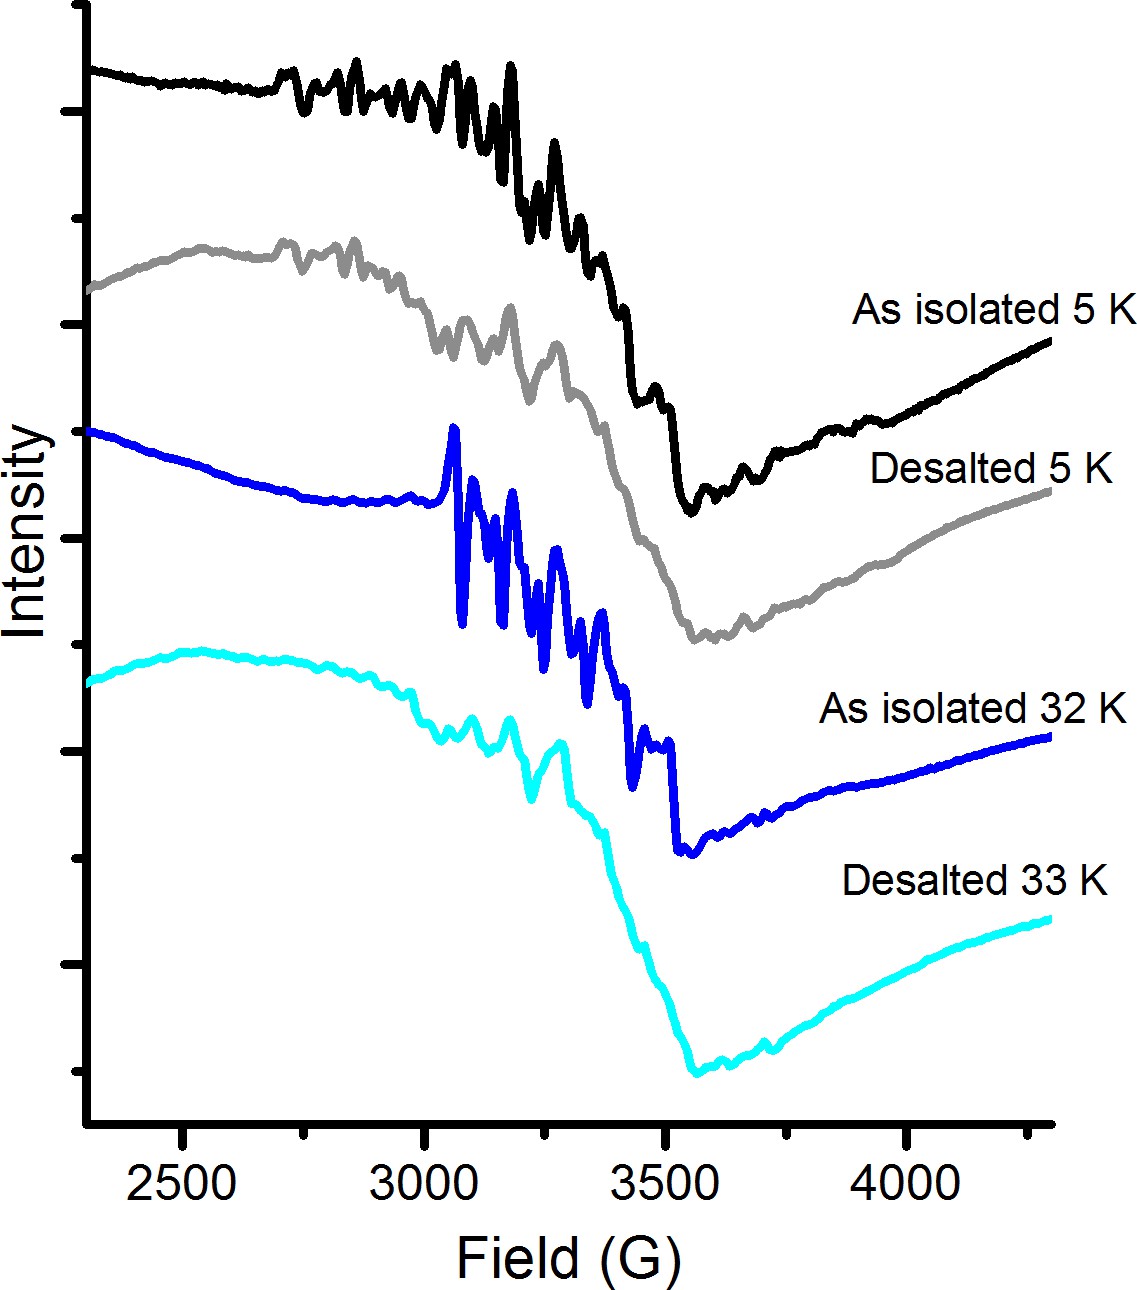
X-band EPR spectra recorded at 5 K and 32 K of catalytically active samples before and after desalting treatment.
Following the desalting column the central 6-line feature is greatly diminished while the multiline signal appears unaffected. Thus, the high-valent Mn-dimer appears tightly bound to the protein and stable on the time-scale of the experiments (hours). As-isolated samples recorded at 5 K (black) and 33 K (dark blue, signal multiplied by 3.5 for clarity); desalted samples recorded at 5 K (grey) and 32 K (light blue, signal multiplied by four for clarity). Instrument settings: microwave frequency = 9.28 GHz; power = 1 mW; modulation amplitude = 10G; modulation frequency = 100 kHz.
Figure 8
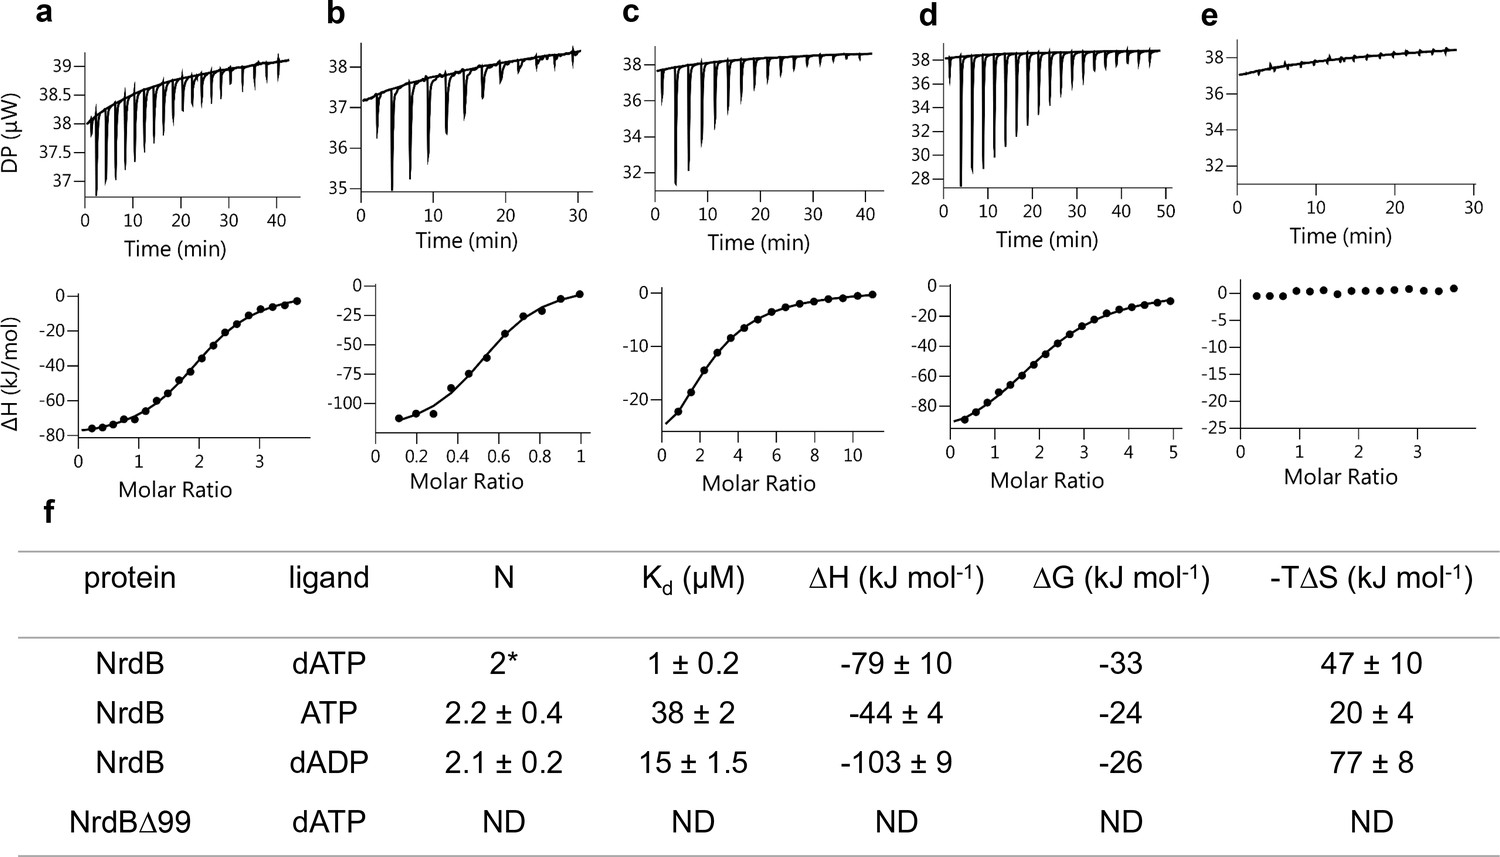
Representative ITC thermograms obtained by titration of dATP (a), ATP (c) and dADP (d) into NrdB.
Isothermal calorimetric enthalpy changes (upper panel) and resulting binding isotherms (lower panel) are shown. Reverse titration of NrdB to dATP (b). Titration of dATP to NrdB∆99 (e). Thermodynamic parameters of ligand binding to NrdB (f). Binding isotherms were fitted using a one-set-of sites binding model. Values are reported as the mean ±SD of three titrations (and additional two reverse titrations for dATP). All titrations were performed at 10°C as described in Materials and methods. *=binding stoichiometry was kept constant N = 2, considering monomeric protein concentrations. ND = not detected.
Tables
Table 1
Data collection and refinement statistics.
Figures in parentheses are for the highest resolution shell.
| Wavelength | 0.9724 |
|---|---|
| Resolution range (Å) | 44.7–2.45 (2.51–2.45) |
| Space group | P1 |
| Unit cell (Å, °) | a = 74.0, b = 90.5, c = 90.9, α = 110.78, β = 98.99, γ = 114.11 |
| Total no. reflections | 246972 (15753) |
| No. unique reflections | 67728 (4517) |
| Multiplicity | 3.6 (3.5) |
| Completeness (%) | 97.8 (97.3) |
| Mean I/σ(I) | 7.4 (1.0) |
| Wilson B-factor (Å2) | 63.3 |
| Rmerge (I) | 0.093 (1.058) |
| Rmeas (I) | 0.109 (1.243) |
| Rpim (I) | 0.055 (0.639) |
| CC(½) (I) | 0.997 (0.495) |
| Reflections used in refinement | 67723 |
| Reflections used for Rfree | 3353 (5%) |
| Rmodel (F) | 0.205 (0.221) |
| Rfree (F) | 0.238 (0.265) |
| Number of non-hydrogen atoms: | |
| macromolecules | 12919 |
| ligands | 284 |
| water molecules | 129 |
| rms deviation from ideal geometry (bonds) | 0.010 |
| rms deviation (angles) | 1.11 |
| Ramachandran favored (%) | 97.7 |
| Ramachandran allowed (%) | 2.1 |
| Ramachandran outliers (%) | 0.2 |
| Rotamer outliers (%) | 3.5 |
| Clashscore | 3.22 (100th percentile) |
| Wilson B-factor (Å2) | 63.3 |
| Average B-factors (Å2): | |
| macromolecules | 66.5 |
| ligands | 69.5 |
| solvent | 54.0 |
Key resources table
| Reagent type (species) or resource | Designation | Source or reference | Identifiers |
|---|---|---|---|
| Gene (Leeuwenhoekiella blandensis sp. nov. MED 217) | NrdAi | NA | WP_009781766 |
| Gene (Leeuwenhoekiella blandensis sp. nov. MED 217) | NrdBi | NA | EAQ51288 |
| Strain, strain background (Leeuwenhoekiella blandensis) | Leeuwenhoekiella blandensis sp. nov. MED 217 | doi: 10.1099/ijs.0.64232–0 | |
| Strain, strain background (Escherichia coli) | Escherichia coli BL21(DE3) | (Novagen) Merck | |
| Strain, strain background (Escherichia coli) | Escherichia coli DH5α | ThermoFisher Scientific | |
| Recombinant DNA reagent | pET-28a(+) vector (Novagen) | Merck | |
| Software, algorithm | HMMER | doi:10.1371/journal.pcbi.1002195 | RRID:SCR_005305 |
| Software, algorithm | RefSeq | RRID:SCR_003496 | |
| Software, algorithm | ProbCons | doi:10.1101/gr.2821705 | RRID:SCR_011813 |
| Software, algorithm | FastTree | doi:10.1371/journal.pone.0009490 | RRID:SCR_015501 |
| Software, algorithm | XDS | doi:10.1107/s0907444909047337 | RRID:SCR_015652 |
| Software, algorithm | CCP4 | doi:10.1107/s0907444910045749 | RRID:SCR_007255 |
| Software, algorithm | Phaser | doi:10.1107/s0021889807021206 | RRID:SCR_014219 |
| Software, algorithm | PDB | RRID:SCR_012820 | |
| Software, algorithm | Coot | doi:10.1107/s0907444910007493 | RRID:SCR_014222 |
| Software, algorithm | Buccaneer | doi:10.1107/s0907444906022116 | RRID:SCR_014221 |
| Software, algorithm | Refmac | doi:10.1107/s0907444996012255 | RRID:SCR_014225 |
| Software, algorithm | Buster | RRID:SCR_015653 | |
| Software, algorithm | MolProbity | doi:10.1107/s0907444909042073 | RRID:SCR_014226 |
Additional files
-
Transparent reporting form
- https://doi.org/10.7554/eLife.31529.020
Download links
A two-part list of links to download the article, or parts of the article, in various formats.
Downloads (link to download the article as PDF)
Open citations (links to open the citations from this article in various online reference manager services)
Cite this article (links to download the citations from this article in formats compatible with various reference manager tools)
Novel ATP-cone-driven allosteric regulation of ribonucleotide reductase via the radical-generating subunit
eLife 7:e31529.
https://doi.org/10.7554/eLife.31529


