A postsynaptic PI3K-cII dependent signaling controller for presynaptic homeostatic plasticity
- University of California, San Francisco, United States
Figures
Figure 1 with 1 supplement
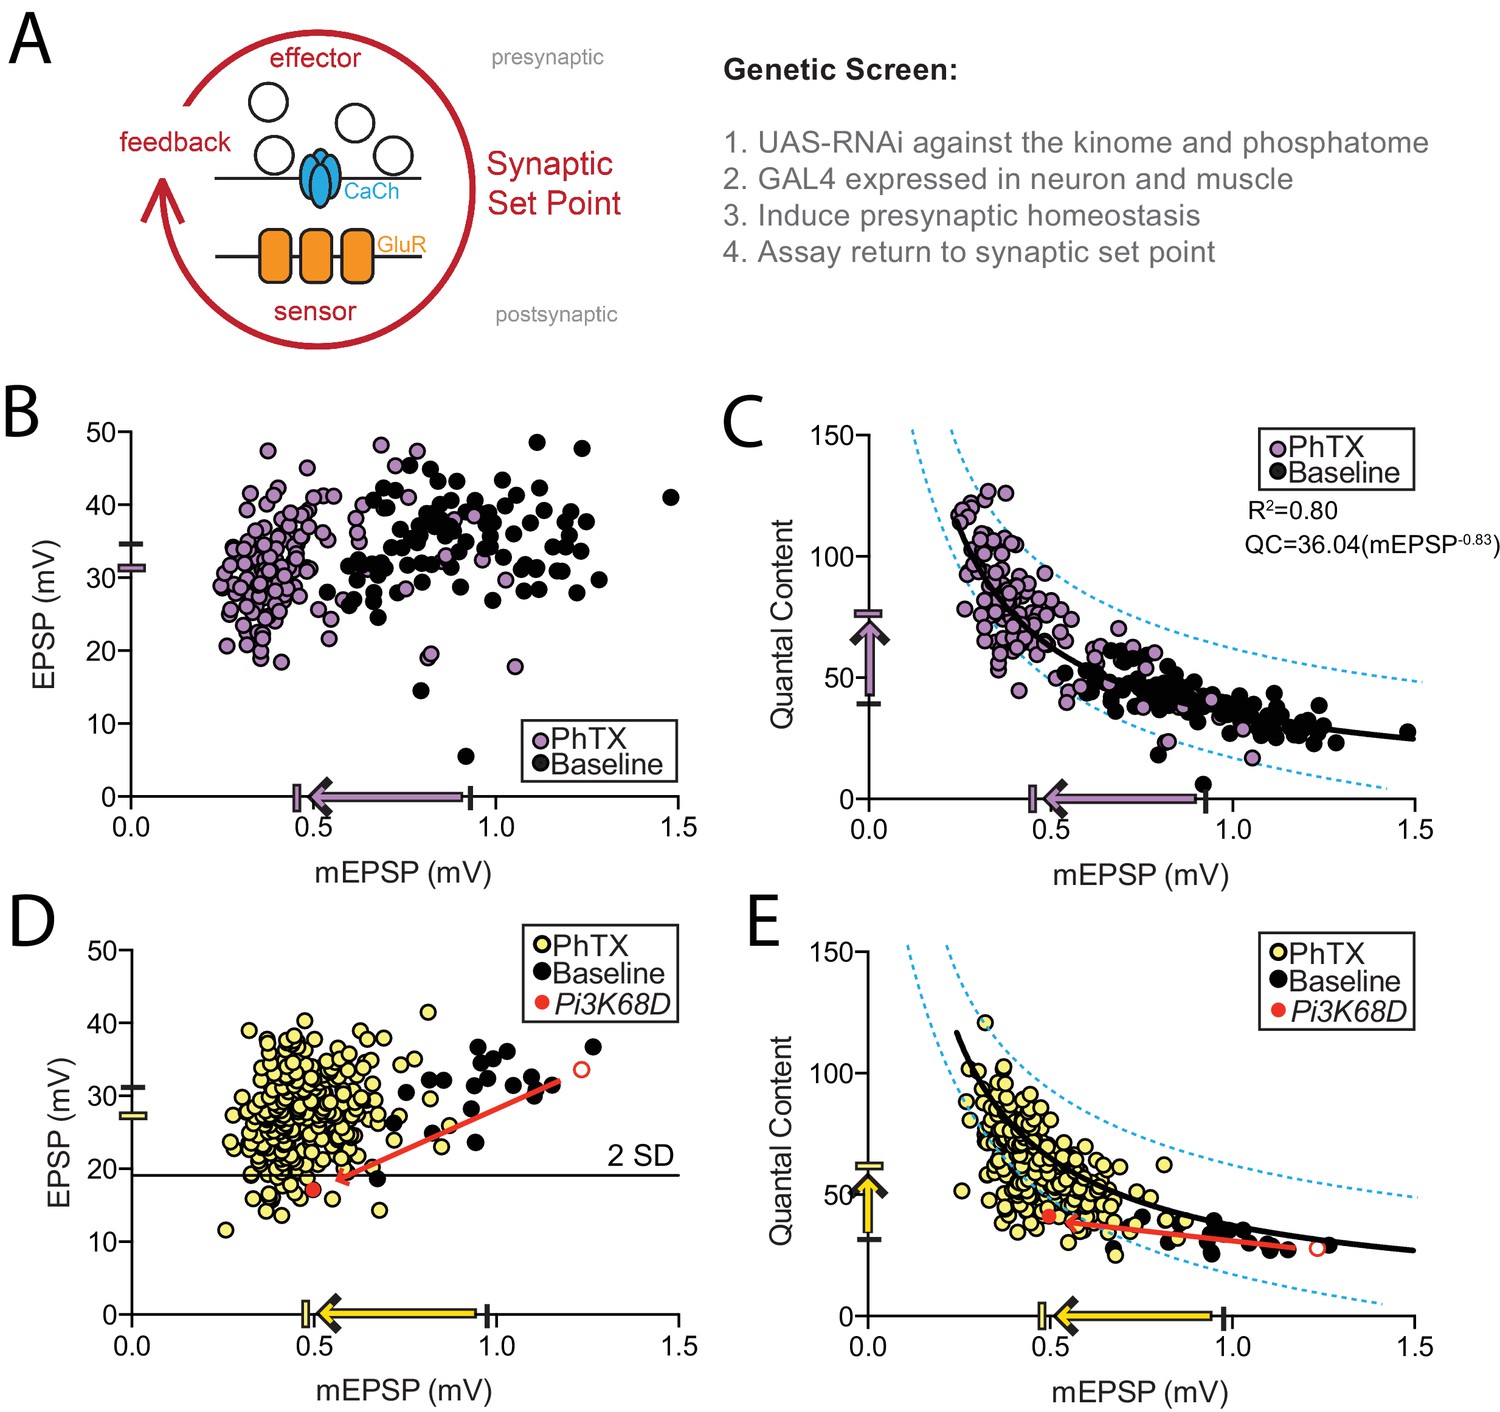
Screen of Drosophila kinome and phosphatome in presynaptic homeostatic plasticity.
(A) Schematic highlighting the trans-synaptic nature of presynaptic homeostatic plasticity. The 'synaptic set point’ is operationally defined as the combined action of all pre- and postsynaptic parameters that reliably specify the transfer of information at the synapse. The synaptic set point is stably maintained by a trans-synaptic, homeostatic signaling circuit (red arrow) that includes postsynaptic sensors, retrograde feedback signaling, and presynaptic effectors that drive changes in presynaptic vesicle release. At right, the forward genetic screen of the Drosophila kinome and phosphatome is outlined. (B–C) Each point represents average data from a single NMJ. Purple points are in the presence of PhTX. Black points are in the absence of PhTX (baseline). The black hash marks on X and Y axes designate average mEPSP and EPSP amplitudes, respectively, without PhTX. The purple hash marks are averages in the presence of PhTX. The black line in (C) is a power curve fit, equation indicated on graph. The dotted blue lines encompass 95% of all wild-type data points. Recordings made at 0.35 mM [Ca2+]e. (D–E) Screen data of kinase and phosphatase UAS-RNAi driven by muscle and neuron GAL4 plotted as in (B–C) except that each point represent genotypic averages, yellow points (+PhTX) and black circles (-PhTX, baseline). The black line in (D) denotes two standard deviations below the population mean EPSP amplitude of control genotypes from (B). In (D) and (E) the red dot represents GAL4, UAS-RNAi for Pi3K68D.The black line in (E) is the same curve fit to the control data set in C, layered onto the experimental screen data for comparison. Blue dotted lines as in (C). Recordings made at 0.35 mM [Ca2+]e.
Figure 1—figure supplement 1
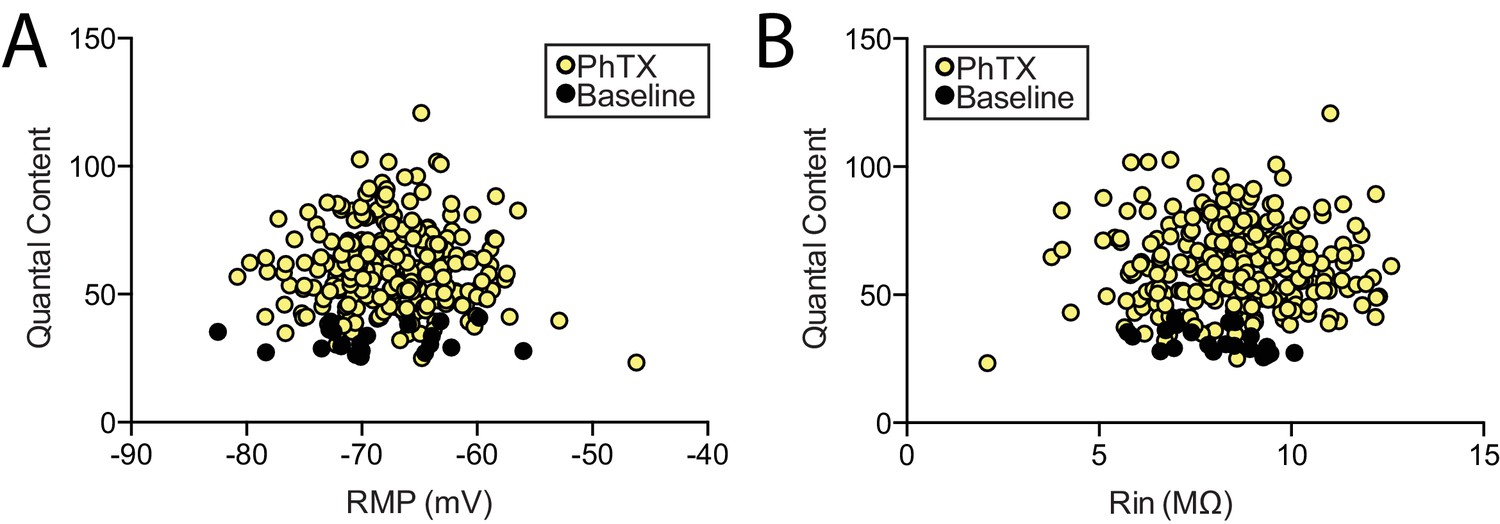
Quantification of additional screening parameters.
(A–B) Resting membrane potential (A) and input resistance (B) plotted versus quantal content in the presence (yellow) or absence (black) of PhTX. Each data point is a genotypic average. No correlations are observed.
Figure 2
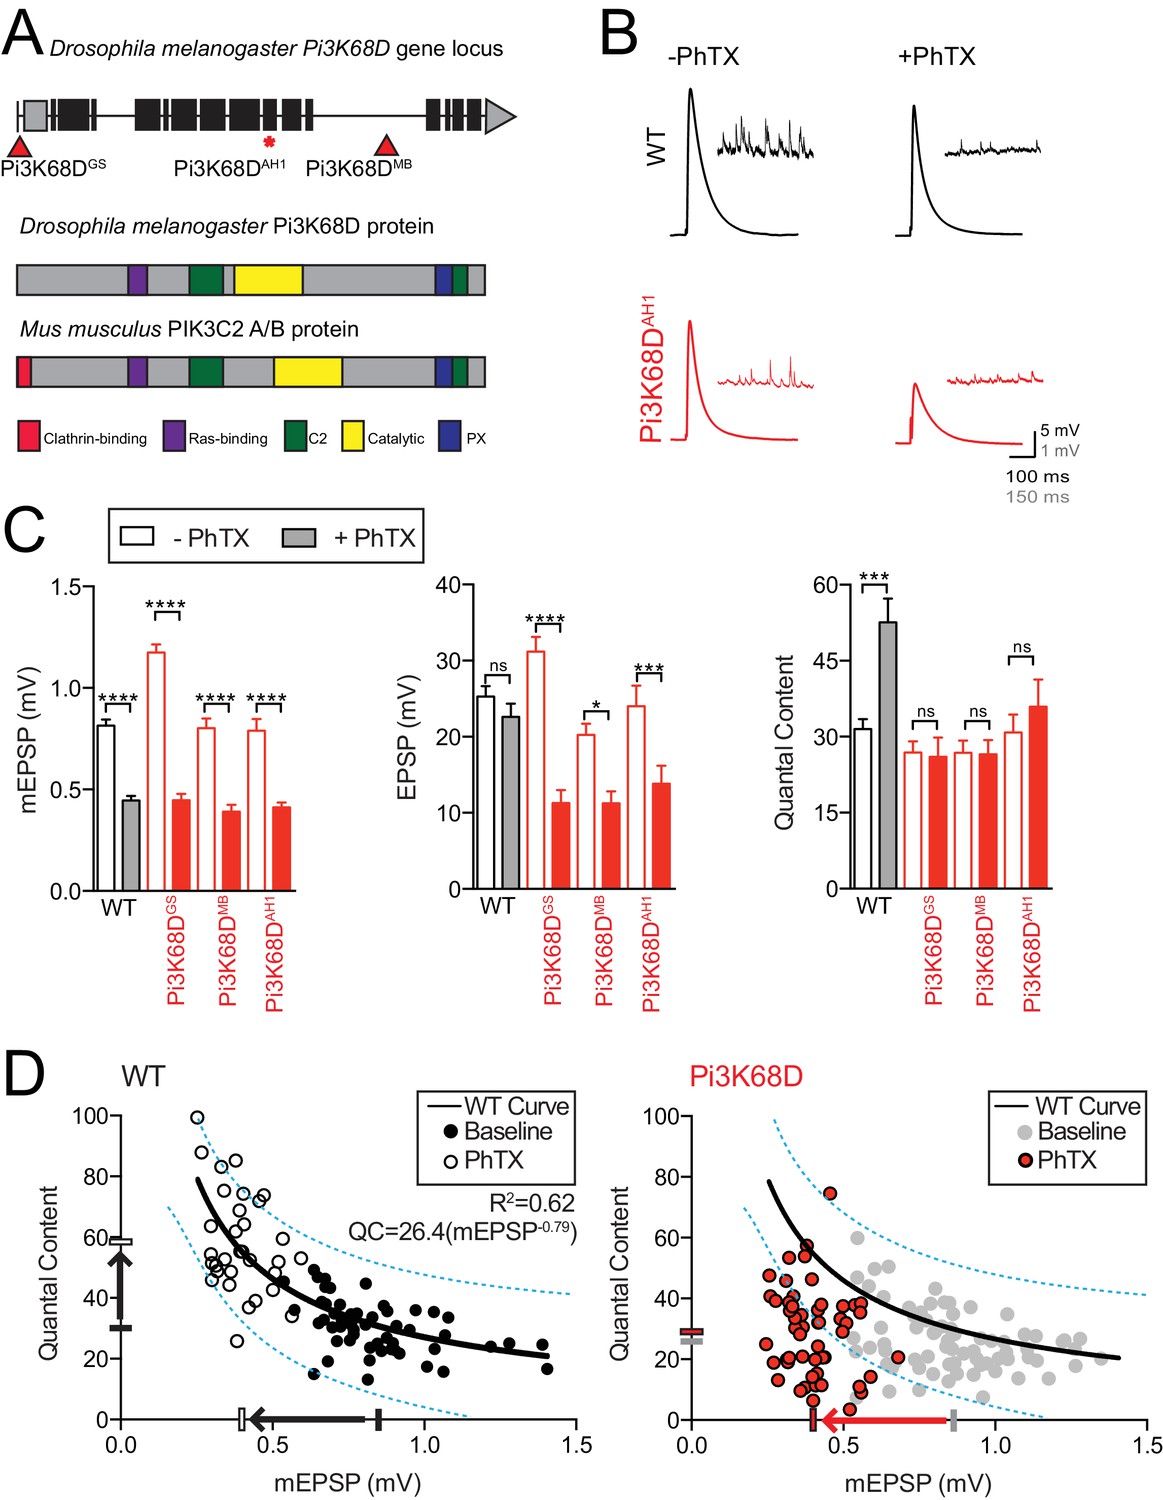
Mutations in Pi3K68D block the rapid expression of presynaptic homeostatic plasticity.
(A) Top: Schematic of the Pi3K68D gene locus with mutations indicated. Below: Pi3K68D protein domains are indicated and compared to mouse class II PI3K proteins. (B) Representative EPSP and spontaneous mEPSP in wild-type (black) and mutant Pi3K68D (red), in the absence or presence of PhTX as indicated. Recordings made at 0.3 mM [Ca2+]e. (C) Average mEPSP amplitude, EPSP amplitude, and presynaptic release (quantal content) in WT, Pi3K68DGS, Pi3K68DMB, and Pi3K68DAH1. Unfilled bars are in the absence of PhTX. Filled bars are in the presence of PhTX. Mean ± SEM; ns not significant, *p<0.05, **p<0.01, ***p<0.001, and ****p<0.0001; Student’s t-test. (D) Each point represents average data from an individual NMJ recording. For WT, recordings in absence of PhTX are filled black circles while those with PhTX are unfilled black circles. For Pi3K68D, recordings in absence of PhTX are grey circles while those with PhTX are red circles. The black or grey filled hash marks on the X and Y axes represent the average mEPSP amplitude and QC, respectively, without PhTX. The white and red hash marks on the X and Y axes represent average mEPSP amplitude and QC, respectively, with PhTX. The black line in the WT graph is a curve fit to this control data. The same wild-type curve-fit is overlaid on the Pi3K68D data for purposes of comparison. Dotted blue lies encompass 95% of wild-type data points. These same lines from wild-type are superimposed on the Pi3K68D graph, at right.
Figure 3 with 1 supplement
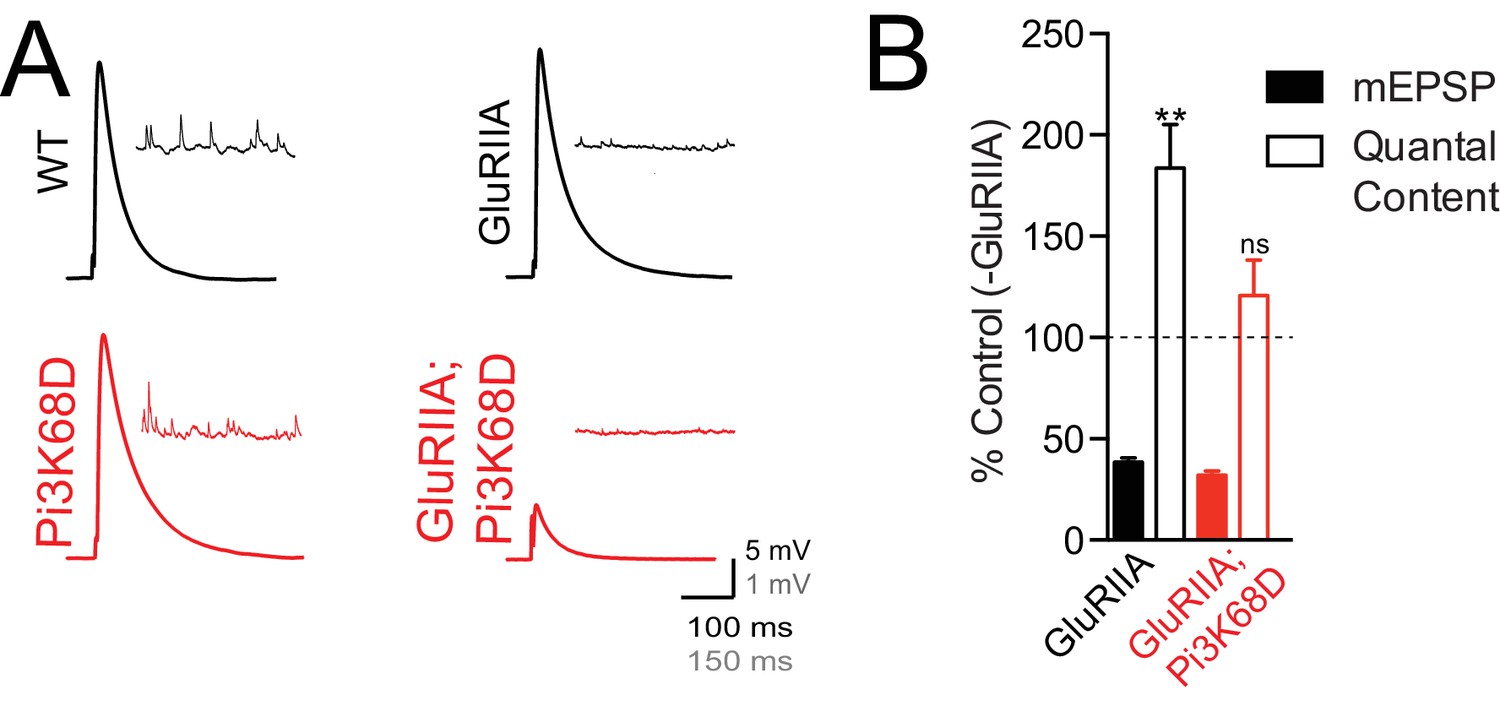
Loss of Pi3K68D blocks the sustained expression of presynaptic homeostatic plasticity.
(A) Representative EPSP and spontaneous mEPSP in wild-type (black) and Pi3K68DAH1 (red), at baseline or in the presence of the GluRIIA mutation as indicated. Recordings made at 0.3 mM [Ca2+]e. (B) Average percent change in mEPSP amplitude (filled bars) and quantal content (open bars) in loss of GluRIIA compared to baseline for indicated genotypes. Statistics comparing baseline and PhTX conditions for quantal content for indicated genotypes. Mean ± SEM; ns not significant, **p<0.01; Student’s t-test.
Figure 3—figure supplement 1
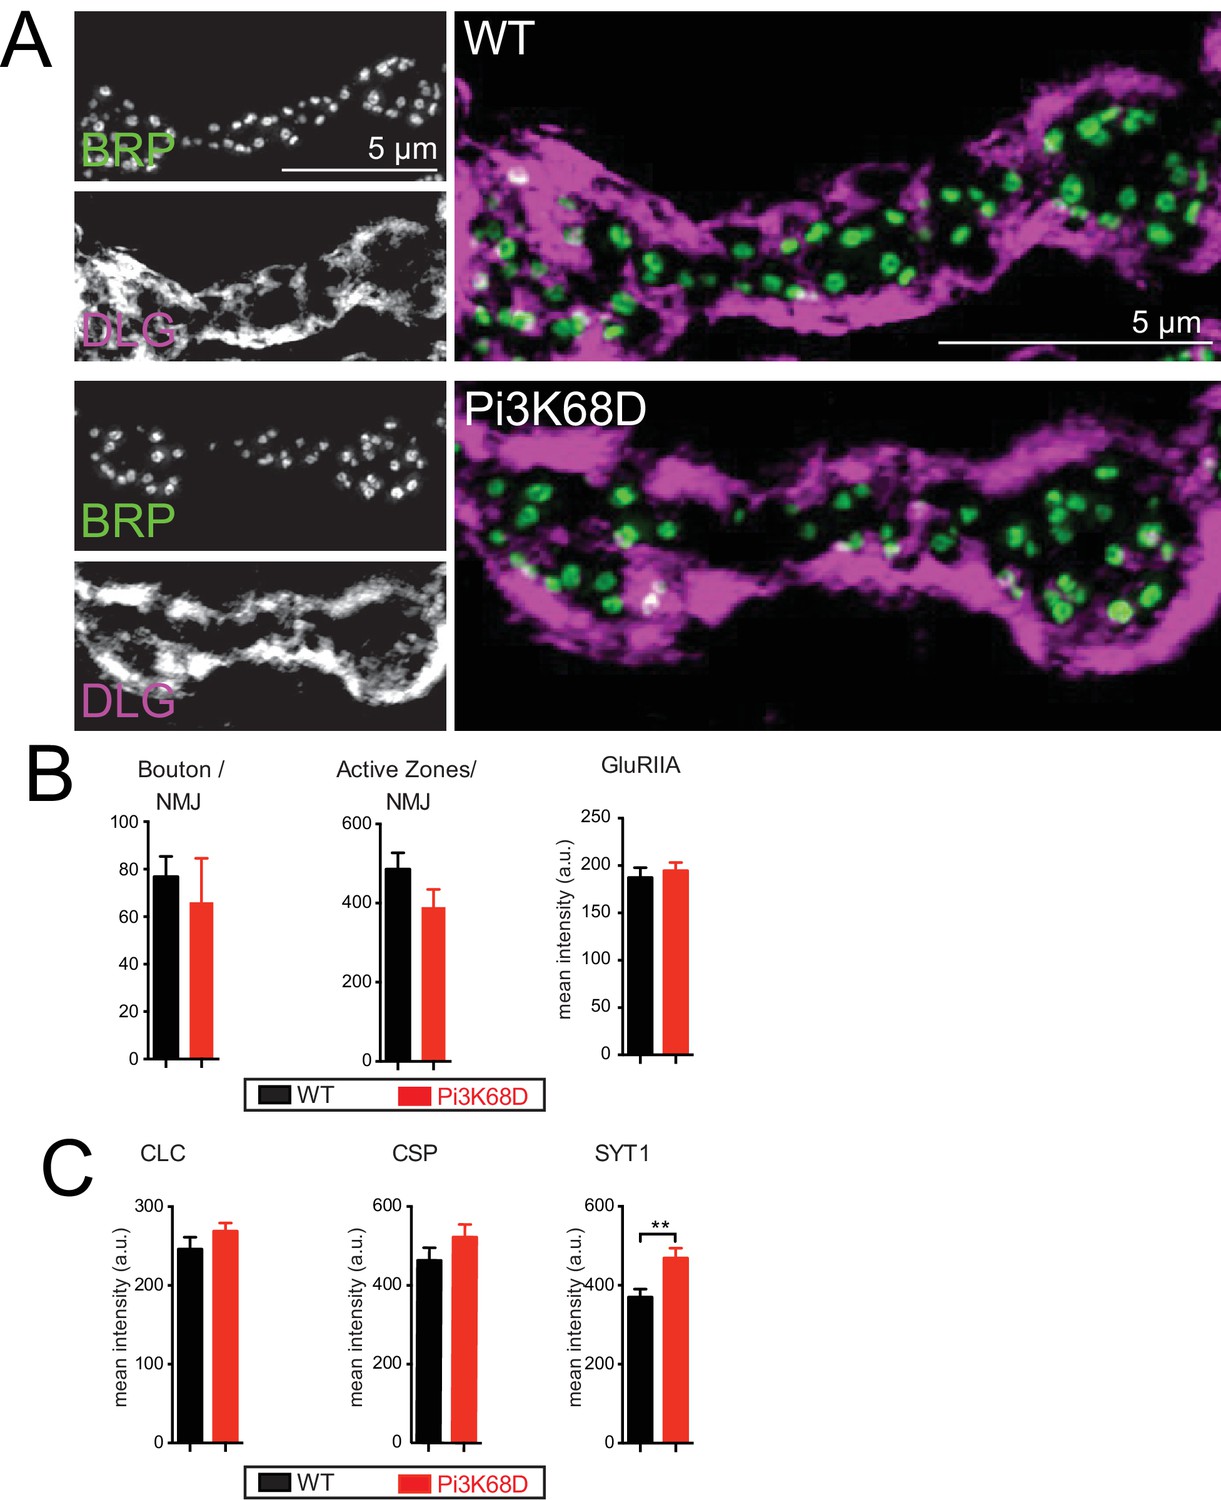
Normal NMJ anatomy.
(A) Representative images of synaptic boutons at the NMJ of WT and Pi3K68D at muscle 4. Imaged using structured illumination microscopy (SIM). NMJ are immunolabeled with anti-BRP (green) and anti-DLG (magenta). (B) Quantification of bouton number (number of synapses: WT n = 13; Pi3K68D n = 11), BRP puncta (active zones) (WT n = 13; Pi3K68D n = 11), and mean fluorescence intensity for anti-GluRIIA (number of synapses: WT n = 12; Pi3K68D n = 8), for 1b and 1 s boutons per muscle 6/7 in abdominal segment two for WT (black) and Pi3K68D AH1 (red). (C) Mean fluorescence intensity for synaptically localized anti-Clathrin Light Chain (anti-CLC) (number of synapses: WT N = 10, Pi3K68D N = 8), anti-Cysteine String Protein (CSP) (number of synapses: WT n = 13, Pi3K68D n = 17), and anti-Synaptogtamin-1 (SYT1) (Number of synapses: WT N = 13, Pi3K68D N = 17), for WT (black) and Pi3K68D AH1 (red), at muscle 6/7, segments 2 and 3. Mean ±SEM; **p<0.01. Student’s t-Test.
Figure 4
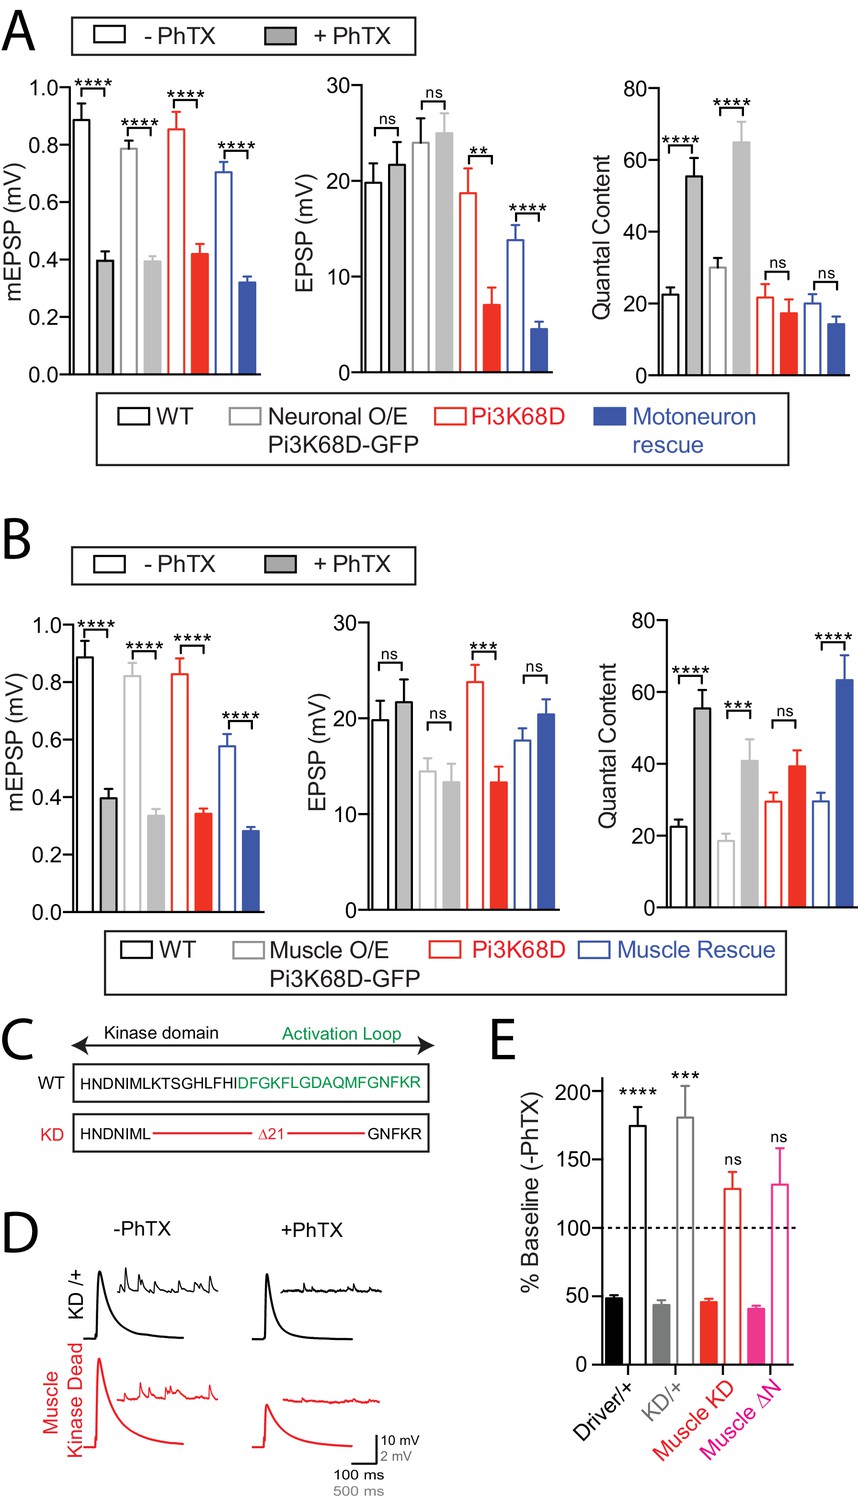
Postsynaptic Pi3K68D is necessary for presynaptic homeostatic plasticity.
(A) Average data for measures as indicated, for conditions, as indicated. Genotypes tested: UAS-Pi3K68D-GFP driven by OK371-GAL4; (light grey), Pi3K68DAH1 (red), and Pi3K68DAH1 with UAS-Pi3K68D-GFP driven by OK371-GAL4; (blue). Recordings made at 0.3 mM [Ca2+]e. (B) Data as in (A). Genotypes tested WT (data re-plotted from A for direct comparison; black), UAS-Pi3K68D-GFP driven by MHC-GAL4 (grey), Pi3K68D AH1 (red), and Pi3K68D AH1 with UAS-Pi3K68D-GFP driven by BG57-GAL4 (blue). Recordings made at 0.3 mM [Ca2+]e. (C) Schematic, beginning at Pi3K68D amino acid 1441, of the mutation used to generate a kinase-dead mutant transgene. (D) Representative EPSP and spontaneous mEPSP in UAS-Pi3K68D-KD/+ (black) and UAS-Pi3K68D-KD driven by BG57-GAL4 (red), in the absence or presence of PhTX as indicated. Recordings at 0.3 mM Ca2+. (E) Average percent change in mEPSP amplitude (filled bars) and quantal content (open bars) in PhTX compared to baseline in BG57-GAL4/+ (black), UAS-Pi3K68D-KD/+ (grey), UAS-Pi3K68D-KD driven by BG57-GAL4 (red), and UAS-Pi3K68D-∆N driven by BG57-GAL4, (magenta). Muscle driver is BG57-GAL4. Mean ±SEM; ns not significant, *p<0.05, **p<0.01, ***p<0.001, ****p<0.0001; Student’s t-test.
Figure 5 with 1 supplement
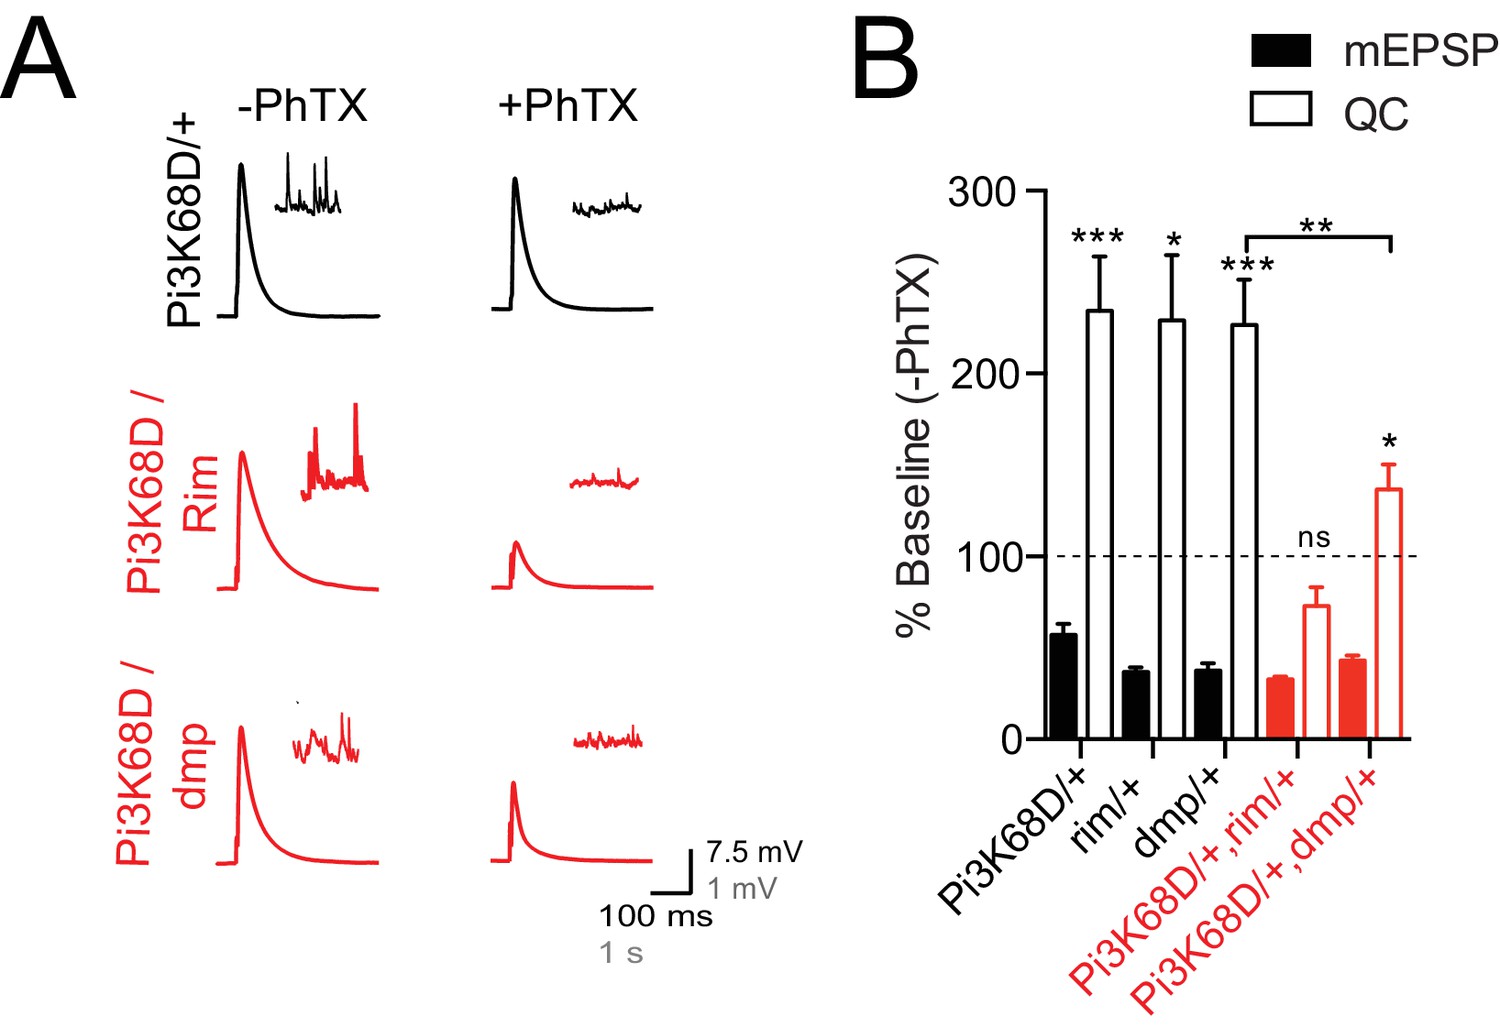
Pi3K68D interacts genetically with rim and dmp.
(A) Representative traces for EPSP and mEPSP in heterozygous controls (Pi3K68D AH1/+; black) and double heterozygous mutants Pi3K68D AH1/rim103 (red) and Pi3K68D AH1/dmpf0 (red) in the absence or presence of PhTX, as indicated. Recordings made at 0.3 mM [Ca2+]e. (B) Average percent change in mEPSP amplitude (filled bars) and quantal content (open bars) in PhTX compared to baseline in heterozygous controls: Pi3K68D AH1/+ (black), rim103/+ (black), and dmpf0/+ (black) and double heterozygous mutants: Pi3K68D AH1/rim103 (red) and Pi3K68D AH1/dmpf0 (red).
Figure 5—figure supplement 1
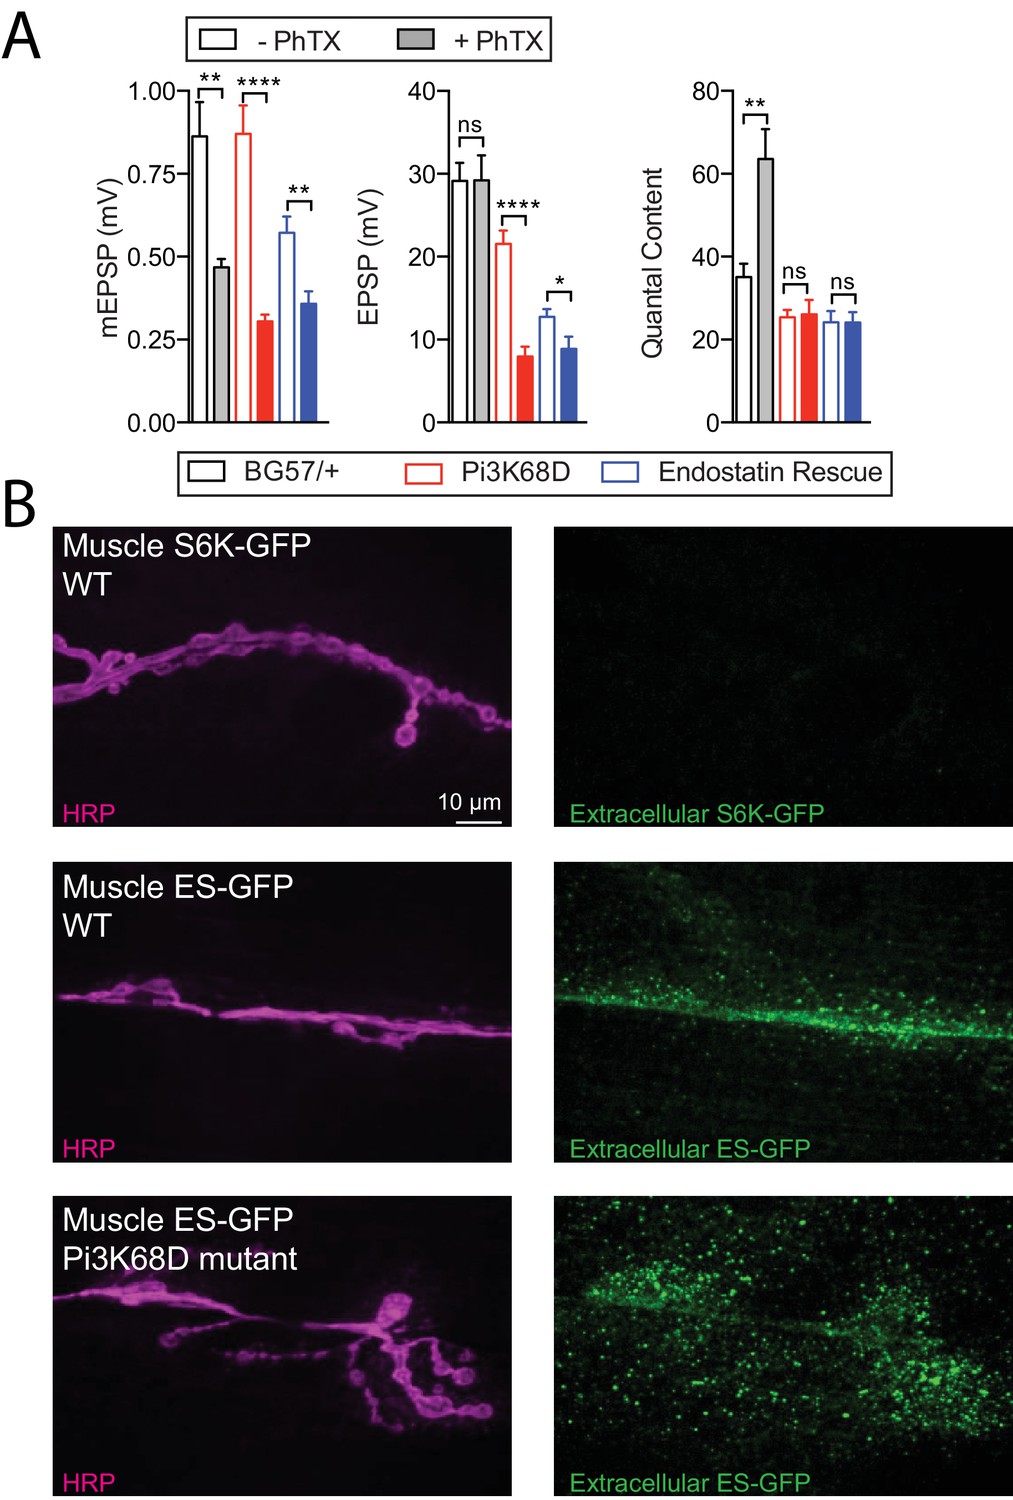
Endostatin does not rescue Pi3K68D.
(A) Average mEPSP amplitude, EPSP amplitude, and presynaptic release (quantal content) in control (BG57-GAL4/+), Pi3K68DAH1 (red), and endostatin (ES) rescue (UAS-ES-GFP; Pi3K68DAH1, BG57-GAL4, blue).
Unfilled bars are in the absence of PhTX. Filled bars are in the presence of PhTX. Mean ±SEM; ns not significant, *p<0.05, **p<0.01, ***p<0.001, and ****p<0.0001; Student’s t-test. Recordings at 0.3 mM [Ca2+]e. (B) Representative images of extracellular GFP antibody labeling (non-cell permeable labeling conditions) (green) and HRP (magenta) in control animals in which muscle-expressed UAS-S6K-GFP (driver = BG57 GAL4) shows no extracellular GFP, as predicted. By contrast, in the wild-type background, muscle-expressed ES-GFP (driver = BG57 GAL4) shows extensive extracellular GFP labeling, as do NMJ in which there is muscle-expressed ES-GFP (driver = BG57 GAL4) in the Pi3K68DAH1 background.
Figure 6 with 2 supplements
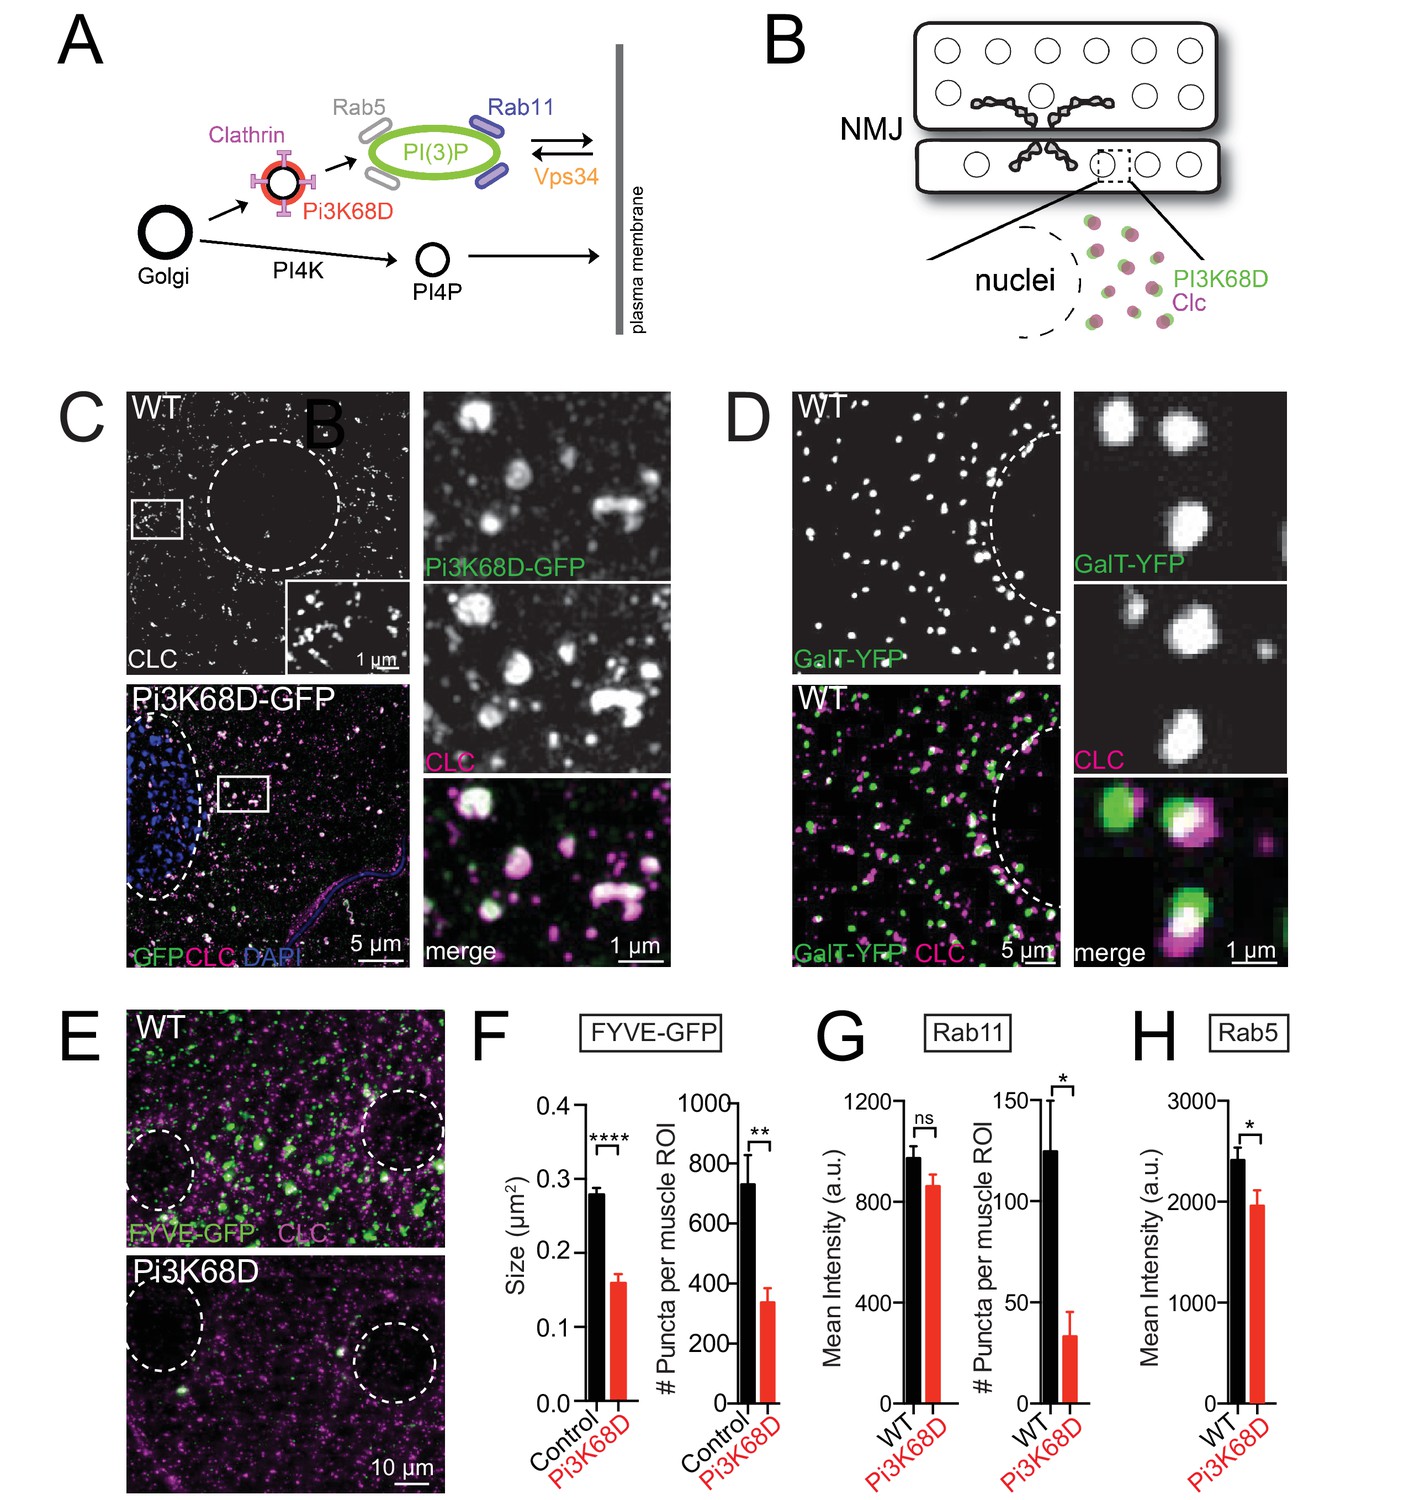
The role of Pi3K68D in endosomal and trans-Golgi signaling.
(A) A model of the Golgi and endosomal system illustrating proteins explored in this and subsequent figures. (B) A schematic of the NMJ, muscles 6 and 7. Large circles depict muscle nuclei. Synaptic boutons are outlined in black and filled gray. Dotted box indicates a region of interest (ROI). The ROI, expanded below, reveals the edge of a nucleus, and puncta defined by Pi3K68D (green) and CLC (magenta). This schematizes images presented in C-E. (C) Muscle ROI in WT and animals expressing UAS-Pi3K68D-GFP in muscle (MHC-GAL4). Staining as indicated; GFP (green) and CLC (magenta or white in WT image). Nuclei are outlined with a white dotted line. Insets at right. (D) ROI in muscle expressing GalT-YFP (trans-Golgi). Staining as indicated. Select puncta shown at higher magnification (right). (E) Muscle ROI in WT and Pi3K68D AH1 expressing UAS-2xFYVE-GFP. Staining as indicated. Nuclei as in (C). (F) FYVE-GFP puncta area and number per muscle ROI. Black is control (FYVE-GFP/+;BG57-GAL4/+). Red is FYVE-GFP/+;BG57-GAL4, Pi3K68D AH1/Pi3K68D AH1. Number of synapses: WT N = 10, Pi3K68D N = 9. (G) Rab11 mean intensity and puncta number per muscle ROI. WT (black) versus Pi3K68D AH1 (red). Number of synapses: WT N = 10, Pi3K68D N = 7. (H) Mean intensity per ROI of Rab5. WT (black) versus Pi3K68D AH1 (red). Number of synapses: WT N = 12, Pi3K68D N = 11. Mean ±SEM; ns not significant, *p<0.05, **p<0.01, ***p<0.001, and ****p<0.0001; Student’s t-test.
Figure 6—figure supplement 1
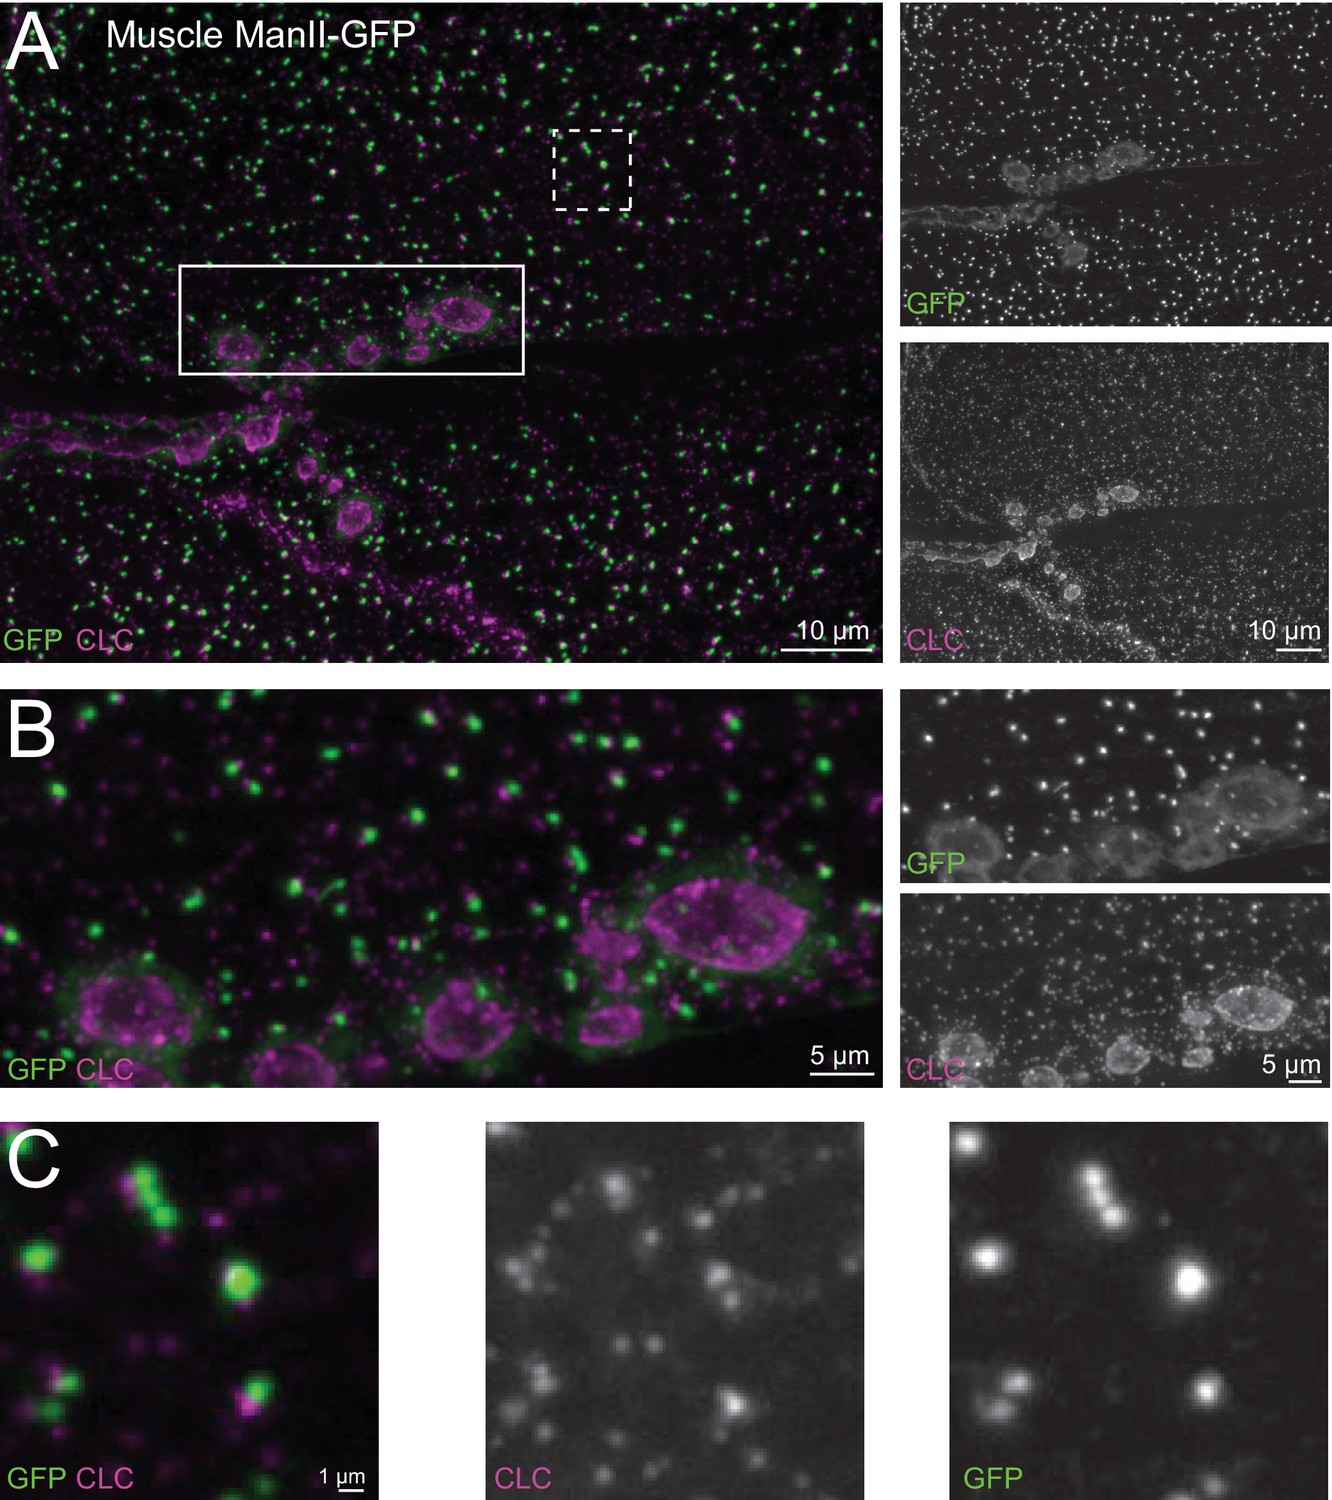
Distribution of ManII-GFP in muscle.
(A) Representative images of the NMJ at muscles 6/7 expressing ManII-GFP (medial-Golgi marker; MHC-GAL4) imaged using deconvolution microscopy. NMJ are immunolabeled with anti-GFP (green) and anti-CLC (magenta). (B) and (C). Insets are shown for the white boxes from (A).
Figure 6—figure supplement 2
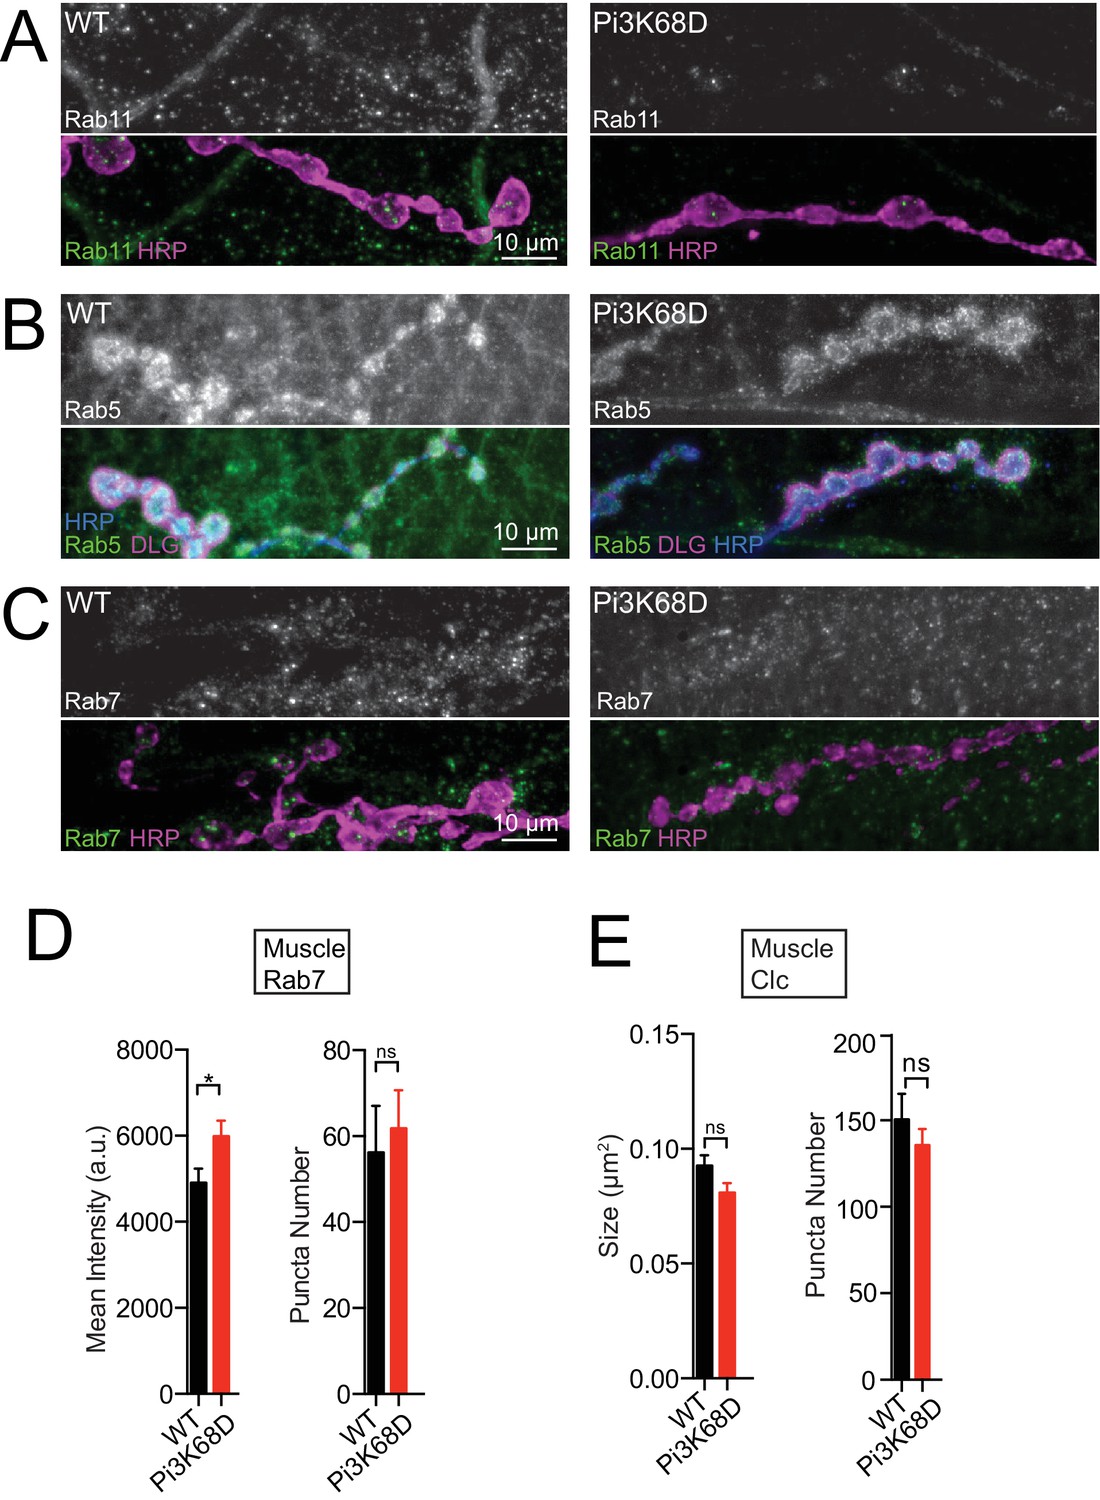
Images and quantification of endosomal antigens.
(A) Representative images of synaptic boutons at muscle six in WT and in Pi3K68D AH1, stained with anti-Rab11 (green) and anti-HRP (magenta). (B) Representative images as in (A) immunolabeled with anti-Rab5 (green), anti-DLG (discs large, magenta), and anti-HRP (blue). (C) Representative images as in (A) immunolabeled with anti-Rab7 (green) and anti-HRP (magenta). (D) Quantification of mean intensity and puncta number per muscle ROI for Rab7 (number of synapses: WT n = 12, Pi3K68D n = 12). WT (black) versus Pi3K68D AH1 (red). (E) Quantification of CLC as in (D) (Number of synapses: WT n = 10, Pi3K68D n = 9). Black is control (FYVE-GFP/+;BG57-GAL4/+). Red is FYVE-GFP/+;BG57-GAL4, Pi3K68D AH1/Pi3K68D AH1. Mean ±SEM; ns not significant, *p<0.05; Student’s t-Test.
Figure 7
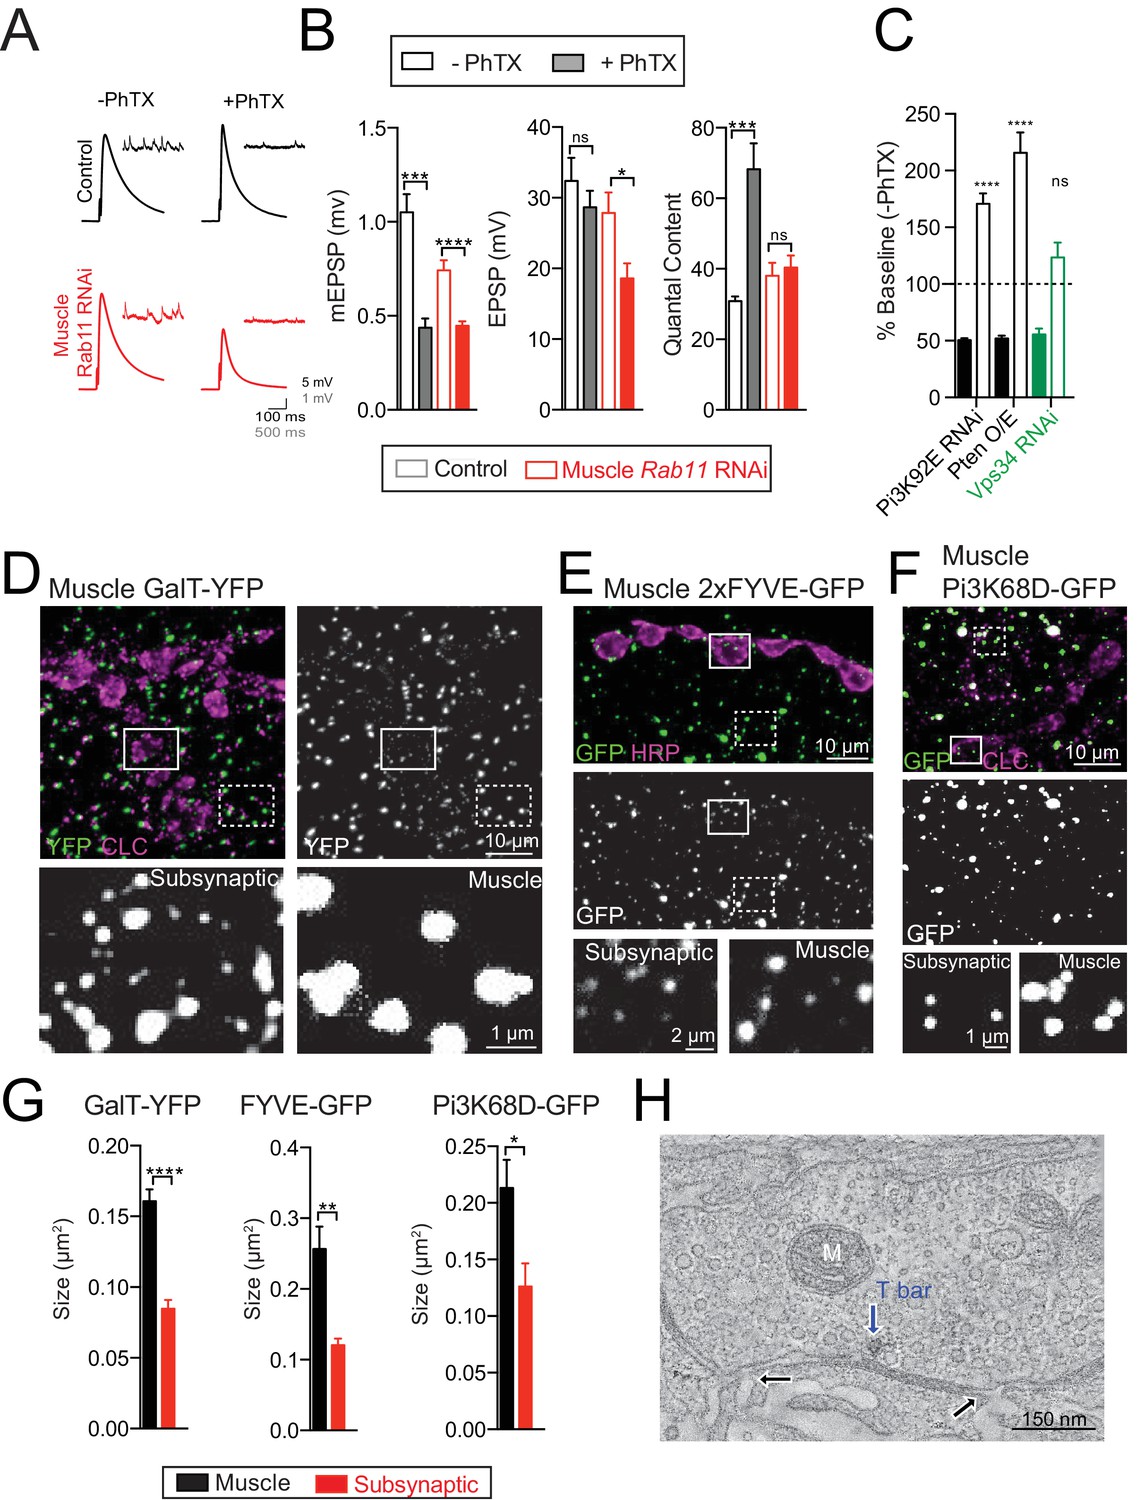
Sub-synaptic specialization of a trans-Golgi network.
(A) Representative traces for controls (BG57-GAL4/+; black) and UAS-Rab11-RNAi driven in muscle (red; BG57-GAL4) in the absence or presence of PhTX, as indicated. Recordings at 0.3 mM [Ca2+]e. (B) Genotypes tested are control (BG57-GAL4/+; grey) and UAS-Rab11-RNAi (red; muscle-expression via BG57-GAL4). (C) Average percent change in mEPSP amplitude (filled bars) and quantal content (open bars) in PhTX compared to baseline. UAS-Pi3K92E-RNAi (black; muscle-expression via MHC-GAL4), UAS-Pten over-expression (black; muscle-expression via BG57-GAL4), and UAS-Vps34-RNAi (green; muscle-expression via MHC-GAL4). (D) ROI from muscle expressing GalT-YFP using MHC-GAL4; GFP (green) and CLC (magenta). Insets directly below; dotted box muscle ROI, solid box synaptic ROI. (E) ROI as in (D) for muscle expressing 2X-FYVE-GFP using BG57-GAL4. GFP (green) and HRP (magenta). (F) ROI as in (D) for muscle expressing Pi3K68D-GFP using MHC-GAL4. GFP (green) and CLC (magenta). (G) Quantification of the area of GalT-YFP (Number of synapses: N = 10), FYVE-GFP (Number of synapses: N = 13), or Pi3K68D-GFP puncta (Number of synapses: N = 9), in a WT muscle ROI (black) vs. synaptic ROI (red). (H) Computational slice from EM tomogram of a bouton illustrating invaginations of muscle membrane (black arrows) opposite an active zone (as indicated by the blue arrow showing T-bar). M = mitochondria. Mean ±SEM; ns not significant, *p<0.05, **p<0.01, ***p<0.001, and ****p<0.0001; Student’s t-test for figure (B and G).
Figure 8 with 1 supplement
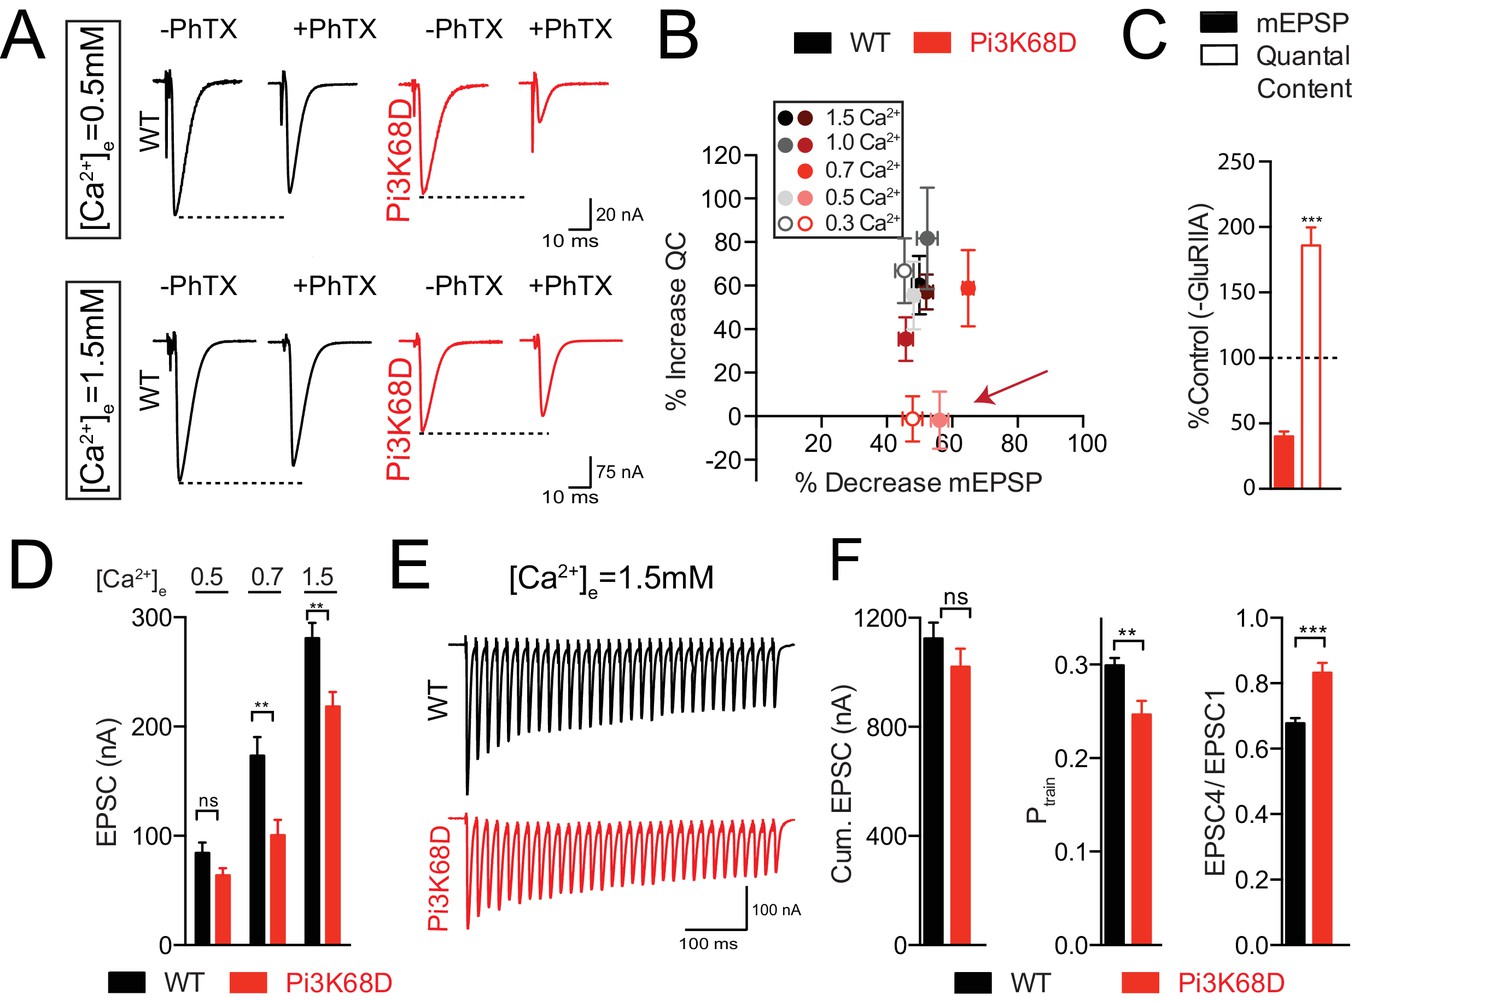
Calcium dependence of homeostatic plasticity in Pi3K68D mutants.
(A) Representative traces at 0.5 mM (A) and 1.5 mM (B) [Ca2+]e, in the absence or presence of PhTX as indicated. (B) Percent decrease mEPSP due to PhTX application is plotted against the percent increase in quantal content for the indicated calcium concentrations (inset). Red arrow highlights block of PHP at 0.3 and 0.5 mM [Ca2+]e. (C) Average percent change for mEPSP (filled bars) and quantal content (open bars) for Pi3K68D AH1;GluRIIAsp16 double mutants compared to Pi3K68D mutant alone. Recordings at 1.5 mM [Ca2+]e. (D) Average EPSC amplitude at 0.5, 0.7, and 1.5 mM [Ca2+]e as indicated for WT (black) and Pi3K68D AH1 (red). (E) Representative EPSCs during a stimulus train, calcium as indicated. WT (black) or Pi3K68D AH1 (red). (F) Cumulative EPSC (left), Ptrain (middle) and EPSC4/EPSC1 (right). WT (black) or Pi3K68D AH1 (red). Mean ±SEM; ns not significant, *p<0.05, **p<0.01, ***p<0.001 Student’s t-test.
Figure 8—figure supplement 1
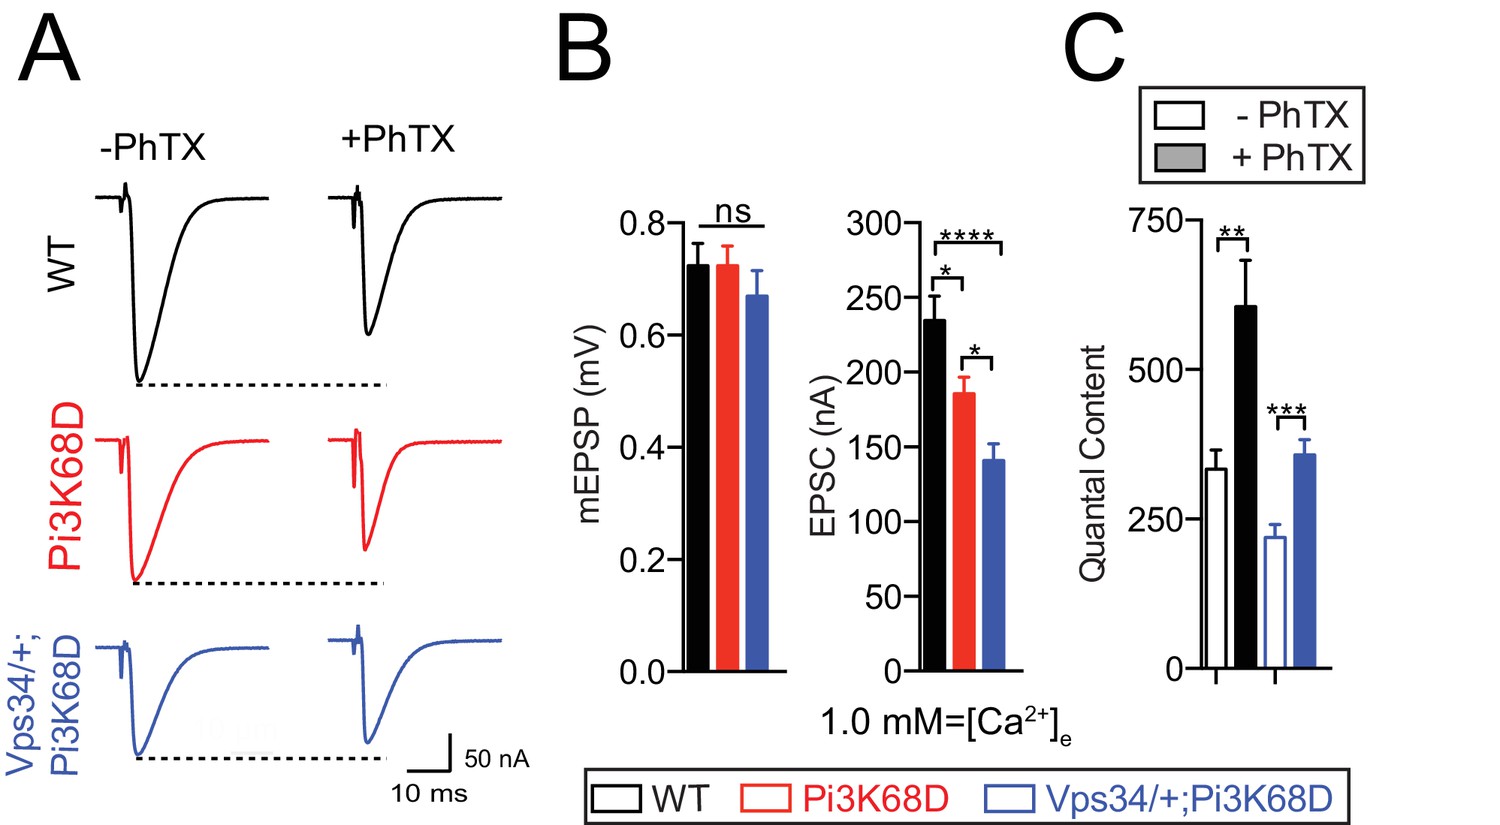
Loss of VPS34 does not enhance the phenotype of Pi3K68D.
(A) Representative EPSC traces at 1.0 mM [Ca2+]e. WT (black), Pi3K68DAH1 (red), and Vps34m22/+;Pi3K68DAH1 (blue) in the absence or presence of PhTX as indicated. (B) Average mEPSP amplitude and EPSC amplitude. WT (black), Pi3K68DAH1 (red), and Vps34m22/+;Pi3K68DAH1 (blue). 1.0 mM [Ca2+]e. (C) Average quantal content quantified. Unfilled bars are in the absence of PhTX. Filled bars are in the presence of PhTX as indicated. Genotypes tested are: WT (black) and Vps34m22/+;Pi3K68DAH1 (blue). 1.0 mM [Ca2+]e.
Figure 9
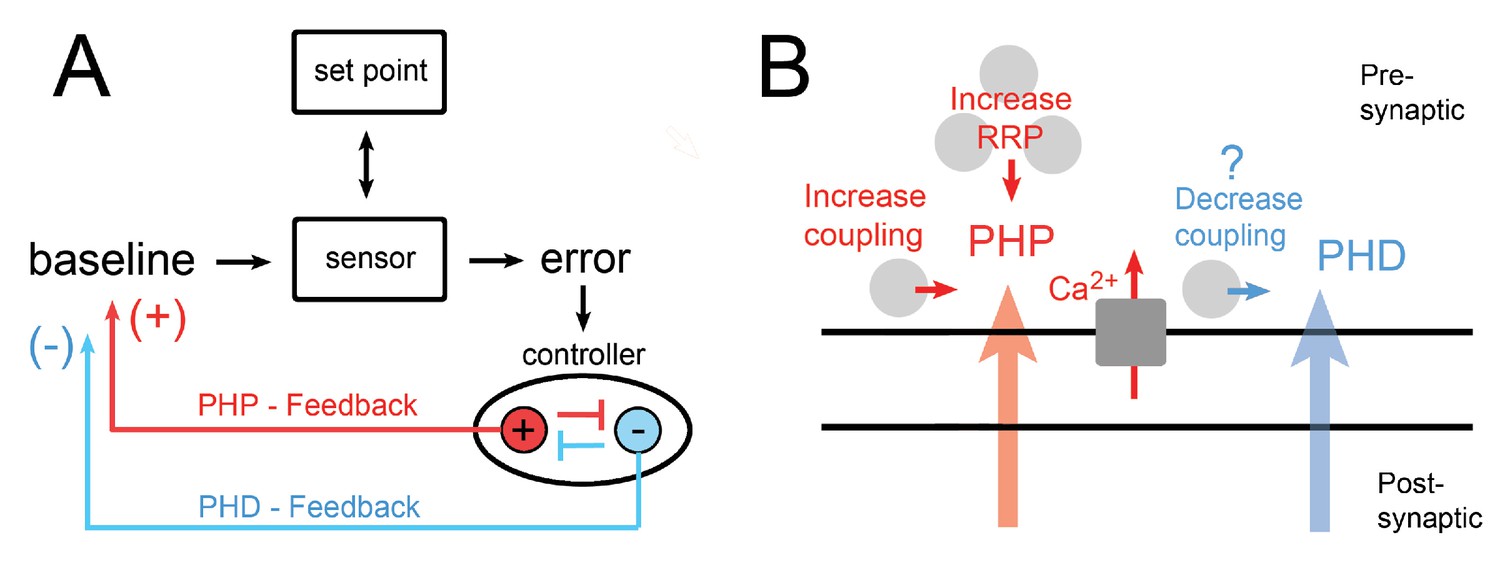
Model for the control of PHP and PHD from an endosomal ‘controller’.
(A) A model of homeostatic feedback control inclusive of feedback for both PHP and PHD. The sign for modulation of presynaptic release is indicated. We speculate that signaling pathway cross-inhibition allows for either PHP (red) or PHD (blue) to be selectively induced. When mEPSP amplitudes are decreased (PhTX), this is detected by the sensor and differs from the synaptic set point, causing an error signal to be generated. The error is then relayed to a homeostatic ‘controller’ where the error is integrated and signaling is induced corresponding to the specific induction of either PHP (red) or PHD (blue). We propose that cross pathway inhibition at the level of the controller allows for the specific induction of either PHP or PHD. We propose that the ‘controller’ is organized within the PI3K and Rab11-depedent recycling endosomal signaling platform and that loss of this signaling platform leads to inappropriate induction of PHD in the presence of PhTX, causing a mechanistic clash at the level of the presynaptic terminal. (B) A model of the neuromuscular junction, highlighting mechanisms of PHP in red (increased calcium influx, increased RRP, and increased vesicle coupling) and PHD in blue, for which very little is understood mechanistically.
Videos
Video 1
TEM tomogram of NMJ.
An electron microscopy tomogram to examine the NMJ, showing invaginations of muscle membrane opposite an active zone.
Tables
Table 1
Selected Hits from Screen
https://doi.org/10.7554/eLife.31535.004| Gene name | Driver | N | PhTX | RMP | Rin | mEPSP amplitude (mV) | EPSP amplitude (mV) | Quantal content |
|---|---|---|---|---|---|---|---|---|
| Control | Driver/+ | 94 | - | −67.0 ± 0.5 | 8.7 ± 0.2 | 0.93 ± 0.02 | 34.6 ± 0.6 | 39.3 ± 1.0 |
| Control | Driver/+ | 141 | + | −66.8 ± 0.5 | 8.7 ± 0.2 | 0.45 ± 0.01 | 31.5 ± 0.5 | 76.3 ± 1.8 |
| Pi3K68D | Sca-GAL4/+; BG57-GAL4/+ | 9 | - | −70.0 ± 1.9 | 6.6 ± 0.35 | 1.23 ± 0.07 | 33.6 ± 2.6 | 28.0 ± 2.6 |
| Pi3K68D | Sca-GAL4/+; BG57-GAL4/+ | 11 | + | −66.0 ± 1.3 | 7.1 ± 1.7 | 0.50 ± 0.09 | 17.2 ± 2.8 | 41.1 ± 2.3 |
| Vps34 | Sca-GAL4/+; BG57-GAL4/+ | 8 | - | −63.9 ± 1.35 | 5.8 ± 0.6 | 0.98 ± 0.05 | 32.4 ± 0.5 | 33.7 ± 4.2 |
| Vps34 | Sca-GAL4/+; BG57-GAL4/+ | 13 | + | −67.2 ± 1.7 | 6.1 ± 1.5 | 0.48 ± 0.04 | 20.9 ± 2.1 | 45.1 ± 4.4 |
| cdi | OK371-GAL4/+; BG57-GAL4/+ | 7 | - | −70.2 ± 1.3 | 8.3 ± 0.4 | 0.93 ± 0.05 | 28.2 ± 1.5 | 30.7 ± 2.2 |
| cdi | OK371-GAL4/+; BG57-GAL4/+ | 12 | + | 64.9 ± 1.6 | 8.5 ± 0.5 | 0.41 ± 0.03 | 13.6 ± 1.6 | 23.9 ± 4.9 |
| cg8726 | OK371-GAL4/+; BG57-GAL4/+ | 12 | - | −73.5 ± 1.9 | 8.9 ± 0.4 | 1.1 ± 0.11 | 30.9 ± 2.4 | 28.9 ± 2.4 |
| cg8726 | OK371-GAL4/+; BG57-GAL4/+ | 8 | + | −66.7 ± 1.7 | 10.0 ± 0.4 | 0.45 ± 0.03 | 17.1 ± 1.8 | 39.3 ± 4.2 |
| CamKII | OK371-GAL4/+; BG57-GAL4/+ | 7 | - | −64.1 ± 1.3 | 7.8 ± 0.5 | 0.83 ± 0.03 | 24.9 ± 2.7 | 30.5 ± 3.7 |
| CamKII | OK371-GAL4/+; BG57-GAL4/+ | 7 | + | −61.0 ± 2.3 | 6.7 ± 1.6 | 0.41 ± 0.05 | 17.7 ± 1.4 | 46.0 ± 5.9 |
Key resources table
| Reagent type (species) or resource | Designation | Source or reference | Identifier | Additional information |
|---|---|---|---|---|
| Gene (Drosophila melanogaster) | Pi3K68D | NA | FLYB: FBgn0015278 | |
| Gene (D. melanogaster) | Rab11 | NA | FLYB: FBgn0015790 | |
| Gene (D. melanogaster) | Vps34 | NA | FLYB: FBgn0015277 | |
| Strain/strain background | WT; w1118 | NA | w1118 | |
| Genetic reagent (D. melanogaster) | GluRIIAsp16; GluRIIA | (Petersen et al., 1997) PMID: 9427247 | FLYB: FBal0085982 | |
| Genetic reagent (D. melanogaster) | elavC155-GAL4 | BDSC: 458 | FLYB: FBst0000458 | Flybase symbol: P {w[+mW_hs]=GawB} elav[C155] |
| Genetic reagent (D. melanogaster) | OK371-GAL4 | (Mahr and Aberle, 2006) PMID: 16378756 | ||
| Genetic reagent (D. melanogaster) | MHC-GAL4 | (Petersen et al., 1997) PMID: 9427247 | ||
| Genetic reagent (D. melanogaster) | BG57-GAL4 | (Budnik et al., 1996) PMID: 8893021 | ||
| Genetic reagent (D. melanogaster) | rim103; rim | (Müller et al., 2012) PMID: 23175813 | ||
| Genetic reagent (D. melanogaster) | dmpf07253; dmp | Bloomington Stock Center | BDSC: 19062; FLYB: FBst0019062 | Flybase symbol: w[1118]; PBac{w[+mC]=WH}Mp[f07253] |
| Genetic reagent (D. melanogaster) | Pi3K68D-RNAi | Exelixis Collection | HMS:01296 | |
| Genetic reagent (D. melanogaster) | UAS-Pi3K68D: GFP | (Velichkova et al., 2010) PMID: 20696708 | ||
| Genetic reagent (D. melanogaster) | Vps34m22 | (Juhász et al., 2008) PMID: 18474623 | ||
| Genetic reagent (D. melanogaster) | Pi3K68D-MB | Bloomington Drosophila Stock Center | BDSC: 26363; FLYB FBst0026363 http://flybase.org/cgi-bin/uniq.html?FBst0026363%3Efbst | Flybase symbol: w[1118]; Mi{ET1}Pi3K68D[MB08286] CG14131[MB08286] |
| Genetic reagent (D. melanogaster) | Pi3K68D-GS | Kyoto Stock Center | KSC: 203158 | Flybase symbol: y[1] w[67c23]; P{w[+mC]=GSV7}GS21729/TM3, Sb[1] Ser[1] |
| Genetic reagent (D. melanogaster) | nos-GAL4VP14, UAS-cas9 | (Port et al., 2014) PMID: 25002478 | ||
| Genetic reagent (D. melanogaster) | PI3K Class I Pi3K92E RNAi | Bloomington Drosophila Stock Center | BDSC: 27690; FLYB: FBst0027690 | Flybase symbol: y[1] v[1]; P{y[+t7.7] v[+t1.8]=TRiP.JF02770}attP2/TM3, Sb[1] |
| Genetic reagent (D. melanogaster) | PI3K Class III RNAi; Vps34 RNAi | Bloomington Drosophila Stock Center | BDSC: 33384; FLYB: FBst0033384 | Flybase symbol: y[1] sc[*] v[1]; P{y[+t7.7]v[+t1.8]=TRiP.HMS00261}attP2/TM3, Sb[1] |
| Genetic reagent (D. melanogaster) | Pten-RNAi | Bloomington Drosophila Stock Center | BDSC: 33643; FLYB: FBst0033643 | Flybase symbol: y[1] v[1]; P{y[+t7.7] v[+t1.8]=TRiP.HMS00044}attP2TRiP.HMS00044}attP2 |
| Genetic reagent (D. melanogaster) | UAS-GFP-myc-2XFYVE | Bloomington Drosophila Stock Center | BDSC: 42712; FLYB FBst0042712 | Flybase symbol: w[*]; P{w[+mC]=UAS-GFP-myc-2xFYVE}2 |
| Genetic reagent (D. melanogaster) | UAS-Rab11 RNAi | Vienna Drosophila RNAi Center | VDRC: 22198; FLYB FBst0454467 | Flybase symbol: w[1118]; P{GD11761}v22198 |
| Genetic reagent (D. melanogaster) | UAS-ManII-GFP | (Ye et al., 2007) PMID: 17719548 | ||
| Genetic reagent (D. melanogaster) | UAS-GalT-YFP | (Ye et al., 2007) PMID: 17719548 | ||
| Genetic reagent (D. melanogaster) | UAS-endostatin | (Meyer and Moussian, 2009) PMID: 19469789 | ||
| Genetic reagent (D. melanogaster) | UAS-endostatin-GFP | (Meyer and Moussian, 2009) PMID: 19469789 | ||
| Genetic reagent (D. melanogaster) | Pi3K68DAH1 | This paper | Indel mutation, premature stop codon at amino acid 1440, made with CRISPR-CAS9 | |
| Genetic reagent (D. melanogaster) | UAS-Pi3K68D-∆21; UAS-Pi3K68D-KD | This paper | Generated using site-directed mutagenesis with primers TTTGGAAACTTTAAGAGAGATC and CATGATGTTGTCATTGTGG then subsequently cloned into 1100 mCherry. | |
| Genetic reagent (D. melanogaster) | UAS-Pi3K68D-∆N | This paper | Primers CACCATGAACGACACCGCCTCCGAC and GTTCCTGGACACCGCGCCC were used to amplify Pi3K68D-∆N, which was then cloned into destination vector 1100 mCherry | |
| recombinant DNA reagent | Pi3K68D gRNA | This paper | ACAGCACTCTGGTACTCGAG for generation of Pi3K68DAH1 | |
| recombinant DNA reagent | pCDF3-dU6:3gRNA vector | Addgene | Addgene plasmid #49410 | |
| recombinant DNA reagent | pENTR/D-TOPO | Invitrogen | K240020 | |
| recombinant DNA reagent | destination vector 1100 mCherry | NA | Gift from Dion Dickman | |
| Antibody | anti-BRP (mouse monoclonal) | Developmental Studies Hybridoma Bank | DSHB: nc82 | 1:100, Bouin’s fixative |
| Antibody | anti-Discs large; anti-DLG (rabbit) | (Budnik et al., 1996) PMID 8893021 | 1:1,000, Bouin’s fixative | |
| Antibody | anti-GFP (mouse monoclonal) | Invitrogen | Invitrogen clone 3E6; A-11120 | 1:500, Bouin’s fixative |
| Antibody | anti-GluRIIA (mouse monoclonal) | Developmental Studies Hybridoma Bank | DSHB: 8B4D2 (MH2B) | 1:100, Bouin’s fixative |
| Antibody | anti-GluRIIB (rabbit polyclonal) | (Marrus et al., 2004) PMID 14960613 | 1:2500, Bouin’s fixative | |
| Antibody | anti-CLC (rabbit polyclonal) | (Heerssen et al., 2008) PMID: 18356056 | 1:1000, 4% PFA | |
| Antibody | Anti-CSP (mouse monoclonal) | (Zinsmaier et al., 1990) PMID 2129171 | 1:250, 4% PFA | |
| Antibody | Anti-Syt1 (rabbit polyclonal) | Other | 1:1000, 4% PFA, gift from Troy Littleton | |
| Antibody | Anti-Rab5 (guinea pig polyclonal) | (Tanaka and Nakamura, 2008) PMID: 18272590 | 1:1000, 4% PFA, gift from Tsubasa Tanaka | |
| Antibody | Anti- Rab7 (rabbit polyclonal) | (Tanaka and Nakamura, 2008) PMID: 18272590 | 1:1000, 4% PFA, gift from Tsubasa Tanaka | |
| Antibody | Anti-Rab11 (rabbit polyclonal) | (Tanaka and Nakamura, 2008) PMID: 18272590 | 1:1000, 4% PFA, gift from Tsubasa Tanaka | |
| Antibody | Alexa conjugated secondary antibodies (488, 555, 647) | Jackson Immuno-research laboratories | 1:500 | |
| Sequence based reagent | Primers for sequencing Pi3K68D CRISPR mutation | GTTTCCAAACATCTGAGCATCG and ATGACTTGCAGCAGGATCAG | ||
| Software, algorithm | mEPSP analysis | Synaptosoft | Mini Analysis 6.0.0.7 | |
| Software, algorithm | EPSP analysis | (Ford and Davis, 2014) | ||
| Software, algorithm | EPSC, Pr, RRP, train analysis | (Müller et al., 2015) |
Additional files
-
Supplementary file 1
Source data for all electrophysiological data for all figures and supplemental figures.
Data includes mEPSP amplitudes, EPSP or EPSC amplitudes, quantal contents, and sample size (N).
- https://doi.org/10.7554/eLife.31535.019
-
Transparent reporting form
- https://doi.org/10.7554/eLife.31535.020
Download links
A two-part list of links to download the article, or parts of the article, in various formats.
Downloads (link to download the article as PDF)
Open citations (links to open the citations from this article in various online reference manager services)
Cite this article (links to download the citations from this article in formats compatible with various reference manager tools)
A postsynaptic PI3K-cII dependent signaling controller for presynaptic homeostatic plasticity
eLife 7:e31535.
https://doi.org/10.7554/eLife.31535


