Alterations of in vivo CA1 network activity in Dp(16)1Yey Down syndrome model mice
- RIKEN, Brain Science Institute, Japan
Figures
Figure 1 with 2 supplements
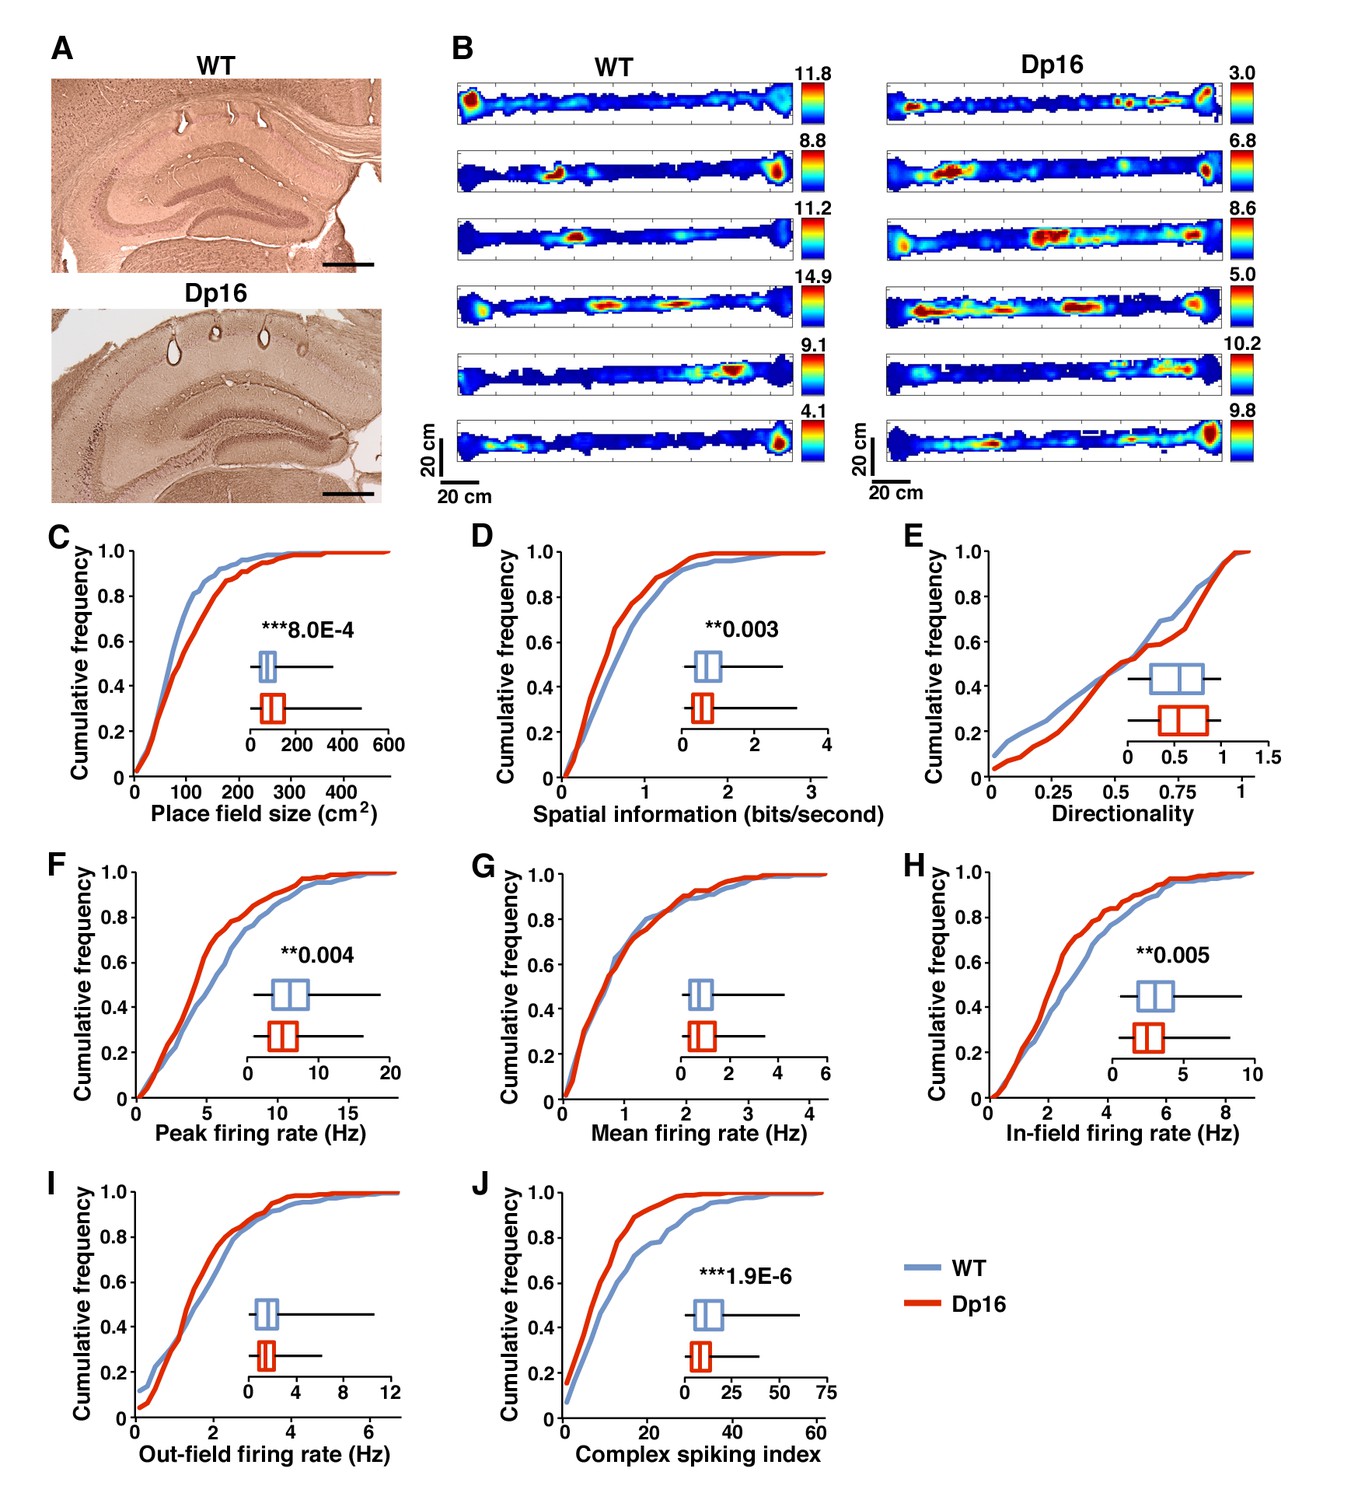
Poorer spatial coding and decreased bursting in Dp(16)1Yey mice during exploration.
(A) Example of tetrode positioning in the dorsal CA1 pyramidal cell layer of WT (upper) and Dp(16)1Yey (lower) mice. (B) Examples of color-coded firing rate maps of CA1 place cells during exploration of a 170 × 10 cm linear track. Red indicates peak firing rate in Hz (value for each cell indicated on the right of each map) while blue represents no firing. (C) Place field size was significantly larger in Dp(16)1Yey mice. (D) The spatial information content encoded per second by pyramidal cells was significantly lower in Dp(16)1Yey mice. (E) The firing rate directionality was comparable between the Dp(16)1Yey and WT groups. Pyramidal cells’ peak firing rate (F) was significantly lower in the Dp(16)1Yey group whereas their mean firing rate (G) remained comparable to the WT group. The firing rate within the place field (H) was significantly lower in Dp(16)1Yey mice, but this was not the case outside the place fields (I). The complex spiking index (J) was significantly decreased in the Dp(16)1Yey group. Statistical significance was assessed using Mann-Whitney U-test with significance set at (**) p<0.01 and (***) p<0.001. Scale bars in (A) correspond to 500 μm.
-
Figure 1—source data 1
Pyramidal cells characteristics during exploratory activity - full data set.
- https://doi.org/10.7554/eLife.31543.005
Figure 1—figure supplement 1
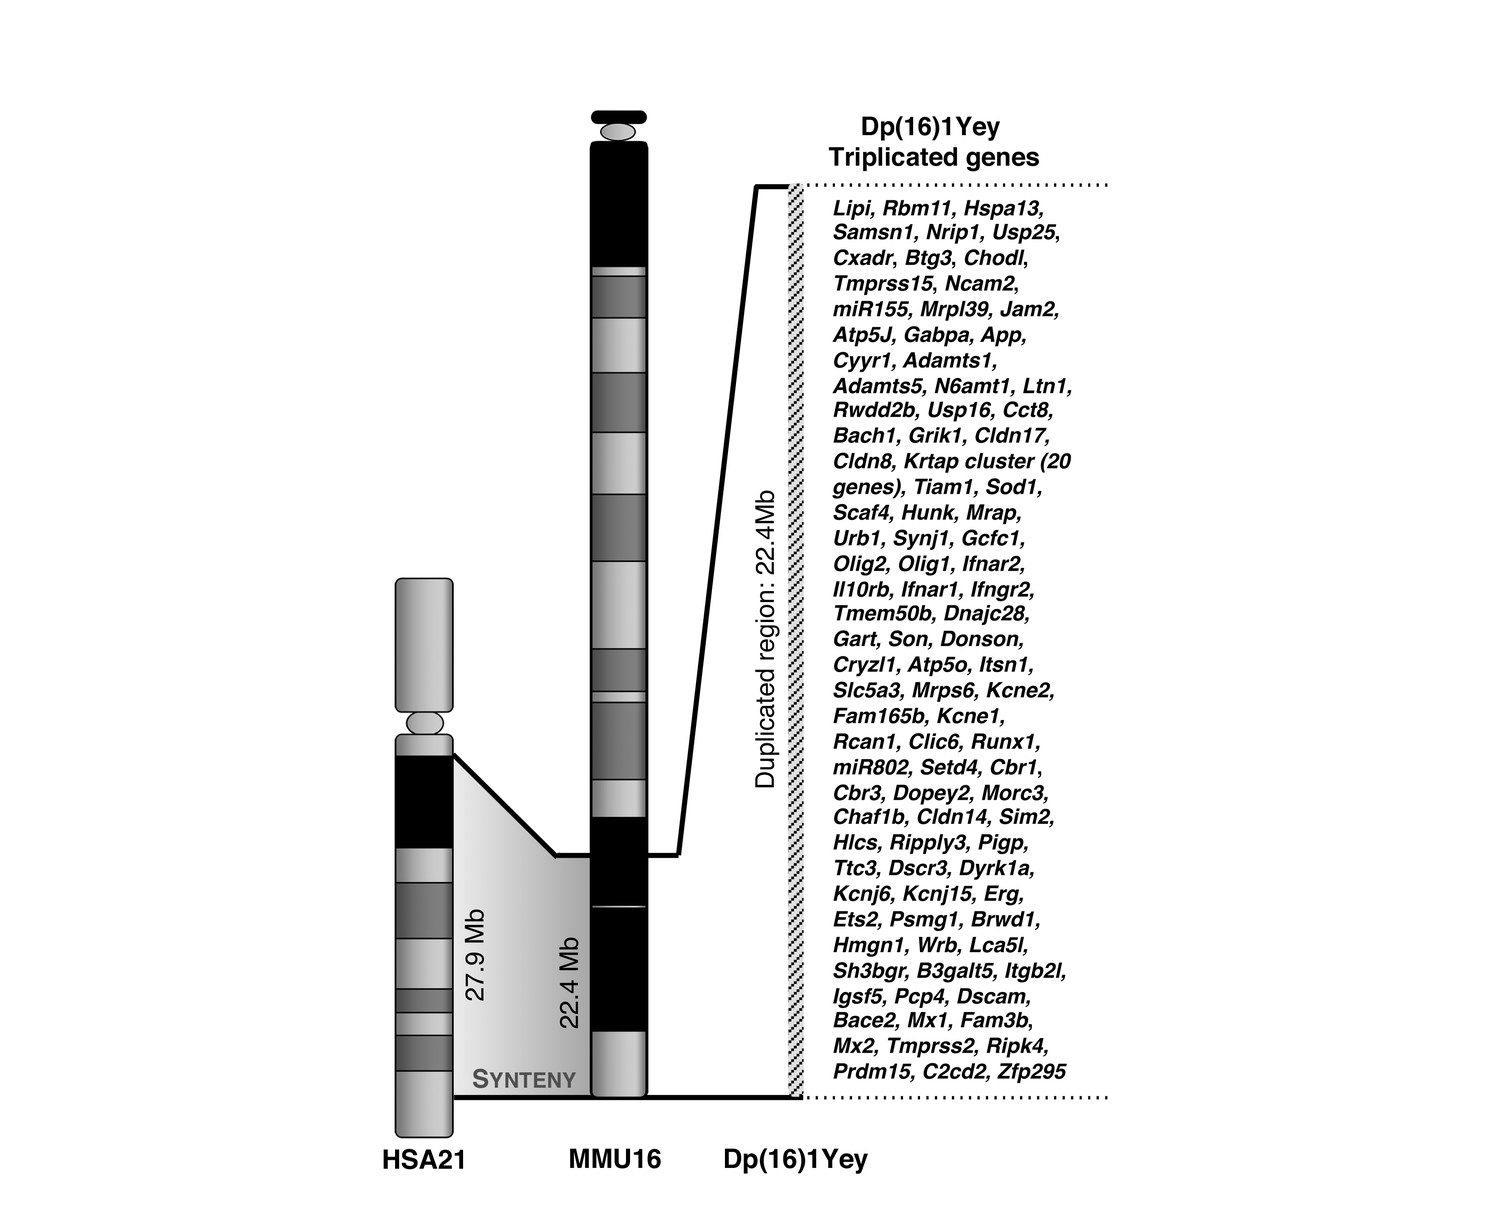
Human – mouse synteny allows modeling Down syndrome in mice.
Human chromosome 21 (HSA21) possesses a large region of synteny to the distal part of mouse chromosome 16 (MMU16), conserving gene content, order and relative orientation. The Dp(16)1Yey carries a tandem duplication for the entire region of synteny on MMU16 spanning from Lipi to Zfp295 (~98 known protein coding genes). This 22.4 Mb duplication was obtained by Cre-loxP mediated chromosomal engineering.
Figure 1—figure supplement 2

LFP power and phase locking properties of CA1 place cells are conserved in Dp(16)1Yey mice.
(A) Power spectrum density (PSD) curves of CA1 local field potentials (LFP) during linear track exploration showed no significant differences between Dp(16)1Yey and WT mice, including in the theta (6–12 Hz), beta (15–30 Hz) and gamma bands (30–100 Hz). (B) The number of spikes plotted as a function of the phase of theta showed a similar pattern between WT and Dp(16)1Yey mice, peaking shortly after the trough of theta (black curve). (C) The preferred firing phase was calculated for significantly theta-modulated neuron during the exploration phase in the linear track and plotted in a circular histogram. No significant differences were observed between Dp(16)1Yey and WT groups, with a preferred phase of theta around 215–240° (0/360° set for theta peak, 180° for theta trough). (D) The von Mises κ parameter revealed no significant differences in the concentration of firings across the theta cycle between Dp(16)1Yey and WT. No group differences where observed in average pyramidal cell Kullback-Leibler divergence (E) and modulation index (F). Values are expressed as mean ±standard error of the mean. Statistical significance was assessed using ANOVA for repeated measures (A), circular ANOVA (B), Kuiper test (C) or Mann-Whitney U-test (D–F) with significance set at p<0.05.
Figure 2
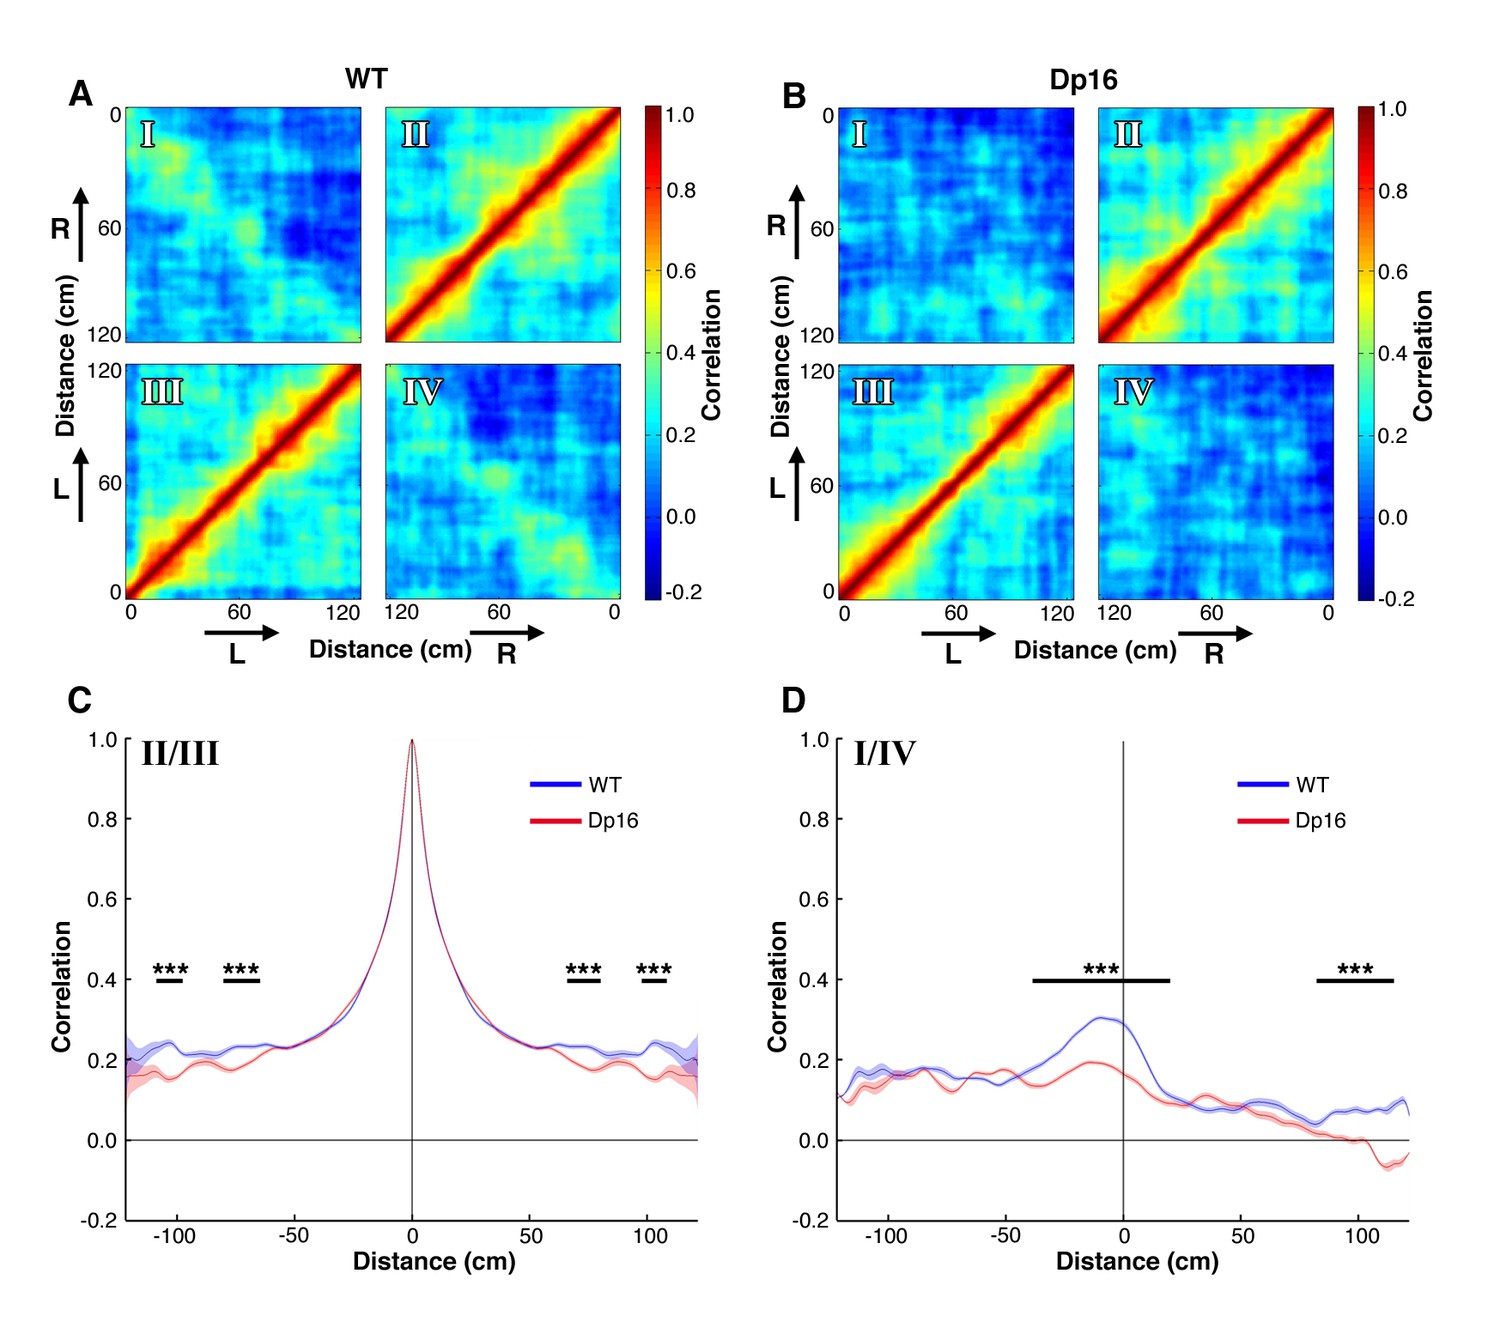
Population level coding of position is altered in Dp(16)1Yey mice.
(A) Spatial autocorrelation matrix of the population vectors in WT mice. Lower left (III) and upper right (II) quadrants represent the correlation of population vectors encoding movements in the same direction. Upper left (I) and lower right (IV) quadrants represent the correlation for opposite directions. Arrows indicate the movement direction (L: left laps; R: right laps). (B) Spatial autocorrelation matrix of the population vectors in Dp(16)1Yey mice. (C) Average correlation as a function of track distance for population vectors encoding movement in the same direction. The blue and red lines represent average values of the quadrants II and III of the cross-correlation matrices displayed on panels A and B respectively. The shaded areas correspond to the standard error of mean (S.E.M) of these values. The dominant central peak indicates a strong positional encoding independent from the location of the place fields in the track, in both WT and Dp(16)1Yey mice. (D) Same as in (C) for population vectors encoding movements in opposite direction, averaged across quadrants I and IV of the cross-correlation matrices shown on panels A and B.. The peak in the center indicates a mild correlation in the encoding of the animal’s position between movements in opposite directions in the WT group. Dp(16)1Yey mice however failed to show a similar pattern. Statistical significance was assessed using Wilcoxon ranksum test with significance set at (***) p<0.001.
Figure 3
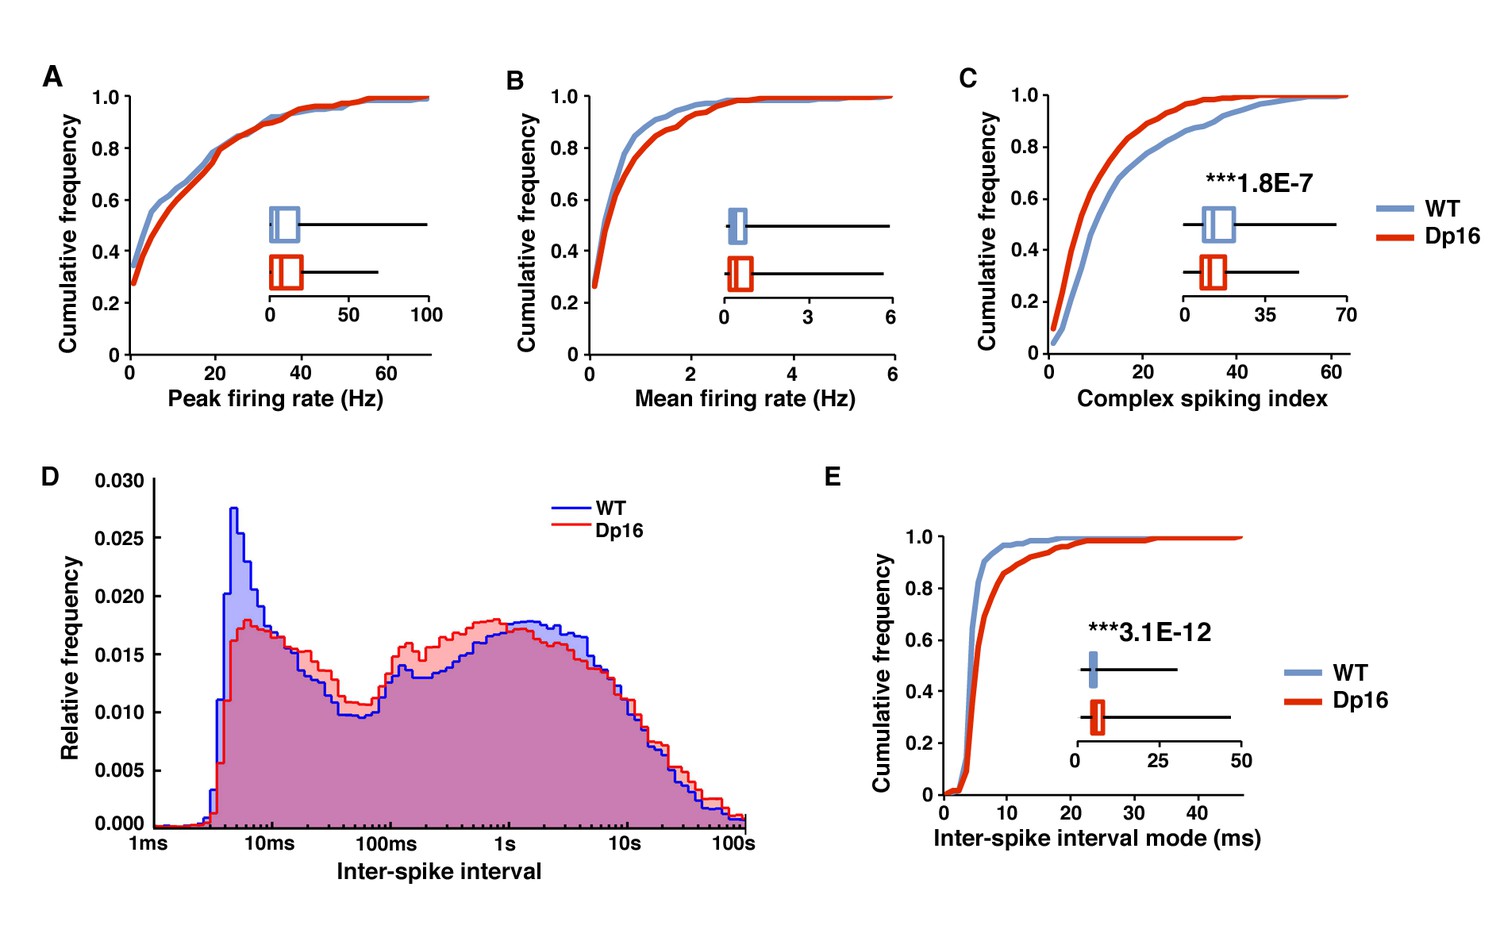
Decreased bursting of CA1 pyramidal cells in Dp(16)1Yey mice during post-exploratory rest.
During post-exploratory quiescent periods the peak firing rate (A) and mean firing rate (B) were not significantly different between the WT and Dp(16)1Yey groups. (C) The complex spiking index was significantly decreased in Dp(16)1Yey CA1 pyramidal cells. (D) The ISI distribution shows two populations of events in CA1 pyramidal cells from WT mice. The peak of events with an ISI between 2 and 15 ms correspond to spikes included in complex bursts. The second large population of events with higher ISI represents single isolated spikes. In the Dp(16)1Yey the peak of short ISI events was smaller than in WT, whereas the population of isolated single spikes tended to be larger. (E) The inter-spike interval (ISI) mode, defined as the most probable inter-spike interval for each recorded neuron, was significantly longer in the Dp(16)1Yey group than in their WT littermates. Statistical significance was assessed using Mann-Whitney U-test with significance set at (***) p<0.001.
-
Figure 3—source data 1
Pyramidal cells characteristics during awake-rest - full data set.
- https://doi.org/10.7554/eLife.31543.008
Figure 4 with 3 supplements
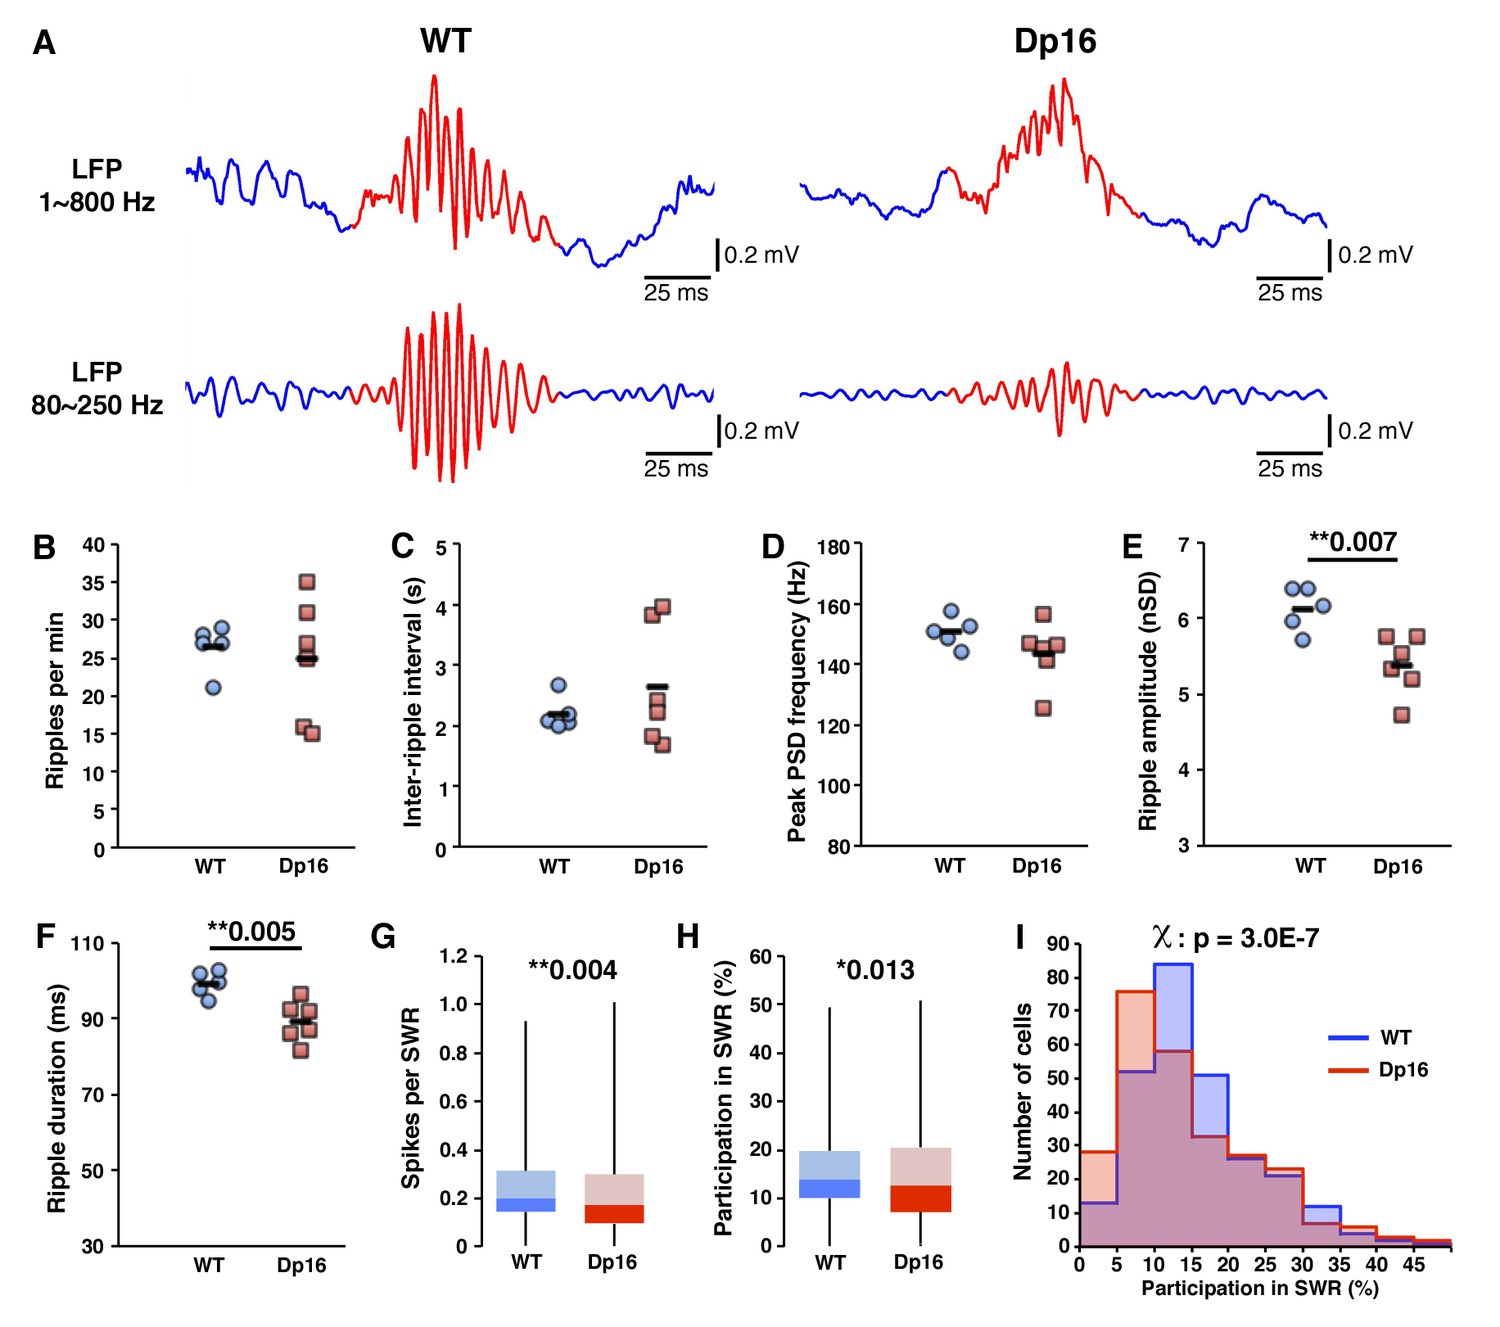
Decreased activity of CA1 pyramidal cells during ripple events in Dp(16)1Yey mice.
(A) Examples of local field potentials (LFP), non-filtered (upper traces) or filtered for the ripple frequency range (lower traces). The occurrence of ripple events (B), the inter-ripple interval (C) and the peak ripple frequency (D) were not significantly different between Dp(16)1Yey and WT mice. Ripple amplitude (E) and duration (F) were significantly decreased in the LFPs of Dp(16)1Yey mice. The number of spikes per cell per ripple (G) and the participation of individual cells in ripple events (H) were significantly lower in CA1 pyramidal cells of Dp16 mice. (I) The proportion of cells plotted as a function of their participation rate in sharp-wave ripples showed a significant shift toward lower participation rates, with Dp(16)1Yey pyramidal cells peaking at 5–10% participation whereas the peak was at 10–15% in the WT group. Each marker in (B) thru (F) represents average value from all events in an individual mouse. The origin of the Y-axis in D, E and F was set at the threshold used for ripple detection. Statistical significance was assessed using one-way ANOVA (B–F) or Mann-Whitney U-test (G, H) with significance set at (*) p<0.05 and (**) p<0.01.
-
Figure 4—source data 1
Sharp wave ripples analysis - full data set.
- https://doi.org/10.7554/eLife.31543.015
Figure 4—figure supplement 1
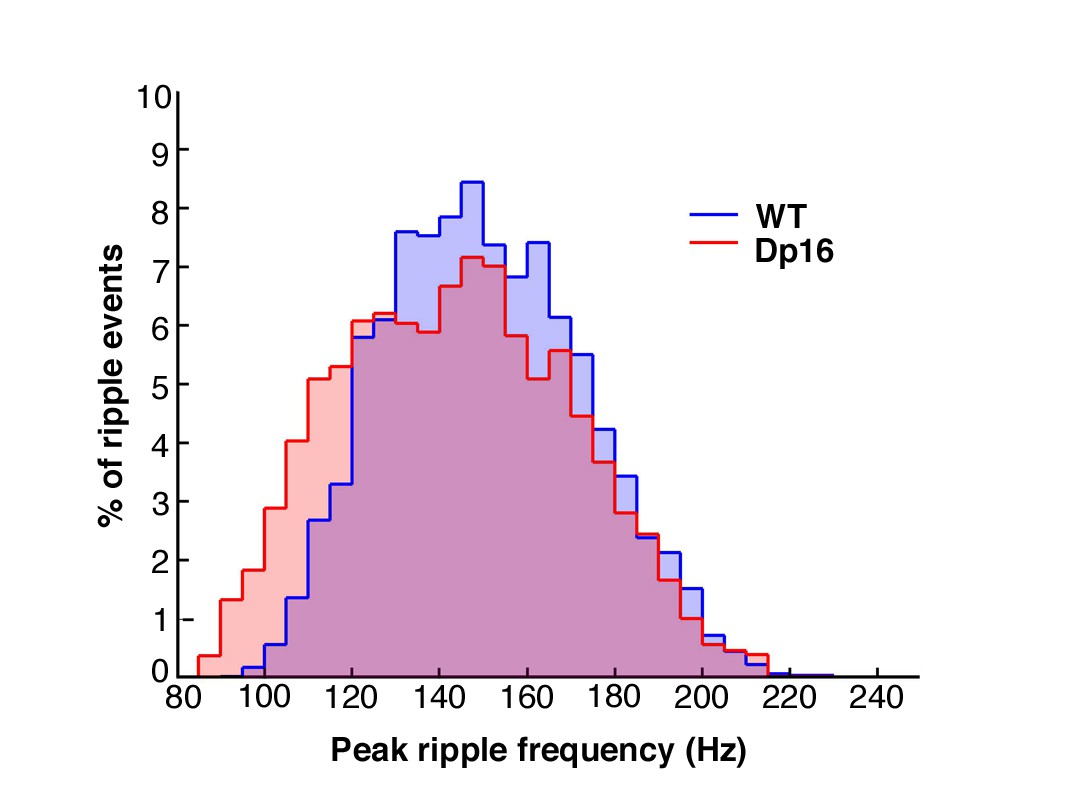
Sharp wave ripple peak frequency was not significantly affected in Dp(16)1Yey mice.
The population distribution of sharp wave ripples was plotted according to their intrinsic peak frequency for all WT (blue; N = 5, n = 4541 ripples) and Dp(16)1Yey (red; N = 6, n = 6034 ripples) mice. A mild shift toward events of lower frequencies was observed in Dp(16)1Yey mice, but this did not reach the level of significance (Kolmogorov-Smirnov test for normality: p=0.6403, k = 0.1714).
Figure 4—figure supplement 2
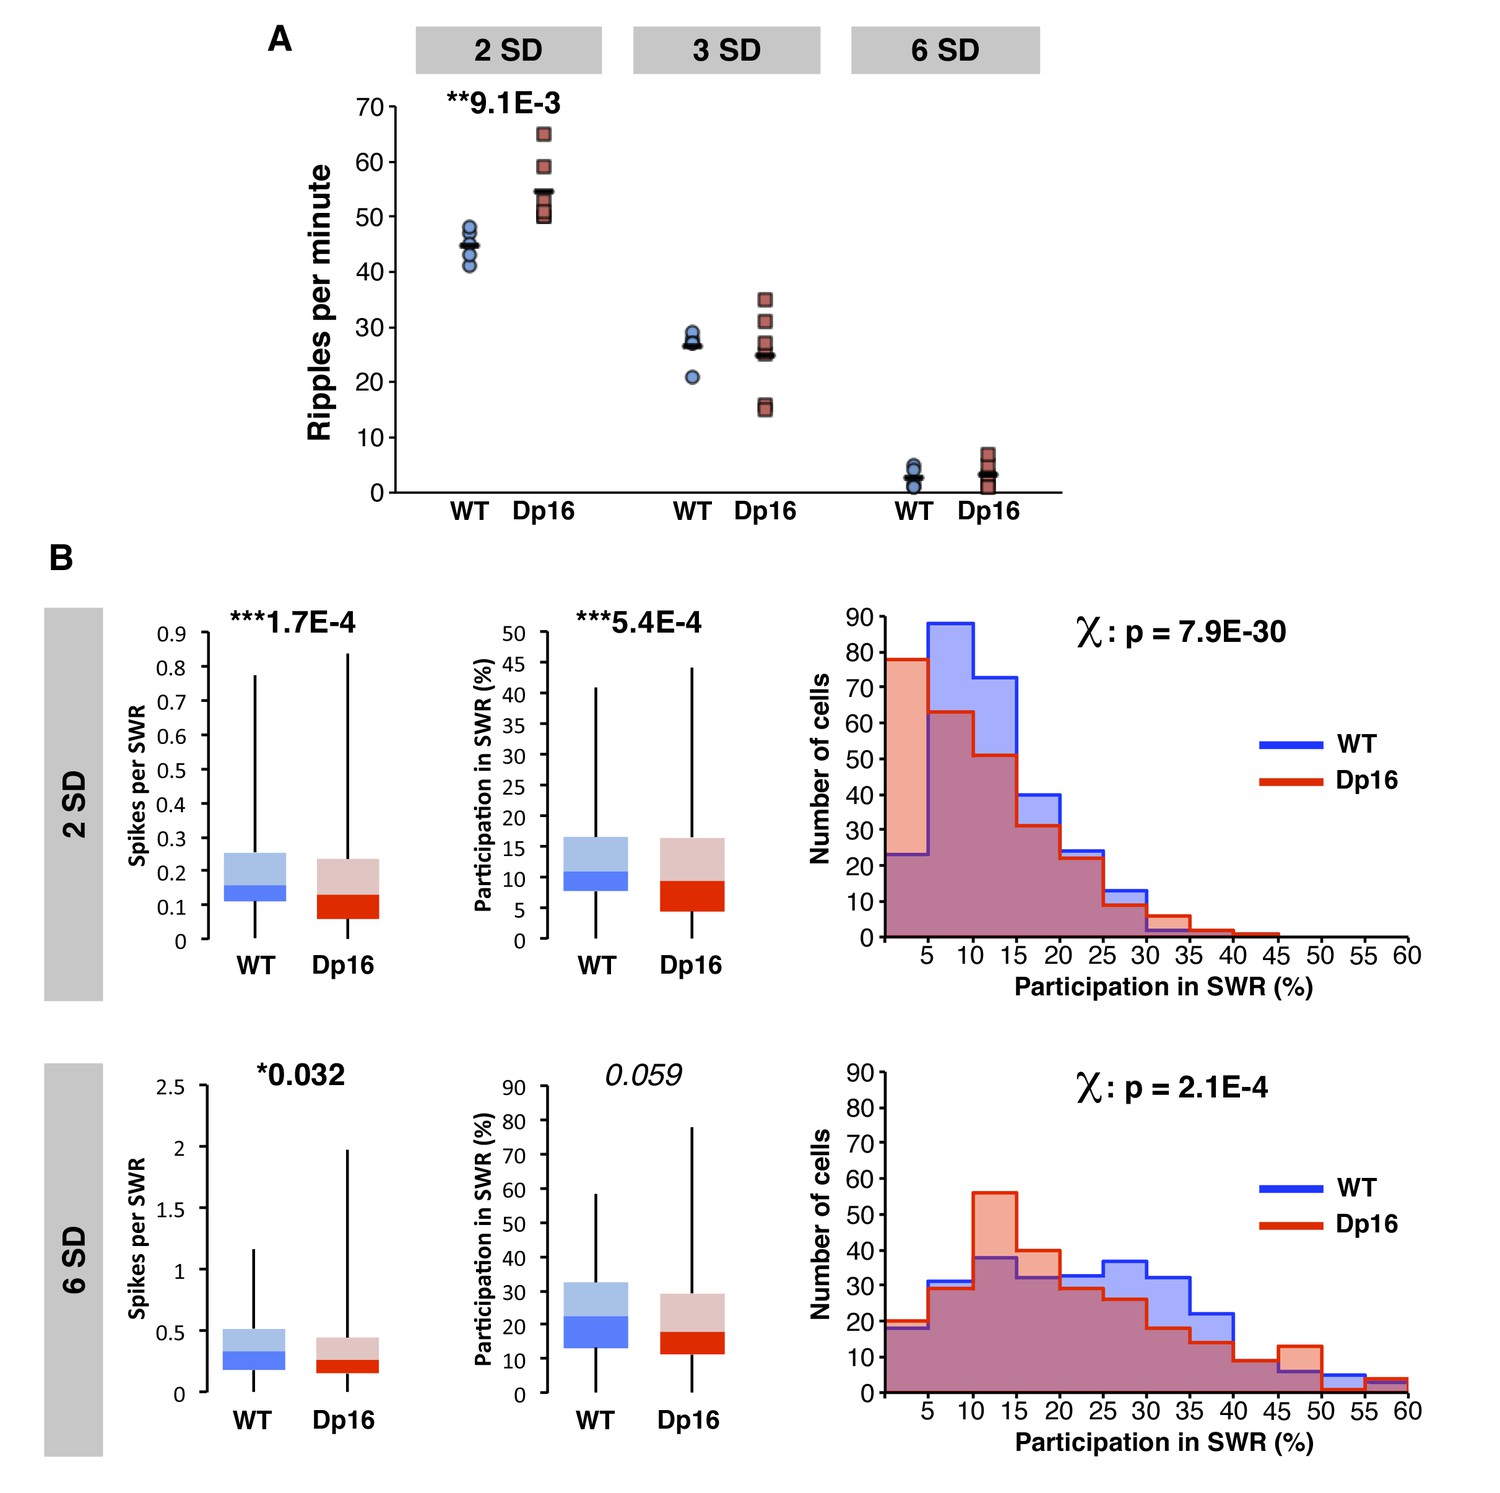
Decreased activity of CA1 pyramidal cells during ripple events in Dp(16)1Yey mice is not related to ripple amplitude.
(A) Compared to the standard detection threshold (commonly placed at 3 SD), using a more permissive threshold (2 SD) led to a larger number of ripples detected in both WT and Dp16 mice. The frequency of occurrence of ripple events was significantly higher in Dp16 than their WT littermates. On the contrary, using a more restrictive threshold (6 SD) decreased the amount of ripples detected in both genotypes to similar low levels. (B) The number of spikes per cell per ripple and the participation of individual cells in ripple events were significantly lower in CA1 pyramidal cells of Dp16 mice even when ripple events were detected using a more permissive threshold (2 SD). A similar effect was seen using a more restrictive threshold (6 SD), even though the decrease in participation rate in Dp16 mice did not reach the significance level. Using either the more restrictive or more permissive threshold for the detection of ripples, the proportion of cells plotted as a function of their participation rate in sharp-wave ripples confirmed a significant shift toward lower participation rates in Dp16 mice. Statistical significance was assessed using one-way ANOVA (A) or Mann-Whitney U-test and chi square text (B) with significance set at (*) p<0.05, (**) p<0.01 and (***) p<0.001.
Figure 4—figure supplement 3
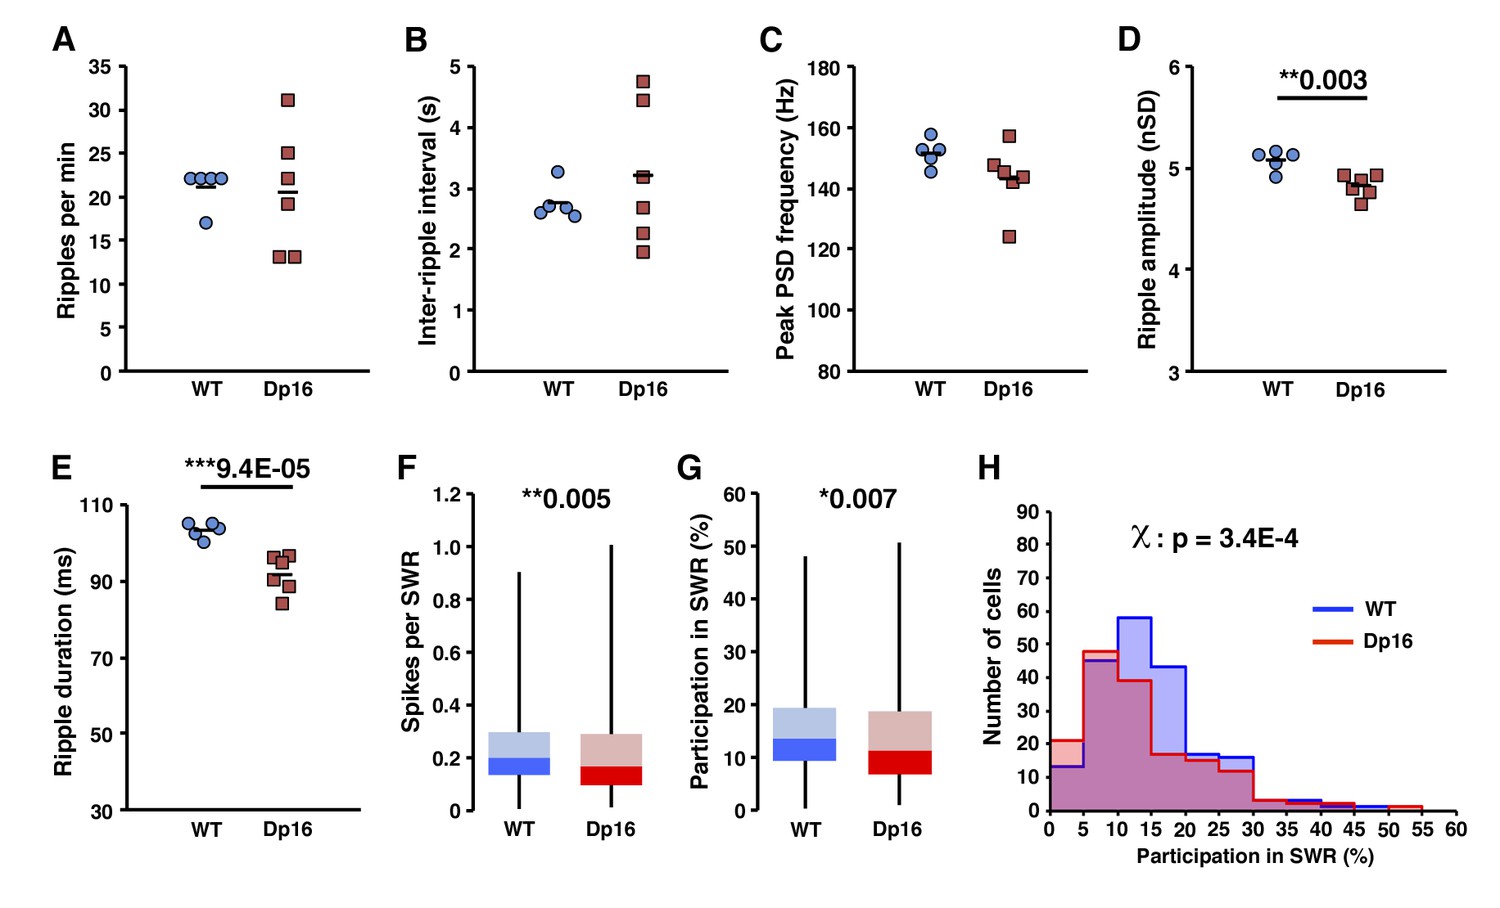
Decreased activity of CA1 pyramidal cells during ripple events in Dp(16)1Yey mice is not related to ripple detection bias.
Onset and offset of ripple events were detected using the underlying multiunit activity in order to prevent a bias eventually caused by the amplitude of these events in Dp16 mice. The number of ripples per minute (A), inter-ripple interval (B) and peak power spectrum density frequency of ripple events were not significantly different between Dp16 and WT littermates. Their amplitude (D) and duration (E) were however significantly decreased in the Dp16 group. The number of spikes per ripple (F) and participation in ripple events (G) were significantly lower in Dp16 mice. (H) The proportion of cells plotted as a function of their participation rate in sharp-wave ripples showed a significant shift toward lower participation rates, with Dp(16)1Yey pyramidal cells peaking at 5–10% participation whereas the peak was at 10–15% in the WT group. Each marker in (A) thru (E) represents average value from all events in an individual mouse. Statistical significance was assessed using one-way ANOVA (A–E) or Mann-Whitney U-test (F, G) with significance set at (*) p<0.05 and (**) p<0.01 and (***) p<0.001.
Figure 5
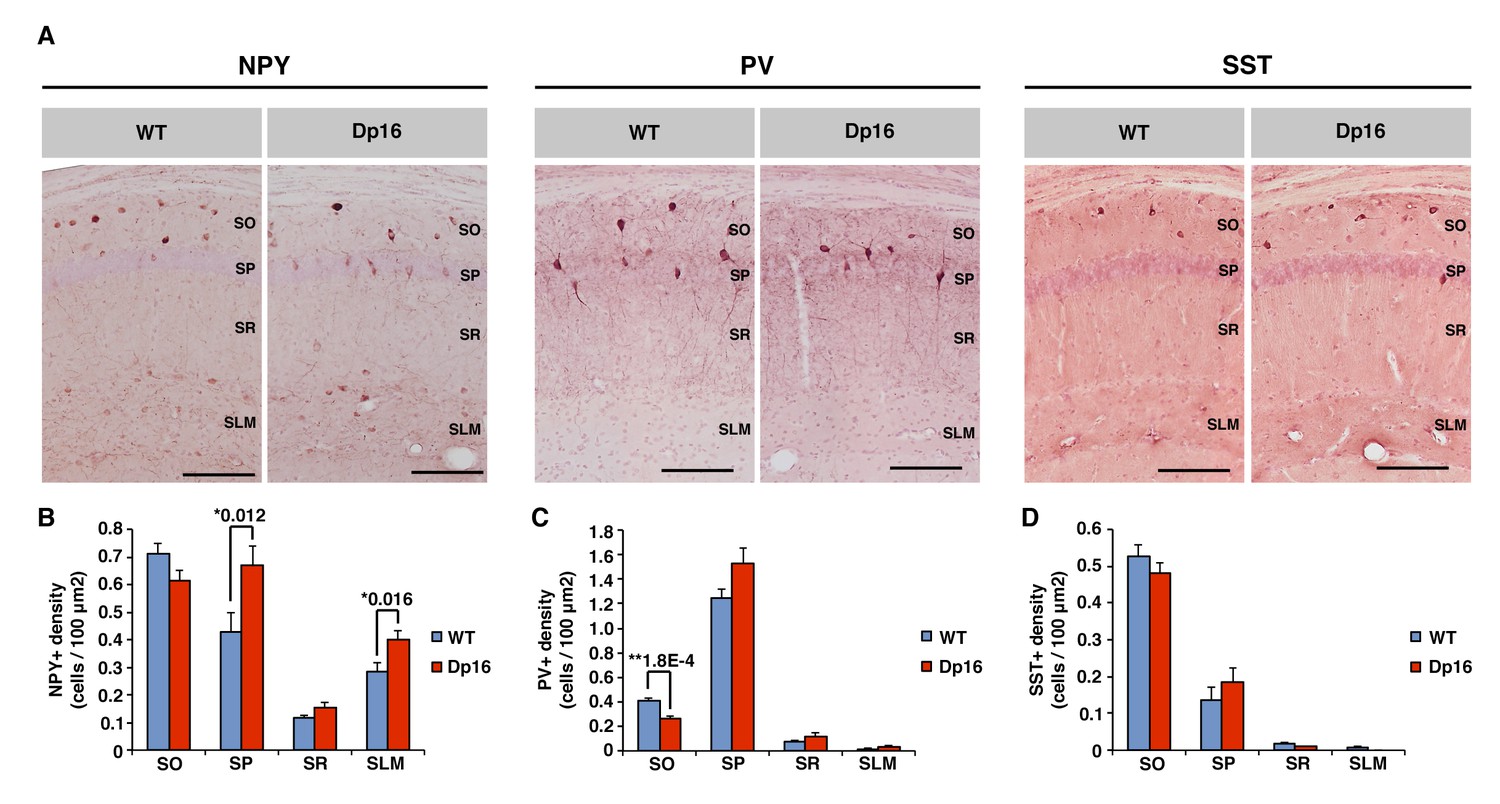
Neuropeptide Y-positive interneuron density is increased in the CA1 of Dp(16)1Yey mice.
(A) Anti-neuropeptide Y (NPY), anti-parvalbumin (PV) and anti-somatostatin (SST) immunochemistry allow the visualization of specific populations of interneurons within the stratum oriens (SO), stratum pyramidale (SP), stratum radiatum (SR) and stratum lacunosum moleculare (SLM) of the CA1 area of hippocampus. (B) The density of NPY positive cells was significantly increased in the SR and SLM of Dp(16)1Yey mice. (C) The density of PV positive neurons was significantly decreased in the SO of Dp(16)1Yey mice, but remained comparable to WT in the SP where the majority of the PV positive cells are found. (D) The density of SST positive neurons was not significantly different between Dp(16)1Yey and WT samples in all four layers of the CA1. Values are expressed as mean ±standard error of the mean. Statistical significance was assessed using Mann-Whitney U-test (B–D) with significance set at (*) p<0.05 and (**) p<0.01. Scale bars in (A) correspond to 50 μm.
-
Figure 5—source data 1
Quantification of interneuron populations density - full data set.
- https://doi.org/10.7554/eLife.31543.017
Author response image 1
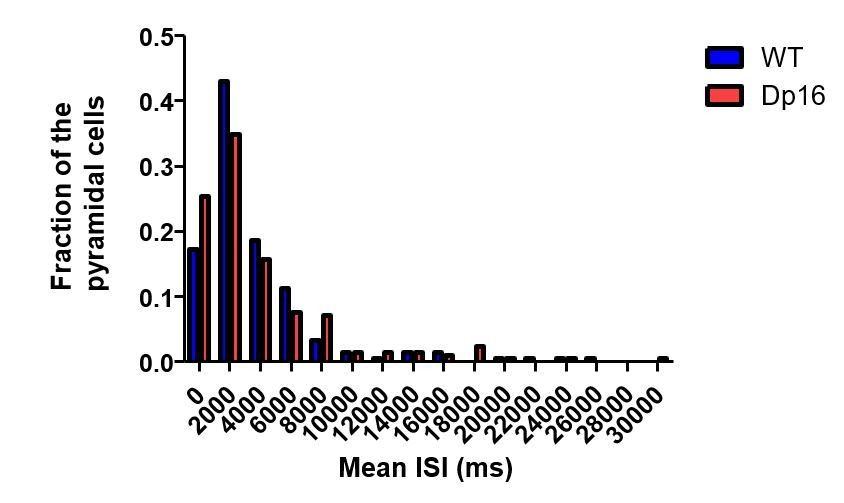
Population distribution of the mean ISI of pyramidal cells in wild-type (blue) and Dp(16) (red) pyramidal cells.
https://doi.org/10.7554/eLife.31543.020
Author response image 2
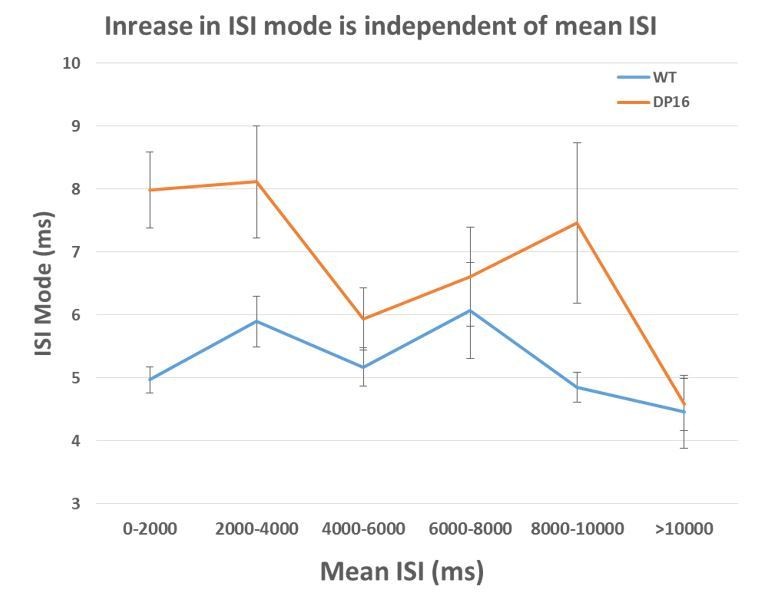
The average ISI mode is larger in the Dp(16) pyramidal cells across all average ISI bin.
(0-2000ms WT n=92, Dp16 n=99; 2000-4000 ms WT n=53, Dp16 n=48; 4000-6000ms WT n=40, Dp16 n=19; 6000-8000 ms WT n=9, Dp16 n=17; 8000-10000ms WT n=7, Dp16 n=9; >10000ms WT n=12, Dp16 n=16)
Tables
Table 1
Bursting characteristics of CA1 place cells during exploration and rest.
https://doi.org/10.7554/eLife.31543.009| Linear track | Rest | |||||||||||||||
|---|---|---|---|---|---|---|---|---|---|---|---|---|---|---|---|---|
| WT | Dp16 | p-value | WT | Dp16 | p-value | |||||||||||
| Bursts per min | 7.901 | ± | 0.532 | 5.777 | ± | 0.383 | *** | 0.0007 | 7.152 | ± | 0.685 | 5.741 | ± | 0.468 | * | 0.0315 |
| Mean Inter-burst Interval (s) | 18.940 | ± | 1.692 | 25.145 | ± | 1.907 | *** | 0.0002 | 30.061 | ± | 2.141 | 56.144 | ± | 6.640 | * | 0.0320 |
| Mean burst duration (ms) | 7.720 | ± | 0.186 | 8.435 | ± | 0.318 | *** | 2.67E-07 | 12.718 | ± | 4.251 | 8.281 | ± | 0.072 | 0.1305 | |
| % of spikes in burst | 33.1% | ± | 0.8% | 24.4% | ± | 0.7% | *** | 2.17E-13 | 29.7% | ± | 0.8% | 22.3% | ± | 0.7% | *** | 9.58E-12 |
| Nb. Spikes per burst | 2.264 | ± | 0.008 | 2.243 | ± | 0.009 | * | 0.0110 | 2.374 | ± | 0.010 | 2.264 | ± | 0.009 | *** | 1.59E-14 |
-
Table 1—source data 1
CA1 bursting analysis - full data set.
- https://doi.org/10.7554/eLife.31543.010
Key resources table
| Reagent type (species) or resource | Designation | Source or reference | Identifiers | Additional information |
|---|---|---|---|---|
| strain, strain background (mouse, males) | ‘Dp(16)1Yey’; ‘Dp16’ | Jackson Laboratory | ‘Stock number: 013530’; ‘RRID:MGI:5690055’ | |
| antibody | anti-PCP4 rabbit polyclonal IgG | Santa-Cruz | ‘sc-74816’; ‘RRID:AB_2236566’ | 1:200 dilution; frozen sections |
| antibody | anti-NPY | Cell Signaling Technology | ‘#11976’; ‘RRID:AB_2716286’ | 1:400 dilution; frozen sections |
| antibody | anti-SST-14 | Peninsula Laboratories | ‘T-4103’; ‘RRID:AB_518614’ | 1:500 dilution; frozen sections |
| antibody | anti-PV | Calbiochem | ‘PC255L’; ‘RRID:AB_2173906’ | 1:1000 dilution; frozen sections |
| antibody | biotinylated goat anti-rabbit IgG antibody | Vector Laboratories | ‘BA-1000’; ‘RRID:AB_2313606’ | |
| commercial assay or kit | RetrievagenA | BD Biosciences | #550524 | antigen retireval reagent |
| commercial assay or kit | Avidin/Biotin blocking kit | Vector Laboratories | SP-2001 | blocking reagent |
| commercial assay or kit | VECTASTAIN Elite ABC kit | Vector Laboratories | PK-6100 | signal amplification kit |
| commercial assay or kit | NovaRed substrate kit | Vector Laboratories | SK-4800 | revelation kit |
| chemical compound, drug | ‘Avertin ‘; ‘2, 2, 2-tribromoethanol’ | Sigma-Aldrich | T48402 | anaesthetic |
Additional files
-
Transparent reporting form
- https://doi.org/10.7554/eLife.31543.018
Download links
A two-part list of links to download the article, or parts of the article, in various formats.
Downloads (link to download the article as PDF)
Open citations (links to open the citations from this article in various online reference manager services)
Cite this article (links to download the citations from this article in formats compatible with various reference manager tools)
Alterations of in vivo CA1 network activity in Dp(16)1Yey Down syndrome model mice
eLife 7:e31543.
https://doi.org/10.7554/eLife.31543


