Two complement receptor one alleles have opposing associations with cerebral malaria and interact with α+thalassaemia
- Kenya Medical Research Institute-Wellcome Trust Research Programme, Kenya
- University of Edinburgh, United Kingdom
- University of Oxford, United Kingdom
- Usher Insitute of Population Health Sciences and Informatics, University of Edinburgh, United Kingdom
- University of Bamako, Mali
- University of Maryland School of Medicine, United States
- Lifeshare Blood Centers, United States
- Imperial College, United Kingdom
- Wellcome Trust Sanger Institute, United Kingdom
Figures
Figure 1
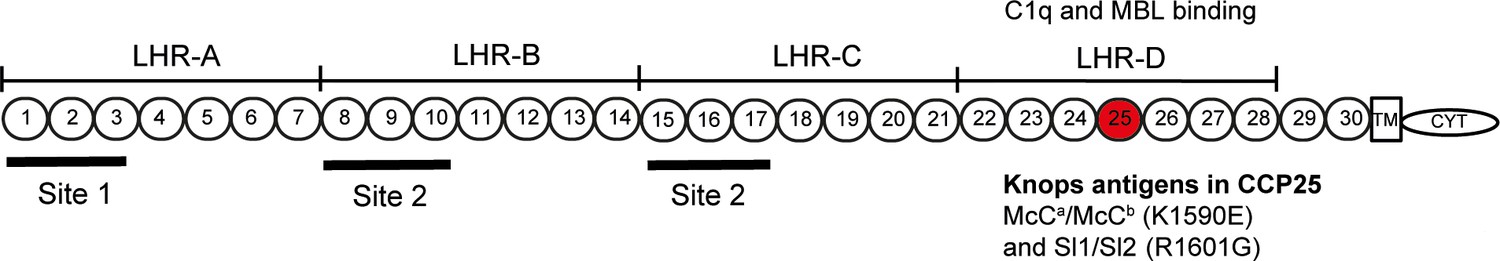
Diagram of the most common Complement Receptor 1 size variant (CR1*1).
Adapted from Schmidt et al. (2015) and Krych-Goldberg et al. (2002). The ectodomain of CR1 is composed of 30 Complement Control Protein (CCP) domains which are organized into four ‘Long Homologous Repeats’ (LHR). The single-nucleotide polymorphisms determining the Sl and McC antigens of the Knops blood group system are found in CCP 25 in LHR-D (red). Various functions have been mapped to different regions of CR1, including Site 1 (decay accelerating activity for C3 convertases; binding of the complement component C4b and the P. falciparum invasion ligand PfRH4), and Site 2 (cofactor activity for Factor I; binding of C3b and C4b and P. falciparum rosetting). LHR-D is thought to bind C1q and Mannose Binding lectin (MBL), but the specific binding sites have not been mapped. TM, transmembrane region; CYT, cytoplasmic tail.
Figure 2
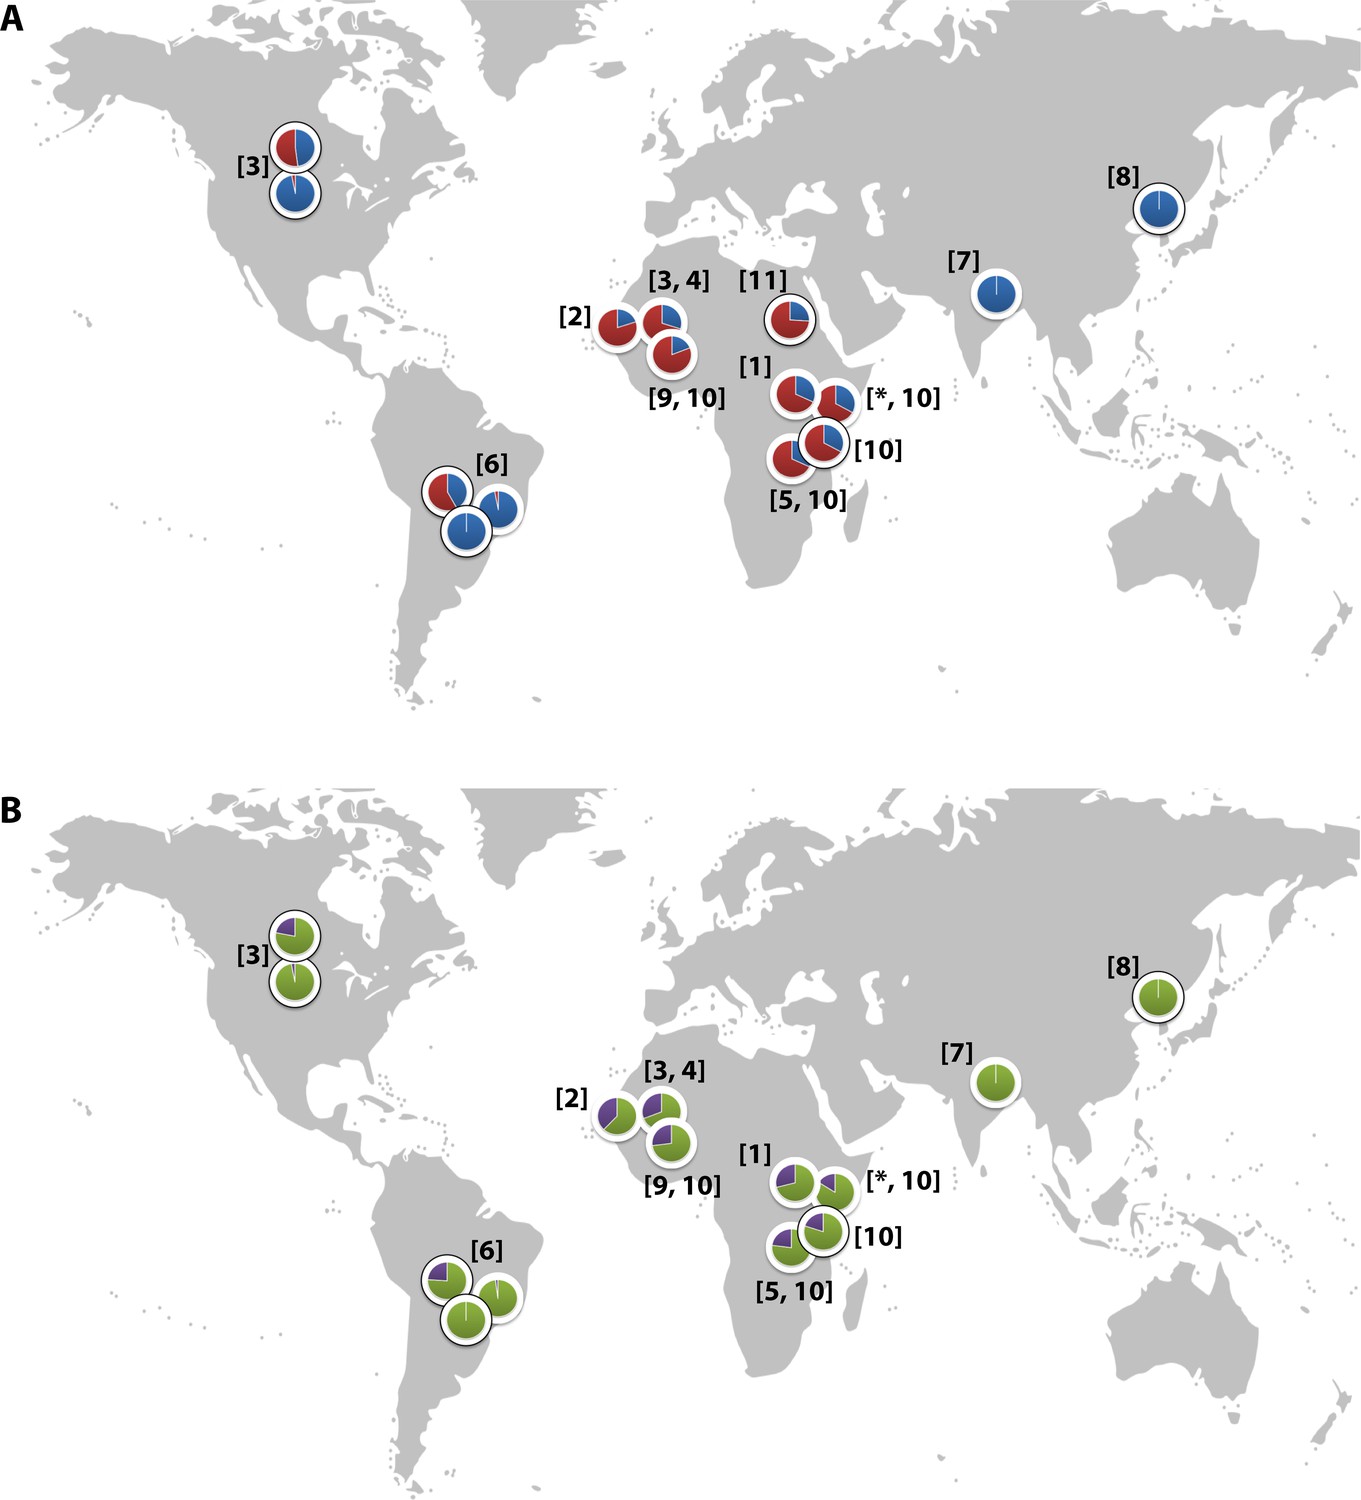
Global distribution of the CR1 Knops Sl and McC alleles
(A) Shows the global frequencies of the Sl alleles. Sl1 is represented in blue and Sl2 in red. (B) Shows the global frequencies of the McC alleles. McCa is represented in green and McCb in purple. The two samples in North and South America showing high frequencies of Sl2 and McCb alleles are both derived from populations with African heritage. Numbers in parentheses indicate the studies from which the Sl and McC allele frequencies were derived, with * indicating data derived from this study. [1] Thathy et al., 2005; [2] Zimmerman et al., 2003; [3] Moulds et al., 2004; [4] Noumsi et al., 2011; [5] Fitness et al., 2004; [6] Covas et al., 2007; [7] Gandhi et al., 2009; [8] Yoon et al., 2013; [9] Hansson et al., 2013; [10] Kariuki et al., 2013; [11] Eid et al., 2010.
Figure 3
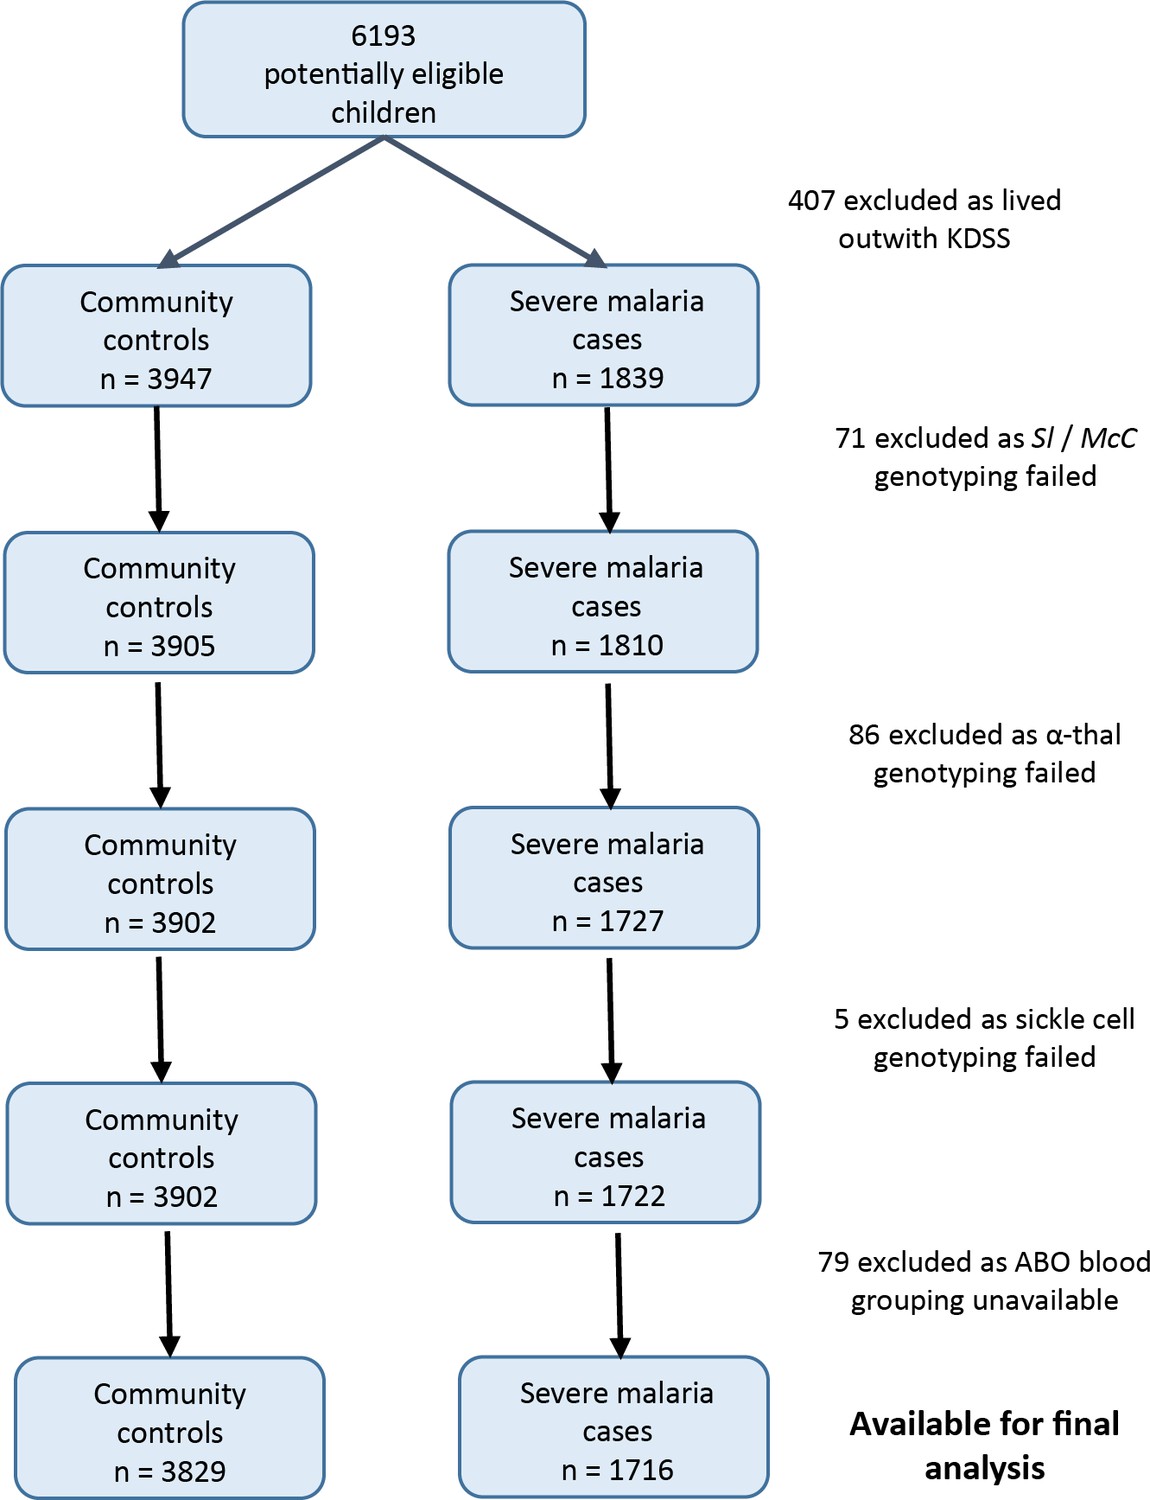
Patient inclusion flow chart for the Kenyan case-control study.
https://doi.org/10.7554/eLife.31579.005
Figure 4
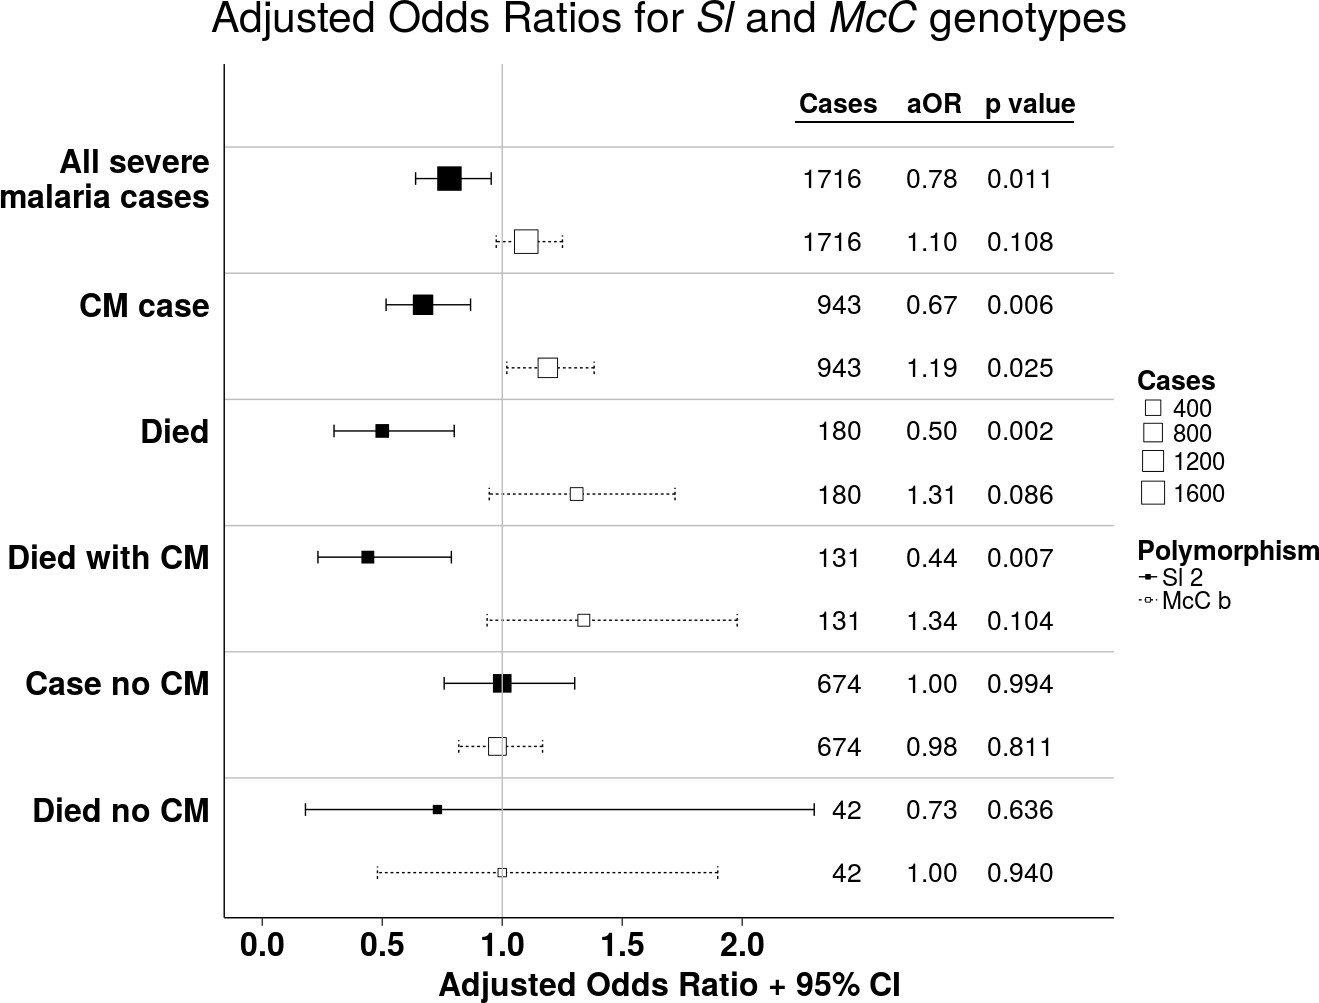
The Sl2 and McCb alleles have opposing associations with cerebral malaria (CM) and death.
Forest plot showing the associations between Sl and McC polymorphisms and severe malaria in Kilifi, Kenya. Filled boxes: adjusted Odds Ratios (aOR) for the Sl2 genotype in the recessive form (i.e. Sl2/Sl2 vs all other Sl genotypes). Open boxes: McCb in the additive form (i.e. change in odds ratio with each additional McCb allele). Sl and McC genotype were included together in a statistical model to examine their associations with malaria susceptibility. aORs displayed are adjusted for ethnicity, location of residence, sickle cell genotype, α+thalassaemia genotype and ABO blood group. An interaction term between Sl genotype and α+thalassaemia is included in the model. Model outputs following 2000 bootstrapped iterations are shown.
Figure 5

The protective association of Sl2 with cerebral malaria and death is only evident in children with normal α-globin.
Interaction plots showing the interaction between Sl (recessive) and α+thalassaemia for the proportion of children suffering (A) cerebral malaria and (B) death. For α+thalassaemia status, 0 = wild type α-globin; 1 = heterozygote or homozygote for α+thalassaemia. For Sl (recessive) status, 0 = Sl1/Sl1 or Sl1/Sl2 genotype; 1 = Sl2/Sl2 genotype.
Figure 6

Parasite densities by Sl and McC genotypes.
Geometric mean parasite densities in the Kenyan case-control study (severe malaria) and longitudinal disease cohort study (uncomplicated malaria and asymptomatic parasitaemia) by A) Sl genotypes and B) McC genotypes. The data on severe malaria includes 1695 children: (Sl1/Sl1 (175), Sl1/Sl2 (793), Sl2/Sl2 (727) and McCa/McCa (1167), McCa/McCb (478) and McCb/McCb (50). The data on uncomplicated malaria includes 162 children: (Sl1/Sl1 (16) , Sl1/Sl2 (75), Sl2/Sl2 (71) contributing 124, 488 and 461 episodes respectively and McCa/McCa (107), McCa/McCb (49) and McCb/McCb (6) contributing 699, 349 and 25 episodes, respectively. The data on asymptomatic parasitaemia includes 57 children: (Sl1/Sl1 (5), Sl1/Sl2 (26), Sl2/Sl2 (26) contributing 6, 35 and 35 episodes, respectively, and McCa/McCa (34), McCa/McCb (20) and McCb/McCb (3) contributing 47, 25 and 4 episodes, respectively. Differences in parasite densities by genotype were tested by linear regression analysis with adjustment for HbAS, age as a continuous variable and ABO blood group in the severe malaria cases, HbAS and season (defined into 3-monthly blocks) in the uncomplicated malaria samples and HbAS and ABO blood group in the asymptomatic parasitaemia samples. Data were adjusted for within-person-clustering of events in the uncomplicated malaria and asymptomatic parasitaemia studies. Bars represent 95% confidence intervals.
Figure 7
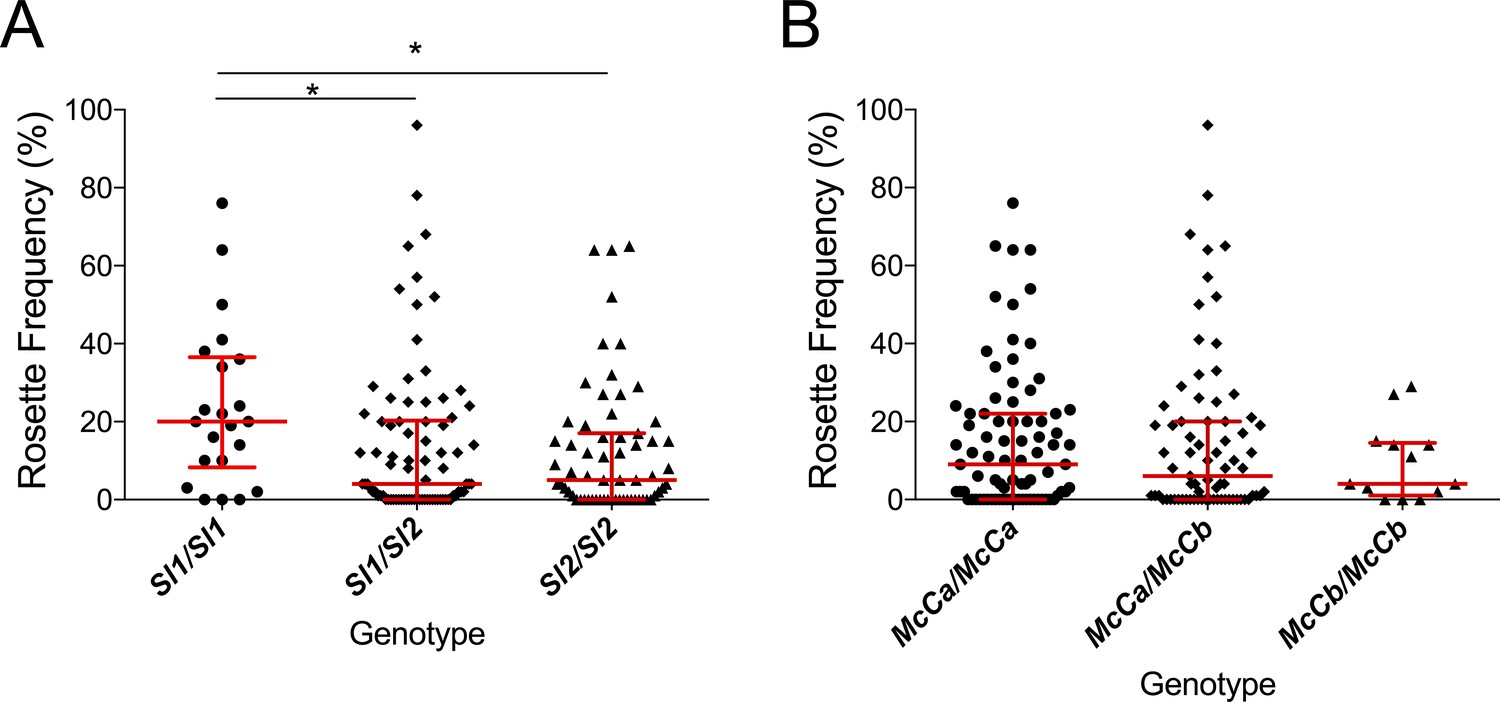
The Sl2 allele is associated with reduced ex vivo rosette frequency of P. falciparum clinical isolates.
Parasite isolates were collected from 167 malaria patients in Mali and matured in culture for 18–36 hr before assessment of rosette frequency (percentage of infected erythrocytes forming rosettes with two or more uninfected erythrocytes). Red bars show the median rosette frequency and interquartile range (IQR) for each genotype. (A) Rosetting by patient Sl genotype. Sl1/Sl1 (n = 22, median 20.0, IQR 8.3–36.5), Sl1/Sl2 (n = 82, median 4.0, IQR 0–20.3), Sl2/Sl2 (n = 63, median 5.0, IQR 0–17.0); *p<0.05, Kruskal Wallis with Dunn’s multiple comparison test; (B) Rosetting by McC genotype. McCa/McCa (n = 81, median 9.0, IQR 0–22.0), McCa/McCb (n = 73, median 6.0, IQR 0–20.0), McCb/McCb (n = 13, median 4.0, IQR 1–14.5); not significant, Kruskal Wallis with Dunn’s multiple comparison test.
Appendix 1—figure 1
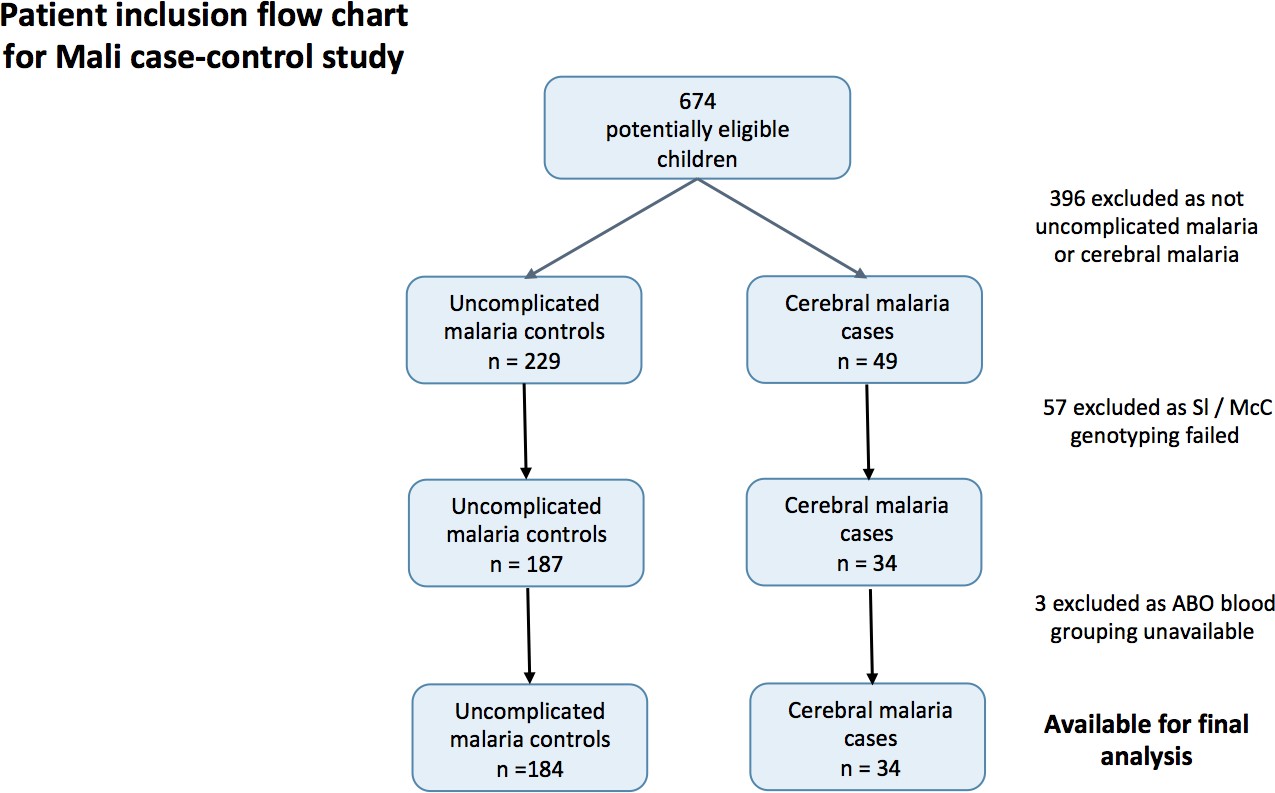
Patient inclusion flow-chart for the Mali case-control study.
https://doi.org/10.7554/eLife.31579.017Tables
Table 1
Adjusted Odds Ratios (aOR) for severe malaria by Sl2 (recessive) and McCb (additive) genotype in Kenya.
https://doi.org/10.7554/eLife.31579.009| Clinical outcome | Sl2 aORs (95% CI)* | P value | McCb aORs (95% CI) | P value |
|---|---|---|---|---|
| All severe malaria† (n = 1716) | 0.78 (0.64–0.95) | 0.011 | 1.10 (0.97–1.25) | 0.108 |
| CM§ (n = 943) | 0.67 (0.52–0.87)‡ | 0.006 | 1.19 (1.02–1.38) | 0.025 |
| Severe without CM (n = 674) | 1.00 (0.76–1.30) | 0.994 | 0.98 (0.82–1.17) | 0.811 |
| Died (n = 180)† | 0.50 (0.30–0.80)‡ | 0.002 | 1.31 (0.95–1.72) | 0.086 |
| Died with CM (n = 131) | 0.44 (0.23–0.78)‡ | 0.007 | 1.34 (0.94–1.88) | 0.104 |
| Died without CM (n = 42) | 0.73 (0.18–2.30) | 0.636 | 1.00 (0.48–1.94) | 0.940 |
| SMA# (n = 483) | 0.76 (0.55–1.05) | 0.099 | 0.96 (0.78–1.17) | 0.688 |
| SMA without CM (n = 223) | 0.82 (0.51–1.26) | 0.366 | 0.91 (0.67–1.20) | 0.553 |
| Died with SMA¶ (n = 56) | 0.65 (0.21–1.67) | 0.374 | 1.35 (0.77–2.20) | 0.229 |
| RD** (n = 522) | 0.81 (0.59–1.10) | 0.181 | 1.12 (0.92–1.35) | 0.225 |
| RD without CM (n = 192) | 1.06 (0.66–1.68) | 0.805 | 1.07 (0.80–1.43) | 0.615 |
| Died with RD†† (n = 73) | 0.39 (0.14–0.88)‡ | 0.027 | 1.01 (0.59–1.61) | 0.948 |
-
*Adjusted Odds Ratios (aOR) and 95% Confidence Intervals (CI) are presented for the Sl2 genotype in the recessive form (i.e. Sl2/Sl2 vs all other Sl genotypes) and McCb genotype in the additive form (i.e. change in aOR with each additional McCb allele). Sl and McC genotype were included together in a statistical model to examine their associations with malaria susceptibility. aORs displayed are adjusted for ethnicity, location of residence, sickle cell genotype, α+thalassaemia genotype and ABO blood group. An interaction term between Sl genotype and α+thalassaemia was included in the model. Model outputs following 2000 bootstrapped iterations are shown.
†99 children (7 of whom died) were severe malaria cases whose CM status was not recorded, hence these children are included in the numbers for ‘All severe malaria’ and ‘Died’ but not in ‘with CM’ or ‘without CM’ categories.
-
‡Models that showed significant evidence of interaction between Sl2 and α+thalassaemia.
§CM, cerebral malaria (P. falciparum infection with a Blantyre coma score of < 3).
-
#SMA, severe malarial anaemia (P. falciparum infection with Hb < 5 g/dl).
¶34/56 cases who died with SMA also had CM.
-
**RD, respiratory distress (P. falciparum infection with abnormally deep breathing).
††56/73 cases who died with RD also had CM.
Table 2
Adjusted Incidence Rate Ratios (aIRR) for uncomplicated malaria and non-malarial diseases in Kenya by Sl and McC genotype*.
https://doi.org/10.7554/eLife.31579.010| Clinical Outcomes | Sl2 aIRRs† (95% CI) | P value | McCb aIRRs (95% CI) | P value |
|---|---|---|---|---|
| Uncomplicated malaria | 0.49 (0.34–0.72)‡ | <0.001 4 | 1.24 (0.90–1.70) | 0.184 1 |
| All non-malaria clinical visits | 1.13 (0.96–1.32) | 0.140 1 | 0.76 (0.61–0.96)‡ | 0.020 4 |
| LRTI§ | 1.09 (0.81–1.47) | 0.561 1 | 0.39 (0.16–0.96) | 0.040 1 |
| URTI# | 1.21 (0.98–1.50) | 0.073 1 | 0.79 (0.63–0.99) | 0.047 3 |
| Gastroenteritis | 0.66 (0.43–1.03) | 0.066 2 | 0.55 (0.31–0.97)‡ | 0.038 2 |
| Skin infection | 1.33 (0.79–2.26) | 0.285 2 | 0.42 (0.16–1.13) | 0.086 1 |
| Helminth infection | 1.98 (0.83–4.71) | 0.122 2 | 0.68 (0.43–1.07) | 0.094 4 |
| Malaria negative fever | 0.83 (0.58–1.18) | 0.293 2 | 1.03 (0.80–1.33) | 0.828 3 |
-
*Data were collected from 22 Sl1/Sl1, 94 Sl1/Sl2 and 92 Sl2/Sl2 individuals during 49.4, 213.8 and 188.8 cyfu (child-years of follow-up), respectively, and 137 McCa/McCa, 63 McCa/McCb and 8 McCb/McCb individuals during 294.5, 143.2 and 14.3 cyfu, respectively. Both Sl2 and McCb alleles were tested for their association with the disease outcomes of interest using Poisson regression in the 1recessive, 2dominant, 3heterozygous and 4additive models. The best fitting models as examined using the Akaike information criterion (AIC) were used in the final analysis that included adjustment for McC genotype (for Sl analyses), Sl genotype (for McC analyses) α+thalassaemia and sickle cell genotype, ABO blood group, season (divided into 3 monthly blocks), ethnicity, age as a continuous variable and within-person clustering of events.
†aIRRs: adjusted Incidence Rate Ratios.
-
‡Models that showed significant evidence of interaction between either Sl2 or McCb and α+thalassaemia.
§LRTI: Lower Respiratory Tract Infection.
-
#URTI: Upper Respiratory Tract Infection.
Table 3
Incidence of uncomplicated malaria by Sl genotype and α+thalassaemia status in the Kenyan longitudinal cohort study.
https://doi.org/10.7554/eLife.31579.011| Sl1/Sl1 | Sl1/Sl2 | Sl2/Sl2 | ||||
|---|---|---|---|---|---|---|
| Number of episodes | Incidence | Number of episodes | Incidence | Number of episodes | Incidence | |
| All samples | 124 | 2.51 | 493 | 2.31 | 461 | 2.44 |
| Normal α globin | 73 | 4.18 | 238 | 2.87 | 77 | 1.64 |
| Heterozygous α+thalassaemia | 32 | 1.58 | 209 | 1.92 | 302 | 2.88 |
| Homozygous α+thalassaemia | 19 | 1.63 | 46 | 2.09 | 82 | 2.20 |
-
Incidence = number of episodes per child-year of follow up (cyfu). Data were collected from 22 Sl1/Sl1, 94 Sl1/Sl2 and 92 Sl2/Sl2 individuals during 49.4, 213.8 and 188.8 child-years of follow-up, respectively.
Appendix 1—table 1
General characteristics for cases and controls in the Mali case- control study.
https://doi.org/10.7554/eLife.31579.018| Controls (Uncomplicated malaria) | Cases (Cerebral malaria) | P value | |
|---|---|---|---|
| Mali | n = 184 | n = 34 | |
| Gender Males Females | 90 (49 %) 94 (51 %) | 17 (50 %) 17 (50 %) | 0.920 |
| Ethnicity Dogon Non-Dogon | 161 (87.5 %) 23 (12.5 %) | 30 (88 %) 4 (12 %) | 1 |
| Age in months* Median (IQR) | 36.5 (19–56) | 28 (16–41) | 0.026 |
-
Comparisons performed using Pearson’s χ2 test except *Kruskal Wallis test
Appendix 1—table 2
Table of Characteristics for the Malian dataset by Sl and McC genotype.
https://doi.org/10.7554/eLife.31579.019| Sl1/Sl1 | % | Sl1/Sl2 | % | Sl2/Sl2 | % | P value | McCa/McCa | % | McCa/McCb | % | McCb/McCb | % | P value | ||
|---|---|---|---|---|---|---|---|---|---|---|---|---|---|---|---|
| Clinical status | Uncomplicated malaria | 19 | 10.3 | 78 | 42.4 | 87 | 47.3 | 103 | 56.0 | 61 | 33.2 | 20 | 10.9 | ||
| CM | 5 | 14.7 | 19 | 55.9 | 10 | 29.4 | 0.135# | 16 | 47.1 | 15 | 44.1 | 3 | 8.8 | 0.478# | |
| Gender | M | 11 | 10.3 | 48 | 44.9 | 48 | 44.9 | 57 | 53.3 | 41 | 38.3 | 9 | 8.4 | ||
| F | 13 | 11.7 | 49 | 44.1 | 49 | 44.1 | 0.945 | 62 | 55.9 | 35 | 31.5 | 14 | 12.6 | 0.430 | |
| Ethnicity | Dogon | 21 | 11.0 | 88 | 46.1 | 82 | 42.9 | 108 | 56.5 | 66 | 34.6 | 17 | 8.9 | ||
| Non-Dogon | 3 | 11.1 | 9 | 33.3 | 15 | 55.6 | 0.448# | 11 | 40.7 | 10 | 37.0 | 6 | 22.2 | 0.078 | |
| Blood group | O | 13 | 10.0 | 63 | 48.5 | 54 | 41.5 | 68 | 52.3 | 49 | 37.7 | 13 | 10.0 | ||
| Non-O | 11 | 12.5 | 34 | 38.6 | 43 | 48.9 | 0.355 | 51 | 58.0 | 27 | 30.7 | 10 | 11.4 | 0.566 | |
| Median age | Months | 32 | IQR 20–57.5 | 31 | IQR 18–52 | 30 | IQR 17–55 | 0.927 | 30 | IQR 17–52.5 | 31 | IQR 18–54.5 | 51 | IQR 29–64.5 | 0.229 |
-
CM, cerebral malaria; IQR, interquartile range. Significance testing uses uncomplicated malaria as the reference group. Age: Kruskal Wallis test. #: Fisher’s exact test. All other analyses: Pearson’s χ2.
Additional files
-
Supplementary file 1
Additional tables.
(A) General characteristics for the Kenyan case-control study. (B) Characteristics for the Kenyan case-control study by Sl and McC genotype. (C) Hardy Weinberg equilibrium calculations for controls in the Kenyan case-control study. (D) Unadjusted odds ratios for clinical outcomes for the Kenyan case-control study. (E) Sl and McC combined genotypes and adjusted odds ratios for cerebral malaria in the Kenyan case-control study. (F) Sl and McC combined genotypes and adjusted odds ratio for death in the Kenyan case-control study. (G) General characteristics of the Kenyan longitudinal cohort study population by Sl and McC genotypes. (H) Incidence of common childhood diseases by Sl genotypes in the Kenyan longitudinal cohort study. (I) Incidence of common childhood diseases by McC genotypes in the Kenyan longitudinal cohort study. (J) Unadjusted Incidence Rate Ratios (IRR) for uncomplicated malaria and non-malarial diseases in the Kenyan longitudinal cohort study by Sl and McC genotype. (K) Reanalysis of Kenyan case-control study including children who lived outside of the KHDSS study area. (L) Adjusted Odds Ratios for different genetic models for the Sl polymorphism in the Kenyan case-control study. (M) Adjusted Odds Ratios for different genetic models for the McC polymorphism in the Kenyan case-control study. (N) Investigation of the sickle trait/α+thalassaemia negative epistatic interaction and the Sl2/α+thalassaemia interaction by clinical outcome in the Kenyan case-control study. (O) Reanalysis of the Kenyan case-control study excluding all children with one or more sickle cell alleles. (P) Raw data for the combined sickle trait, α+thalassaemia and Sl genotype by clinical outcome in the Kenyan case-control study. (Q) Correlations between the sickle cell, α + thalassaemia, Sl2 and McCb variants in the Kenyan case-control study. (R) Adjusted incidence Rate Ratios (IRRs) for Sl disease associations in the longitudinal cohort study by genetic models of inheritance (S) Adjusted incidence rate ratios for McC disease associations in the longitudinal cohort study by genetic models of inheritance
- https://doi.org/10.7554/eLife.31579.013
-
Reporting standard 1
- https://doi.org/10.7554/eLife.31579.014
-
Transparent reporting form
- https://doi.org/10.7554/eLife.31579.015
Download links
A two-part list of links to download the article, or parts of the article, in various formats.
Downloads (link to download the article as PDF)
Open citations (links to open the citations from this article in various online reference manager services)
Cite this article (links to download the citations from this article in formats compatible with various reference manager tools)
Two complement receptor one alleles have opposing associations with cerebral malaria and interact with α+thalassaemia
eLife 7:e31579.
https://doi.org/10.7554/eLife.31579


