Functional roles of Mg2+ binding sites in ion-dependent gating of a Mg2+ channel, MgtE, revealed by solution NMR
- Tatsuro Maruyama

- Shunsuke Imai
- Tsukasa Kusakizako
- Ryuichiro Ishitani
- Osamu Nureki
- Koichi Ito
- Ichio Shimada
- Masanori Osawa
- The University of Tokyo, Japan
- Fudan University, China
- Nagoya University, Japan
- Keio University, Japan
Figures
Figure 1 with 1 supplement
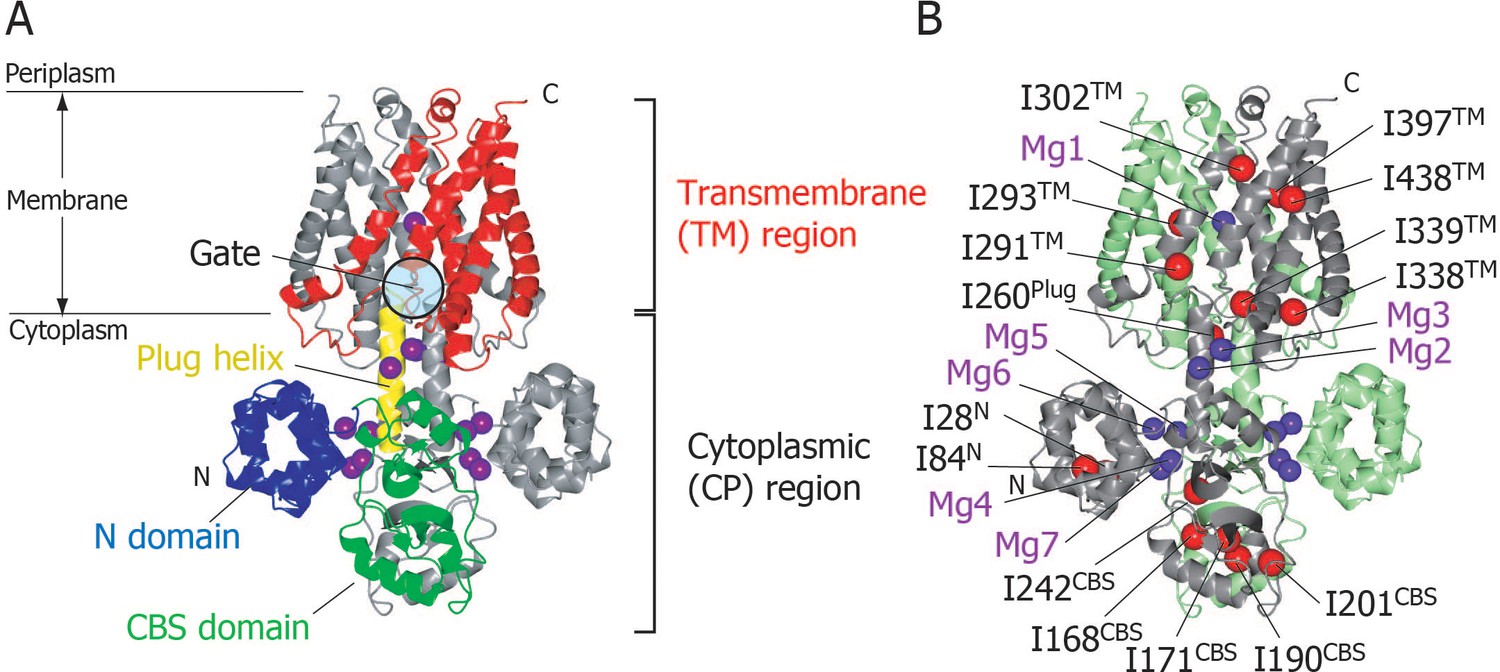
Structure of MgtE in the Mg2+-bound state.
(A) The MgtE dimer (PDB code:2ZY9) viewed in the membrane plane, with the N domain (blue), the CBS domain (green), the plug helix (yellow), and the TM region (red) highlighted in one subunit. Mg2+ ions are shown as purple spheres. The gate region is circled (see Figure 1—figure supplement 1). (B) Two subunits of the dimer are shown in green and grey, respectively. Ile Cδ1 atoms in the grey subunit are shown as red spheres. The Mg2+-binding sites in the dimer, Mg1-Mg7, are also labelled.
Figure 1—figure supplement 1
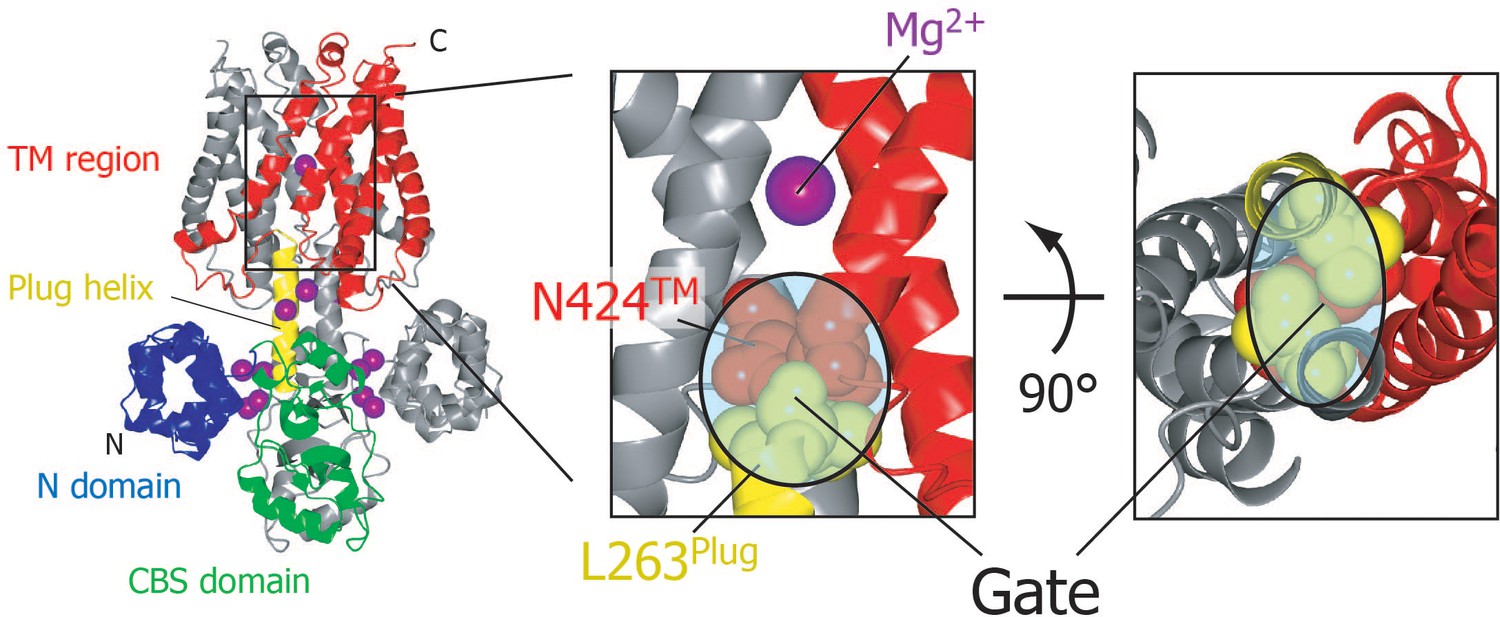
Gate region of MgtE.
MgtE structure in the Mg2+-bound, closed state (PDB code: 2ZY9) is shown in the same colour scheme as in Figure 1A. L263 residues in the C-termini of the plug helices and N424 residues in the TM helices are shown as red and yellow spheres, respectively. The direct interaction between these residues closes the ion- conducting pore at its cytoplasmic side; thus, this region is assumed to function as a gate in MgtE.
Figure 2 with 2 supplements
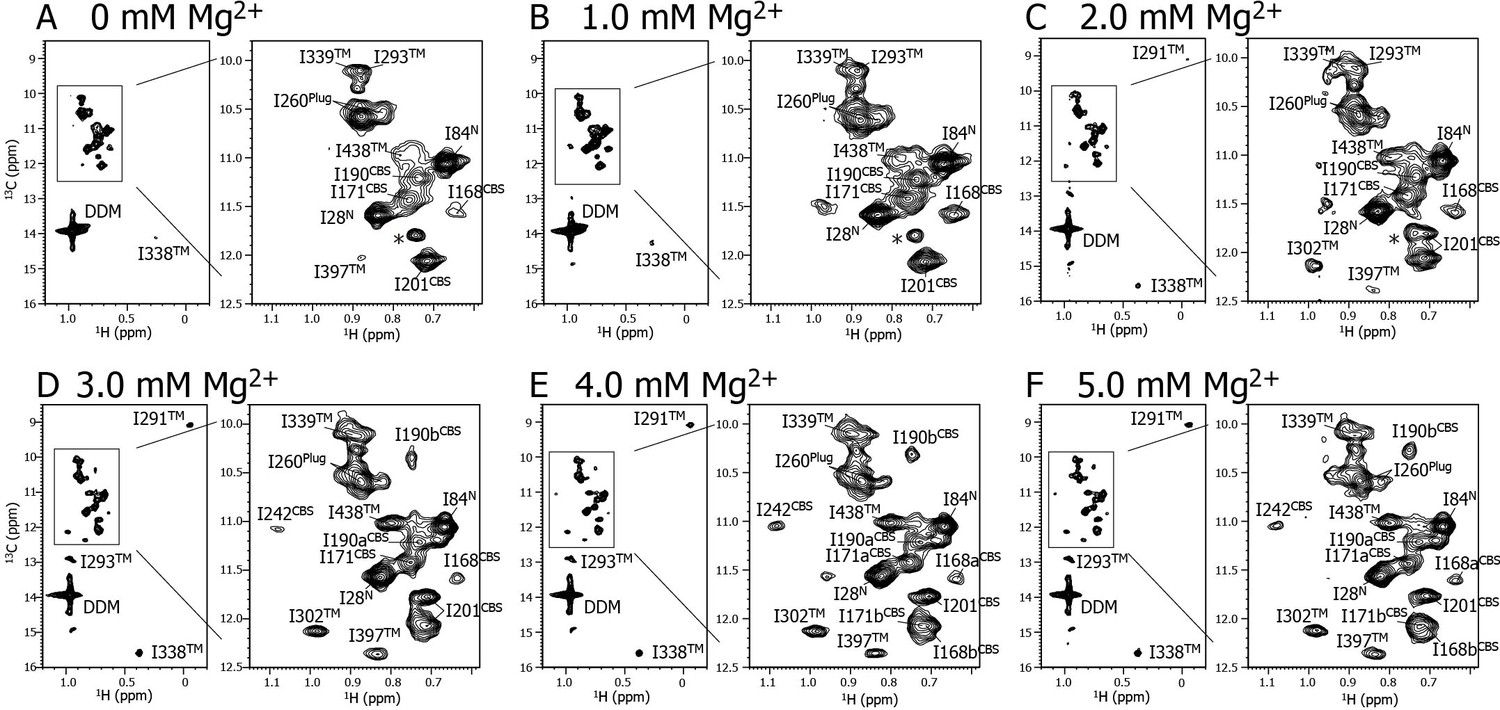
Mg2+ titration experiments monitored by NMR signals of the Ile δ1 methyl groups.
Methyl-TROSY spectra of {u-2H, Ileδ1-[13CH3]} MgtE reconstituted into DDM micelles in the presence of (A) 0, (B) 1.0, (C) 2.0, (D) 3.0, (E) 4.0, and (F) 5.0 mM Mg2+. The signal with an asterisk is unassigned.
Figure 2—figure supplement 1
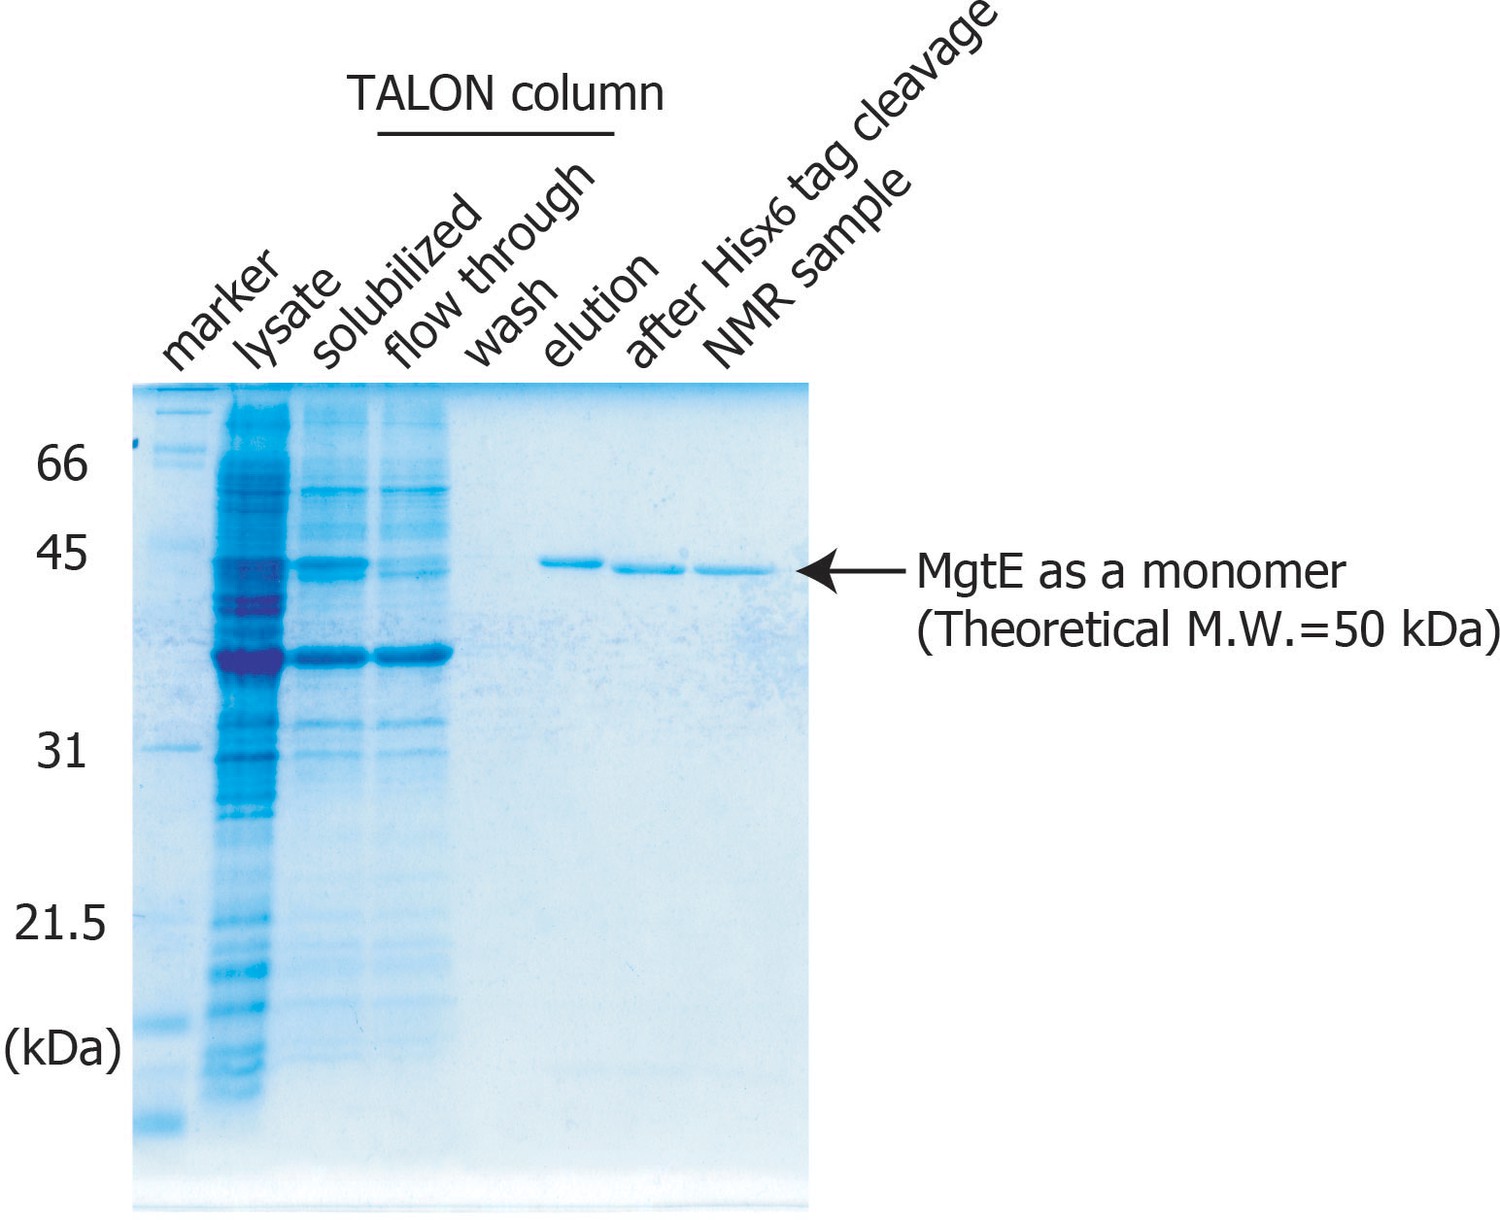
Purification of MgtE.
Sodium dodecyl sulphate-polyacrylamide gel electrophoresis analysis of the purified full-length MgtE is shown.
Figure 2—figure supplement 2
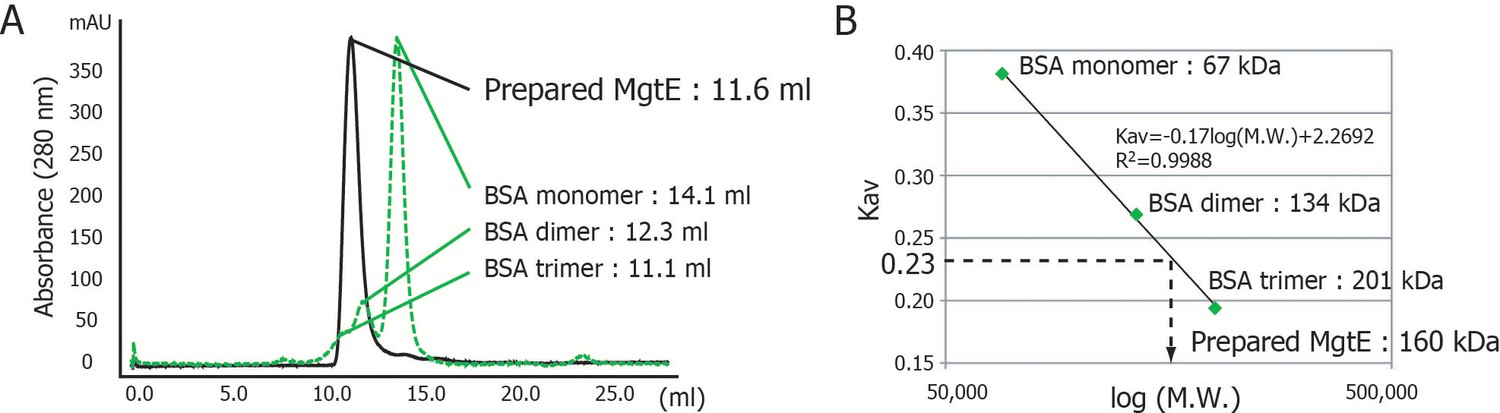
Analysis of the oligomeric state of purified full-length MgtE in DDM micelles.
(A) The elution profile of purified MgtE by size exclusion chromatography (SEC) on a Superdex 200 GL 10/300 column (black solid line), along with a standard sample of bovine serum albumin (BSA) (green dashed line). The running buffer was 20 mM HEPES-NaOH (pH 6.1), 100 mM NaCl, and 1 mM DDM. The elution volumes were 11.6 mL for purified MgtE, 14.1 mL, 12.3 mL, and 11.1 mL for the BSA monomer, dimer, and tetramer, respectively. (B) Estimated distribution coefficients (Kav) from the elution volume in (A) were plotted against logarithmic molecular weight (M.W.). The solid line is the best fit function as indicated in the graph of plots of the BSA monomer, dimer, and tetramer. The estimated apparent M.W. of purified MgtE (Kav = 0.23) is approximately 160 kDa, suggesting that the purified MgtE, whose theoretical M.W. is 50 kDa, exists as a dimer in DDM micelles, as the apparent M.W. of DDM micelles is 60 kDa.
Figure 3
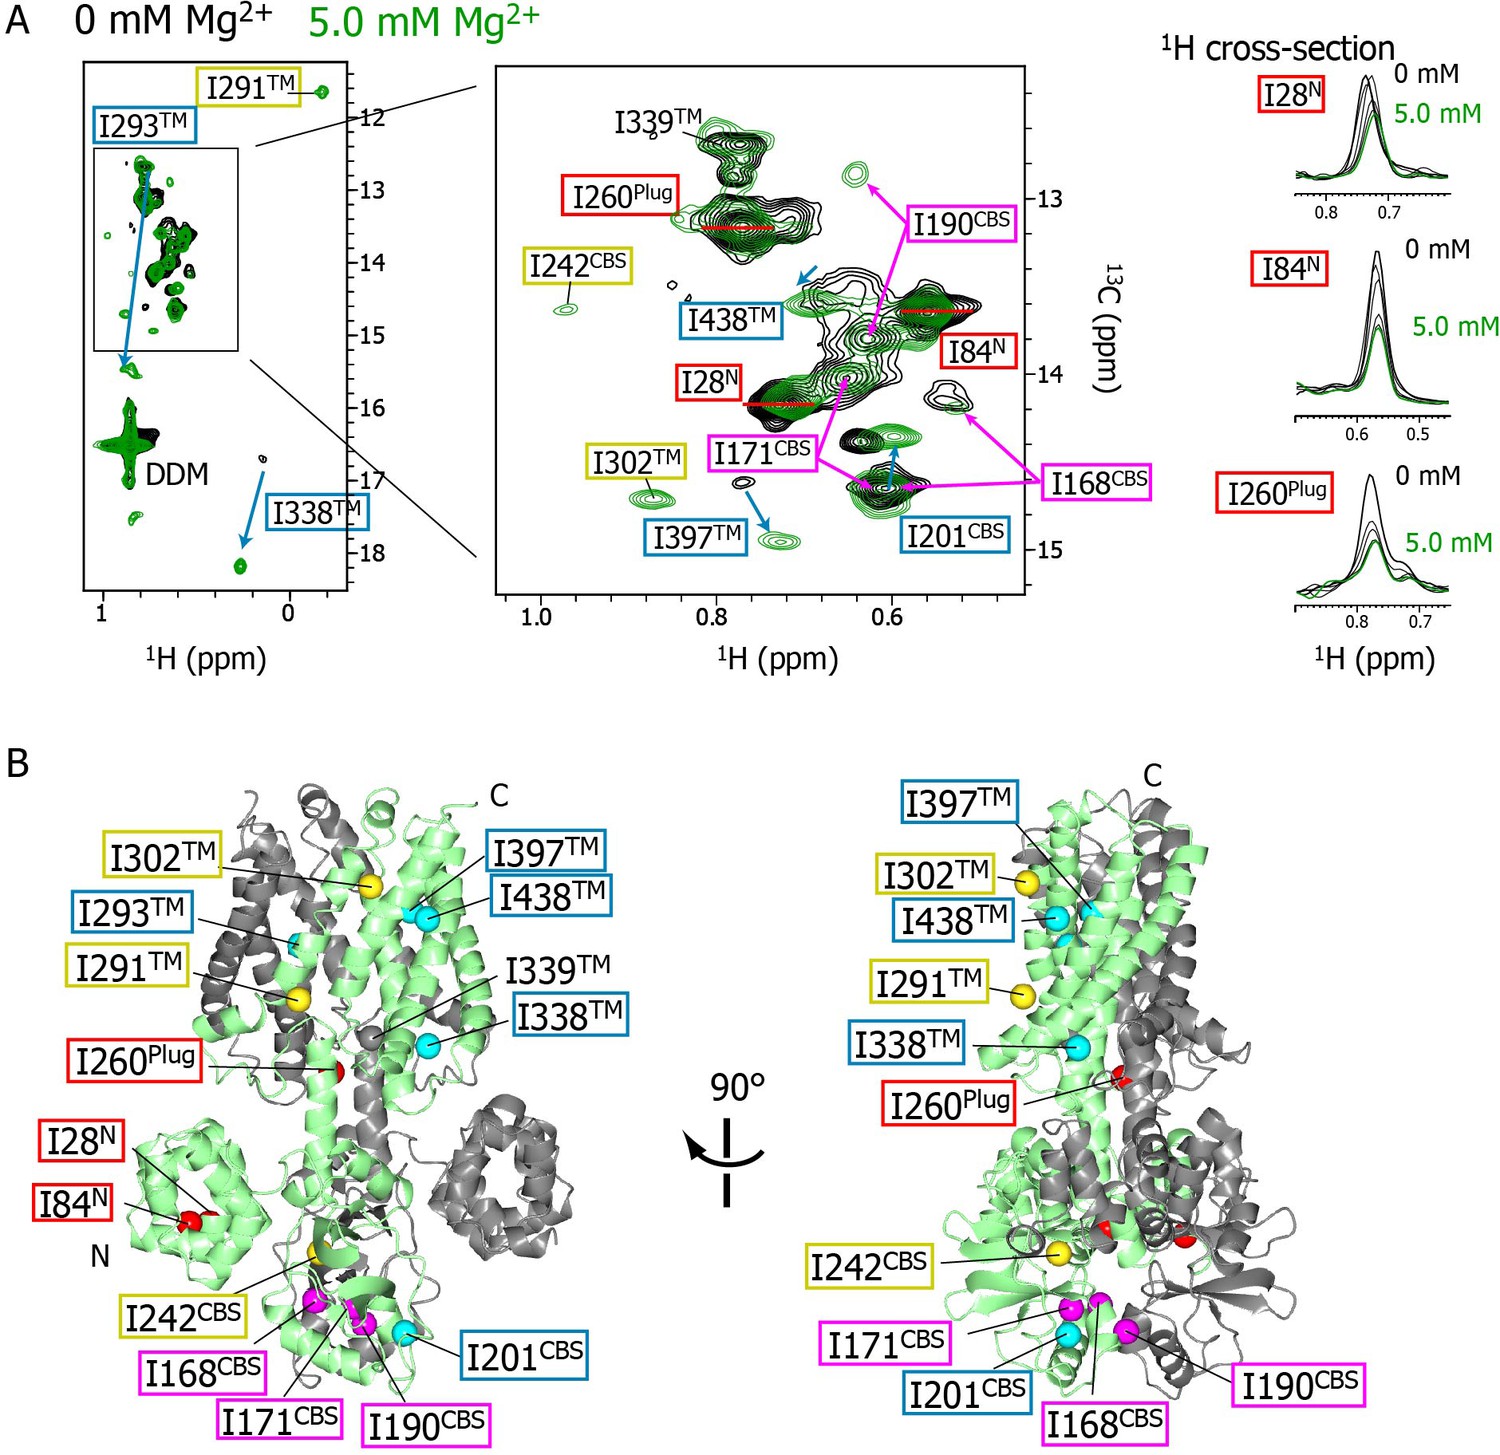
Mg2+-concentration-dependent spectral changes in MgtE.
(A) Superposition of the methyl-TROSY spectra in the Mg2+-free state (0 mM; black) and the bound state (5.0 mM; green). Upon Mg2+ binding, (i) the residues whose signals broadened are boxed in red, (ii) the residues whose signals appeared or were sharpened are boxed in yellow, (iii) the residues exhibiting chemical shift changes are boxed in cyan, with an arrow indicating the direction of the chemical shift changes, and (iv) the residues for which two signals were observed (split signals) are boxed in magenta. The right panels show the 1H cross-sections for the I28N, I84N, and I260Plug signals at Mg2+ concentrations of 0, 1.0, 2.0, 3.0, 4.0, and 5.0 mM. (B) Mapping of the residues whose signals exhibited the Mg2+-dependent changes in (A) on the Mg2+-bound crystal structure (PDB code:2ZY9). Ile Cδ1 atoms are coloured as in (A), whereas the Ile Cδ1 atom of I339, which exhibited no significant change, is coloured grey.
Figure 4
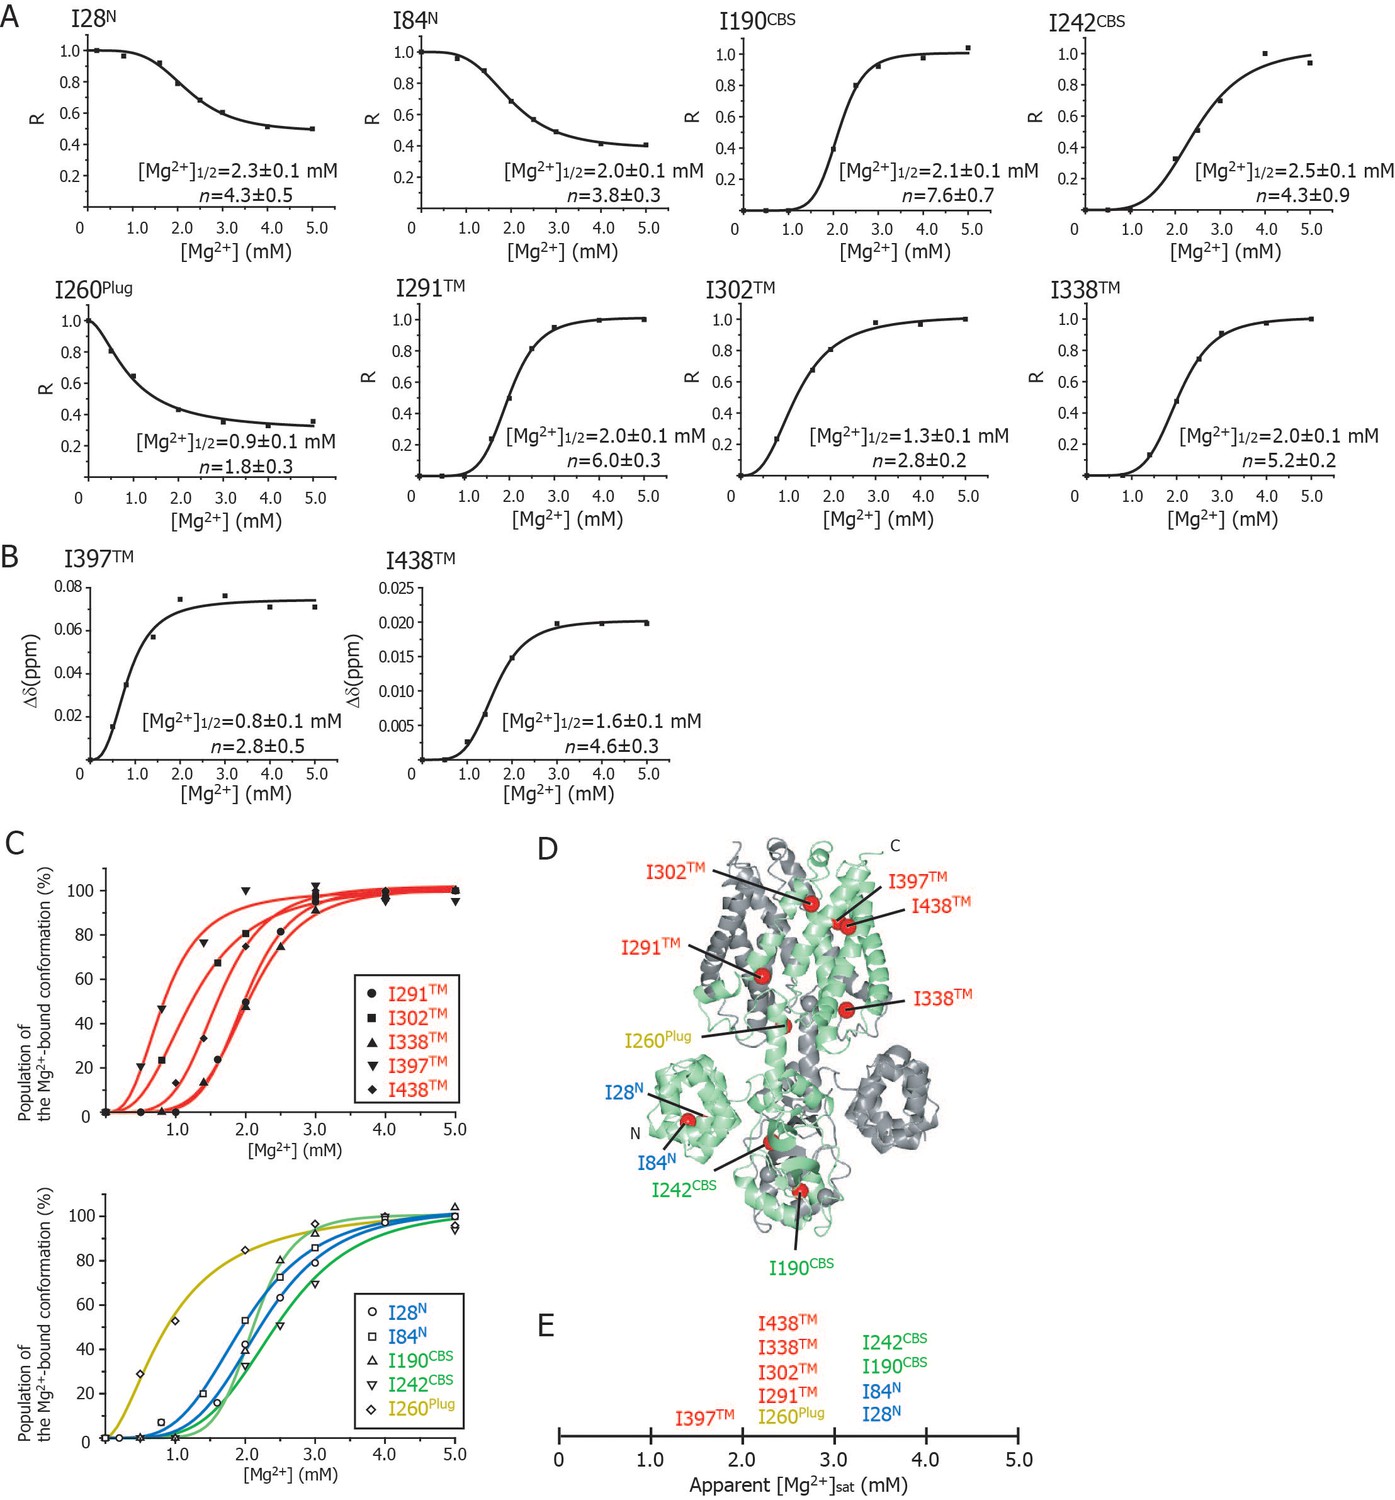
Cooperative effects of Mg2+ binding on Ileδ1 methyl signals.
(A) Normalized signal intensities (R) and (B) chemical shift changes (Δδ) of Ileδ1 methyl signals plotted against Mg2+ concentration ([Mg2+]). The solid lines represent the best fit curves of a Hill equation to the data. The estimated Mg2+ concentrations reaching the half maximal values of the changes ([Mg2+]1/2) and the Hill coefficients (n) are shown in each graph. (C) Superposition of the changes in the population of the Mg2+-bound conformation of the Ile δ1 methyl signals. The normalized changes in the chemical shift values and signal intensities in A and B were regarded as changes in the population of the Mg2+-bound conformation. The solid lines, coloured blue for the N domain, green for the CBS domain, yellow for the plug helix, and red for the TM region, represent the best fit curves of Hill equations to the data. The graphs of Ile residues in the TM and other regions are separated for clarity. (D) The positions of Ile residues (red) subjected to the analyses. (E) Apparent saturated Mg2+ concentrations, [Mg2+]sat at which the population of the Mg2+-bound conformation is above 90%. Apparent [Mg2+]sat is 3 mM for the Ile residues in the plug helix and the TM region, and 4 mM for the Ile residues in the N and CBS domains in the CP region.
Figure 5 with 3 supplements
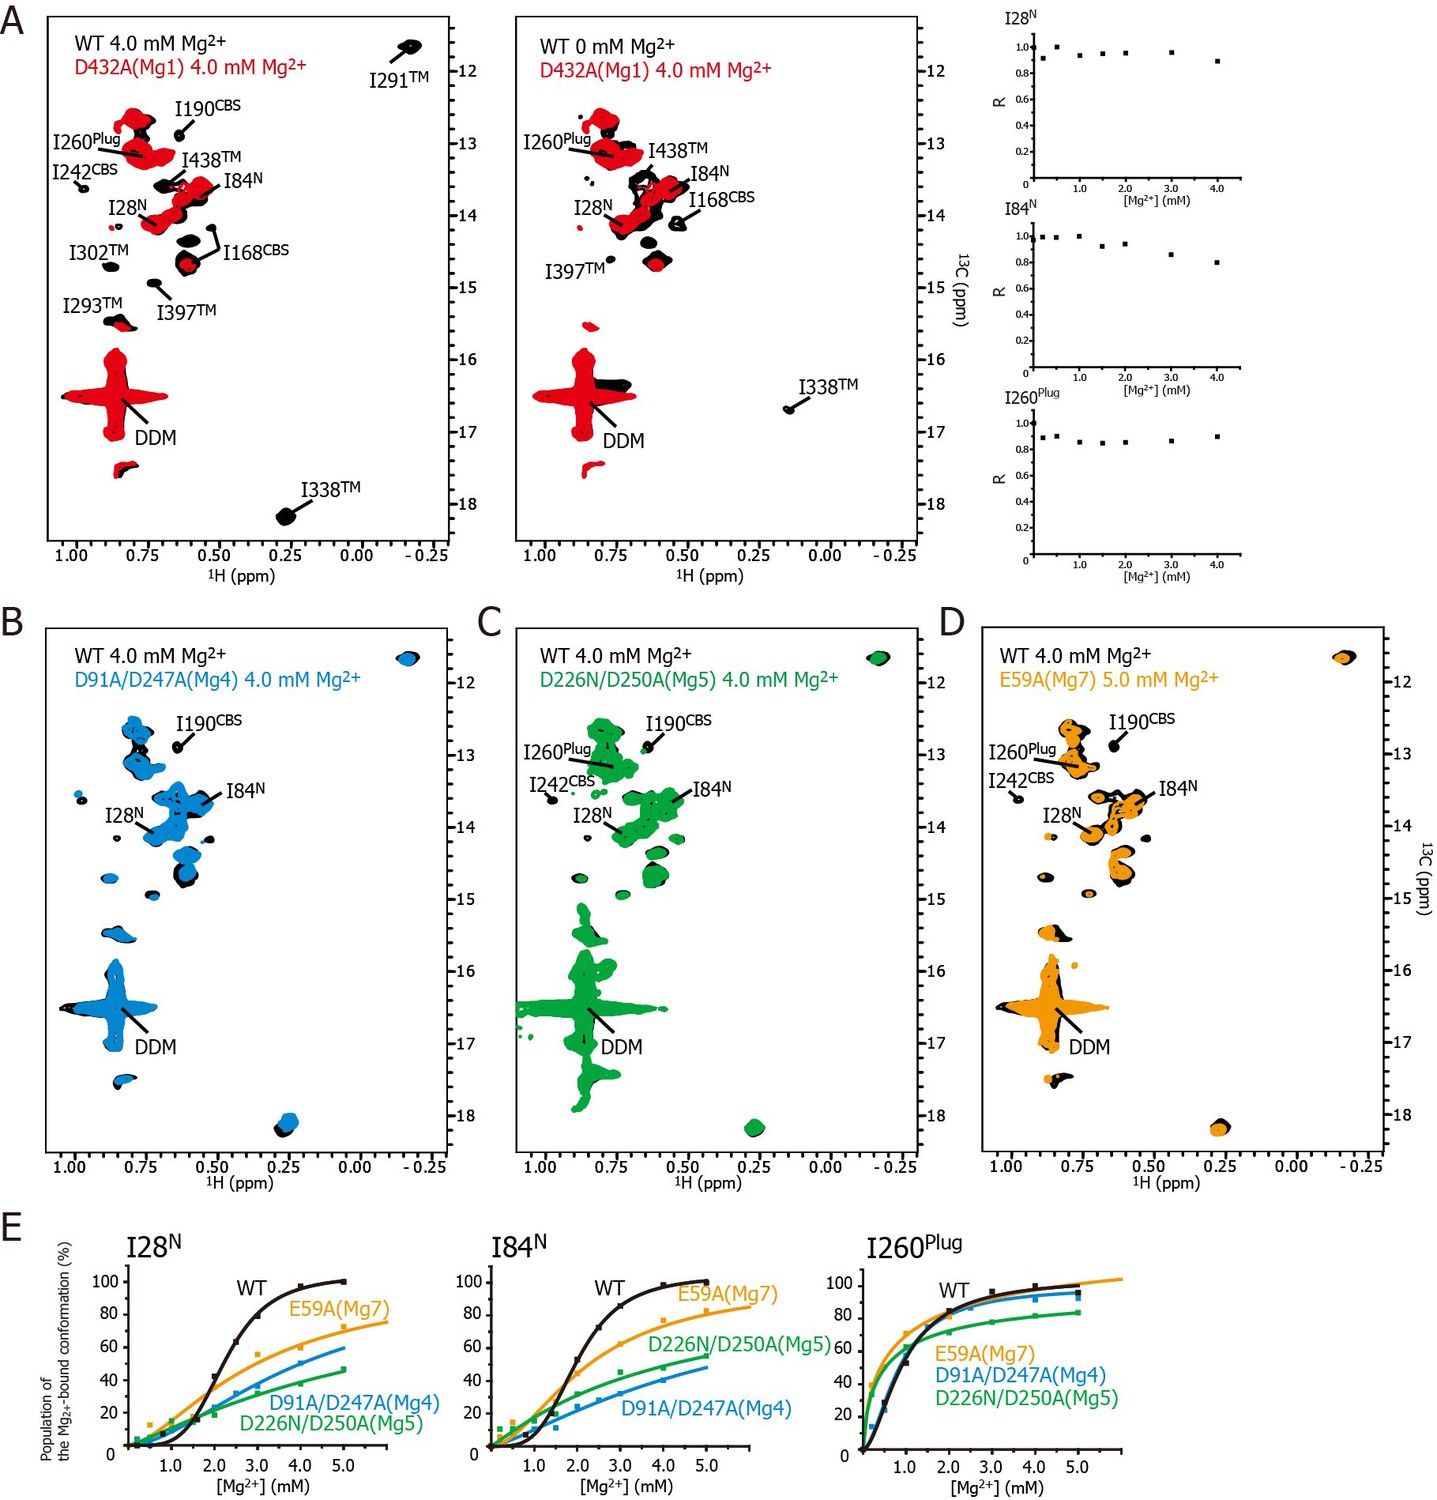
Effects of mutations at each Mg2+-binding site on the Mg2+-dependent conformational changes.
(A) Methyl-TROSY spectrum of the D432A mutant for Mg1 in the presence of 4.0 mM Mg2+ (red) superimposed on the spectrum of the wild-type (WT) protein (black) in the presence (left) and absence (middle) of 4.0 mM Mg2+. Normalized signal intensities (R) for I28N, I84N, and I260Plug in the Mg1 mutant were plotted against Mg2+ concentration ([Mg2+]). (B–D) Methyl-TROSY spectra of the D91A/D247A mutant of Mg4 (B, cyan), the D226N/D250A mutant of Mg5 (C, green), and the E59A mutant of Mg7 (D, orange) in the presence of 4.0–5.0 mM Mg2+, are overlaid on that of the wild-type (black) in the presence of 4.0 mM Mg2+. The signals differing from those in the wild-type are labelled. (E) The population of the Mg2+-bound conformation of I28N, I84N, and I260Plug plotted against Mg2+ concentrations ([Mg2+]). The solid lines are coloured black for the wild-type, cyan for the Mg4 mutant (D91A/D247A), green for Mg5 mutant (D226N/D250A), and orange for Mg7 mutant (E59A), respectively.
Figure 5—figure supplement 1
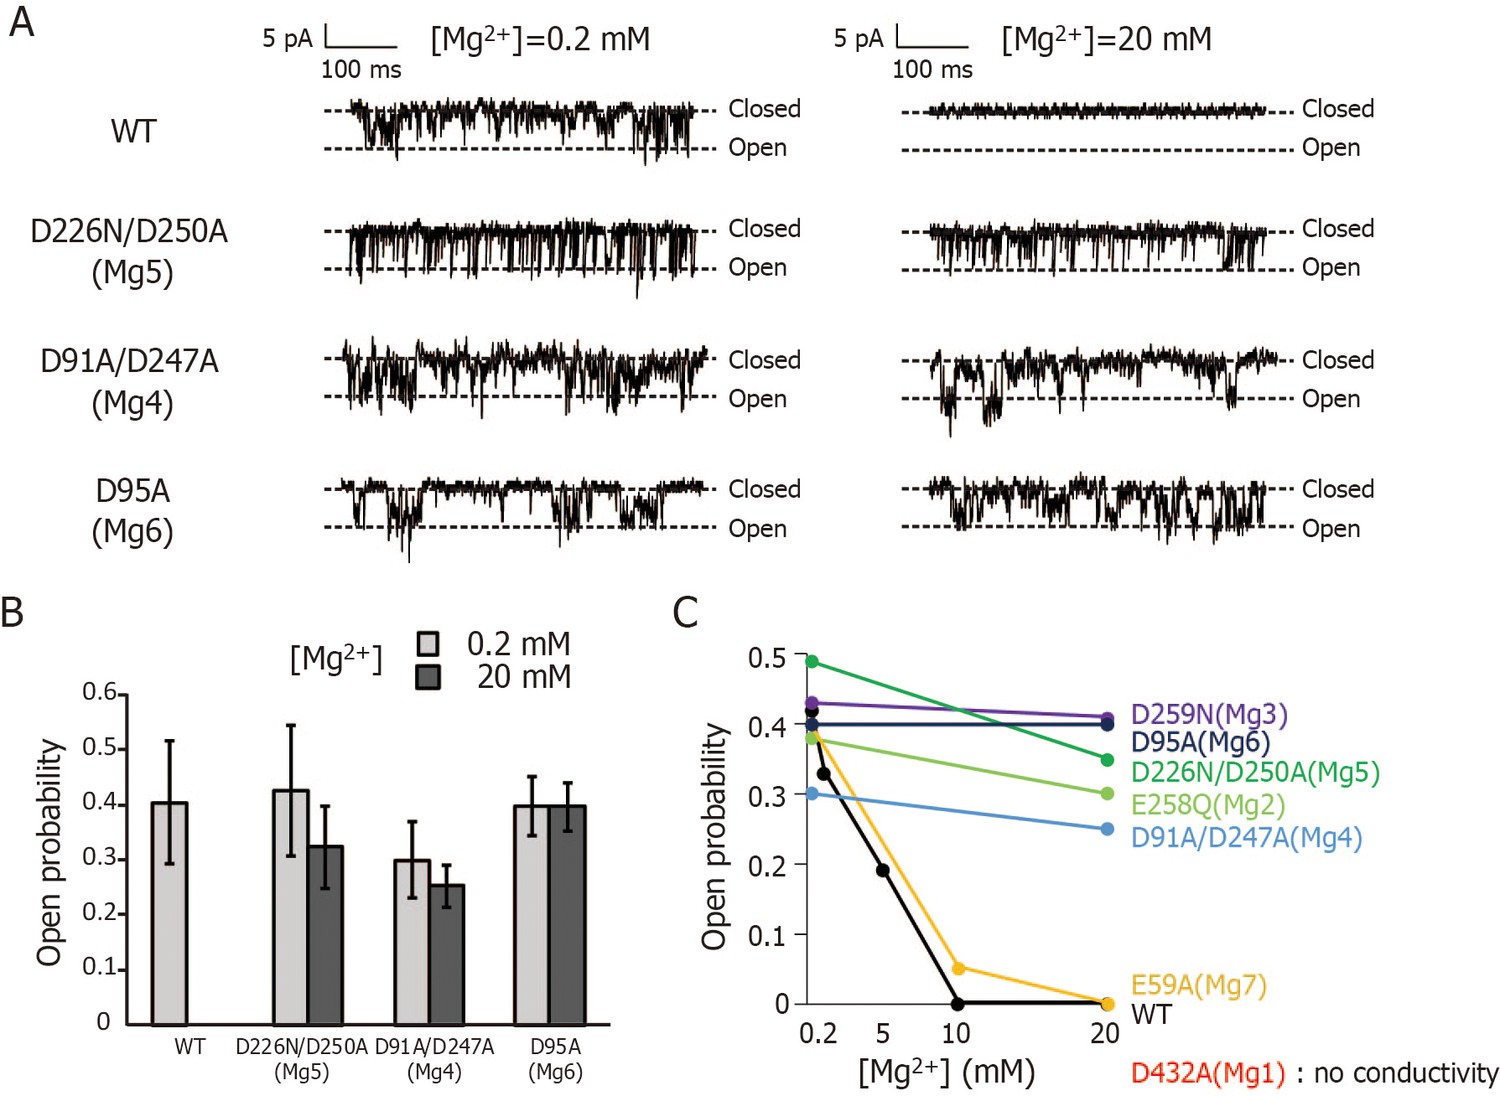
Patch-clamp analyses of wild-type and mutant forms of MgtE using the Mg2+-auxotrophic E. coli strain.
(A) Membrane patches from E coli. giant spheroplasts expressing wild-type (WT) and Mg5- (D226N/D250A), Mg4- (D91A/D247A), or Mg6- (D95A) binding site mutants were clamped at voltage of −80 mV and single-channel currents were recorded in the presence of 0.2 mM or 20 mM Mg2+ on the periplasmic side. (B) Open probability of wild-type (WT) and Mg5-, Mg4-, or Mg6-binding site mutants in the presence of 0.2 mM or 20 mM Mg2+ on the periplasmic side was plotted. The data of wild-type in the presence of 20 mM Mg2+ were not plotted because no current upon channel-opening was observed. Experiments were repeated 3–4 times. (C) Plot of Mg2+-concentration dependence of the open probability of wild-type and Mg2+-binding site mutants of MgtE. Wild-type (WT) and Mg2-, Mg3-, Mg5-, or Mg7-binding site mutants were analysed at −40 mV in the previous paper (Hattori et al., 2009). Mg4- and Mg6-binding site mutants were analysed at −80 mV in this study. It should be noted that open probability of MgtE exhibited no membrane potential dependency (Hattori et al., 2009).
Figure 5—figure supplement 2
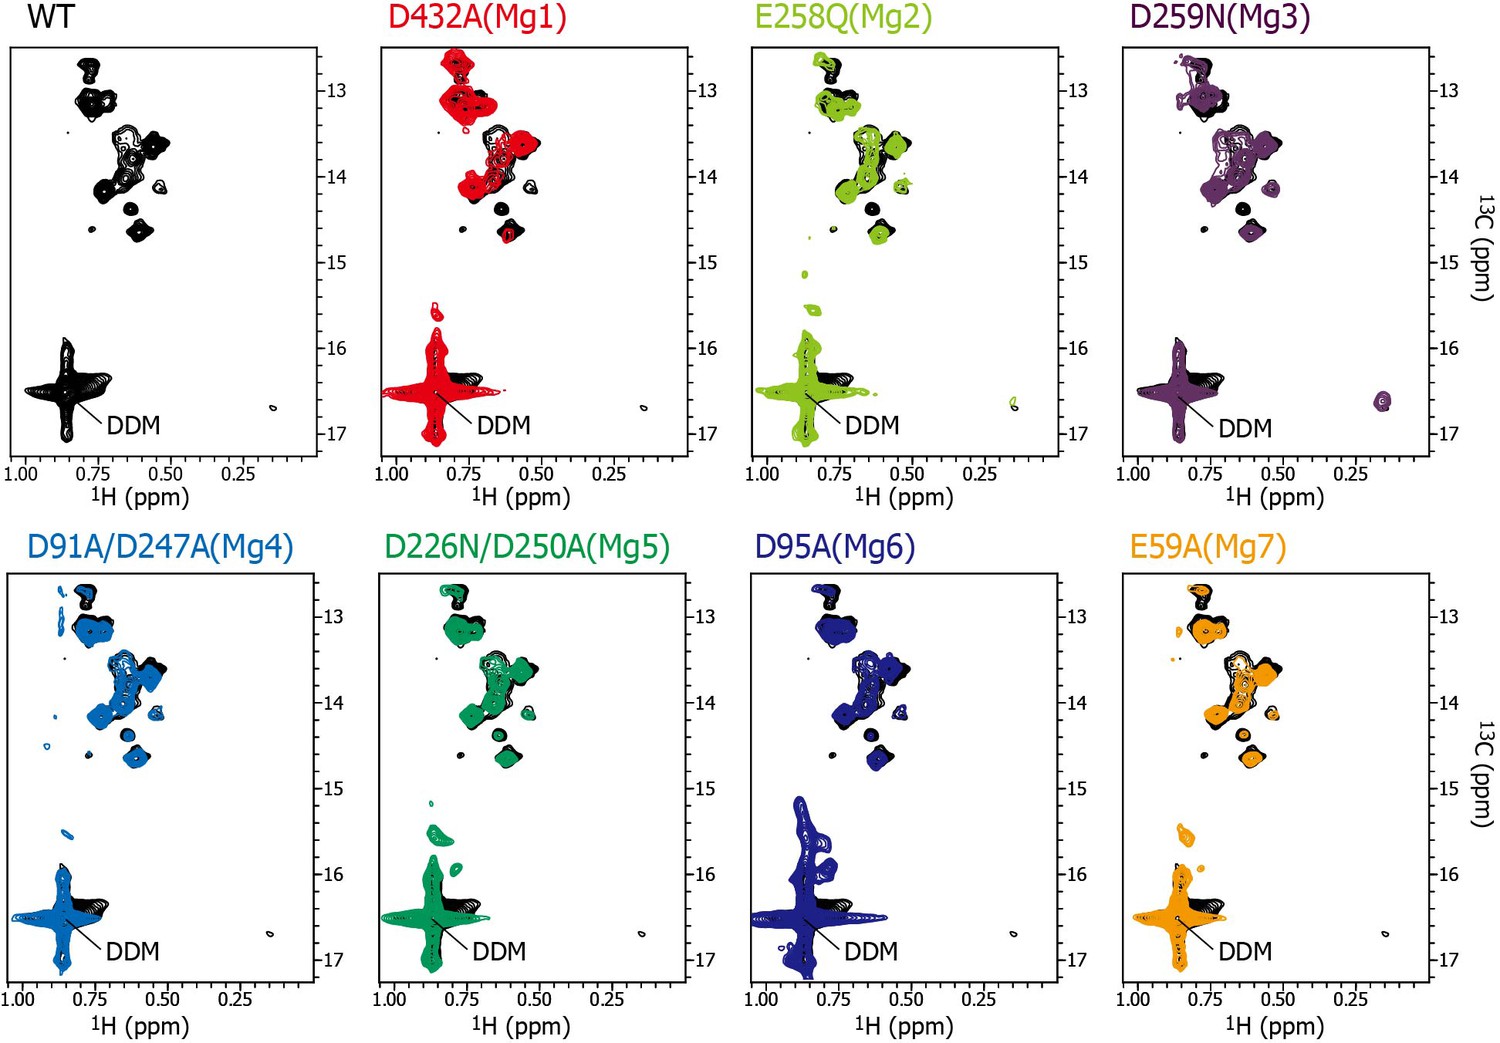
Effects of the mutations at each Mg2+-binding site on the MgtE structure in the absence of Mg2+.
Methyl-TROSY spectrum of MgtE wild-type (black) in the absence of Mg2+ is overlaid with that of the D432A mutant for Mg1 (red), the E258Q mutant for Mg2 (light green), the D259N mutant for Mg3 (purple), the D91A/D247A mutant for Mg4 (cyan), the D226N/D250A mutant for Mg5 (green), the D95A mutant for Mg6 (blue), and the E59A mutant for Mg7 (orange) in the absence of Mg2+.
Figure 5—figure supplement 3
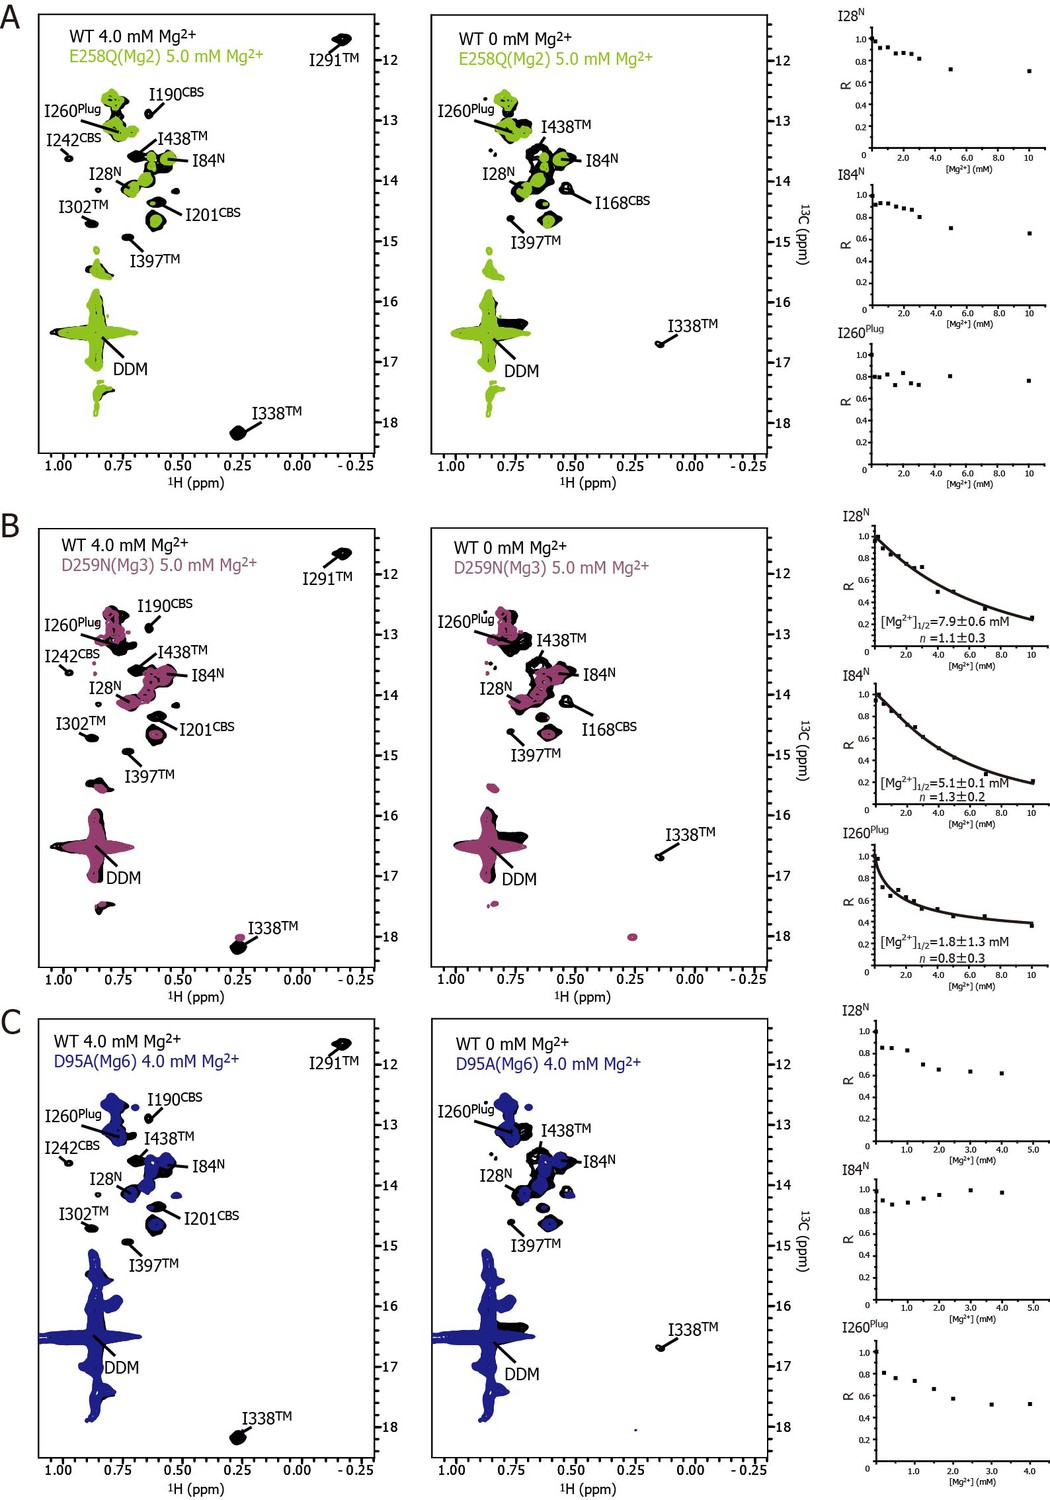
Effects of the mutations at each Mg2+ binding site on the Mg2+-dependent changes in MgtE structure and dynamics.
(A–C) Methyl-TROSY spectrum of the E258Q mutant of the Mg2 site in the presence of 5.0 mM Mg2+ (A, light green), the D259N mutant of the Mg3 site in the presence of 5.0 mM Mg2+ (B, purple), and the D95N mutant of the Mg6 site in the presence of 4.0 mM Mg2+ (C, blue) superimposed on the spectrum of the wild-type (WT) protein (black) in the presence (left) and absence (middle) of 4.0 mM Mg2+, respectively. Normalized signal intensities (R) for I28N, I84N, and I260Plug were plotted against Mg2+ concentration ([Mg2+]). The solid lines in (B) represent the best fit curves of a Hill equation to the data. The estimated Mg2+ concentrations reaching half maximal values of the changes ([Mg2+]1/2) and the Hill coefficients (n) are shown in the graph.
Figure 6
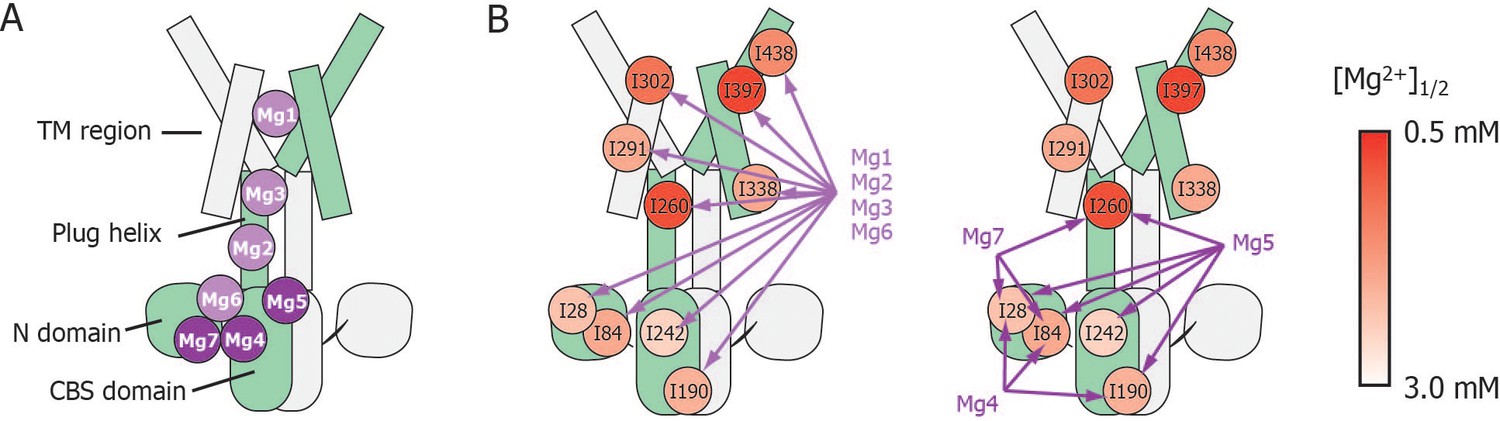
Schematic summary of the effects of mutations at each Mg2+-binding site on Mg2+-dependent changes in the conformation and dynamics.
(A) Positions of Mg2+-binding sites in one subunit. (B) Relationship between the Mg2+-binding sites and the Ile residues whose Mg2+-dependent changes of the NMR signal were affected by the mutations at each Mg2+-binding site. The mutated Mg2+-binding sites and the affected residues are connected with arrows. The Ile residues are coloured by the [Mg2+]1/2 values shown in Figure 4, as indicated.
Figure 7

Roles for each Mg2+ binding site in the gating of MgtE.
In the Mg2+-free state, which MgtE does not adopt in physiological conditions, conformational equilibrium exists between the CBS domain and the TM region, whereas the N domain and the plug helix have high motional flexibility. Cooperative Mg2+ binding to Mg1, Mg2, Mg3, and Mg6 form the ion-conducting pore, whose gate is closed by cooperative Mg2+ binding to Mg4, Mg5, and Mg7. The Mg2+ bound at Mg4 forms a bridge between the N domain and the plug helix in the same subunit. The Mg2+ bound at Mg5 forms a bridge between the CBS domain in one subunit and the plug helix in the other subunit. The Mg2+ bound at Mg7 forms a bridge between the N domain in one subunit and the CBS domain in the other subunit. Together, these bound Mg2+ atoms may stabilize the domain orientations in close proximity to each other.
Tables
Table 1
Assignments of Ile δ1 methyl groups of full-length MgtE.
Chemical shifts for δ1 methyl groups in Ile residues in the Mg2+-free and bound states are shown. Labels a and b are used to discriminate two signals from a single Ile residue. 1H chemical shifts were referenced to external sodium 2,2-dimethyl-2-silapentane-5-sulfonate (0 ppm), and 13C chemical shifts were referenced indirectly. Spectral width (eight ppm) in the 13C dimension was subtracted from the 13C chemical shift of I338 owing to spectral aliasing.
| Methyl group | Mg2+-free state (0 mM Mg2+) | Mg2+-bound state (5.0 mM Mg2+) | ||
|---|---|---|---|---|
| 1H (ppm) | 13C (ppm) | 1H (ppm) | 13C (ppm) | |
| I28 | 0.729 | 14.16 | 0.714 | 14.13 |
| I84 | 0.559 | 13.63 | 0.526 | 13.62 |
| I168a | 0.539 | 14.12 | 0.526 | 14.14 |
| I168b | – | – | 0.606 | 14.62 |
| I171a | 0.651 | 13.99 | 0.644 | 13.98 |
| I171b | – | – | 0.606 | 14.62 |
| I190a | 0.627 | 13.77 | 0.621 | 13.77 |
| I190b | – | – | 0.641 | 12.83 |
| I201 | 0.606 | 14.62 | 0.599 | 14.33 |
| I242 | – | – | 0.85 | 14.13 |
| I260 | 0.771 | 13.13 | 0.762 | 13.15 |
| I291 | – | – | −0.171 | 11.63 |
| I293 | 0.773 | 12.66 | 0.858 | 15.45 |
| I302 | – | – | 0.872 | 14.68 |
| I338 | 0.145 | 8.67 | 0.264 | 10.16 |
| I339 | 0.799 | 12.66 | 0.798 | 12.65 |
| I397 | 0.771 | 14.59 | 0.728 | 14.92 |
| I438 | 0.674 | 13.54 | 0.693 | 13.58 |
Key resources table
| Reagent type (species) or resource | Designation | Source or reference | Identifiers | Additional information |
|---|---|---|---|---|
| Gene (Thermus thermophilus) | MgtE | doi: 10.1107/S1744309107032332 | Uniprot ID: Q5SMG8 | |
| Strain, strain background (Escherichia coli) | BW25113 ΔmgtA ΔcorA ΔyhiD DE3 | doi: 10.1038/emboj.2009.288 | ||
| Recombinant DNA reagent | pET28a-MgtE | doi: 10.1107/S1744309107032332 |
Additional files
-
Transparent reporting form
- https://doi.org/10.7554/eLife.31596.016
Download links
A two-part list of links to download the article, or parts of the article, in various formats.
Downloads (link to download the article as PDF)
Open citations (links to open the citations from this article in various online reference manager services)
Cite this article (links to download the citations from this article in formats compatible with various reference manager tools)
Functional roles of Mg2+ binding sites in ion-dependent gating of a Mg2+ channel, MgtE, revealed by solution NMR
eLife 7:e31596.
https://doi.org/10.7554/eLife.31596


