Internal amino acid state modulates yeast taste neurons to support protein homeostasis in Drosophila
- Champalimaud Centre for the Unknown, Portugal
Figures
Figure 1 with 3 supplements

Identification of neuronal populations required for yeast feeding.
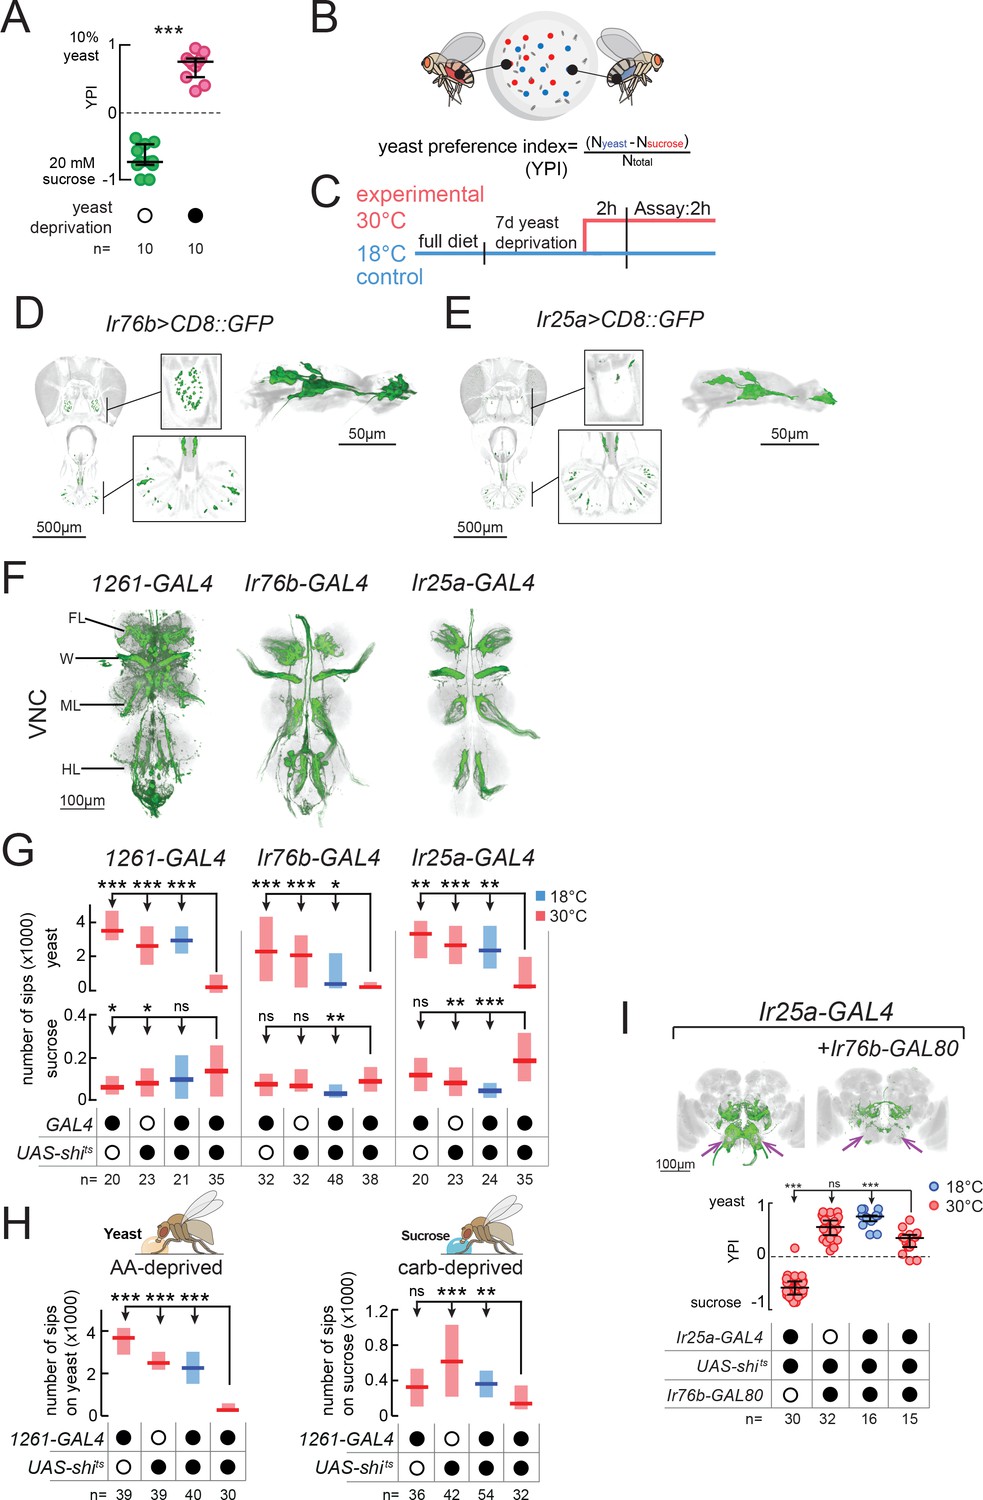
(A) Number of sips from 10% yeast (left) and 20 mM sucrose (right) by mated female flies of the genotype Ir76b-GAL4,UAS-GCaMP6s, fed for 3 days on a holidic diet with the indicated composition. (B) Yeast preference index (YPI) of yeast-deprived female flies in which 1261-GAL4 neurons were acutely silenced and corresponding controls. (C) Expression pattern of 1261-GAL4 in the head and tarsus of the fly. Boxes are magnifications of the antenna or the labellum. Note absence of signal in the maxillary palps. Green represents GFP signal and gray the cuticular autofluorescence. (D) YPI of yeast-deprived female flies in which Ir76b- or Ir25a-GAL4 neurons were acutely silenced and corresponding controls. (E) YPI of yeast-deprived female flies in which 1261-GAL4 neurons were all silenced, or with Ir76b-GAL80, and corresponding controls. Arrows indicate presence/loss of GFP expression in the SEZ. (D) and (E) Expression pattern of experimental flies in the brain as visualized using UAS-CD8::GFP in green, with nc82 synaptic staining in gray. Note absence of cell bodies in the Ir25a-GAL4 brain. A, antenna; VCSO, ventral cibarial sense organ; LSO, labral sense organ; L, labellum; AL, antennal lobes; SEZ, subesophageal zone. In this and following figures, empty and filled black circles represent absence and presence of the indicated elements, respectively. In (A), boxes represent median with upper/lower quartiles. In (B), (D) and (E), circles represent yeast preference in single assays, with line representing the median and whiskers the interquartile range. ***p<0.001, *p<0.05, ns p≥0.05. Groups compared by Kruskal-Wallis test, followed by Dunn’s multiple comparison test.
Figure 1—figure supplement 1
Individual yeast metabolites do not explain the phagostimulatory power of yeast.
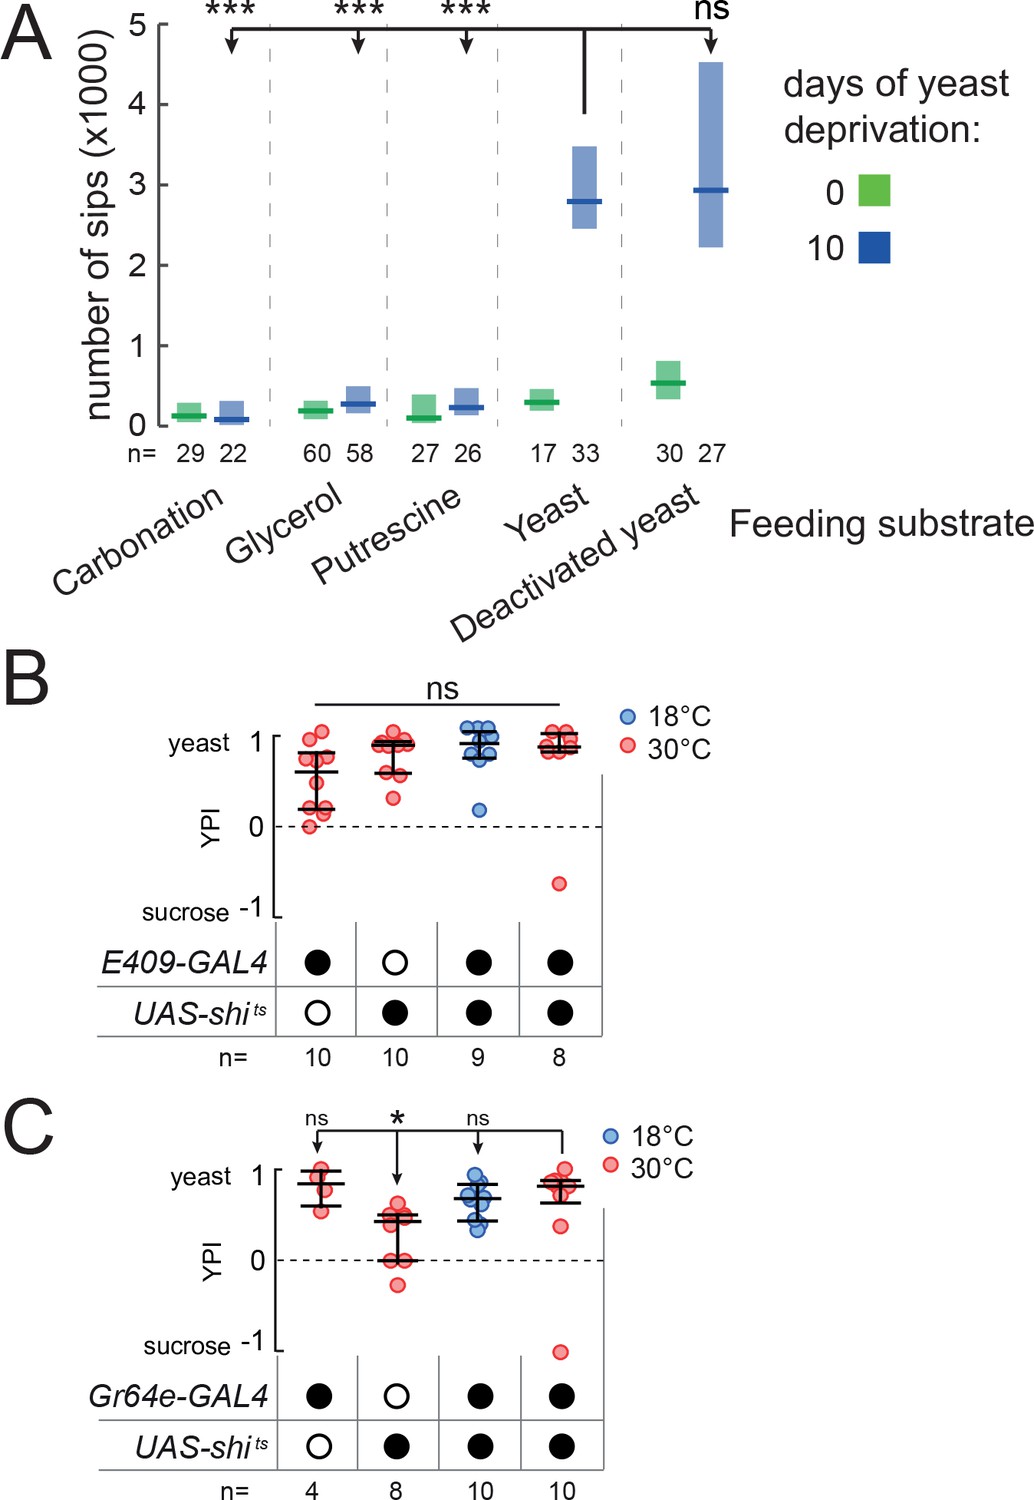
(A) Number of sips from the indicated substrates by female flies of the genotype Ir76b-GAL4,UAS-GCaMP6s, either fully-fed or deprived from yeast for 10 days. Concentrations are detailed in Materials and methods. (B) and (C) YPI of yeast-deprived female flies in which E409- or Gr64e-GAL4 neurons were acutely silenced and corresponding controls. In (A), boxes represent median with upper/lower quartiles. In (B) and (C), circles represent yeast preference in single assays, with line representing the median and whiskers the interquartile range. ***p<0.001, *p<0.05, ns p≥0.05. Groups compared by Kruskal-Wallis test, followed by Dunn’s multiple comparison test.
Figure 1—figure supplement 2
Characterization of neuronal populations required for yeast feeding.
(A) YPI of w1118 female flies prefed a complete diet (YBM) or deprived of yeast for 3 days. (B) Overview of the two-color food choice assay. (C) Experimental design for the neuronal silencing experiments using shibirets. Flies were reared and yeast-deprived at 18°C until two hours prior to the assay. Experimental flies were tested at 18°C and 30°C. Genetic control flies were tested at 30°C. (D) and (E) Expression pattern of Ir76b- (D) and Ir25a-GAL4 (E) in the head and tarsus of the fly. Boxes are magnifications of the antenna or the labellum. Note absence of signal in the maxillary palps. Green represents GFP signal and gray the cuticular autofluorescence. (F) Expression pattern of 1261-, Ir76b- and Ir25a-GAL4 lines in the ventral nerve cord (VNC). Green represents GFP signal and gray nc82 synaptic staining. Note absence of cell bodies in the Ir25a-GAL4 VNC. (G) Number of sips from 10% yeast (upper) and 20 mM sucrose (lower) by yeast-deprived females in which 1261-, Ir76b- or Ir25a-GAL4 neurons were acutely silenced, and corresponding controls. (H) Number of sips from 10% yeast by amino acid-deprived females (left) and from 20 mM sucrose by sucrose-deprived females (right) in which 1261-GAL4 neurons were acutely silenced, and corresponding controls. (I) YPI of yeast-deprived female flies in which Ir25a-GAL4 neurons were all silenced, or with Ir76b-GAL80, and corresponding controls. Expression pattern of experimental flies in the brain as visualized using UAS-CD8::GFP in green, with nc82 synaptic staining in gray. Arrows indicate presence/loss of GFP expression in the SEZ. FL, foreleg projections; ML, midleg projections; HL, hindleg projections; W, wing projections. In (A) and (I), circles represent yeast preference in single assays, with line representing the median and whiskers the interquartile range. In (G) and (H), boxes represent median with upper/lower quartiles. ***p<0.001, **p<0.01, *p<0.05, ns p≥0.05. Groups compared by Kruskal-Wallis test, followed by Dunn’s multiple comparison test.
Figure 1—figure supplement 3
The idenitified lines label neurons required for amino acid preference and amino acids are not the sole determinant of yeast feeding.
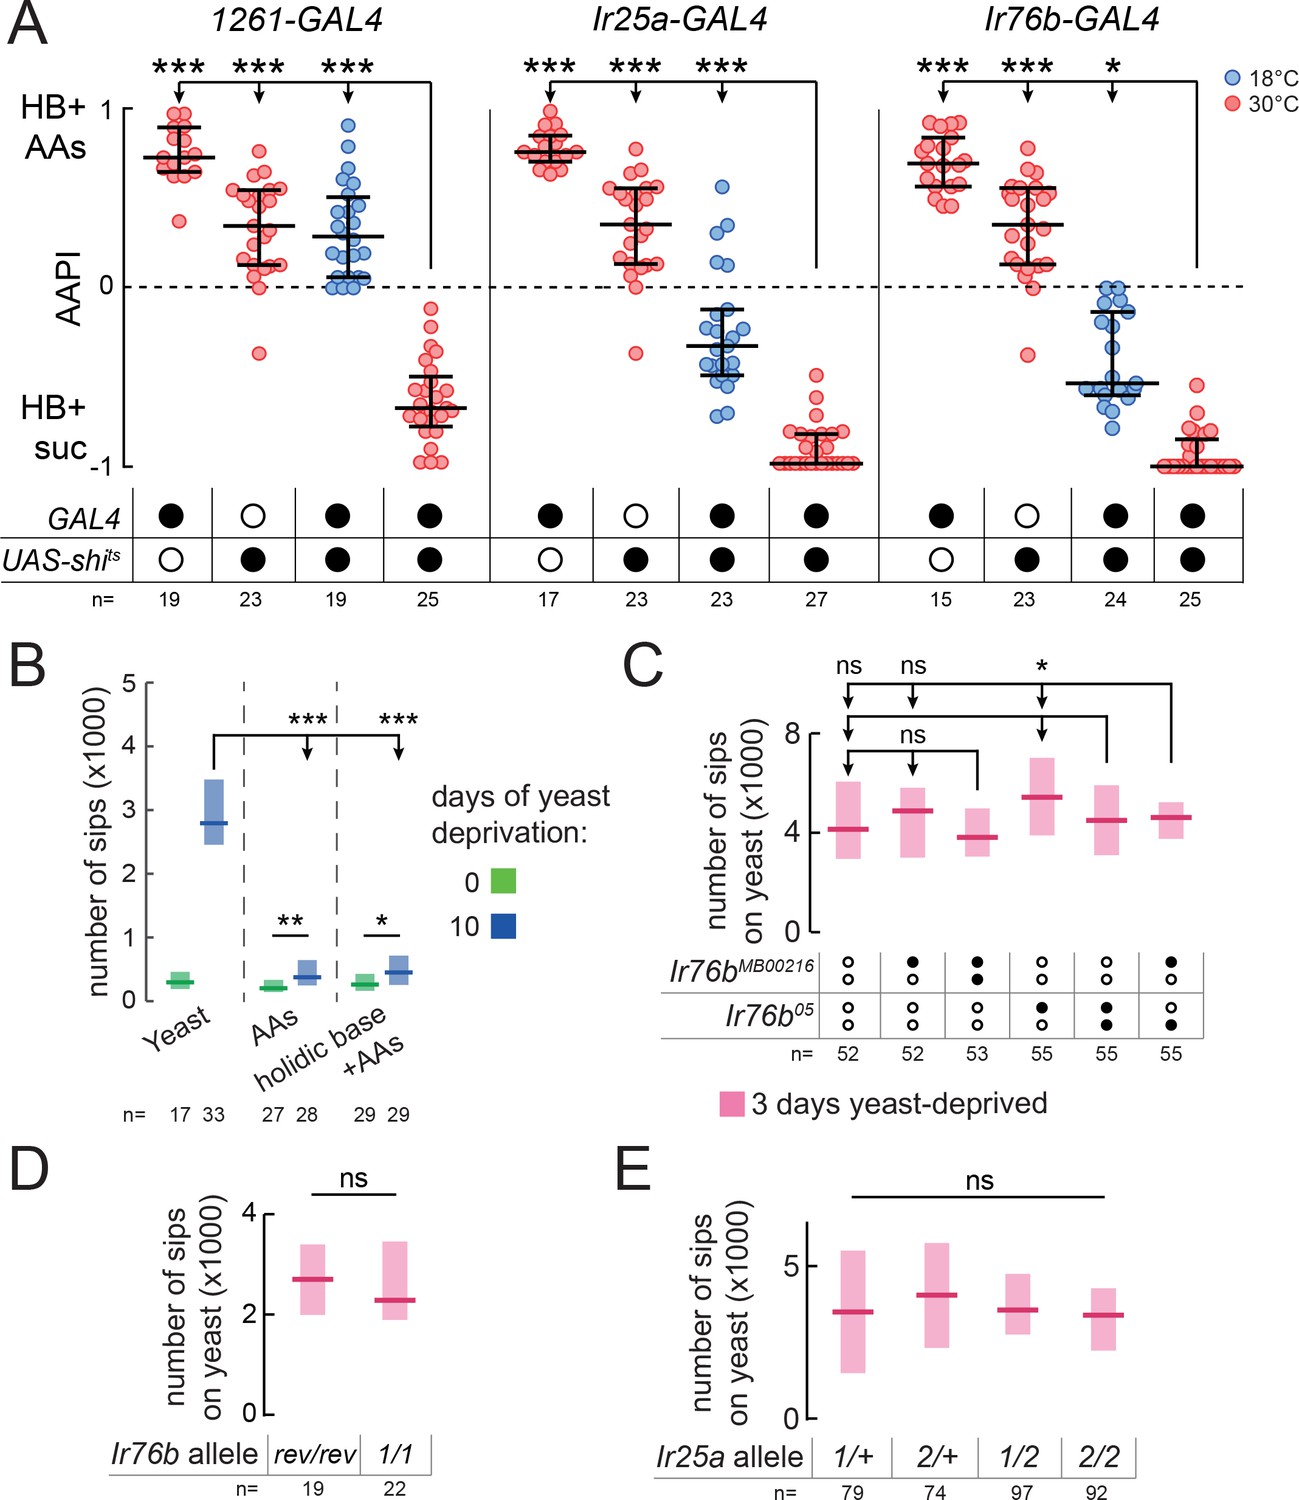
(A) Amino acid preference index (AAPI) of yeast-deprived females expressing shibirets under the control of 1261-, Ir25a- or Ir76b-GAL4 and corresponding controls, choosing between a holidic diet base (HB) with sucrose (suc) and the same base with a mix of all 20 amino acids (AAs) in a two-color food choice assay. (B) Number of sips from the indicated substrates by female flies of the genotype Ir76b-GAL4,UAS-GCaMP6s, either fully-fed or deprived from yeast for 10 days. (C–E) Number of sips from 10% yeast by Ir76b (C,D) or Ir25a (E) mutant and control yeast-deprived female flies. In (A), circles represent AA preference in single assays, with line representing the median and whiskers the interquartile range. In (B–E), boxes represent median with upper/lower quartiles. ***p<0.001, *p<0.05, ns p≥0.05. (A–C) and (E) Groups compared by Kruskal-Wallis test, followed by Dunn’s multiple comparison test. (D) Groups compared by Wilcoxon rank-sum test.
Figure 2 with 3 supplements
Proboscis gustatory receptor neurons are required for yeast intake.
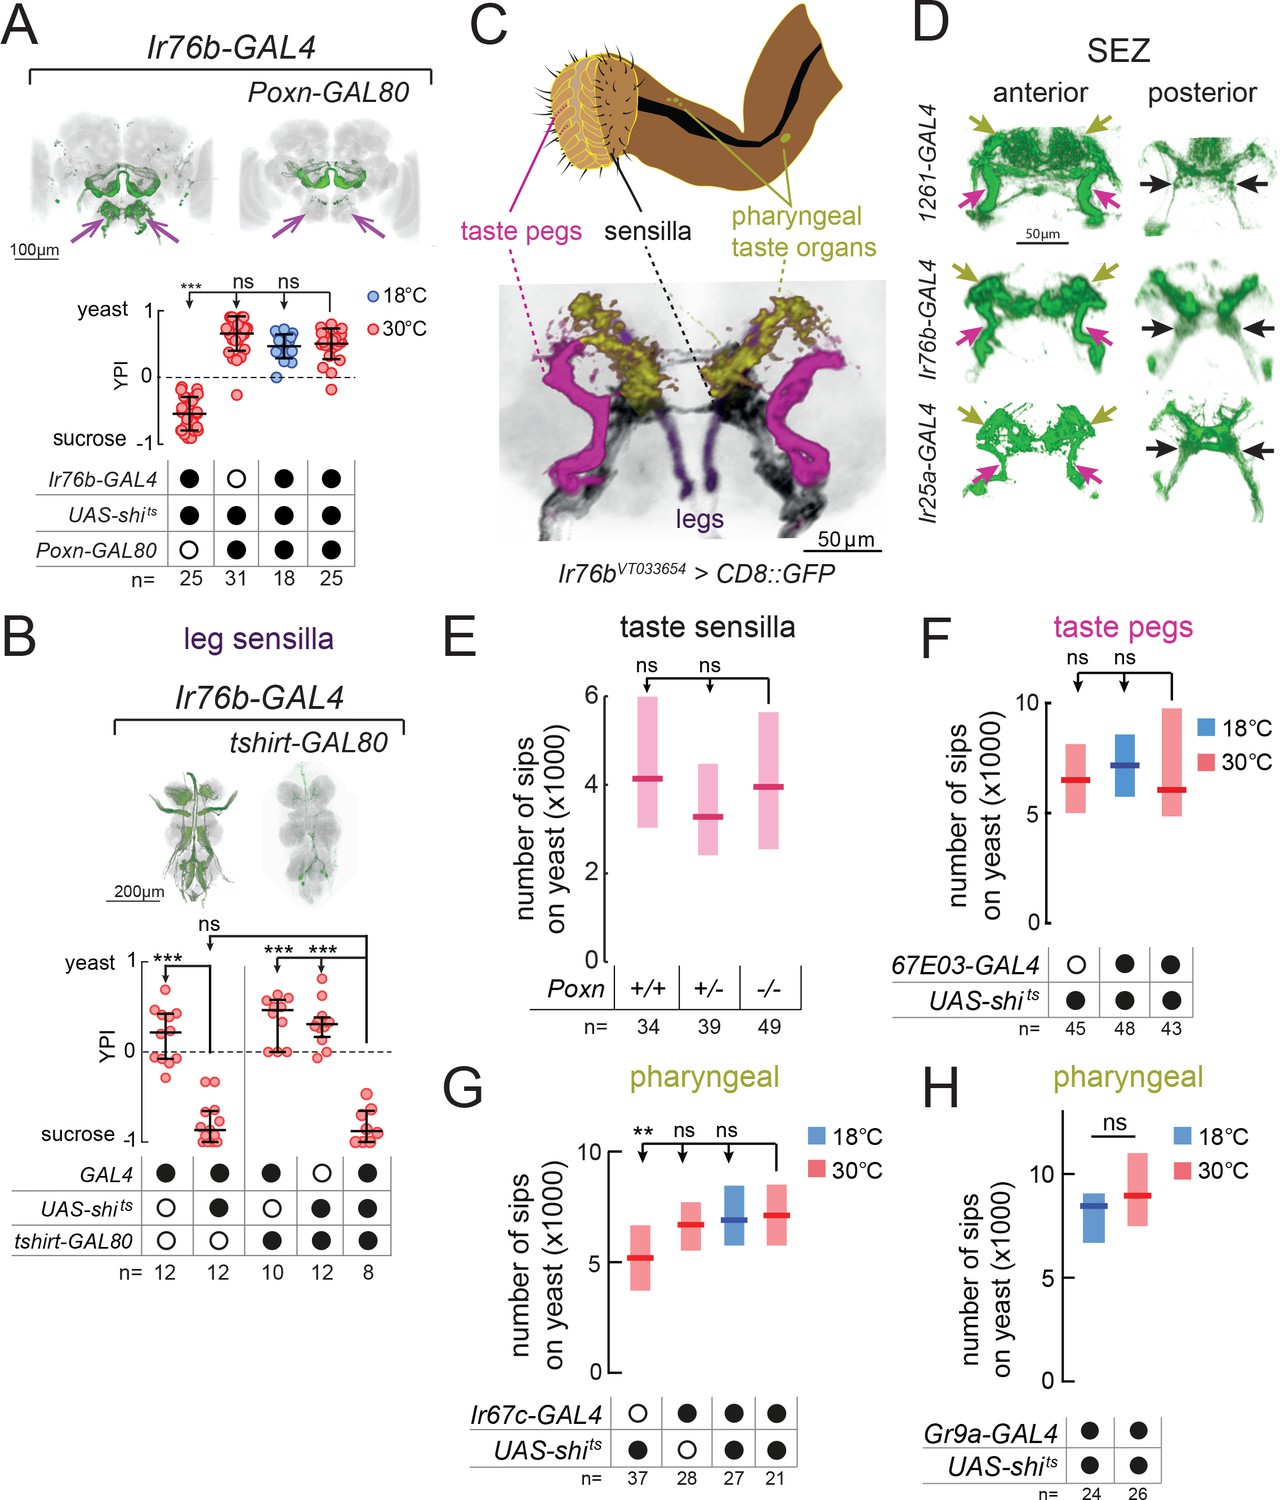
(A) YPI of yeast-deprived female flies in which Ir76b-GAL4 neurons were all silenced, or with Poxn-GAL80, and corresponding controls. Expression pattern of experimental flies in the brain as visualized using UAS-CD8::GFP in green, with nc82 synaptic staining in gray. Arrows indicate presence/loss of GFP expression in the SEZ. (B) YPI of yeast-deprived female flies in which Ir76b-GAL4 neurons were all silenced, or with tshirt-GAL80, and corresponding controls. Expression pattern of experimental flies in the VNC as visualized using UAS-CD8::GFP in green, with nc82 synaptic staining in gray. (C) Upper: Schematic of the proboscis, showing sensilla, taste pegs and pharyngeal taste organs. Lower: Schematic view of the SEZ of flies expressing CD8::GFP from a fragment of the Ir76b enhancer (VT033654-GAL4) with GRNs colored by their peripheral innervation and gray representing the nc82 synaptic staining. Pink, taste pegs; black, sensilla; yellow, pharyngeal taste organs; purple, legs. (D) Expression of 1261-, Ir76b- and Ir25a-GAL4 in the anterior (left) and posterior (right) SEZ, with arrows showing projections from pharyngeal (yellow), taste peg (pink) and sensillar (black) GRNs. (E) Number of sips from yeast by flies with 0/1/2 copies of the PoxnΔM22-B5 mutation. The homozygous mutant also contains a rescue construct to rescue all defects except taste sensilla (see Materials and methods). (F–H) Number of sips from 10% yeast by yeast-deprived females in which 67E03- (F), Ir67c- (G) or Gr9a-GAL4 (H) neurons were acutely silenced, and corresponding controls. 67E03-GAL4 labels taste peg GRNs, Ir67c-GAL4 labels a subset of GRNs in the LSO, and Gr9a-GAL4 labels a subset of GRNs in the VCSO. In (A) and (B), circles represent yeast preference in single assays, with line representing the median and whiskers the interquartile range. In (E–H), boxes represent median with upper/lower quartiles. ***p<0.001, **p<0.01, ns p≥0.05. Groups compared by Kruskal-Wallis test, followed by Dunn’s multiple comparison test.
Figure 2—figure supplement 1

Olfactory receptor neurons labeled by the identified lines do not explain the yeast feeding phenotype.
(A) and (B) YPI of yeast-deprived female flies in which 1261- (A) or Ir25a-GAL4 (B) neurons were all silenced, or with Poxn-GAL80, and corresponding controls. Expression pattern of experimental flies in the brain as visualized using UAS-CD8::GFP in green, with nc82 synaptic staining in gray. Arrows indicate presence/loss of GFP expression in the SEZ. (C) and (D) YPI of yeast-deprived female flies in which Orco-GAL4 (C) or Ir8a-GAL4 (D) neurons were acutely silenced and corresponding controls. (E) YPI of yeast-deprived female flies with or without atonal mutant antennae (generated using the ey-FLP method). (F) and (G) YPI of Ir8a (F) and Orco (G) mutant and control yeast-deprived female flies. Circles represent yeast preference in single assays, with line representing the median and whiskers the interquartile range. ***p<0.001, **p<0.01, *p<0.05, ns p≥0.05. (A-D) Groups compared by Kruskal-Wallis test, followed by Dunn’s multiple comparison test. (E-G) Groups compared by Wilcoxon rank-sum test.
Figure 2—figure supplement 2
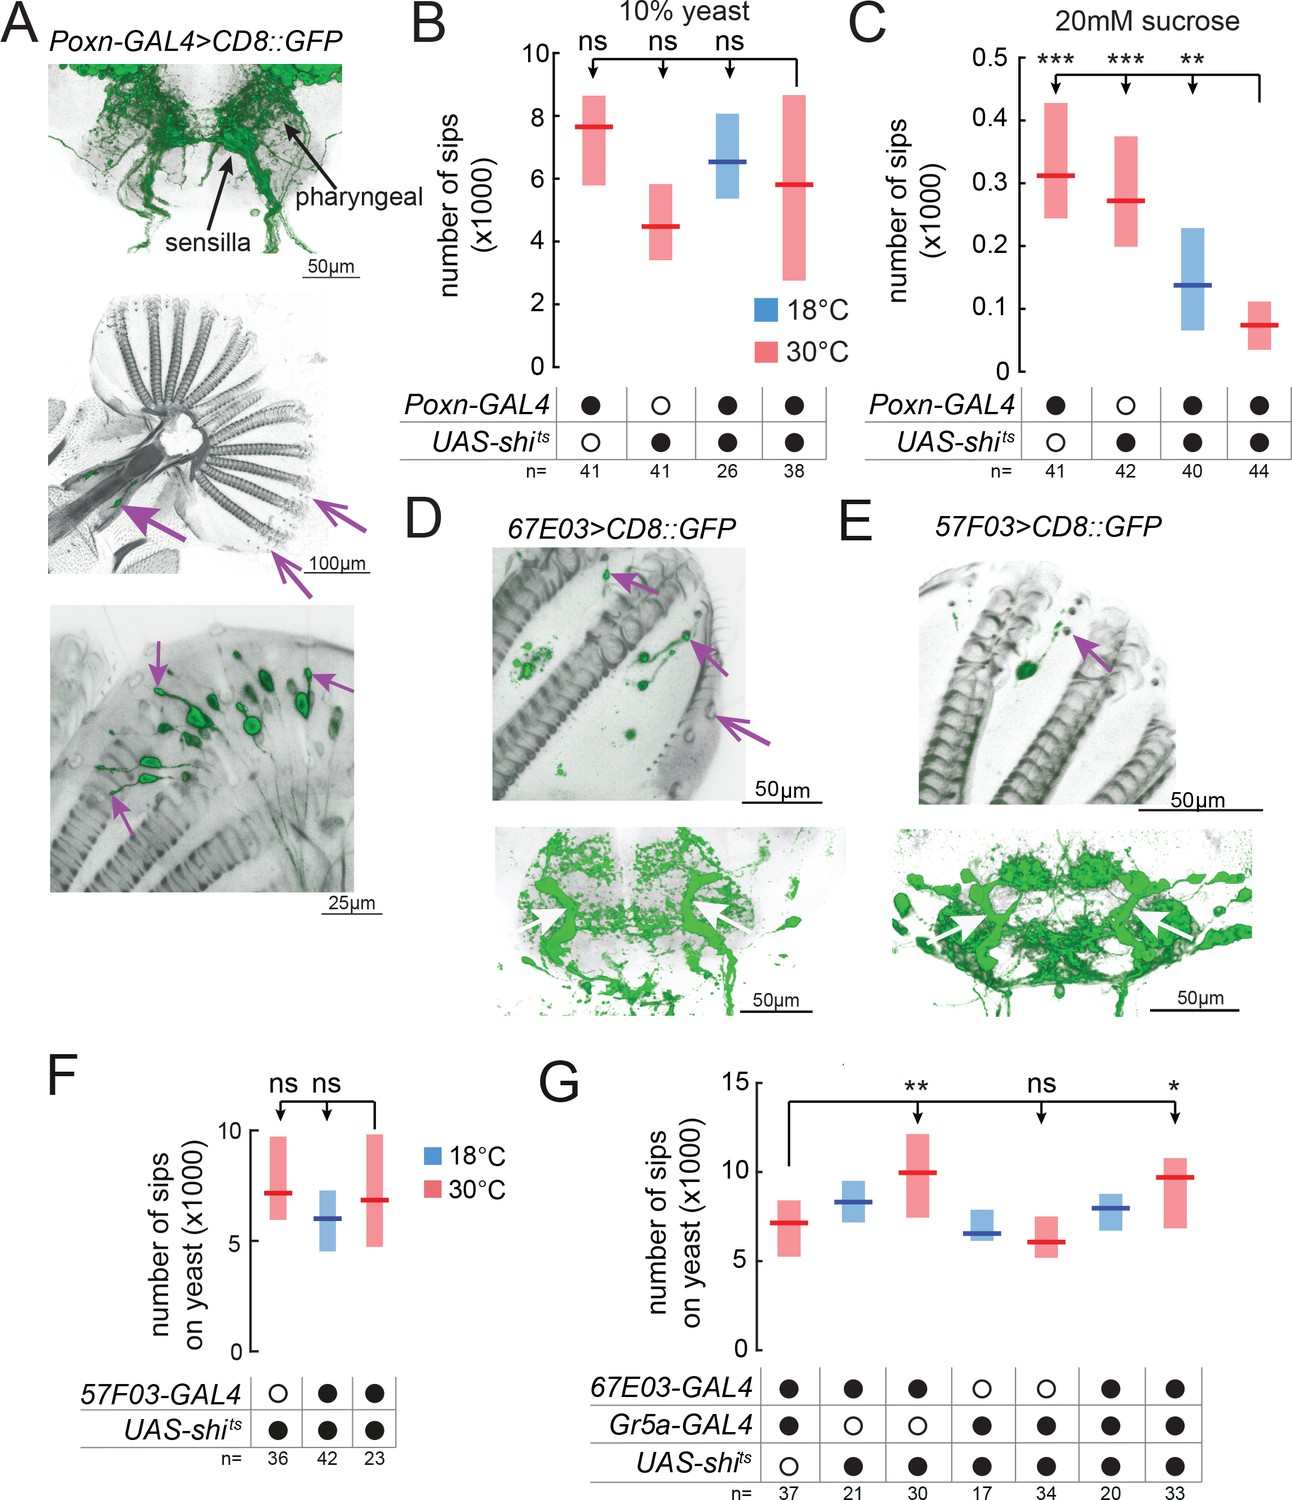
Silencing subsets of GRNs within the identified lines does not affect yeast feeding.
(A) Expression pattern of Poxn-GAL4 visualized using UAS-CD8::GFP. Upper: SEZ, green represents GFP signal and gray nc82 synaptic background staining. Middle: labellum, green represents GFP signal and gray cuticular autofluorescence; open arrows indicate taste pegs lacking GFP signal, closed arrows indicate GRNs innervating the LSO. Lower: closeup of lateral labellum, arrows indicate sensillar GRNs. (B) and (C) Number of sips from 10% yeast by yeast-deprived females (B) and from 20 mM sucrose by fully-fed females (C) expressing shibirets under the control of Poxn-GAL4 and controls. (D) and (E) Expression pattern of 67E03- (D) and 57F03-GAL4 (E) visualized using UAS-CD8::GFP, represented in green. Upper: labellum, gray represents cuticular autofluorescence; closed arrows indicate taste peg GRNs, open arrows indicate taste sensilla lacking GFP signal. Lower: SEZ, gray represents nc82 synaptic background staining; arrows indicate projections from taste peg GRNs. (F) Number of sips from 10% yeast by yeast-deprived females in which 57F03-GAL4 neurons were silenced and corresponding controls. (G) Number of sips from 10% yeast by yeast-deprived females in which 67E03- and/or Gr5a-GAL4 neurons were silenced and corresponding controls. Boxes represent median with upper/lower quartiles. ***p<0.001, **p<0.01, *p<0.05, ns p≥0.05. Groups compared by Kruskal-Wallis test, followed by Dunn’s multiple comparison test.
Figure 2—figure supplement 3
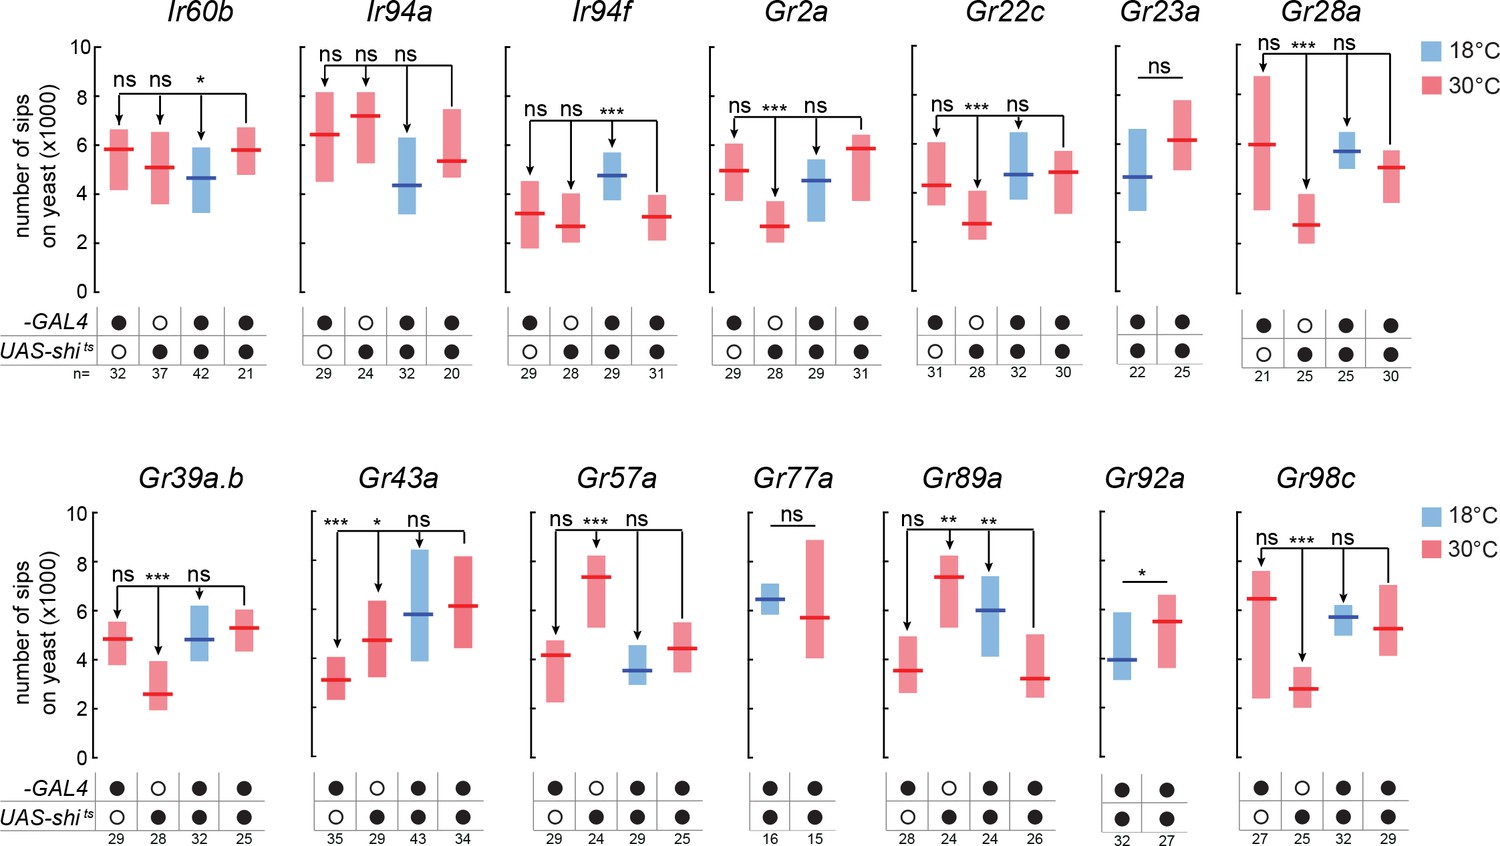
Silencing subsets of pharyngeal GRNs does not affect yeast feeding.
Number of sips from 10% yeast by yeast-deprived females expressing shibirets under the control of the indicated GAL4 lines expressed in pharyngeal GRNs at 18 and 30°C, and control genotypes. Boxes represent median with upper/lower quartiles. ***p<0.001, *p<0.05, ns p≥0.05. Upper: groups compared by Wilcoxon rank-sum test (2 conditions) or Kruskal-Wallis test followed by Dunn’s multiple comparison test (4 conditions).
Figure 3 with 1 supplement
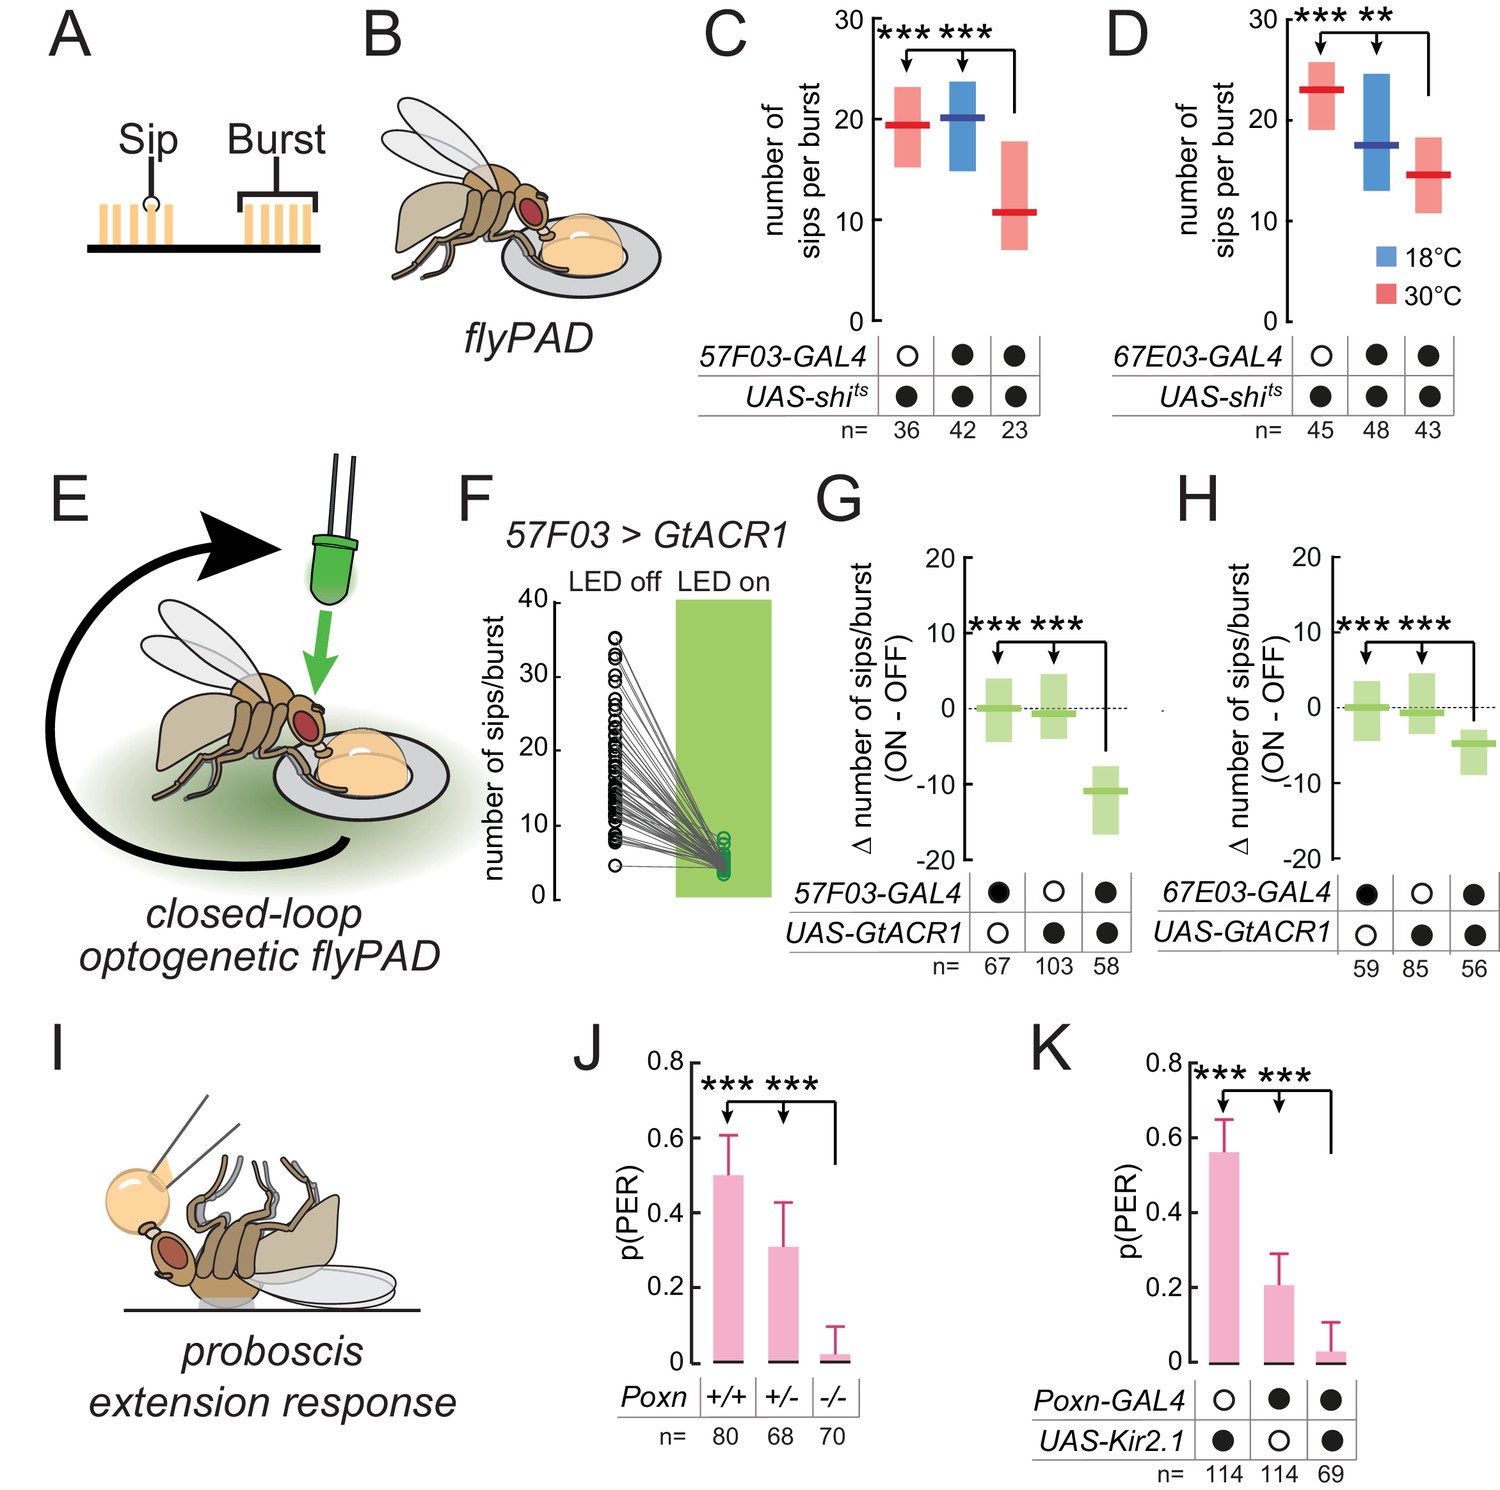
Taste peg and sensillar GRNs sustain and initiate yeast feeding, respectively.
(A) Schematic of the microstructure of feeding behavior. Sips are grouped into feeding bursts, which can be detected using the flyPAD. (B) Representation of the flyPAD assay. (C) and (D) Number of sips per burst from 10% yeast by yeast-deprived females expressing shibirets under the control of the indicated GAL4 lines, which label taste peg GRNs, and corresponding controls. (E) Schematic of closed-loop optogenetic silencing of GRNs. Interaction with one of the two food patches leads to activation of a green LED after a delay, resulting in silencing of neurons expressing GtACR1 after feeding initiation. (F) Number of sips per feeding burst from the unstimulated (LED off) and the light-stimulated (LED on) yeast patches by flies expressing GtACR1 under the control of 57F03-GAL4. (G) and (H) Difference in number of sips per feeding burst on the stimulated (ON) and unstimulated (OFF) yeast patches for flies expressing GtACR1 under the control of the indicated GAL4 lines, which label taste peg GRNs, and corresponding genetic controls. (I) Representation of the proboscis extension response (PER) assay. (J) Probability of PER in response to 10% yeast presented to the labellum, by flies lacking taste sensilla due to Poxn loss-of-function, and genetic controls. For full genotypes, see Materials and methods. (K) Probability of PER in response to 10% yeast presented to the labellum, by flies expressing Kir2.1 under the control of Poxn-GAL4 and genetic controls. ***p<0.001, **p<0.01, ns p≥0.05. In (C), (D), (G) and (H), boxes represent median with upper/lower quartiles; groups compared by Kruskal-Wallis test, followed by Dunn’s multiple comparison test. In (F), circles represent individual flies, and lines link data points from the two food patches for each single fly. In (J) and (K), bars represent fraction of flies producing PER with 95% confidence interval; groups compared by Fisher’s exact test.
Figure 3—figure supplement 1
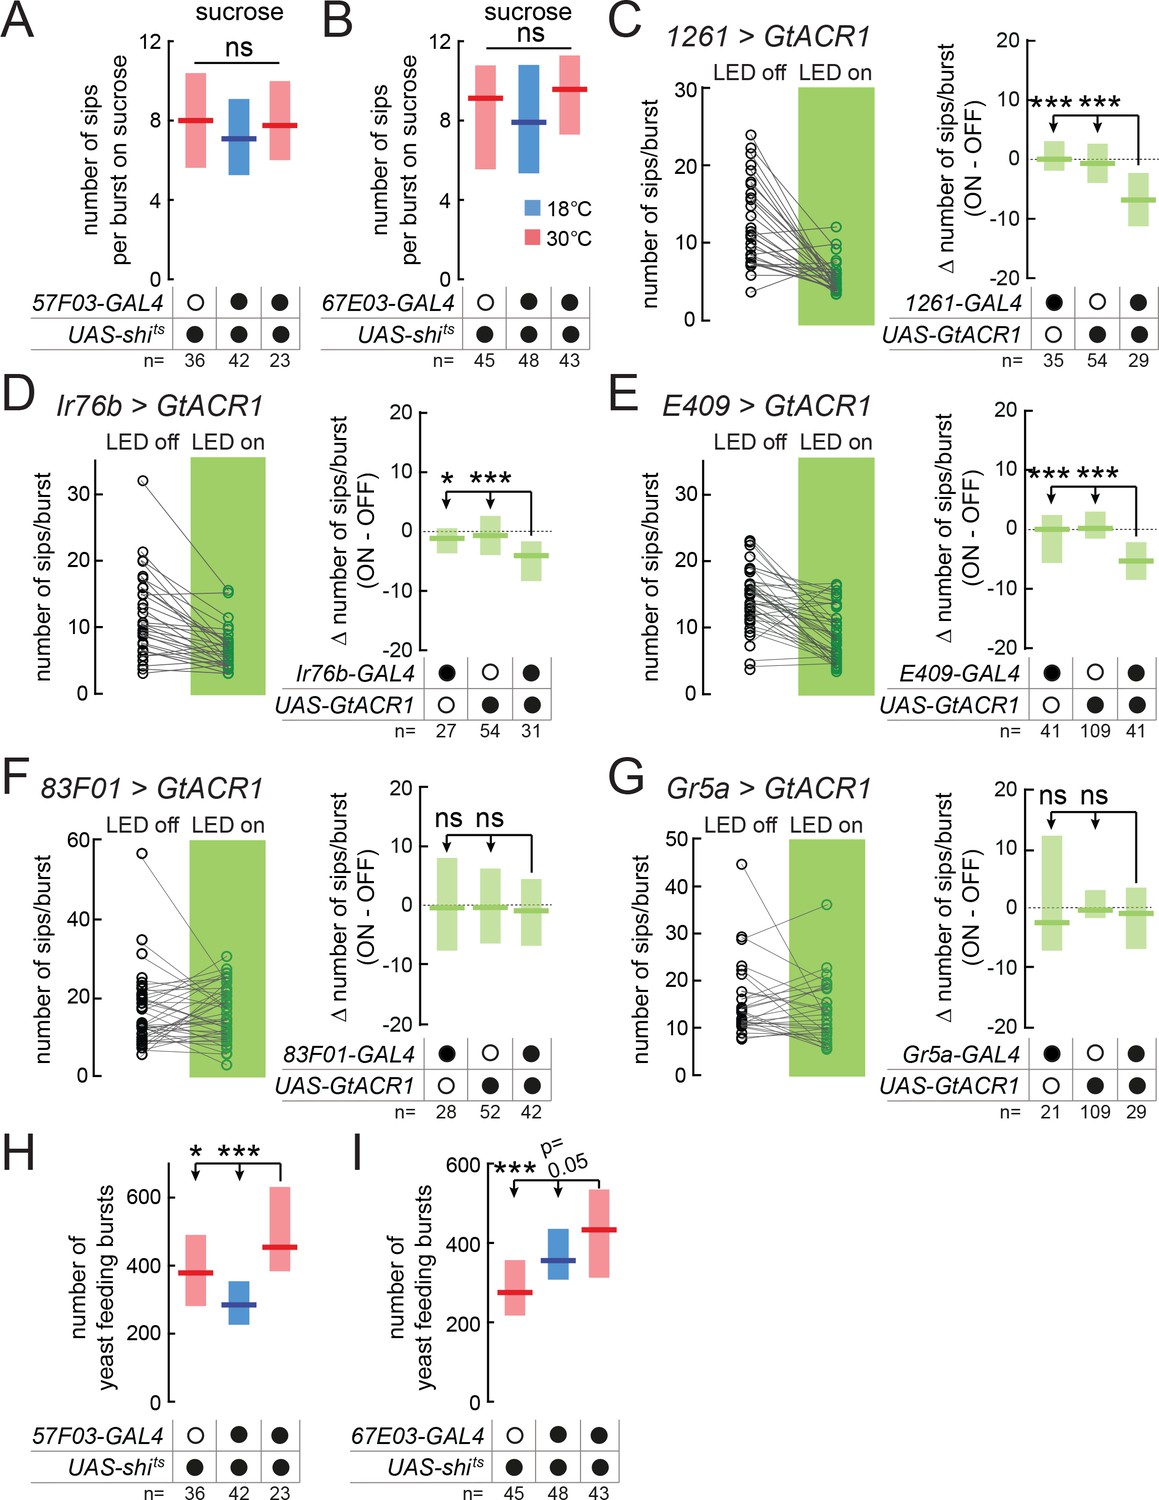
Taste peg GRNs specifically sustain yeast feeding bursts, and flies compensate for the loss of peg GRNs.
(A) and (B) Number of sips per burst from 20 mM sucrose by yeast-deprived females expressing shibirets under the control of the indicated GAL4 lines, which label taste peg GRNs, and corresponding controls. (C–G) Left: number of sips per feeding burst on the unstimulated (LED off) and stimulated (LED on) yeast patches for flies expressing GtACR1 under the control of the indicated GAL4 lines. Right: difference in number of sips per feeding burst on the stimulated (ON) and unstimulated (OFF) yeast patches for flies expressing GtACR1 under the control of the indicated GAL4 lines and corresponding genetic controls. (H) and (I) Number of feeding bursts from 10% yeast by yeast-deprived females expressing shibirets under the control of the indicated GAL4 lines, which label taste peg GRNs, and corresponding controls. ***p<0.001, *p<0.05, ns p≥0.05. In (A), (B), (H), (I), and right panels of (C–G), boxes represent median with upper/lower quartiles; groups compared by Kruskal-Wallis test, followed by Dunn’s multiple comparison test. In left panels of (C–G), circles represent individual flies, and lines link data points from the two food patches for each single fly.
Figure 4 with 1 supplement
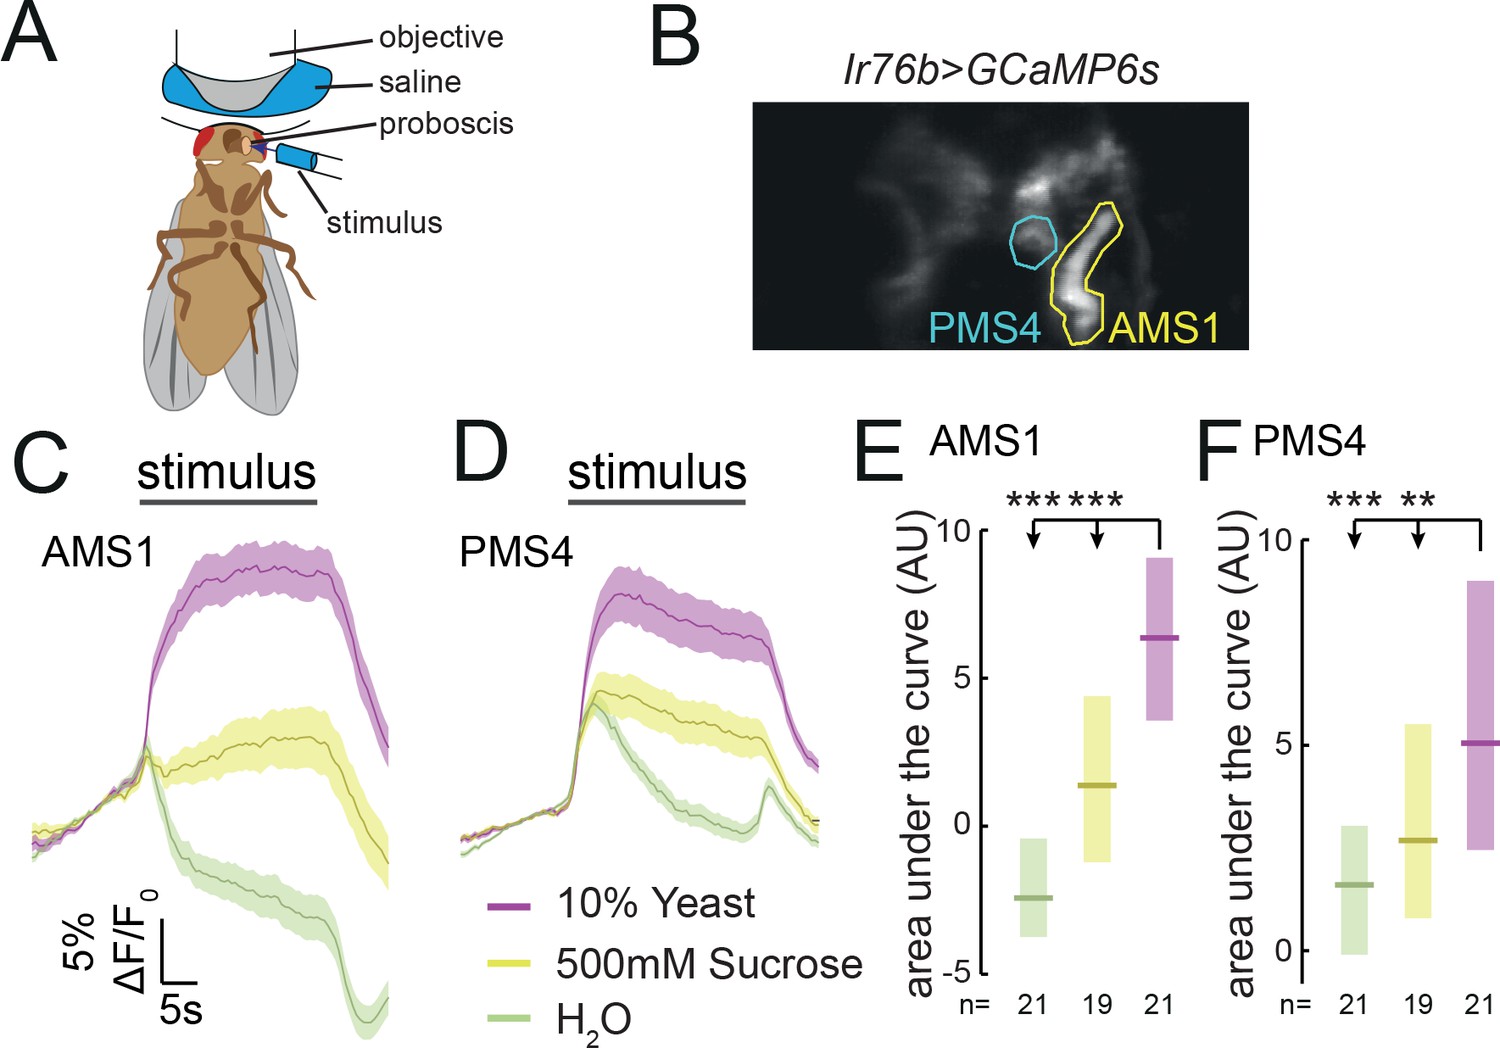
Ir76b GRNs respond to yeast taste.
(A) Schematic of the imaging setup. The fly is head-fixed, with a window in the head to allow visual access to GRN axons in the SEZ using a two-photon microscope. The fly is stimulated on the labellum with liquid tastant solutions. (B) Representative z-projection of baseline GCaMP6s fluorescence from Ir76b-GAL4 axons in the SEZ. Highlighted ROIs indicate the AMS1 and PMS4 regions, which are largely innervated by taste peg and sensillar GRNs, respectively. (C–F) Average responses measured in ROIs shown in (B) to 10% yeast (purple), 500 mM sucrose (yellow) or water (green) from females deprived of yeast for 10 days. Average (mean ± SEM) trace of ΔF/F0 from GCaMP6s signal in AMS1 (C) and PMS4 (D) upon taste stimulation. Black line indicates stimulus period. Responses quantified as area under the curve in AMS1 (E) and PMS4 (F) during stimulus presentation. Boxes represent median with upper/lower quartiles. **p<0.01, ***p<0.001. Groups compared by Kruskal-Wallis test, followed by Dunn’s multiple comparison test.
Figure 4—figure supplement 1
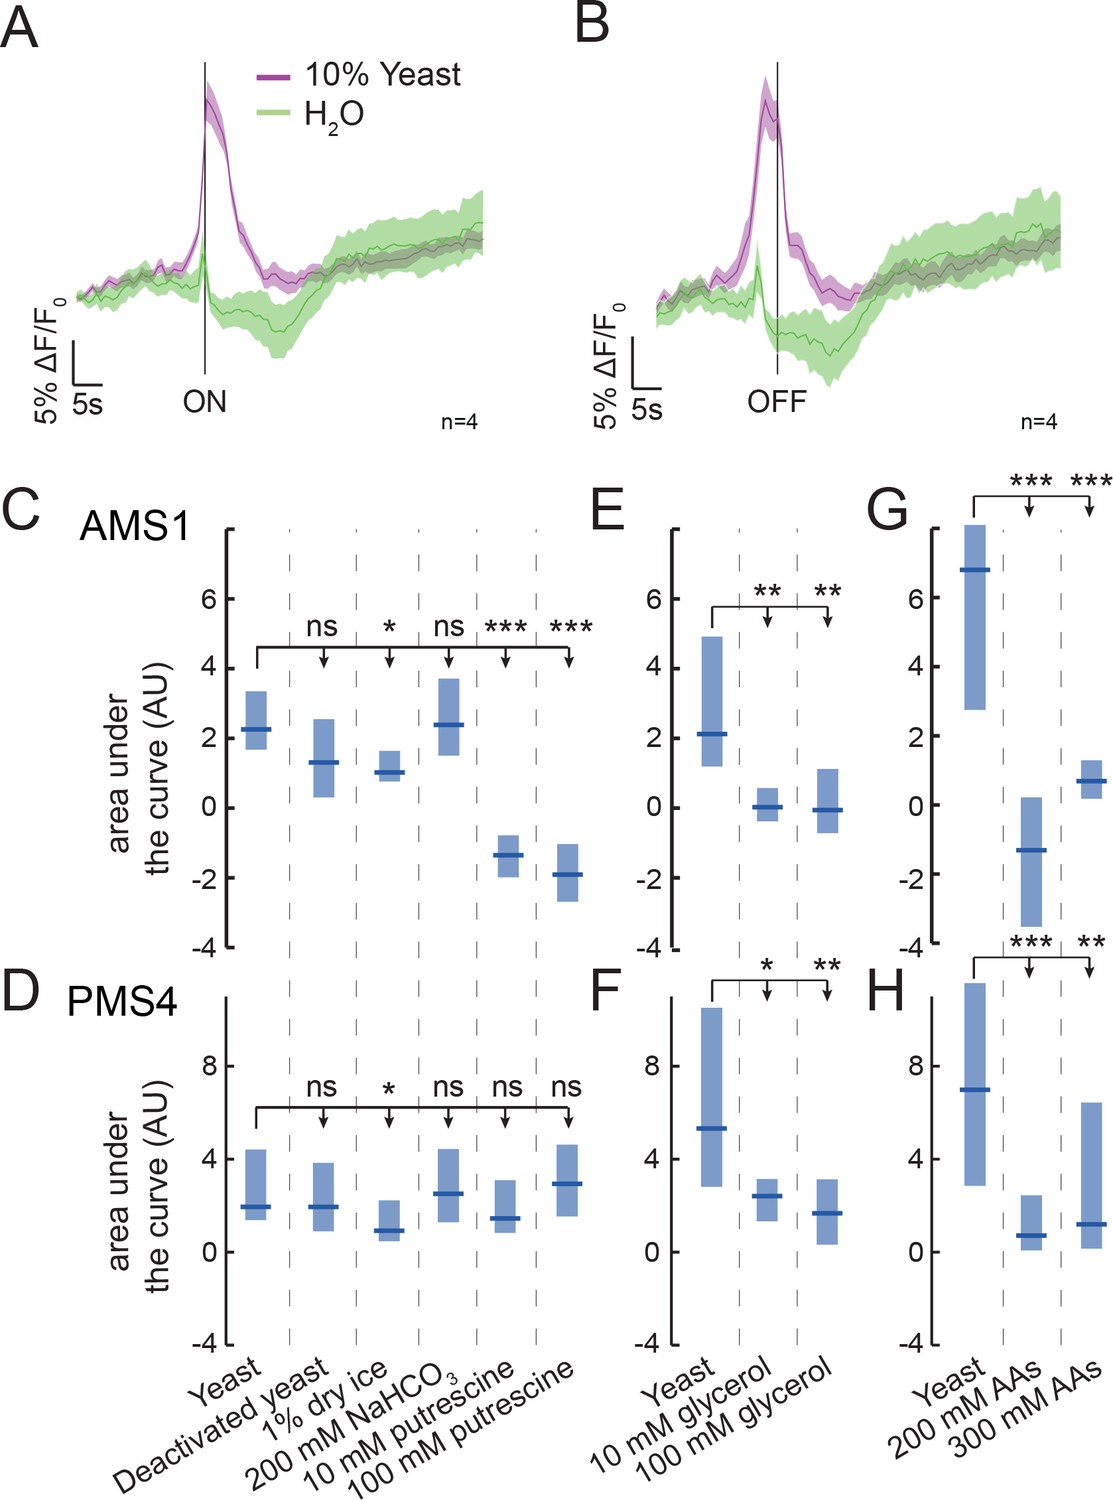
Ir76b GRNs respond to yeast metabolites.
(A) and (B) Average (mean ± SEM) trace of ΔF/F0 from GCaMP6s in Ir76b-GAL4 AMS1 region (Figure 3B) in response to 10% yeast and H2O presented for 2–4 s, aligned to stimulus onset (A) or offset (B). (C–H) Calcium responses to the indicated substrates from Ir76b-GAL4 in the AMS1 (C,E,G) and PMS4 (D,F,H) regions, quantified as area under the curve during stimulus presentation, from females deprived of yeast for 10 days. In (C) and (D), NaHCO3 was mixed with 500 mM NaH2PO4 to produce carbonation. In (F), responses to glycerol in PMS4 are significantly greater than zero (10 mM:**; 100 mM:*, Wilcoxon signed rank test). Boxes represent median with upper/lower quartiles. ***p<0.001, **p<0.01, *p<0.05, ns p≥0.05. Groups compared by Kruskal-Wallis test, followed by Dunn’s multiple comparison test.
Figure 5 with 1 supplement
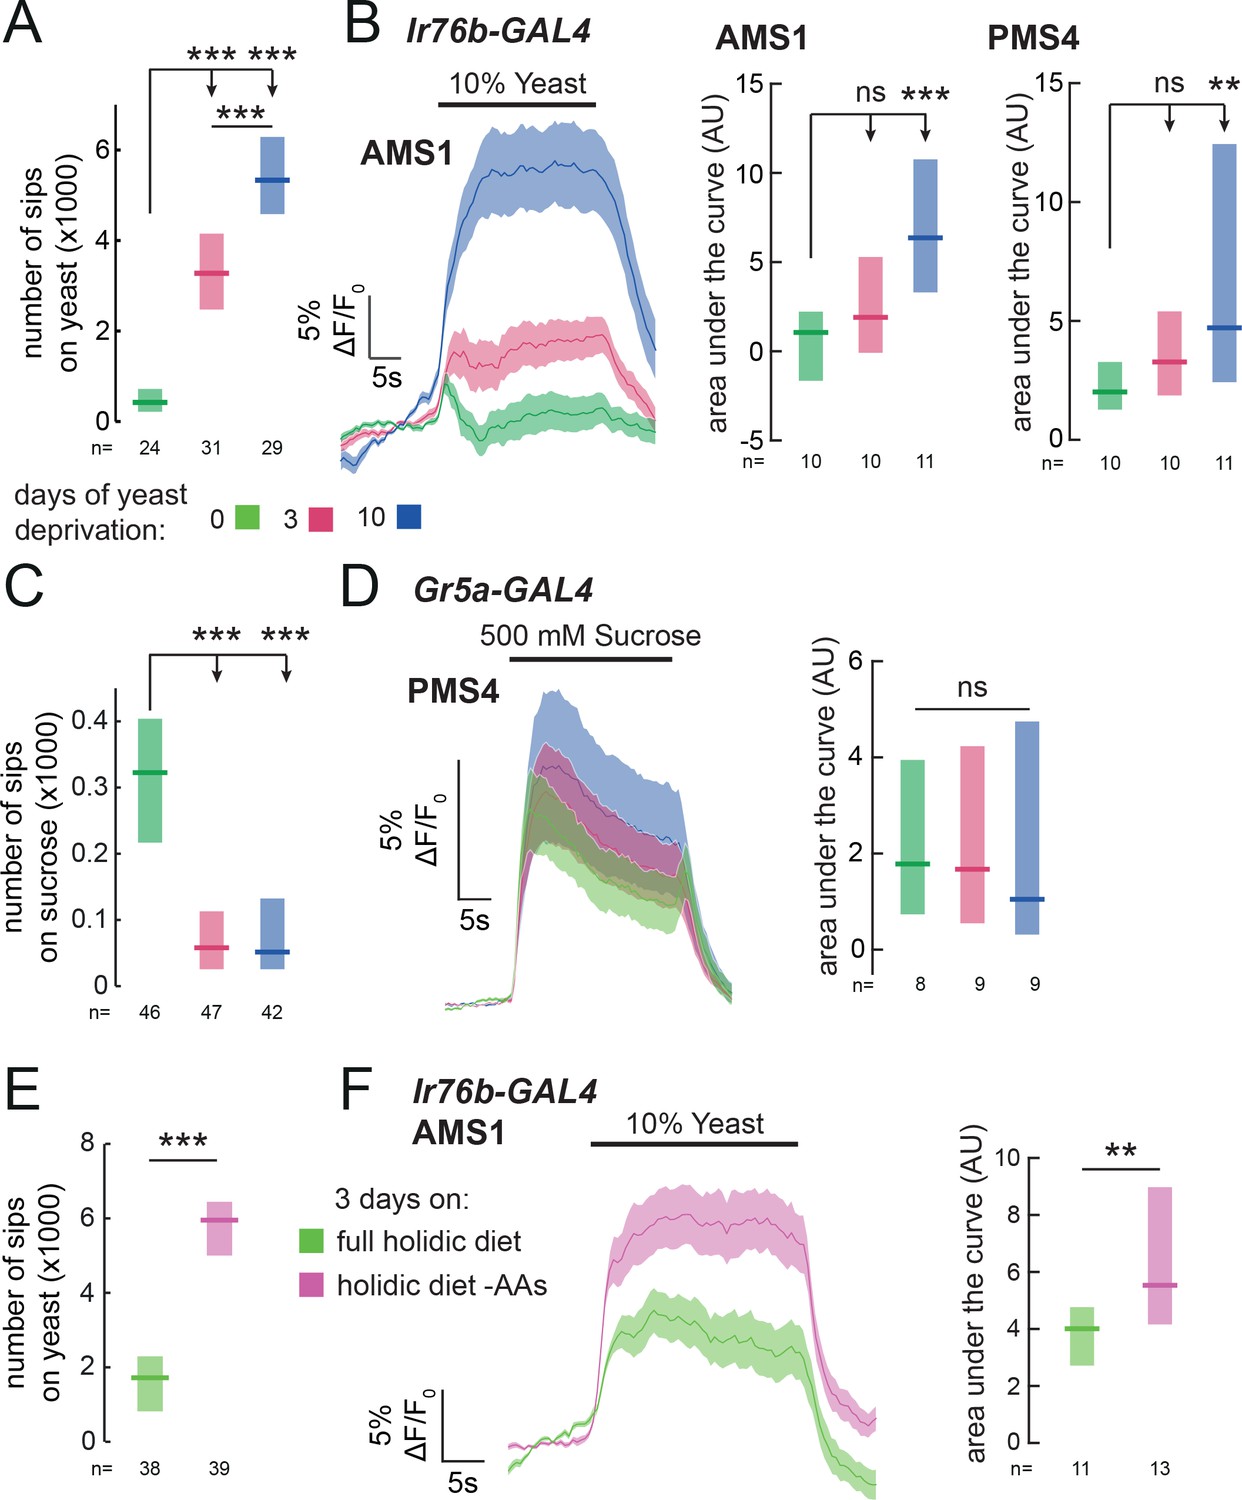
Yeast or amino acid deprivation modulates yeast feeding and enhances the response of yeast GRNs.
(A) and (C) Number of sips from 10% yeast (A) and 20 mM sucrose (C) by female flies of the genotype Ir76b-GAL4,UAS-GCaMP6s. Flies were deprived from yeast for 0, 3 or 10 days. (B) Left: Average (mean ± SEM) trace of ΔF/F0 from GCaMP6s signal in Ir76b-GAL4 AMS1 region upon stimulation of the labellum with 10% yeast, from flies deprived of yeast for 0, 3 or 10 days. Quantification of responses of AMS1 (center) and PMS4 (right) regions as area under the curve during stimulus presentation. (D) Left: Average (mean ± SEM) trace of ΔF/F0 measured from GCaMP6s in Gr5a-GAL4 taste sensillar projections upon stimulation of the labellum with 500 mM sucrose, from flies deprived of yeast for 0, 3 or 10 days. Right: Quantification of responses as area under the curve during stimulus presentation. (E) Number of sips from 10% yeast by females fed on a holidic diet with or without amino acids for 3 days prior to assay. (F) Left: Average (mean ± SEM) trace of ΔF/F0 from GCaMP6s signal in Ir76b-GAL4 AMS1 region upon stimulation of the labellum with 10% yeast, from flies treated as in (E). Right: Quantification of responses as area under the curve during stimulus presentation. (A), (C) and (E) Feeding behavior of mated female flies expressing GCaMP6s under the control of Ir76b-GAL4 was measured on the flyPAD. Boxes represent median with upper/lower quartiles. ***p<0.001, **p<0.01, *p<0.05, ns p≥0.05. (A-D) Groups compared by Kruskal-Wallis test, followed by Dunn’s multiple comparison test. (E-F) Groups compared by Wilcoxon rank-sum test.
Figure 5—figure supplement 1
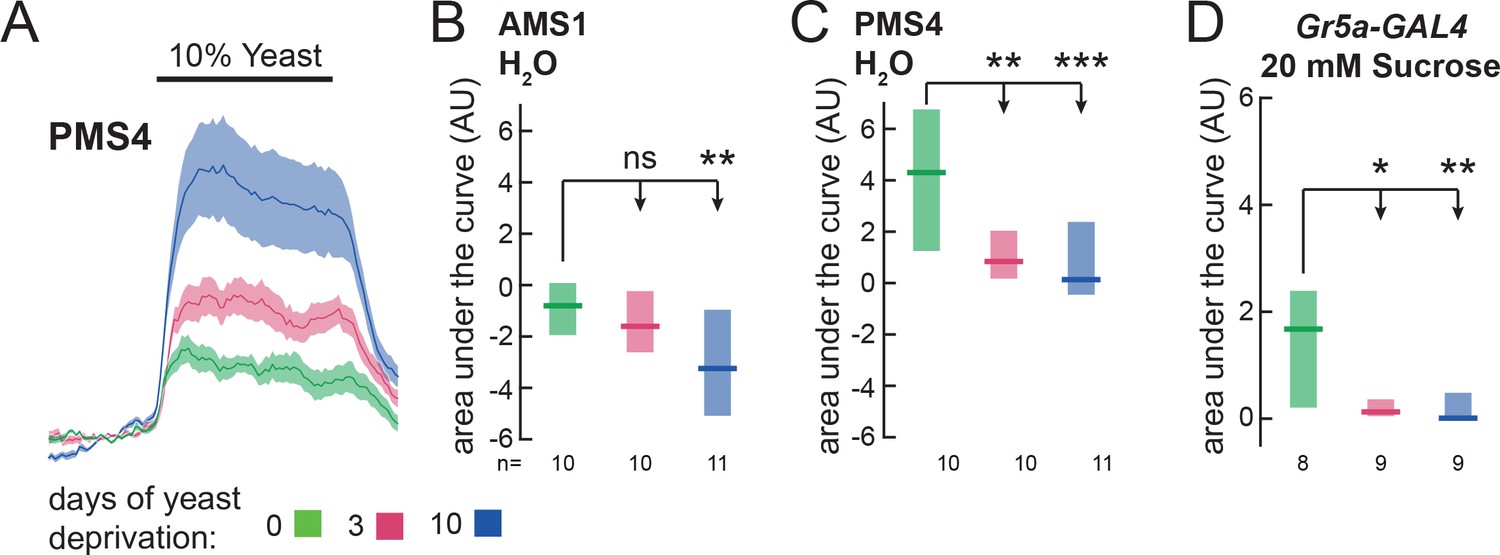
Effects of yeast deprivation on taste responses.
(A) Average (mean ± SEM) trace of ΔF/F0 from GCaMP6s signal in Ir76b-GAL4 AMS1 region upon stimulation of the labellum with 10% yeast (as quantified in Figure 5B). (B) and (C) Quantification of calcium responses of AMS1 (B) and PMS4 (C) regions of Ir76b-GAL4 to presentation of water. (D) Quantification of calcium responses of Gr5a-GAL4 sensillar projections to presentation of 20 mM sucrose. In all experiments, responses from females deprived of yeast for 0, 3 or 10 days were compared. Boxes represent median with upper/lower quartiles. ***p<0.001, **p<0.01, *p<0.05, ns p≥0.05. Groups compared by Kruskal-Wallis test, followed by Dunn’s multiple comparison test.
Figure 6 with 1 supplement
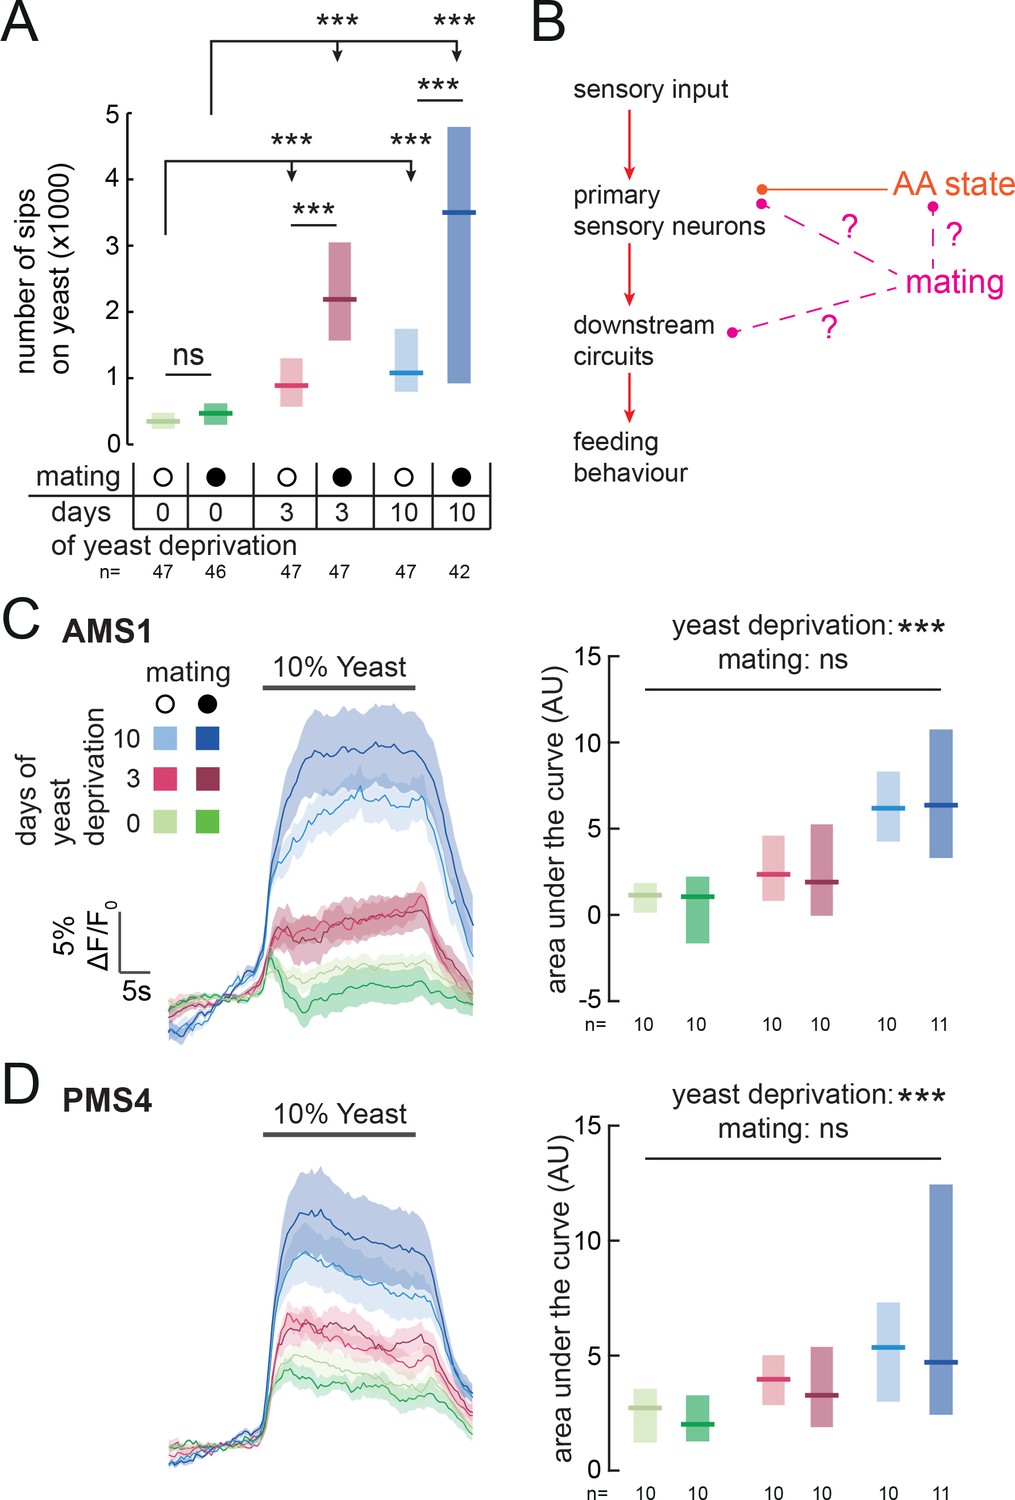
Mating state affects yeast feeding behavior but does not modulate GRN responses to yeast.
(A) Number of sips from 10% yeast by female flies of the genotype Ir76b-GAL4,UAS-GCaMP6s. Flies were virgin or mated, and yeast-deprived for 0, 3 or 10 days. (B) Schematic of how mating could act to modulate yeast feeding behavior. Mating could regulate the sensitivity of the nervous system to AA deprivation; it could act on yeast GRNs independently from protein state; or it could act on downstream yeast taste processing circuits. (C) and (D) Calcium responses of AMS1 (C) and PMS4 (D) regions of Ir76b-GAL4 upon stimulation of the labellum with 10% yeast, from virgin and mated females deprived of yeast for 0, 3 or 10 days. Left: Average (mean ± SEM) trace of ΔF/F0. Right: Quantification of responses as area under the curve during stimulus presentation. Boxes represent median with upper/lower quartiles. Significance was tested using two-way ANOVA, with deprivation and mating states as the independent variables. In (A), this was followed by multiple comparisons with Bonferroni correction. ***p<0.001, ns p≥0.05.
Figure 6—figure supplement 1
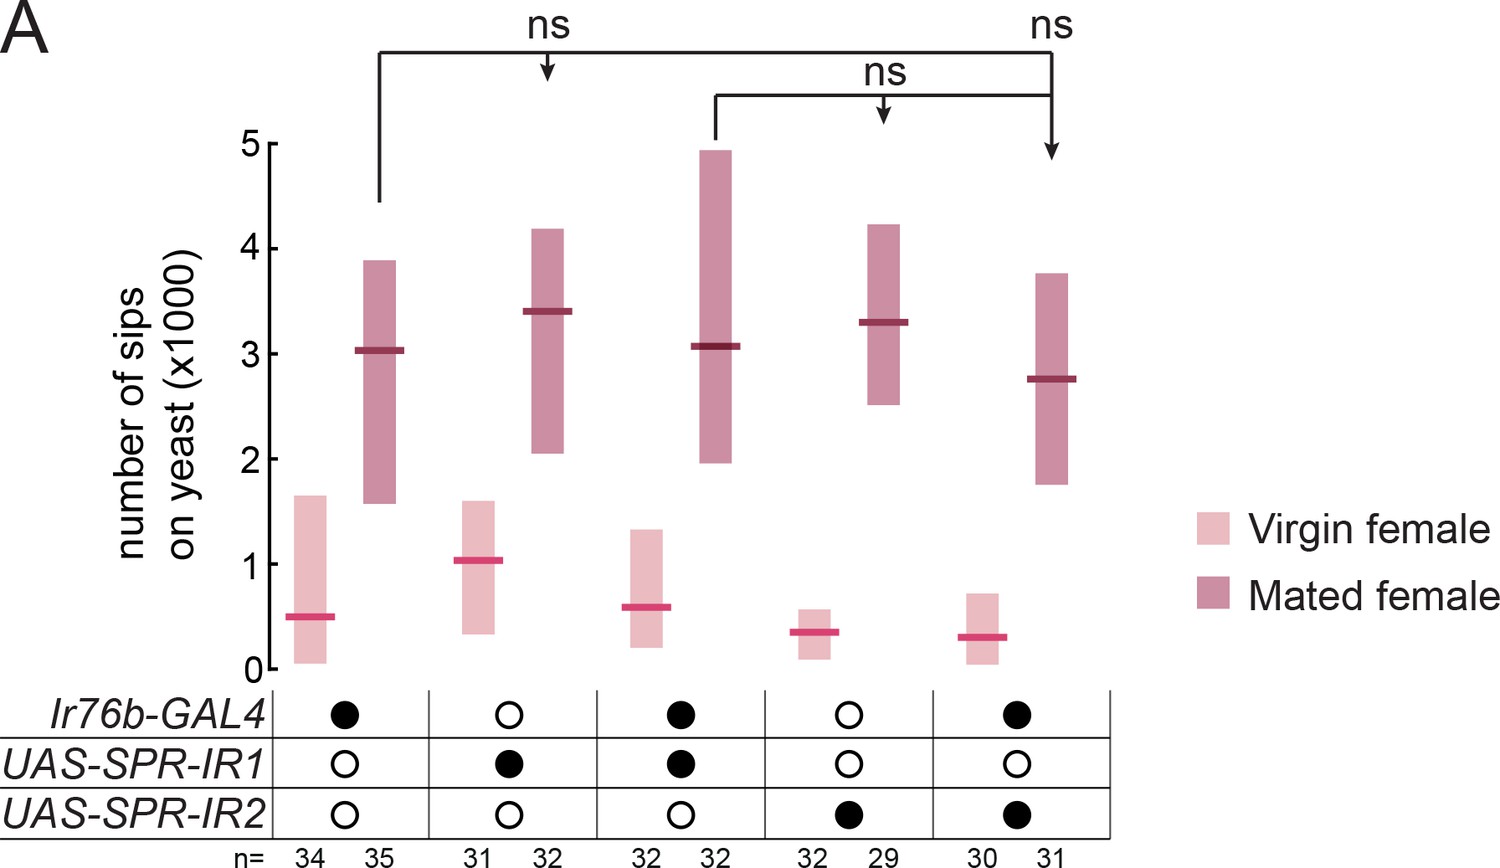
Knockdown of Sex peptide receptor in Ir76b neurons does not affect yeast appetite.
(A) Number of sips from 10% yeast as measured using the flyPAD by yeast-deprived virgin and mated females expressing RNAi against the Sex Peptide Receptor under the control of Ir76b-GAL4 and by controls. All flies carried a first chromosomal UAS-Dcr2 transgene. Boxes represent median with upper/lower quartiles. ns p≥0.05. Groups compared by Kruskal-Wallis test, followed by Dunn’s multiple comparison test.
Figure 7
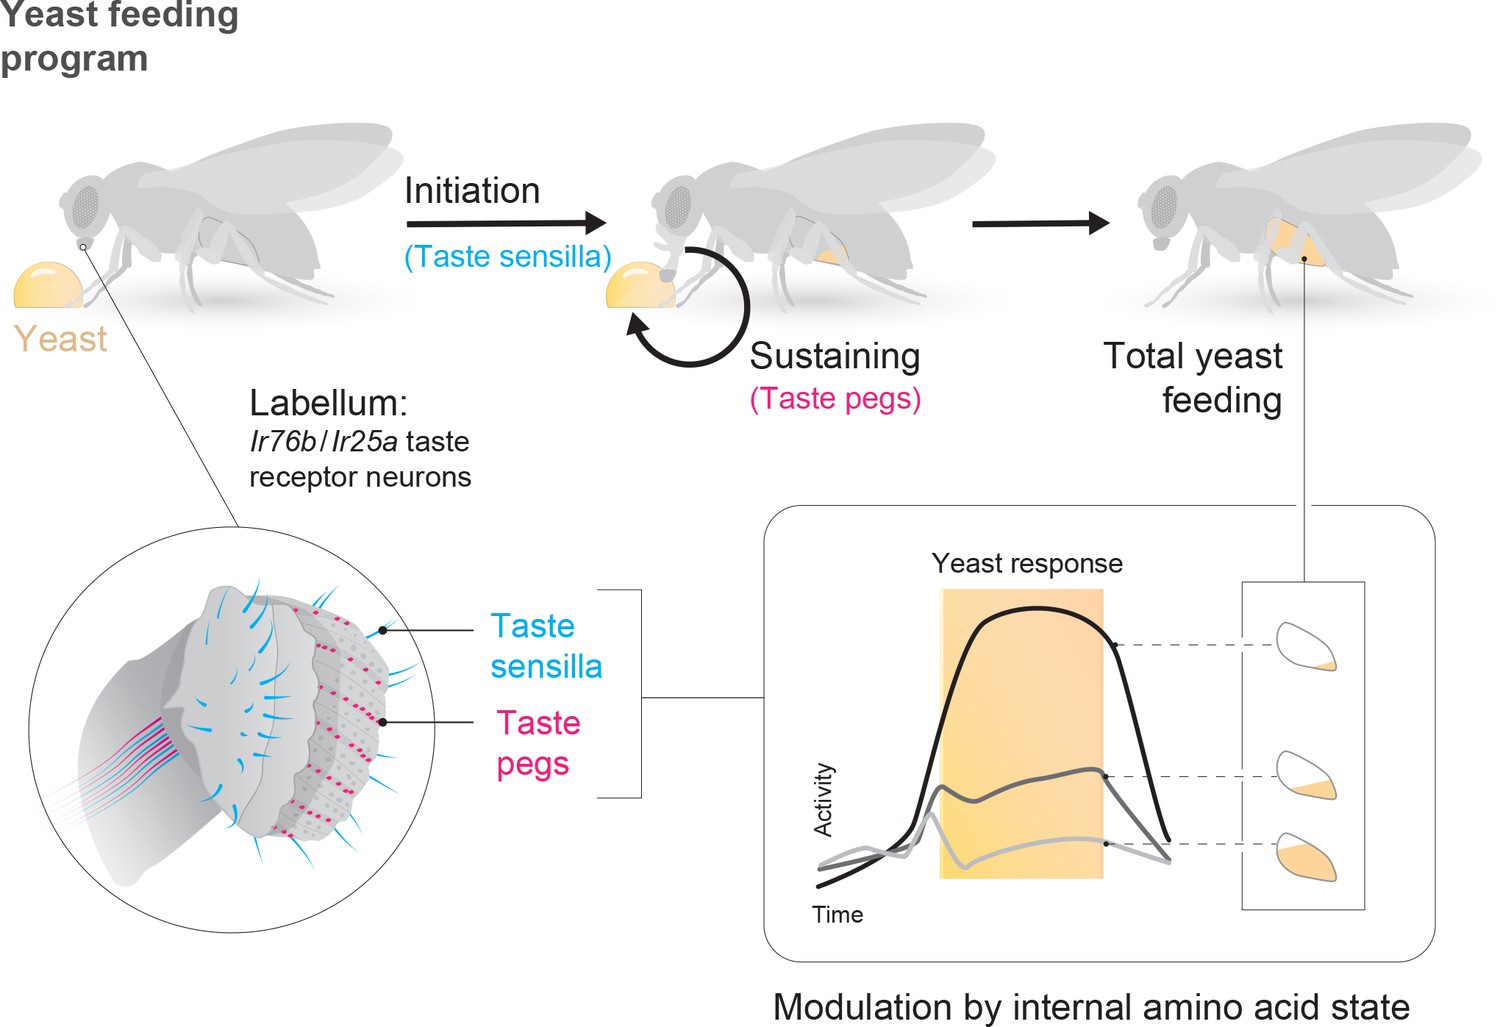
State-dependent modulation of yeast taste neurons regulates specific yeast feeding behavior programs to support protein homeostasis.
Schematic depicting the regulation of yeast feeding by specific taste receptor neurons. GRNs in the proboscis that express Ir76b and Ir25a mediate yeast feeding. GRNs innervating taste sensilla on the labellum regulate proboscis extension in response to yeast, and subsequent extension and retraction cycles are regulated by taste peg GRNs. The response of each of these GRN subsets is modulated according to the fly’s internal amino acid state: after 3 or 10 days of deprivation from yeast, the response of these neurons is increased. This modulation provides a potential neuronal basis to increase both the number and duration of yeast feeding bursts when the fly is lacking amino acids, and thereby to maintain protein homeostasis.
Videos
Video 1
Ir76b taste peg GRNs respond to yeast taste.
Representative time series of yeast response. Upper: time series of average z-projections of GCaMP6s fluorescence from Ir76b-GAL4 axons in the SEZ. Highlighted ROI indicates the AMS1 region in one hemisphere, which is innervated by taste peg GRNs. Lower: trace of average ΔF/F0 value within the highlighted ROI. Yeast is presented to the labellum and removed at the specified time points, indicated by blue and orange lines, respectively. Movie is at 10x real time.
Additional files
-
Supplementary file 1
Supplementary Tables 1-3.
- https://doi.org/10.7554/eLife.31625.021
-
Transparent reporting form
- https://doi.org/10.7554/eLife.31625.022
Download links
A two-part list of links to download the article, or parts of the article, in various formats.
Downloads (link to download the article as PDF)
Open citations (links to open the citations from this article in various online reference manager services)
Cite this article (links to download the citations from this article in formats compatible with various reference manager tools)
Internal amino acid state modulates yeast taste neurons to support protein homeostasis in Drosophila
eLife 7:e31625.
https://doi.org/10.7554/eLife.31625


