The genome of the Hi5 germ cell line from Trichoplusia ni, an agricultural pest and novel model for small RNA biology
- Boston University, United States
- University of Massachusetts Medical School, United States
Figures
Figure 1 with 3 supplements

Chromosomes and genes in the T. ni genome based on data from the Hi5 cell line.
(A) Genome assembly and annotation workflow. (B) An example of a DAPI-stained spread of Hi5 cell mitotic chromosomes used to determine the karyotype. (C) Phylogenetic tree and orthology assignment of T. ni with 18 arthropod and two mammalian genomes. Colors denote gene categories. The category 1:1:1 represents universal single-copy orthologs, allowing absence and/or duplication in one genome. N:N:N orthologs include orthologs with variable copy numbers across species, allowing absence in one genome or two genomes from different orders. Lepidoptera-specific genes are present in at least three of the four lepidopteran genomes; Hymenoptera-specific genes are present in at least one wasp or bee genome and at least one ant genome. Coleoptera-specific genes are present in both coleopteran genomes; Diptera-specific genes present in at least one fly genome and one mosquito genome. Insect indicates other insect-specific genes. Mammal-specific genes are present in both mammalian genomes. The phylogenetic tree is based on the alignment of 1:1:1 orthologs.
Figure 1—figure supplement 1
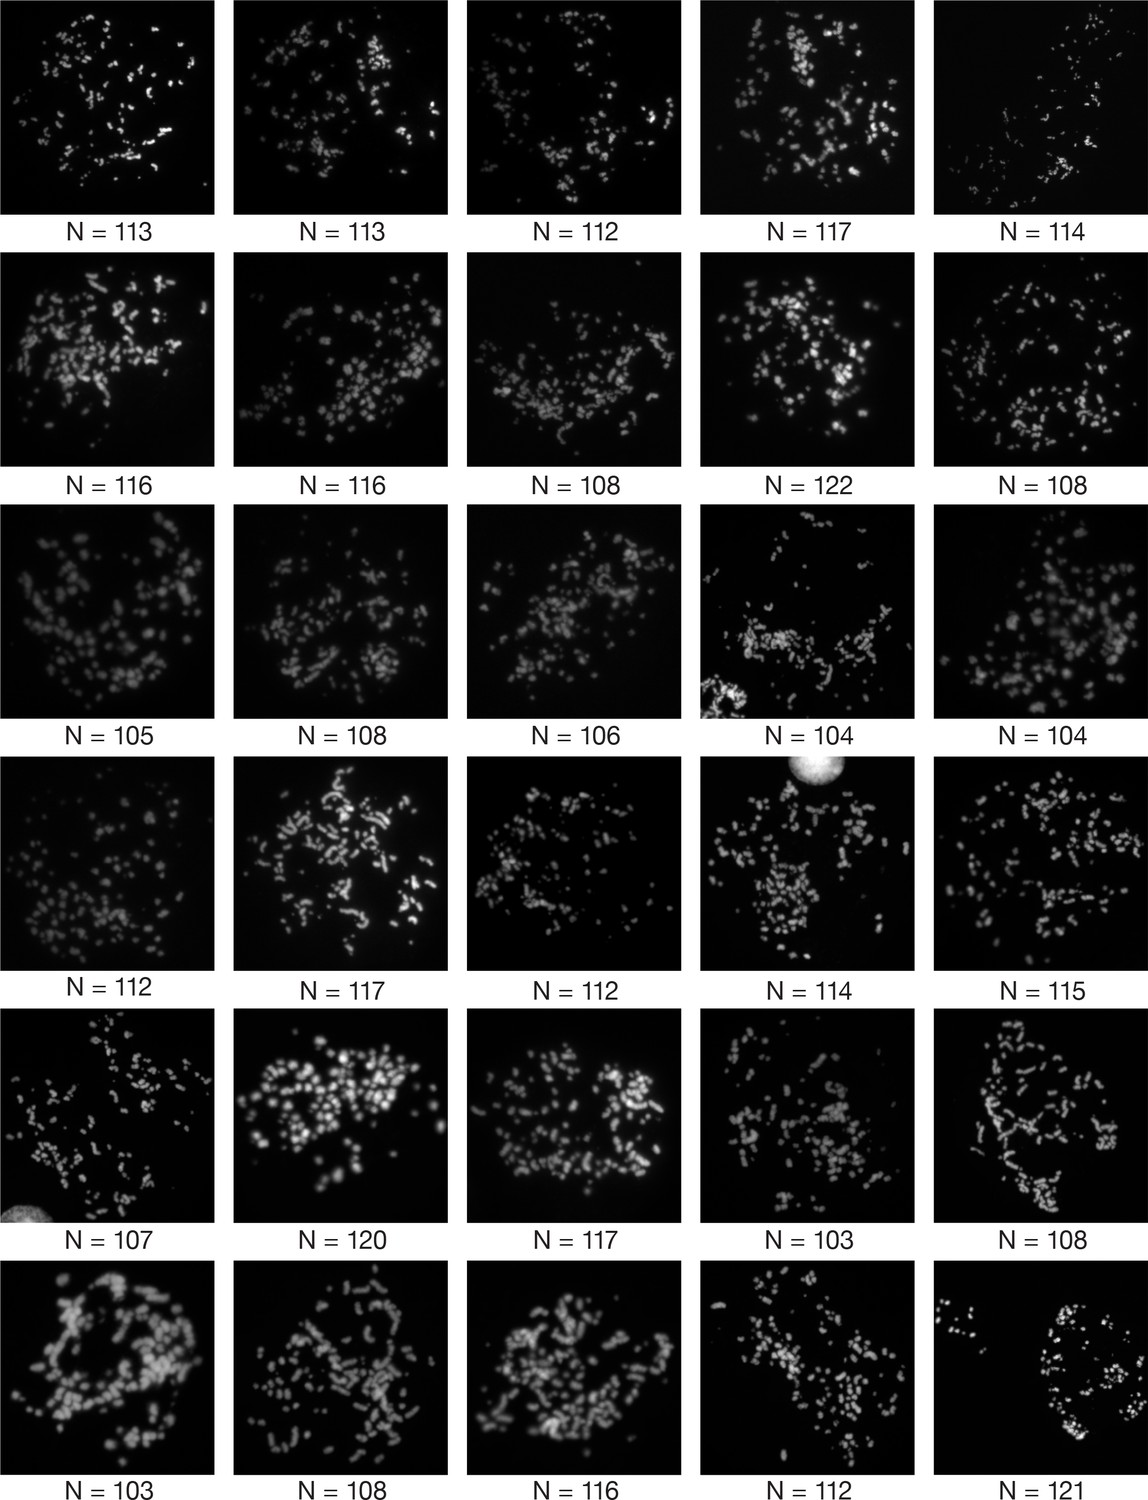
Hi5 cell Karyotyping.
Thirty images showing the numbers of chromosomes (N) in Hi5 cells. N ranged from 103 to 122; mean ± S.D.=111.7 ± 5.45. Since lepidopteran cell lines are typically tetraploid, the haploid genome likely contains 28 (mean ± S.D.=27.9 ± 1.36) pairs of chromosomes.
Figure 1—figure supplement 2
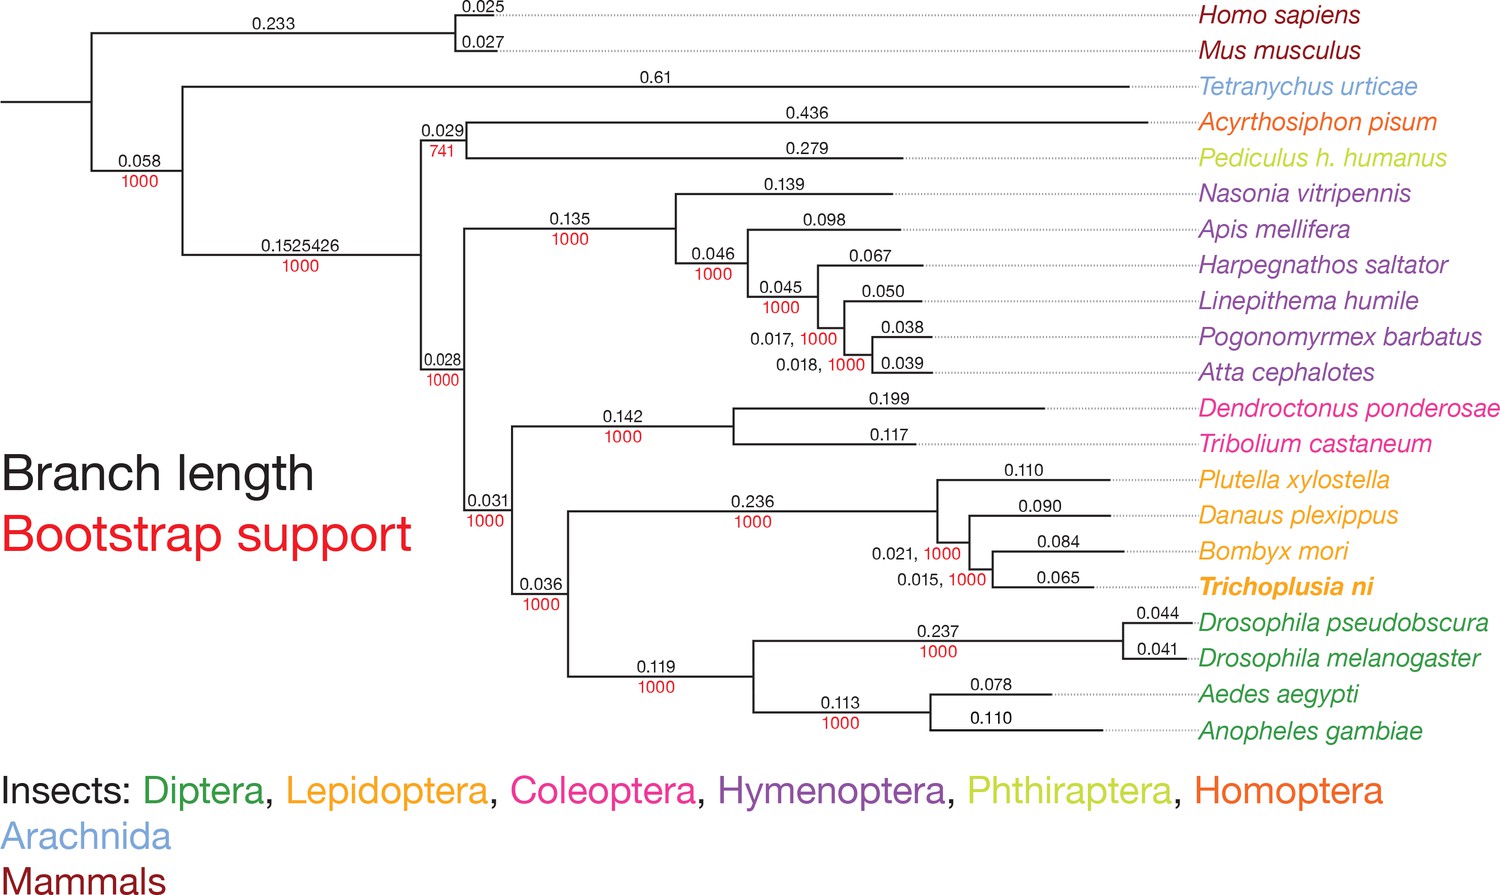
Phylogenetic tree of 21 species showing the scale, branch lengths and bootstrap support.
Strict 1:1:1 orthologs were used to compute the phylogenetic tree using the maximum likelihood method. Black, branch length; red, bootstrap support.
Figure 1—figure supplement 3
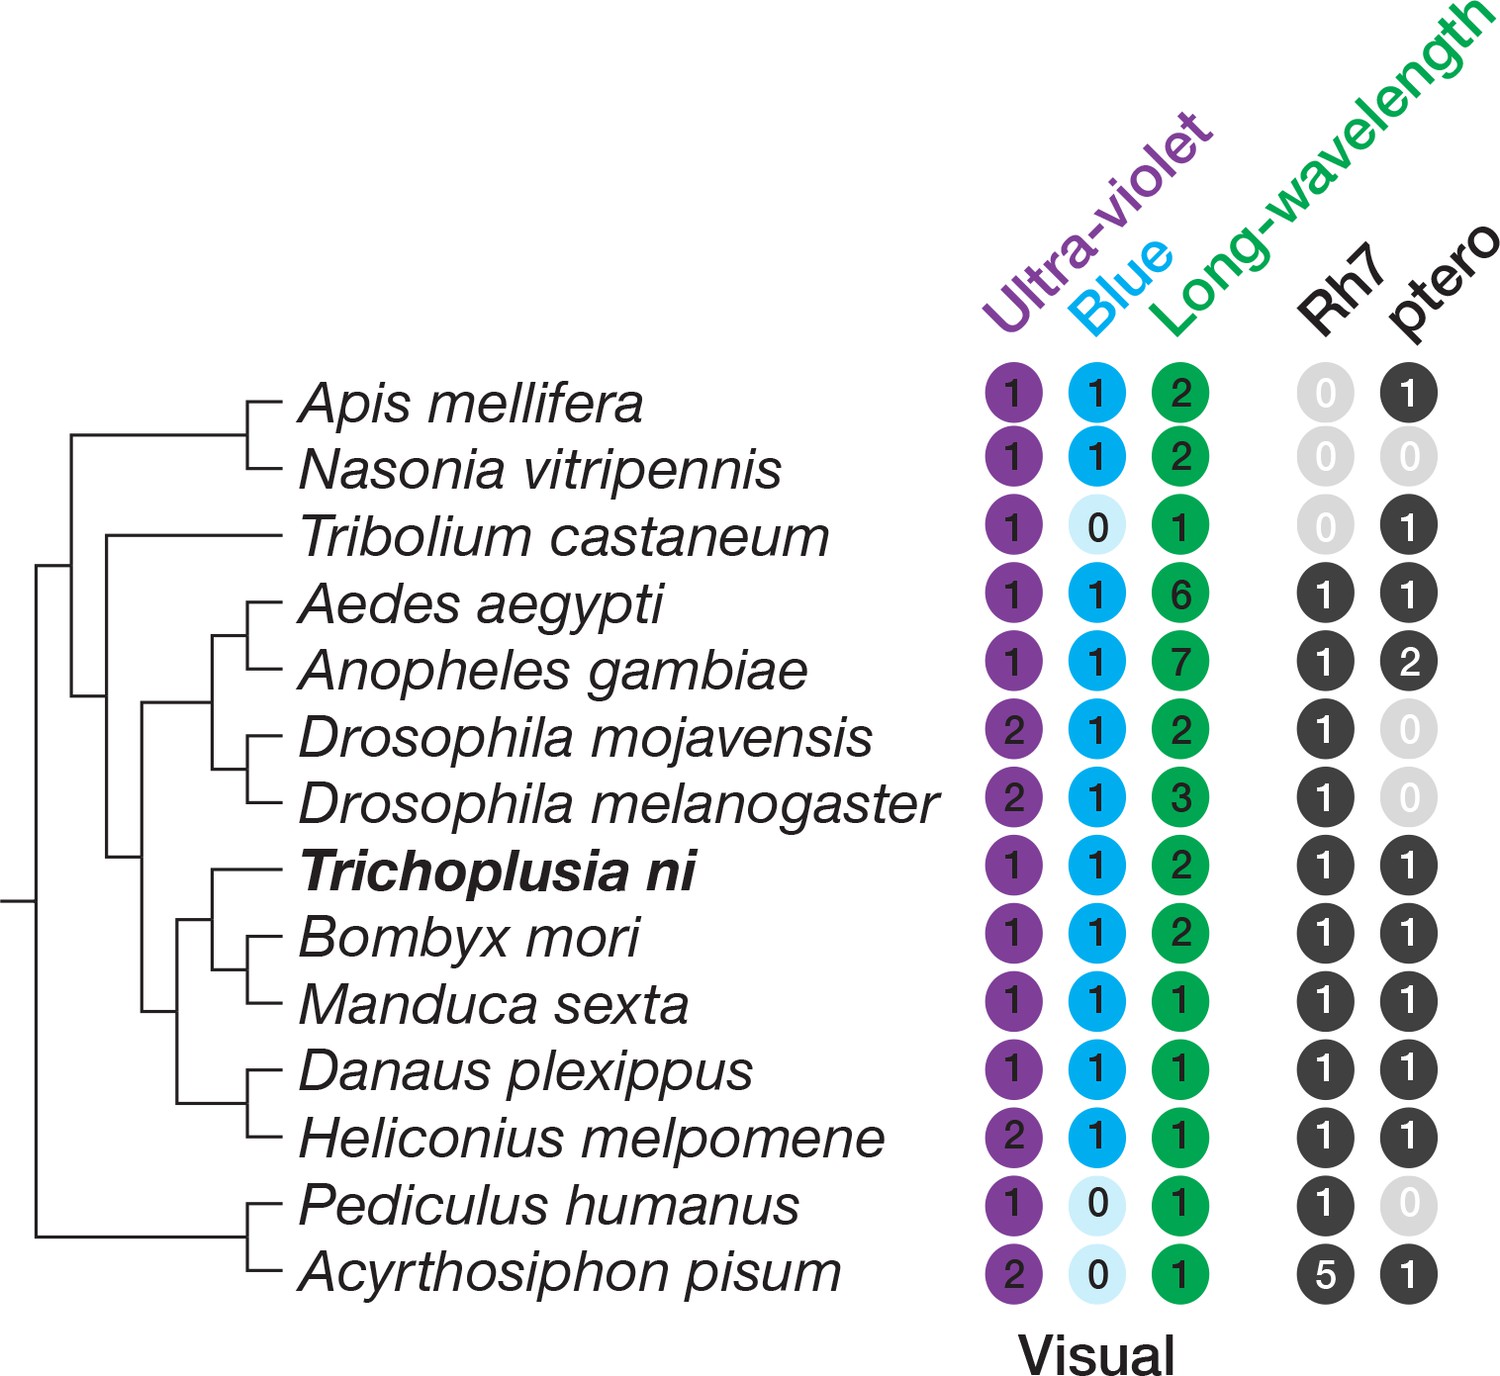
Opsins in insects.
https://doi.org/10.7554/eLife.31628.006
Figure 2 with 2 supplements
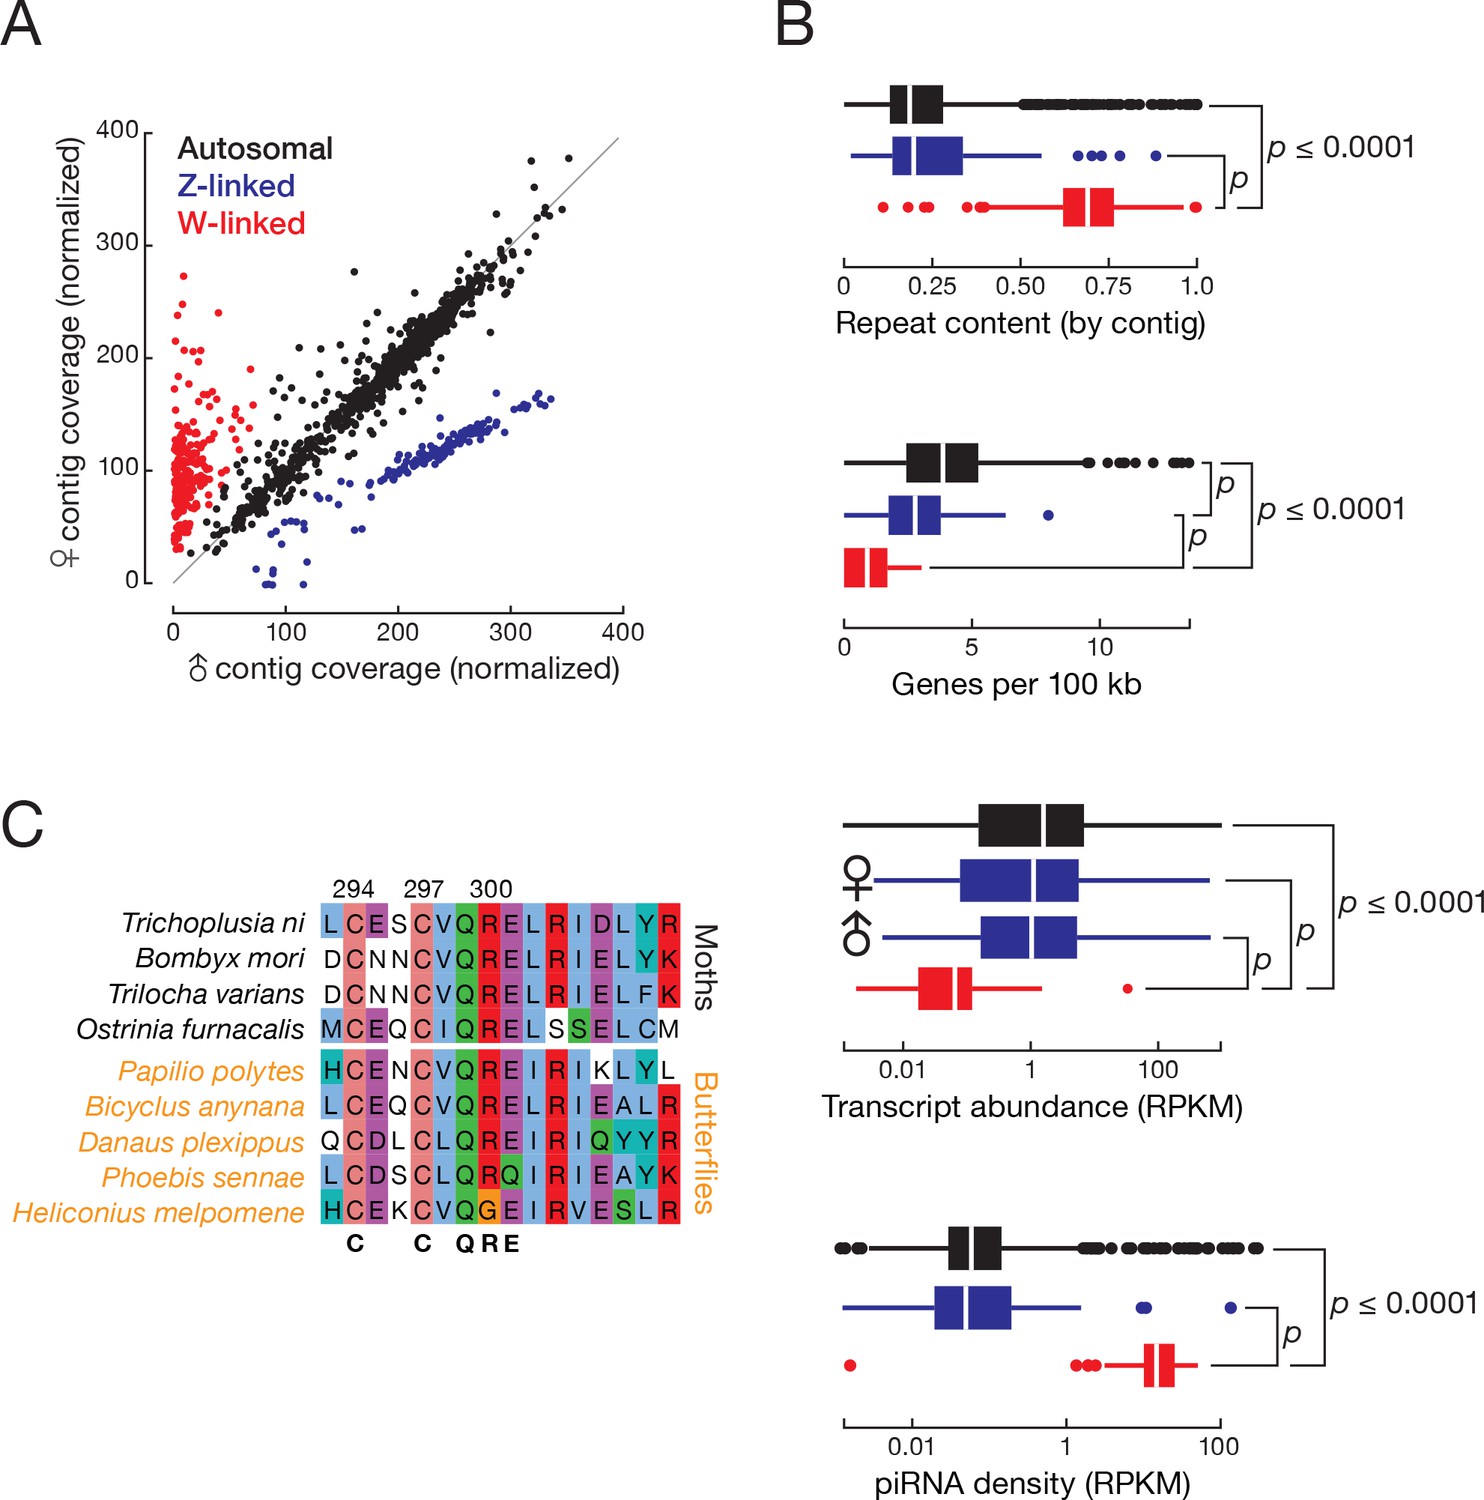
T. ni males are ZZ and females are ZW.
(A) Normalized contig coverage in males and females. (B) Relative repeat content, gene density, transcript abundance (female and male thoraces), and piRNA density of autosomal, Z-linked, and W-linked contigs (ovary). (C) Multiple sequence alignment of the conserved region of the sex-determining gene masc among the lepidopteran species.
Figure 2—figure supplement 1
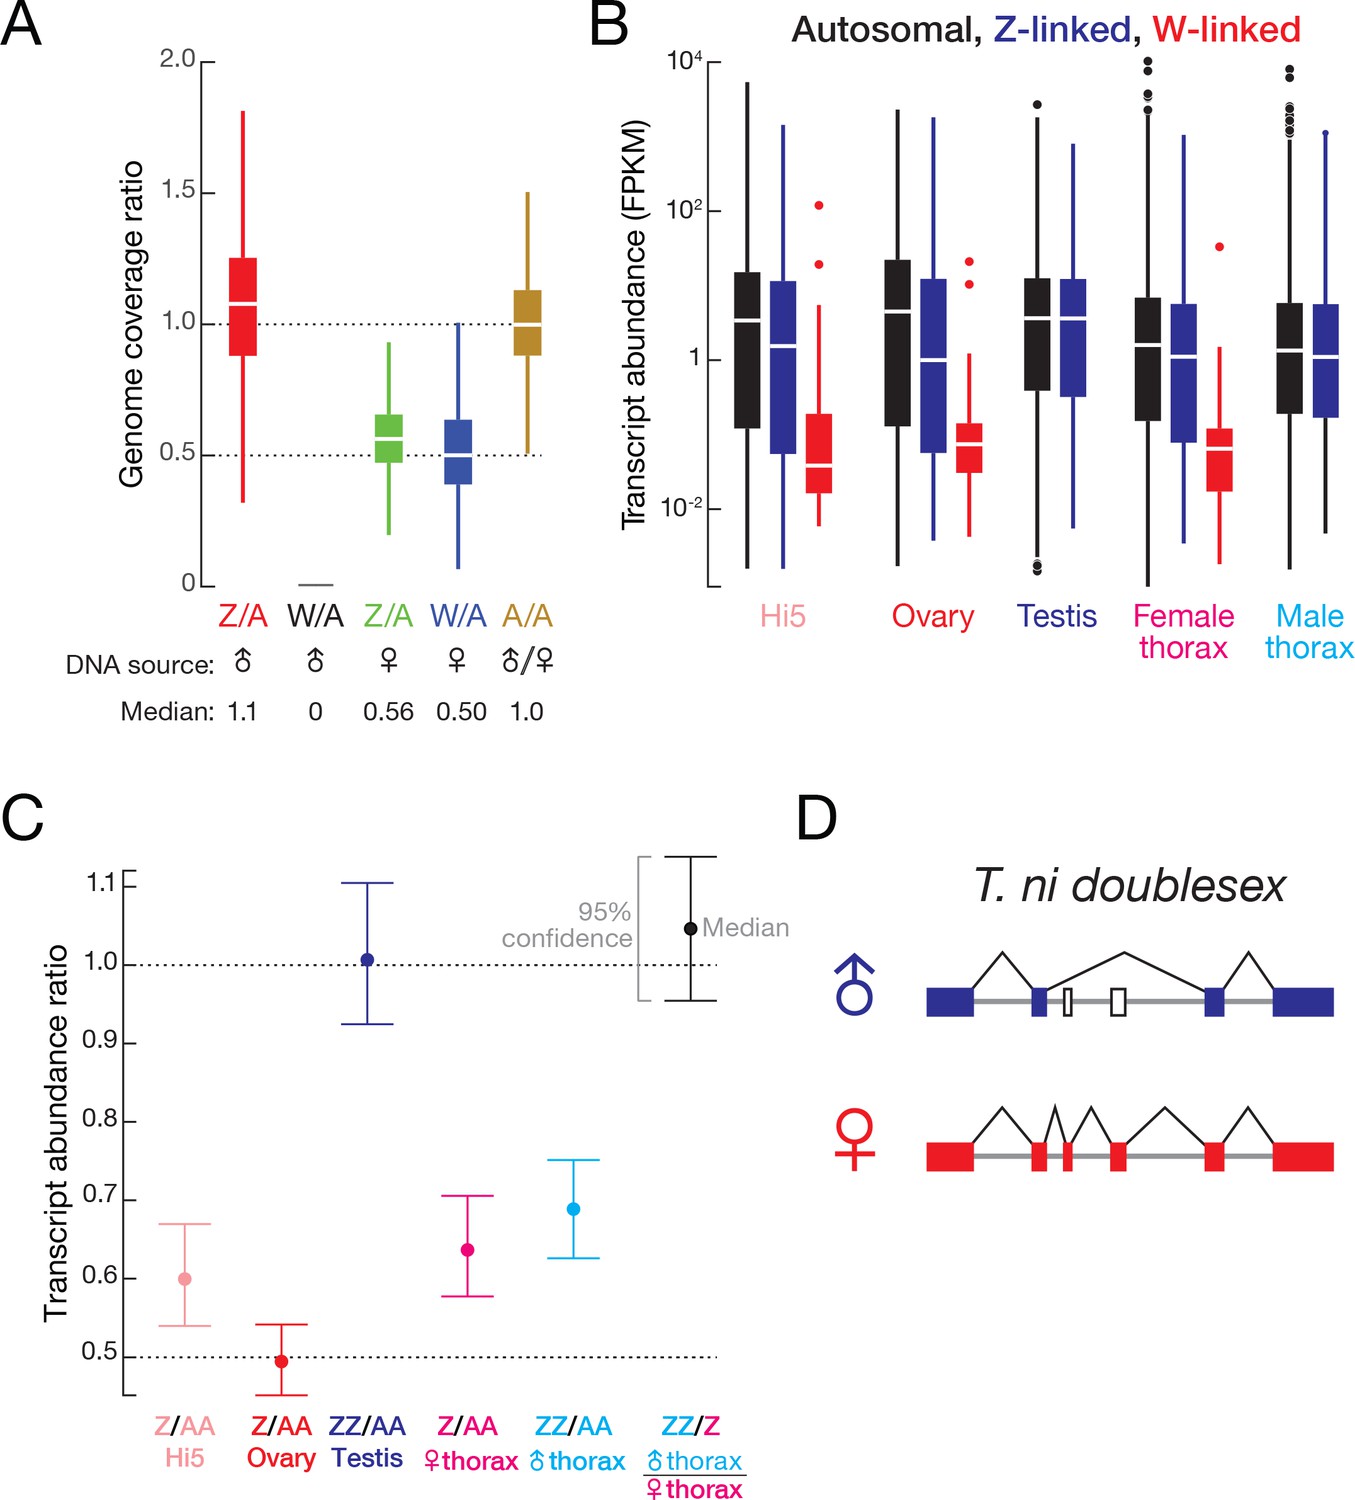
T. ni sex determination and dosage compensation.
(A) Genomic coverage comparison of Z-linked, W-linked and autosomal contigs. Contig coverage was shuffled 1,000,000 times to calculate the coverage ratio. Outliers are not shown. (B) Autosomal, Z-linked and W-linked transcript abundance in Hi5 cells and T. ni tissues. (C) Transcript abundance ratios of autosomal, Z-linked, and W-linked genes in Hi5 cells and T. ni tissues. Error bars represent 95% confidence interval estimated from 1000 bootstrap replicates. (D). Sex-specific splicing of T. ni doublesex pre-mRNA.
Figure 2—figure supplement 2
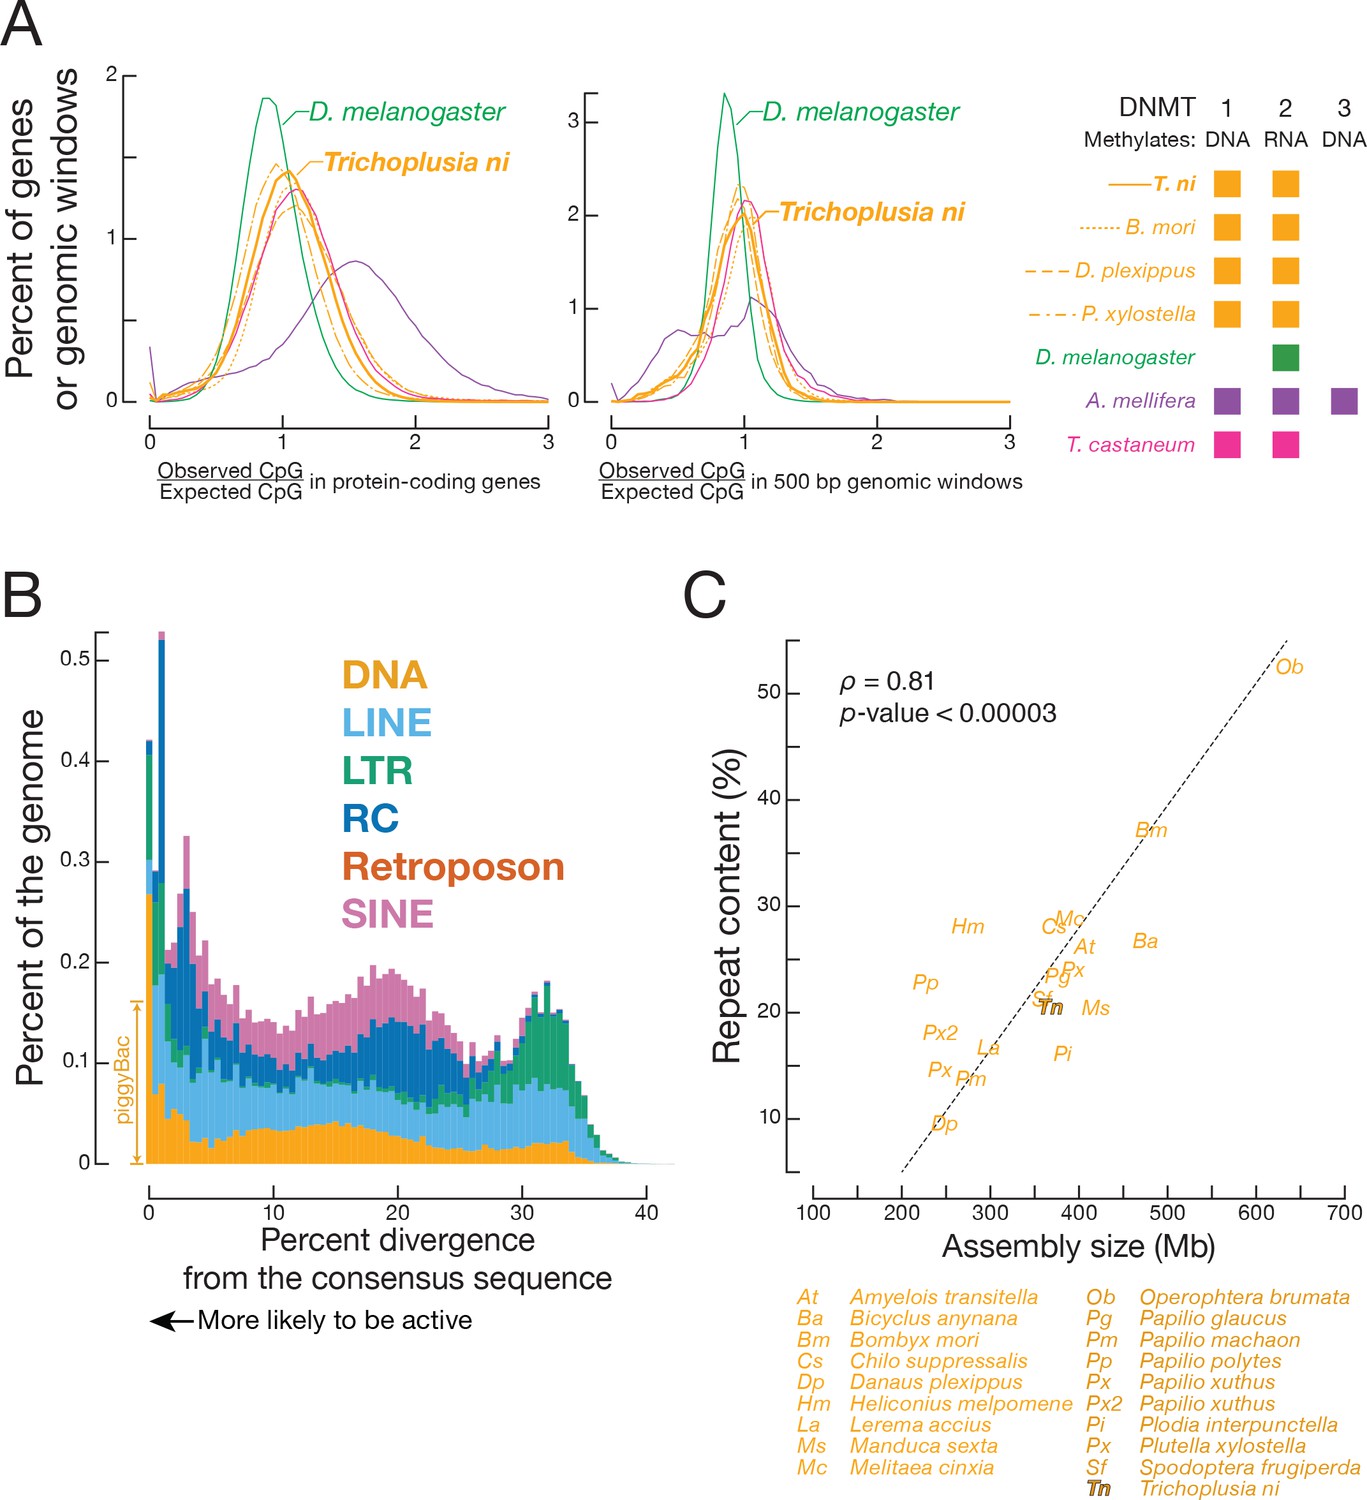
CpG ratios and transposons.
(A) Distribution of observed-to-expected CpG ratios in protein-coding genes (left panel) and in 500 bp genomic windows (right panel) in A. mellifera, B. mori, D. plexippus, D. melanogaster, P. xylostella, T. castaneum, and T. ni. (B) Proportion of the genome occupied by transposons versus transposon sequence divergence. Sequence divergence was calculated by comparing individual transposon copies with the corresponding consensus sequence (see Materials and methods). (C) Repeat content in lepidopteran genomes.
Figure 3
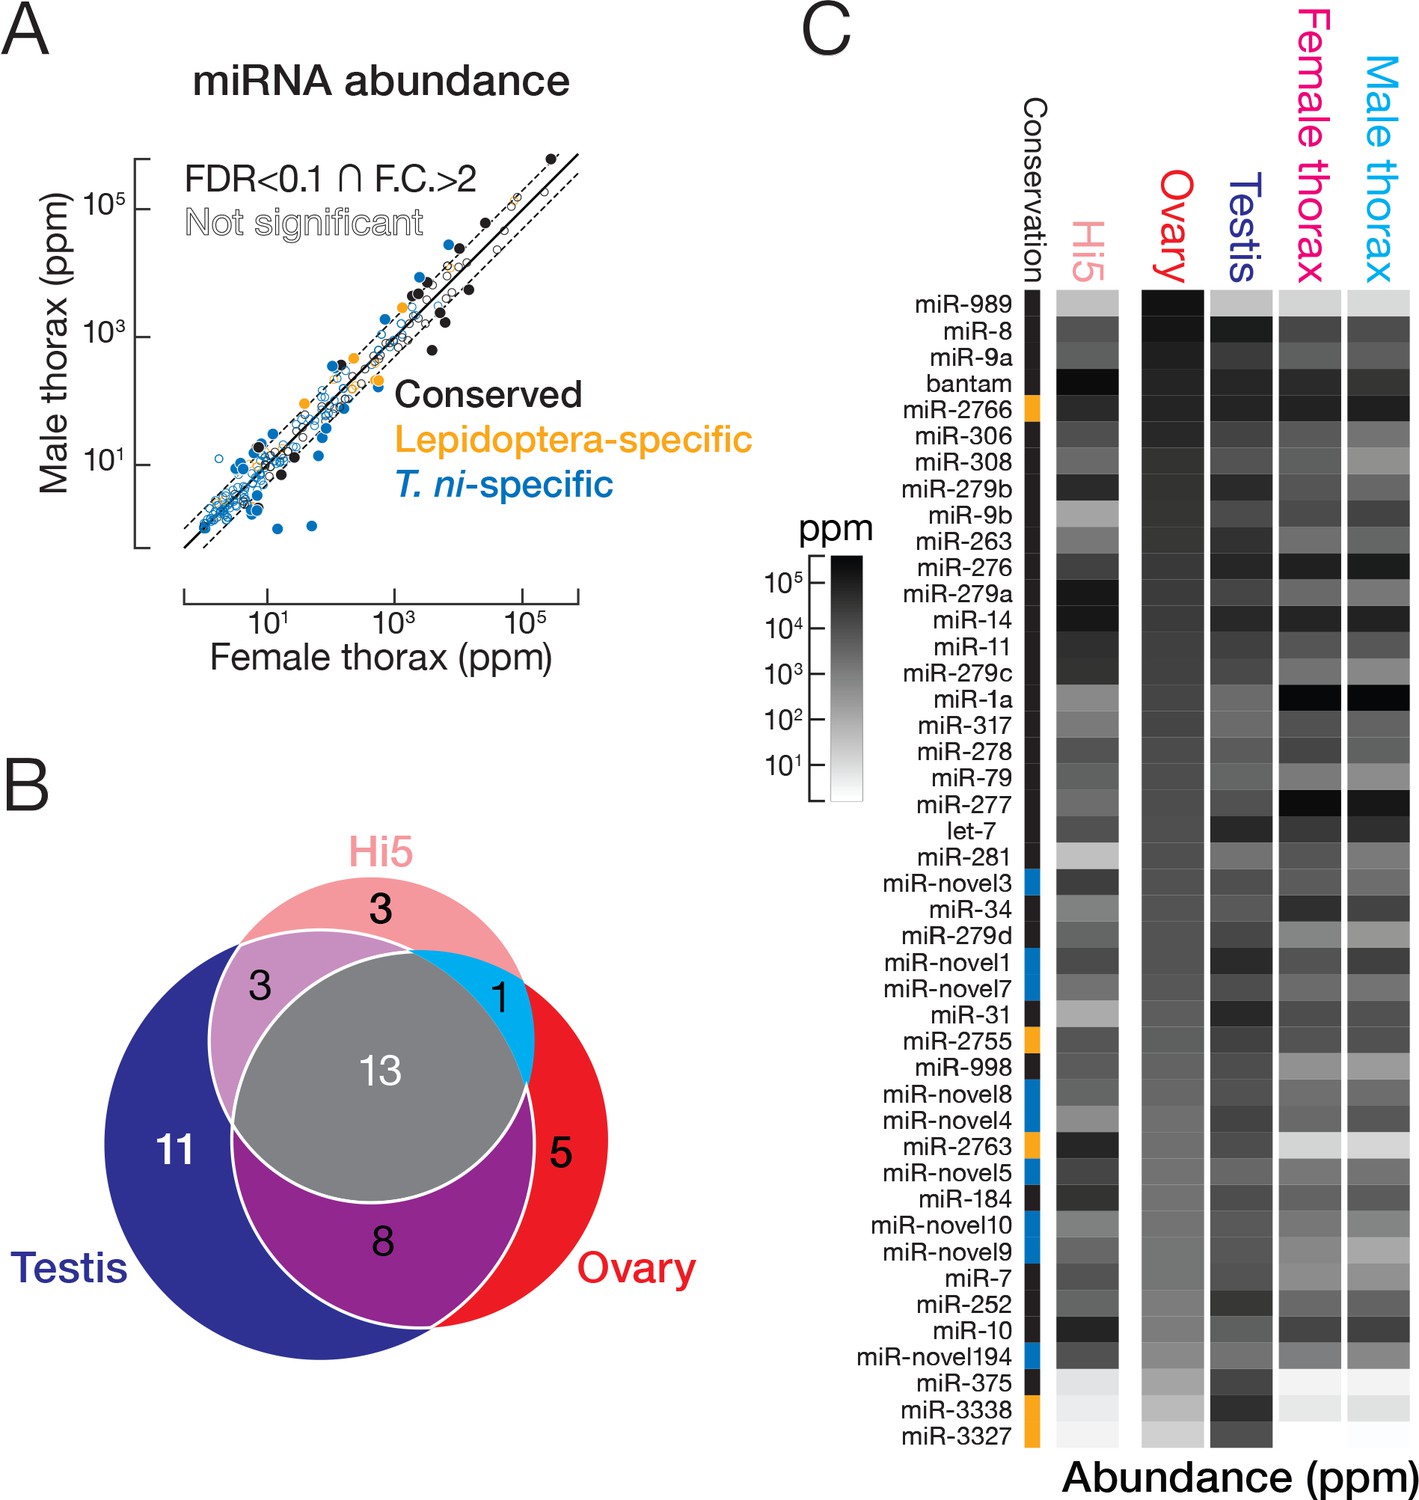
miRNA expression in T. ni.
(A) Comparison of miRNA abundance in male and female T. ni thoraces. Solid circles, miRNAs with FDR < 0.1 and fold change >2. Outlined circles, all other miRNAs. (B) Comparison of the tissue distribution of the 44 most abundant miRNAs among T. ni ovaries, testes, and Hi5. (C) Heat map showing the abundance of miRNAs in (B). miRNAs are ordered according to abundance in ovary. Conservation status uses the same color scheme in (A).
Figure 4 with 2 supplements
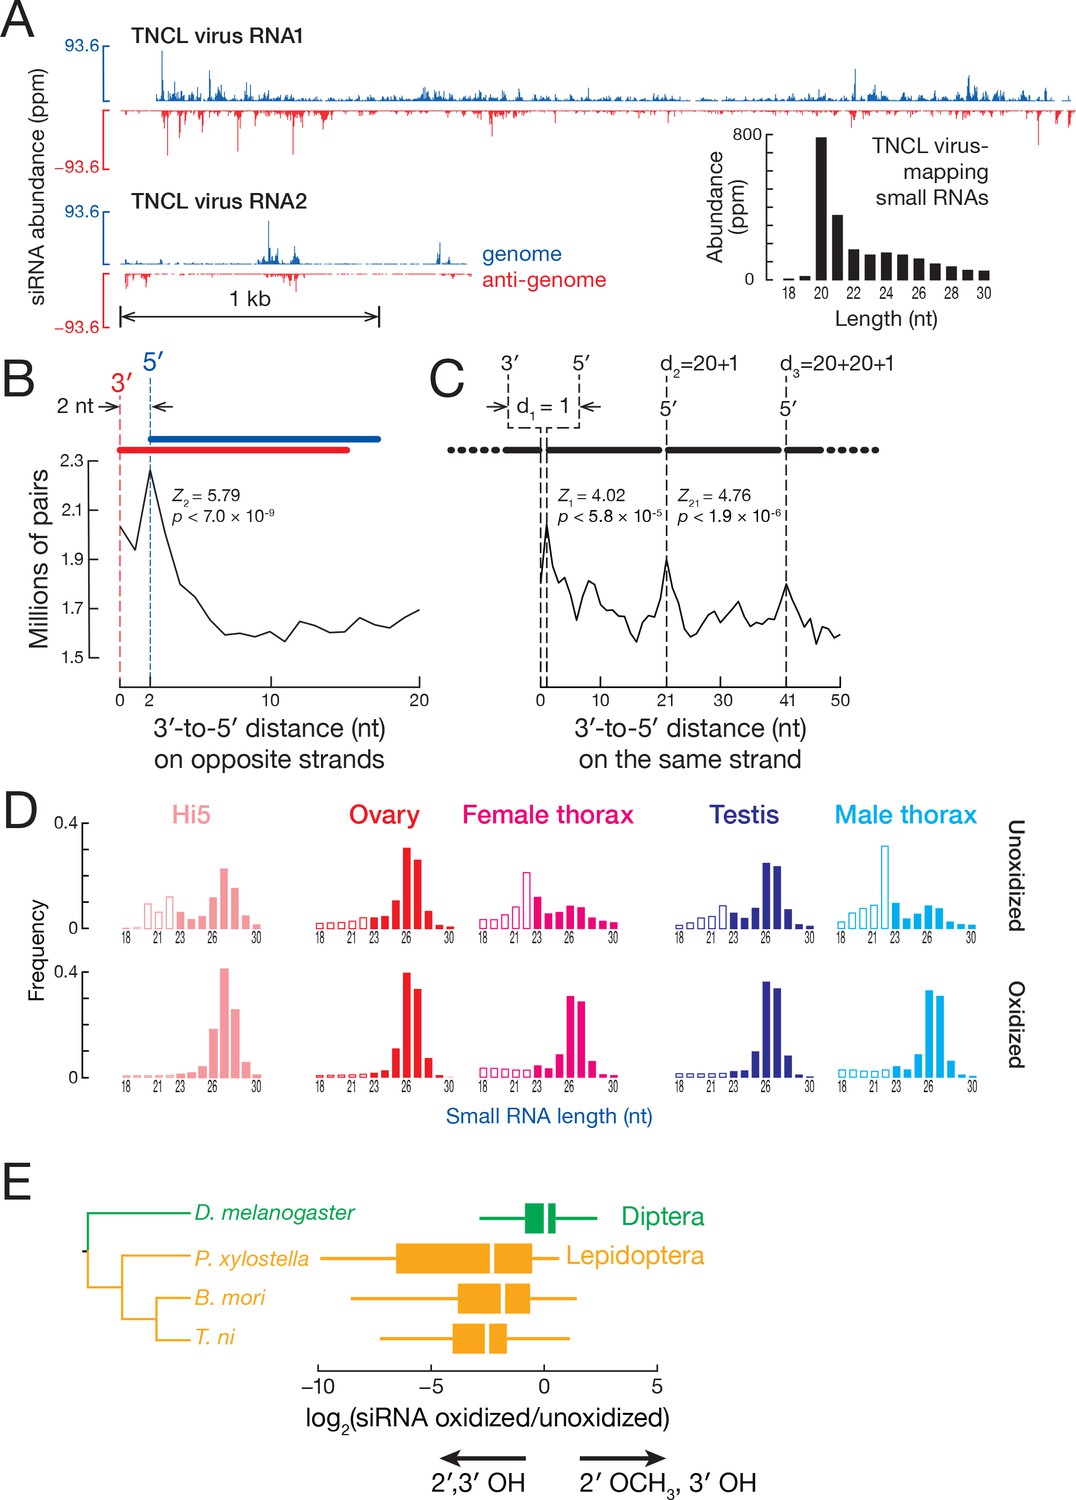
siRNA.
(A) Distribution of siRNAs mapping to TNCL virus in the genomic (blue) and anti-genomic orientation (red). Inset: length distribution of TNCL virus-mapping small RNAs. (B) Distance between the 3′ and 5′ ends of siRNAs on opposite viral strands. (C) Distance between the 3′ and 5′ ends of siRNAs on the same viral strand. (D) Length distribution of small RNAs from unoxidized and oxidized small RNA-seq libraries. (E) Lepidopteran siRNAs are not 2′-O-methylated. The box plots display the ratio of abundance (as a fraction of all small RNAs sequenced) for each siRNA in oxidized versus unoxidized small RNA-seq libraries. The tree shows the phylogenetic relationships of the analyzed insects. Outliers are not shown.
Figure 4—figure supplement 1
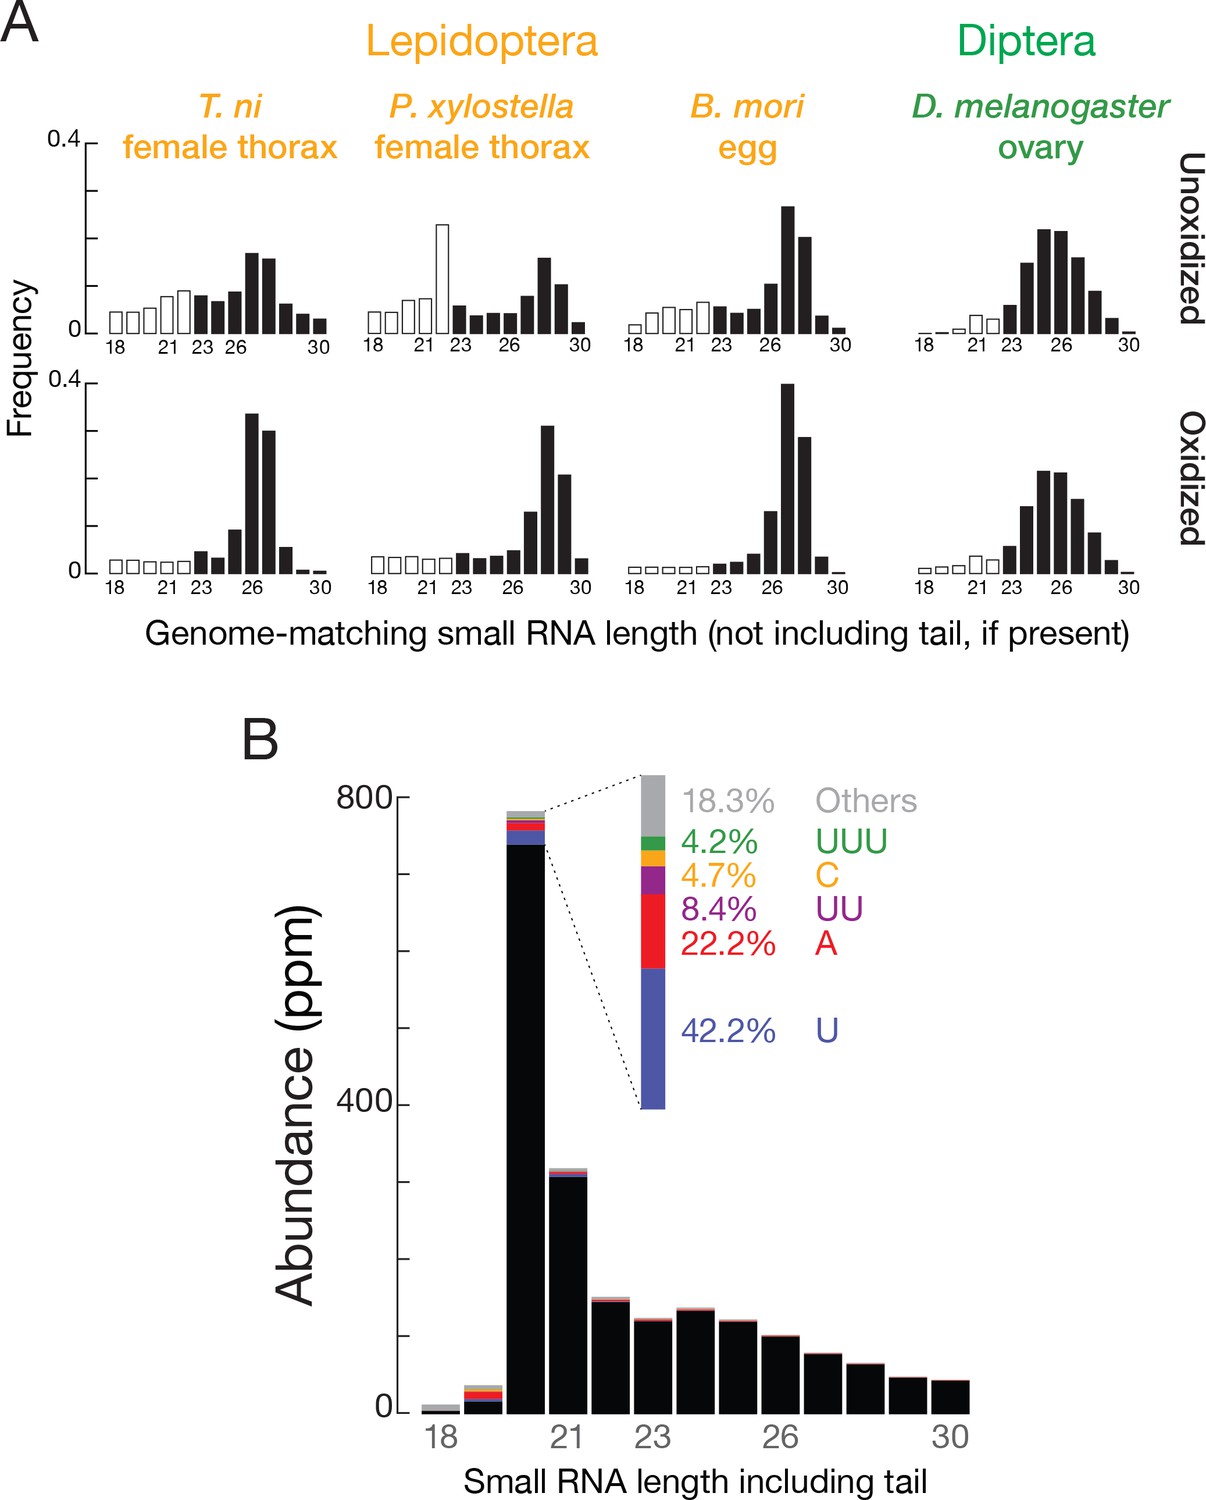
T. ni siRNAs.
(A) siRNA length distributions for multiple insects in oxidized and unoxidized small RNA-seq libraries. (B) Length distribution of fully matched and tailed TNCL virus-siRNAs.
Figure 4—figure supplement 2
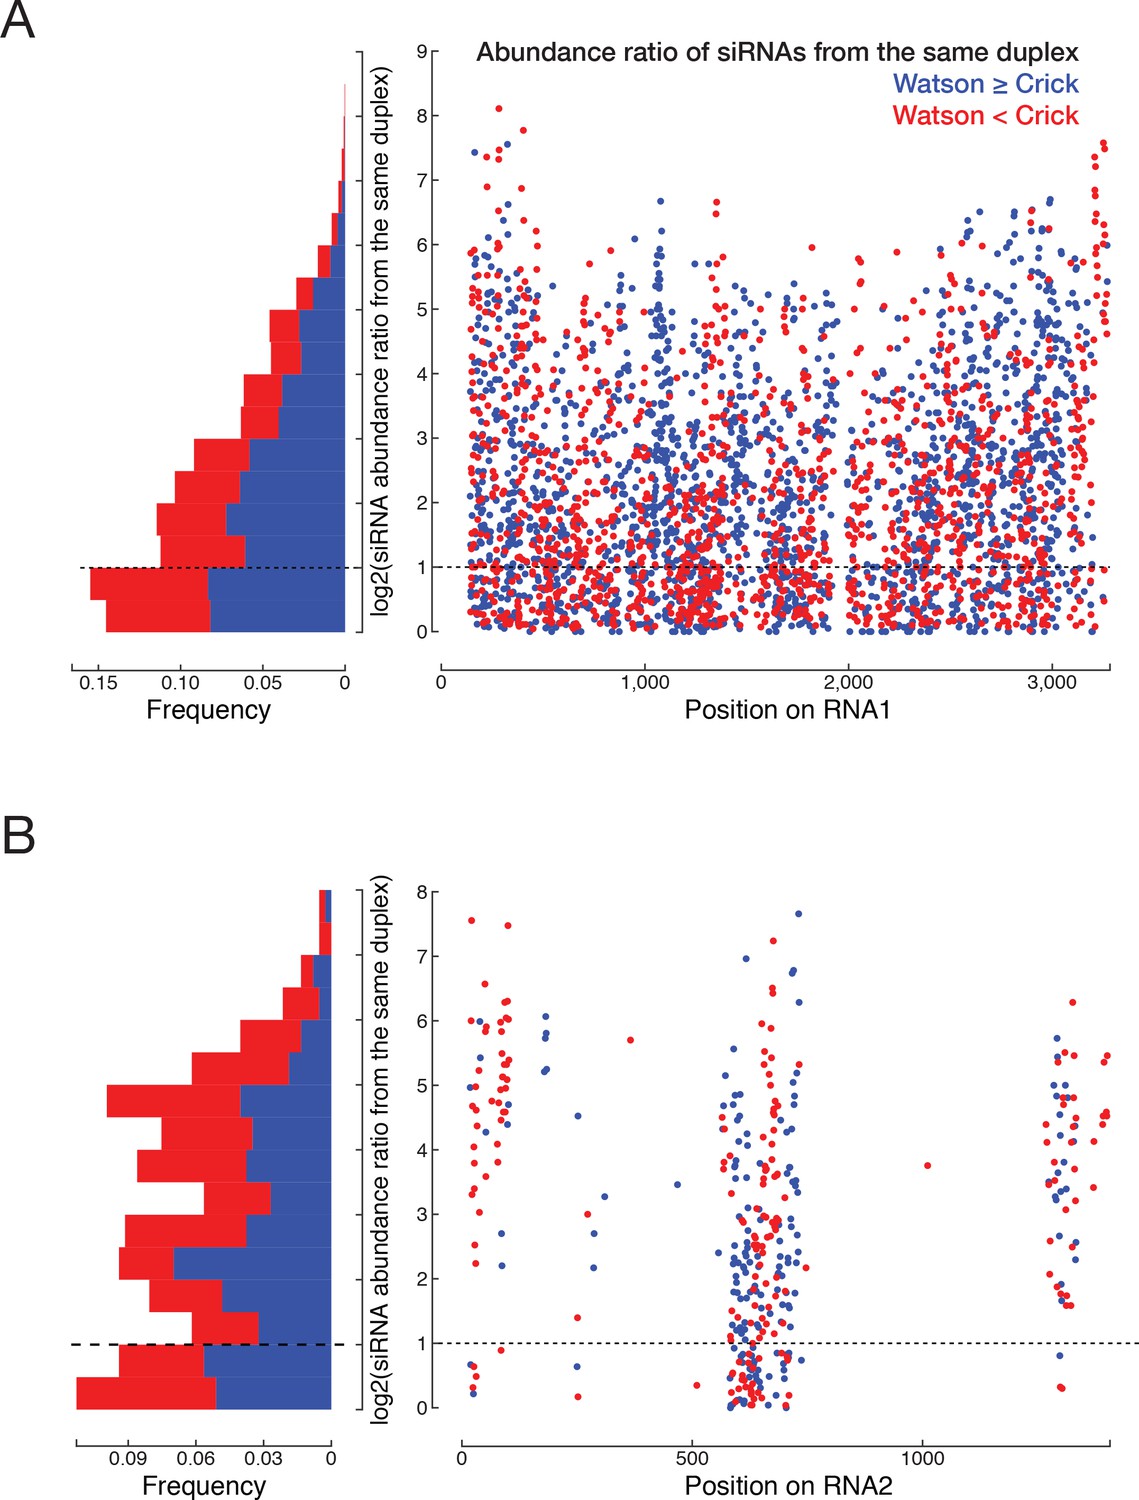
Loading asymmetry of siRNAs mapping to TNCL RNA1 (A) and RNA2 (B).
For each single-stranded siRNA species, we searched for siRNAs on the other strand that when paired produce a typical siRNA duplex with two-nucleotide overhanging 3′ ends.
Figure 5 with 2 supplements
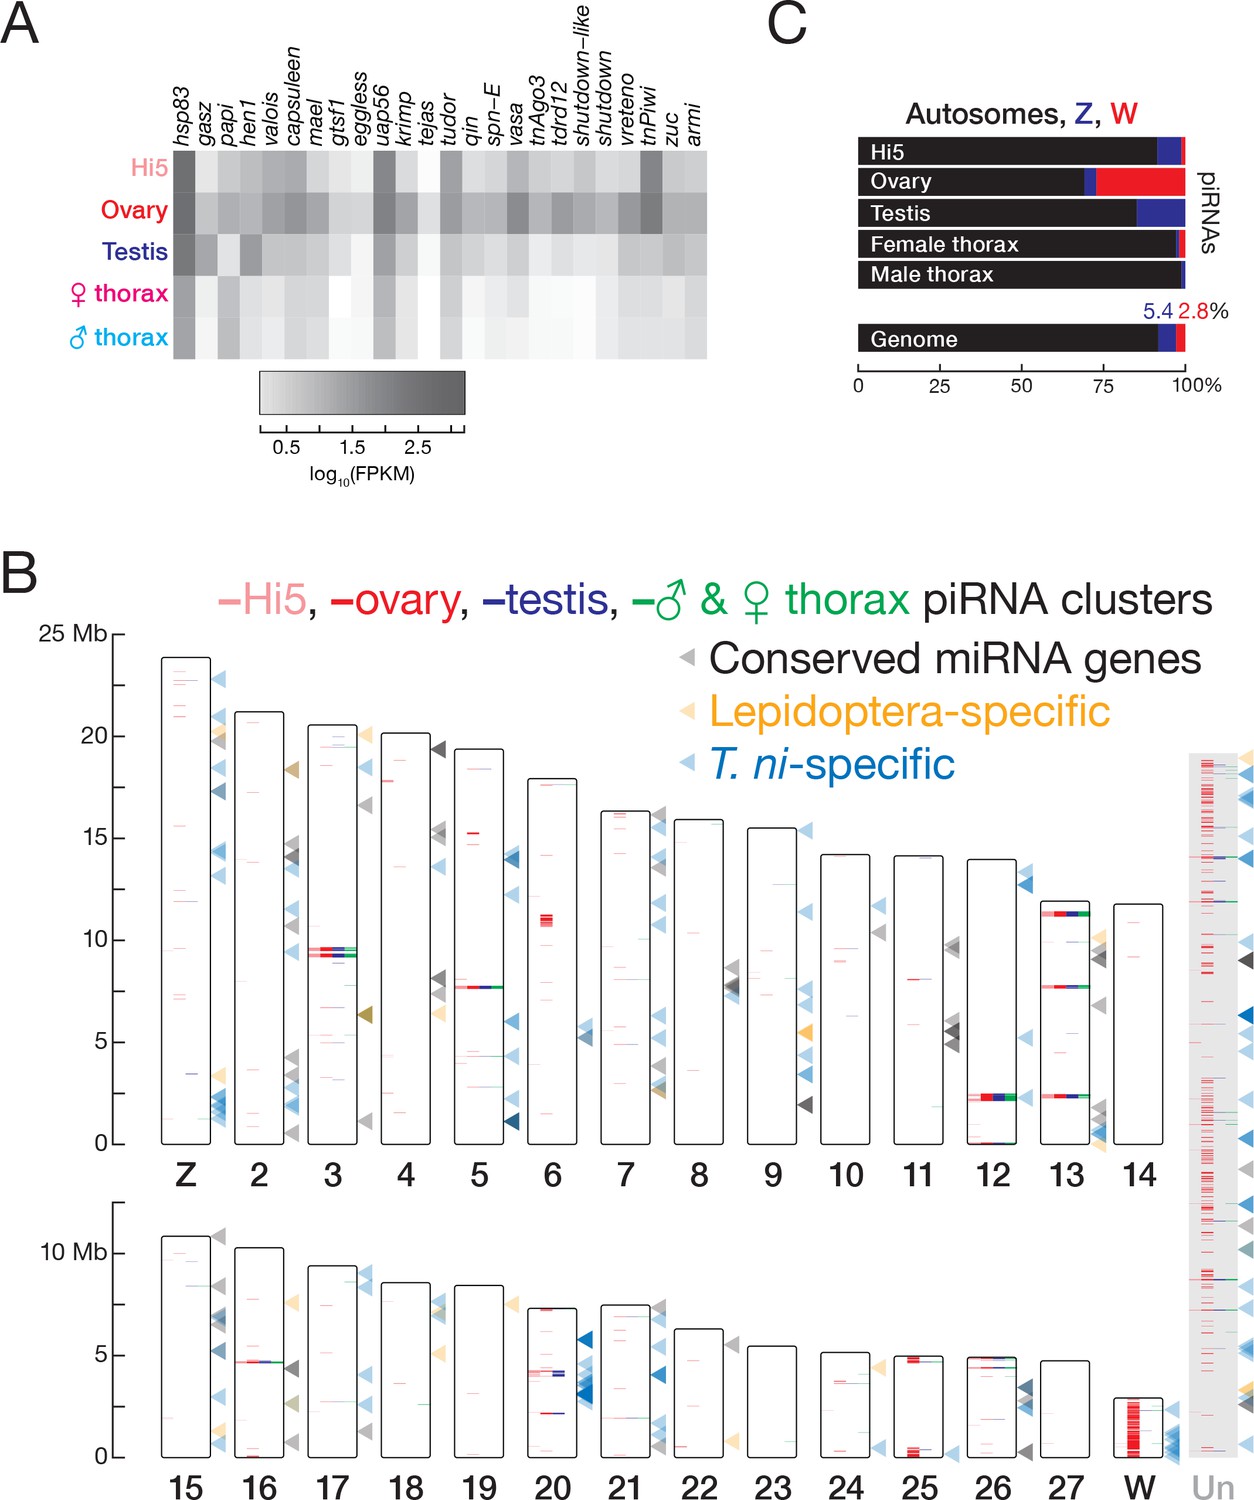
piRNAs and miRNAs in the T. ni genome.
(A) Abundance of mRNAs encoding piRNA pathway proteins) in Hi5 cells, ovary, testis, and thorax. (B) Ideogram displaying the positions of miRNA genes (arrowheads) and piRNA clusters in the T. ni genome. Color-coding reports tissue expression for Hi5 cells, ovaries, testis, and thorax. Contigs that cannot be placed onto chromosome-length scaffolds are arbitrarily concatenated and are marked ‘Un.’ (C) Distribution of piRNAs among the autosomes, Z, and W chromosomes in Hi5 cells, ovary, testis, and female and male thorax, compared with the fraction of the genome corresponding to autosomes, W, and Z chromosomes.
Figure 5—figure supplement 1
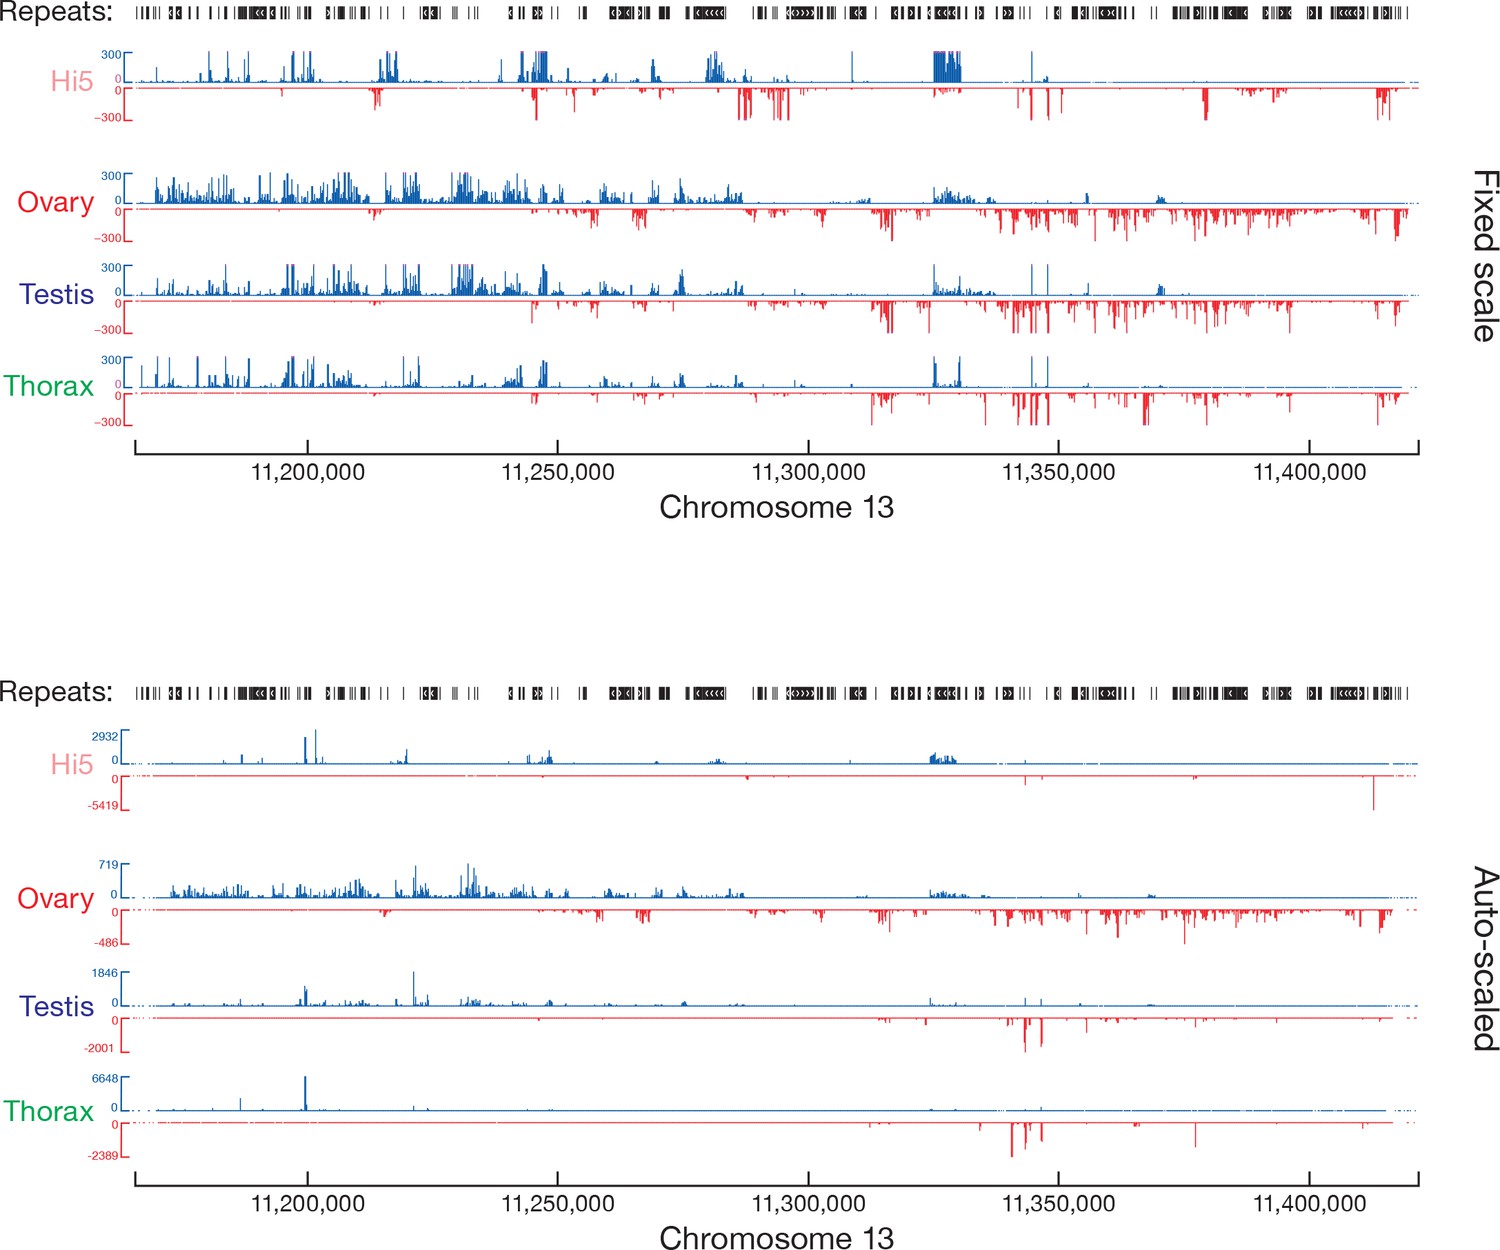
piRNA abundance (ppm) along the most productive piRNA cluster.
Top, fixed scale (some data clipped); bottom, auto-scaled.
Figure 5—figure supplement 2
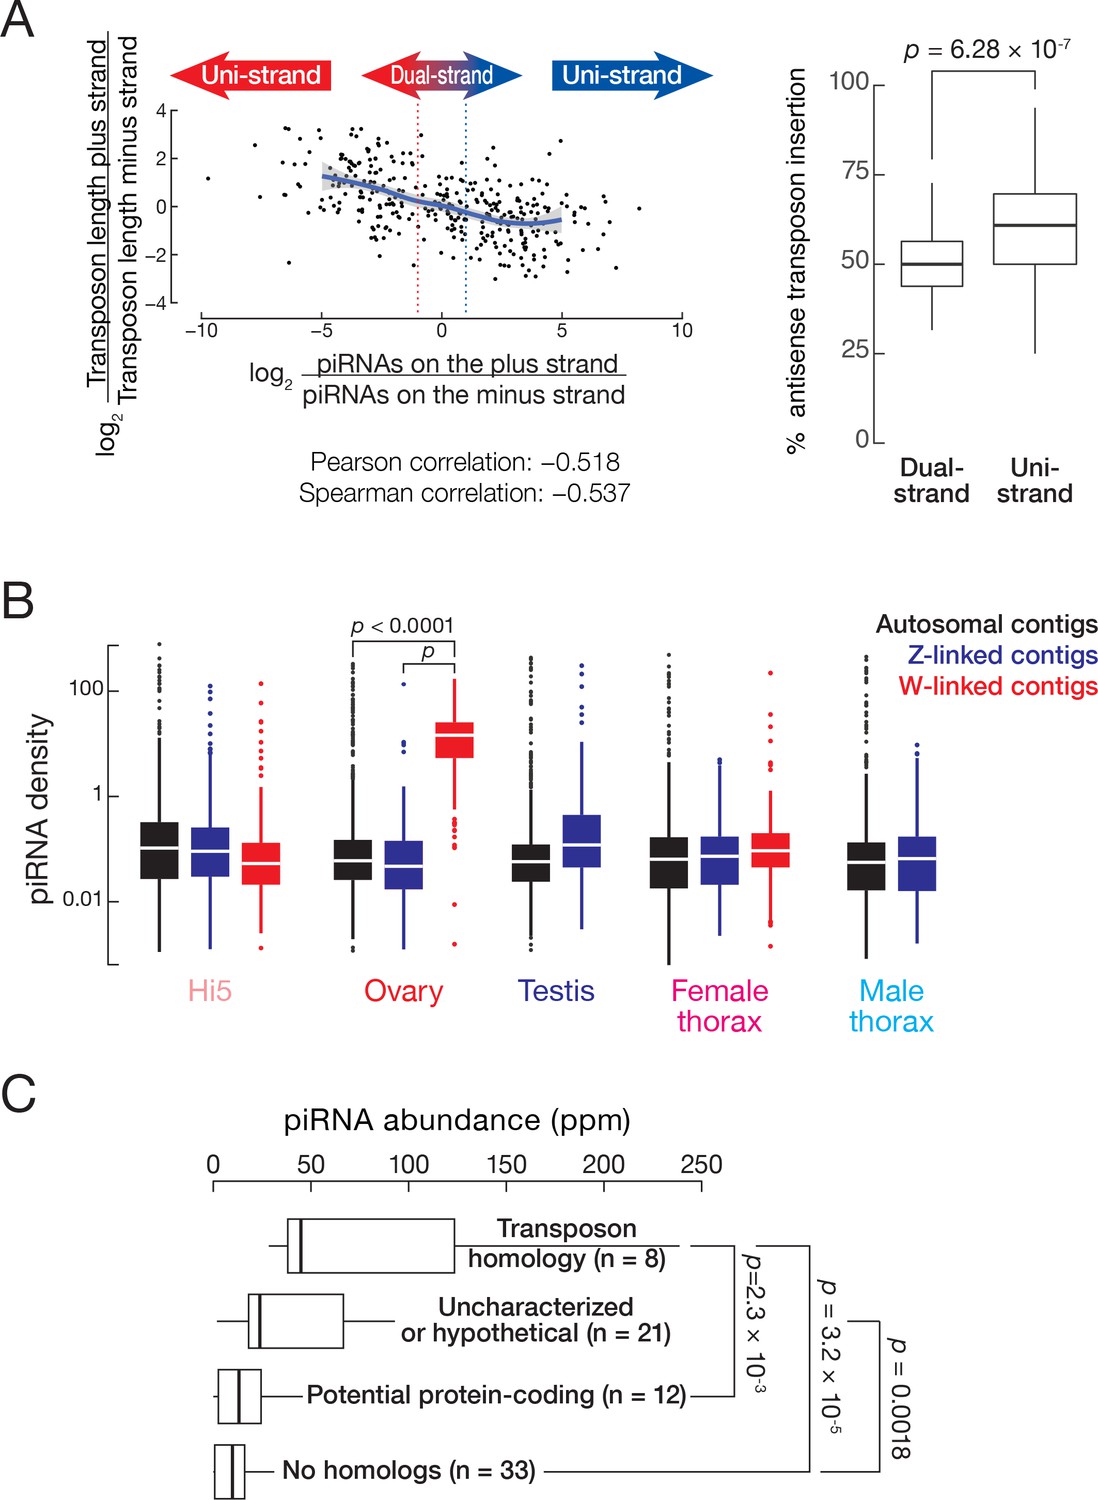
T. ni piRNAs.
(A) piRNA clusters tend to produce piRNAs that are antisense to transposons. The x-axis represents the ratio of piRNAs from the plus strand to piRNAs from the minus strand, with the dotted lines indicating twofold difference. The y-axis indicates the ratio of transposons lengths on the plus strand over transposon length on the minus strand. The solid line indicates regression line and shading indicates 95% confidence interval by LOWESS. Boxplot shows fractions of antisense transposons (i.e. transposons inserted opposite to the direction of piRNAs precursor transcription) in dual- and uni-strand clusters. Outliers are not shown. Wilcoxon rank-sum test. (B) piRNA densities on autosomal, Z-linked and W-linked contigs in Hi5 cells, ovary, testis, and female and male thorax. (C) Abundance of piRNAs from putative W-linked genes.
Figure 6 with 1 supplement
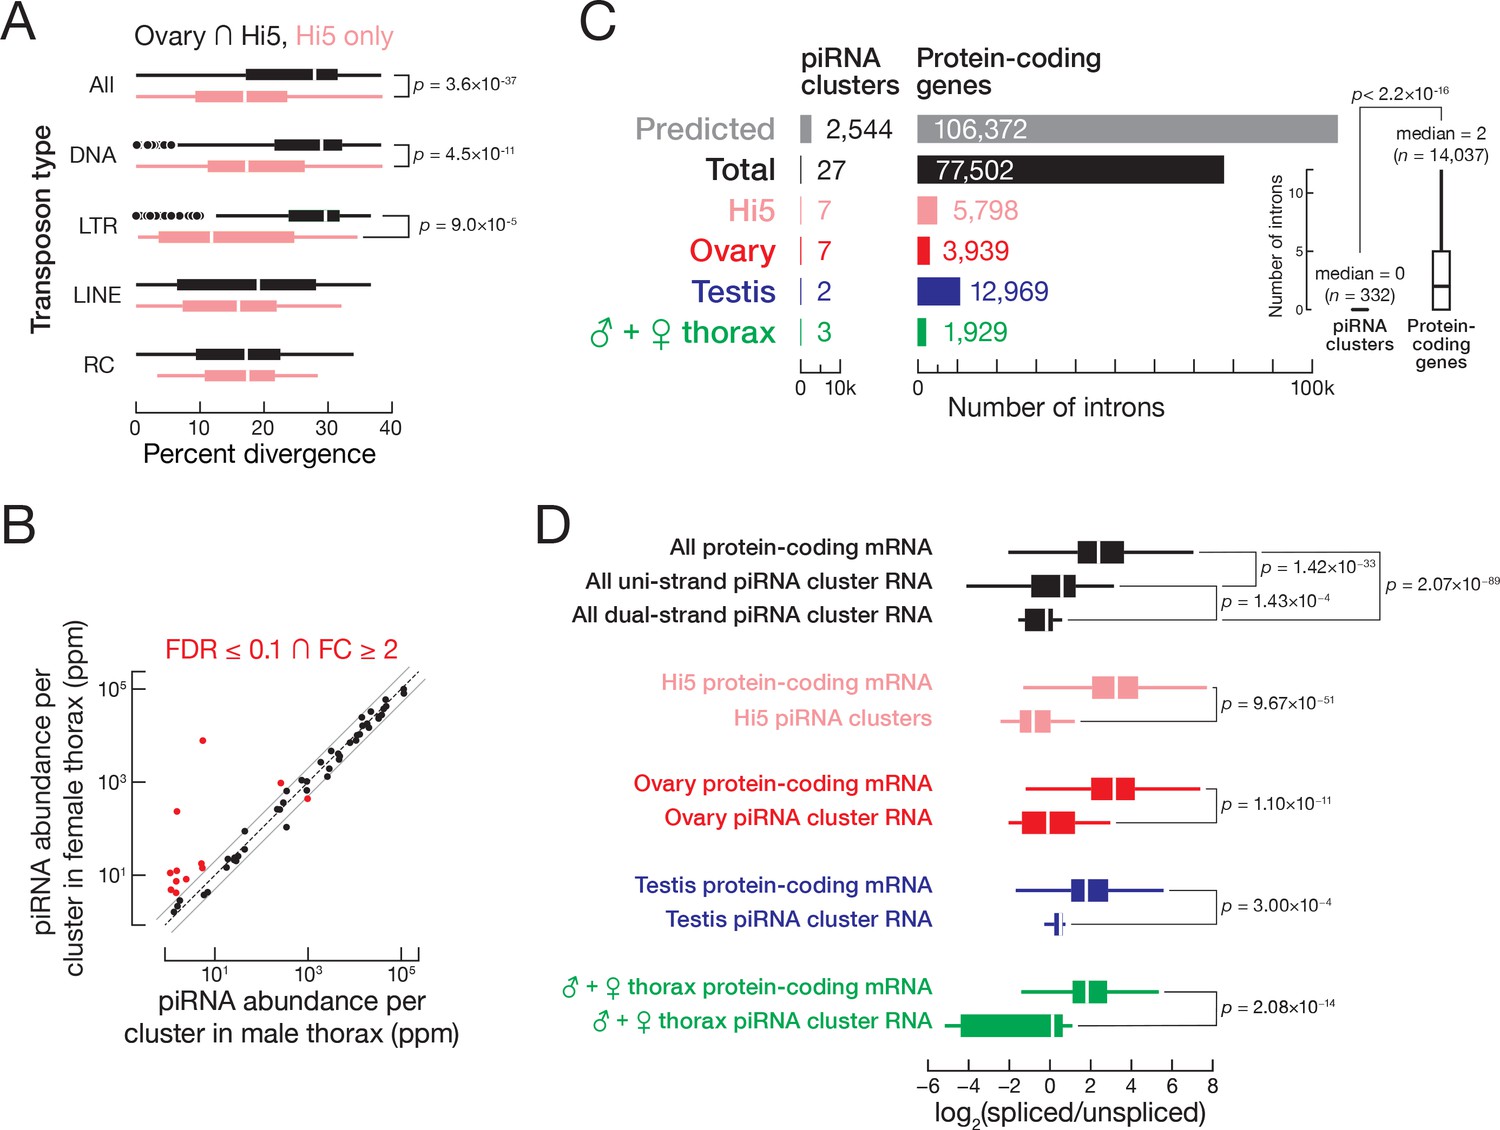
T. ni piRNAs.
(A) Hi5-specific piRNA clusters contain younger transposon copies. RC, rolling-circle transposons; LINE, Long interspersed nuclear elements; LTR, long terminal repeat retrotransposon; DNA, DNA transposon. (B) Comparison of piRNA abundance per cluster in female and male thorax. (C) piRNA precursors are rarely spliced. The number of introns supported by exon-exon junction-mapping reads is shown for protein-coding genes and for piRNA clusters for each tissue or cell type. (D) piRNA precursors are inefficiently spliced. Splicing efficiency is defined as the ratio of spliced over unspliced reads. Splice sites were categorized into those inside and outside piRNA clusters. Outliers are not shown.
Figure 6—figure supplement 1
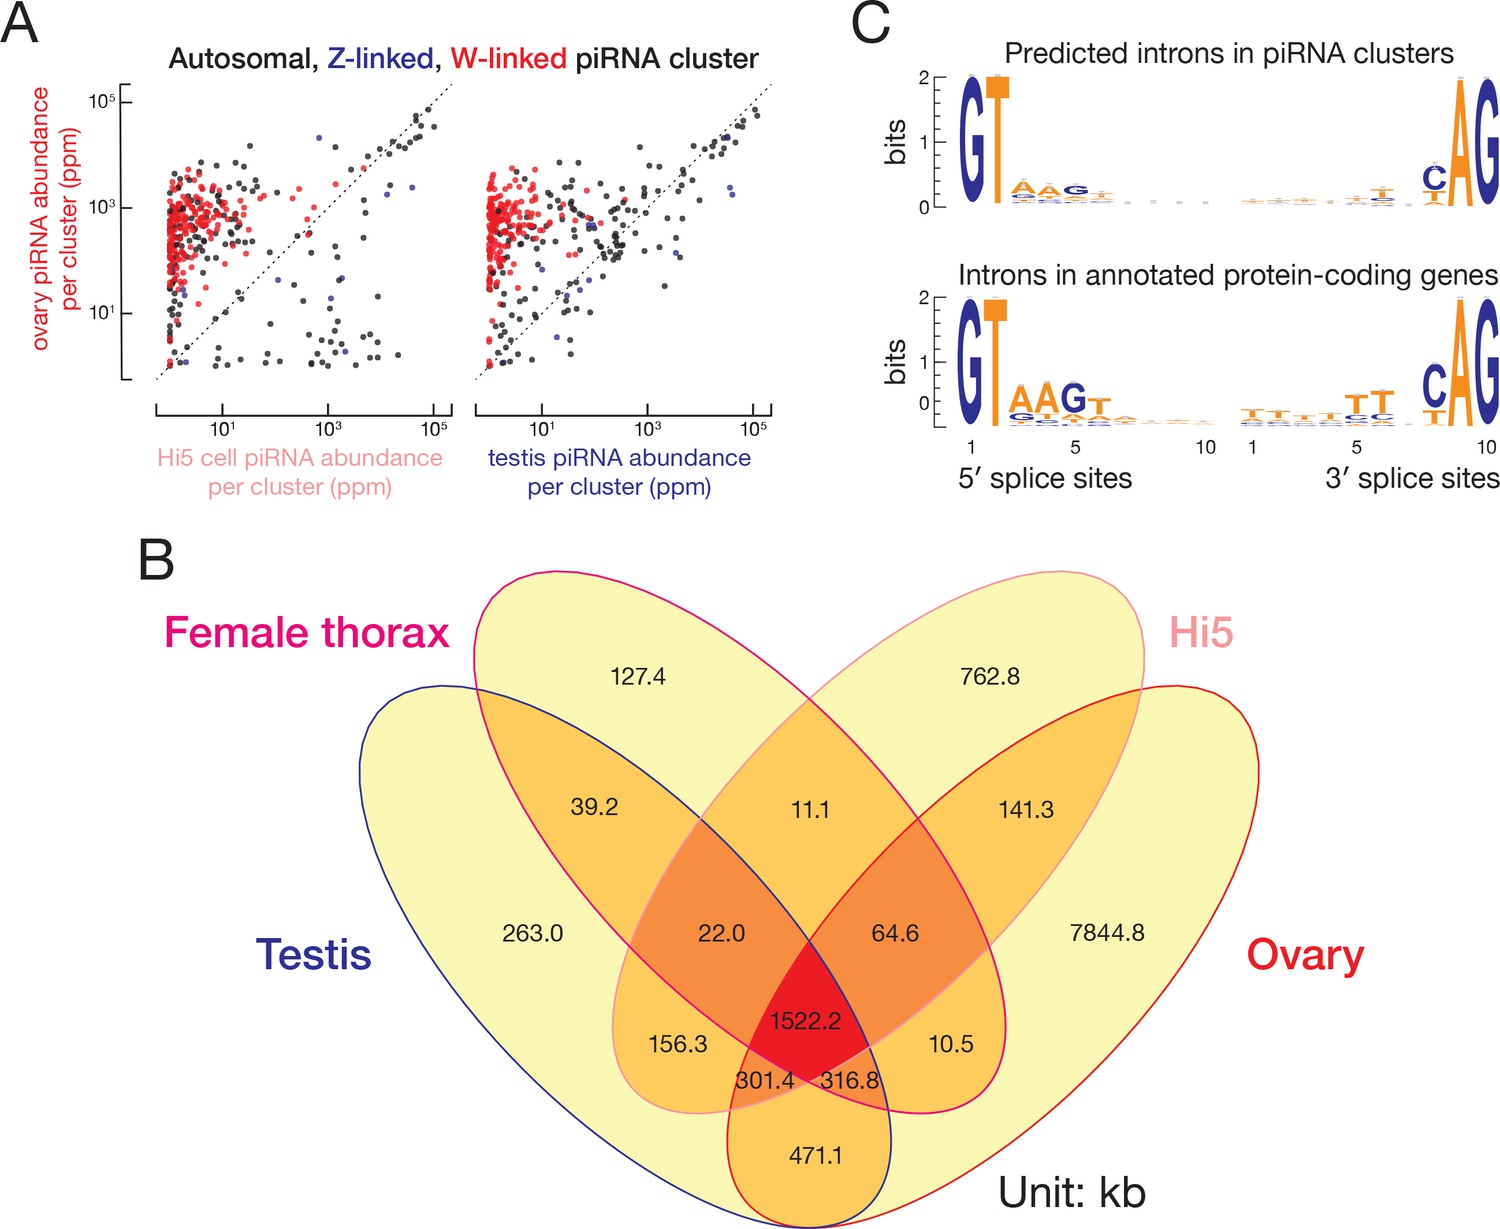
T. ni piRNA clusters.
(A) Comparison of piRNA abundance (ppm) from ovary and Hi5 piRNA-producing loci and from ovary and testis piRNA-producing loci. (B) piRNA cluster lengths in T. ni ovary, testis, thorax, and Hi5 cells. (C) Motifs around intron boundaries of predicted protein-coding gene models within and outside of piRNA clusters.
Figure 7
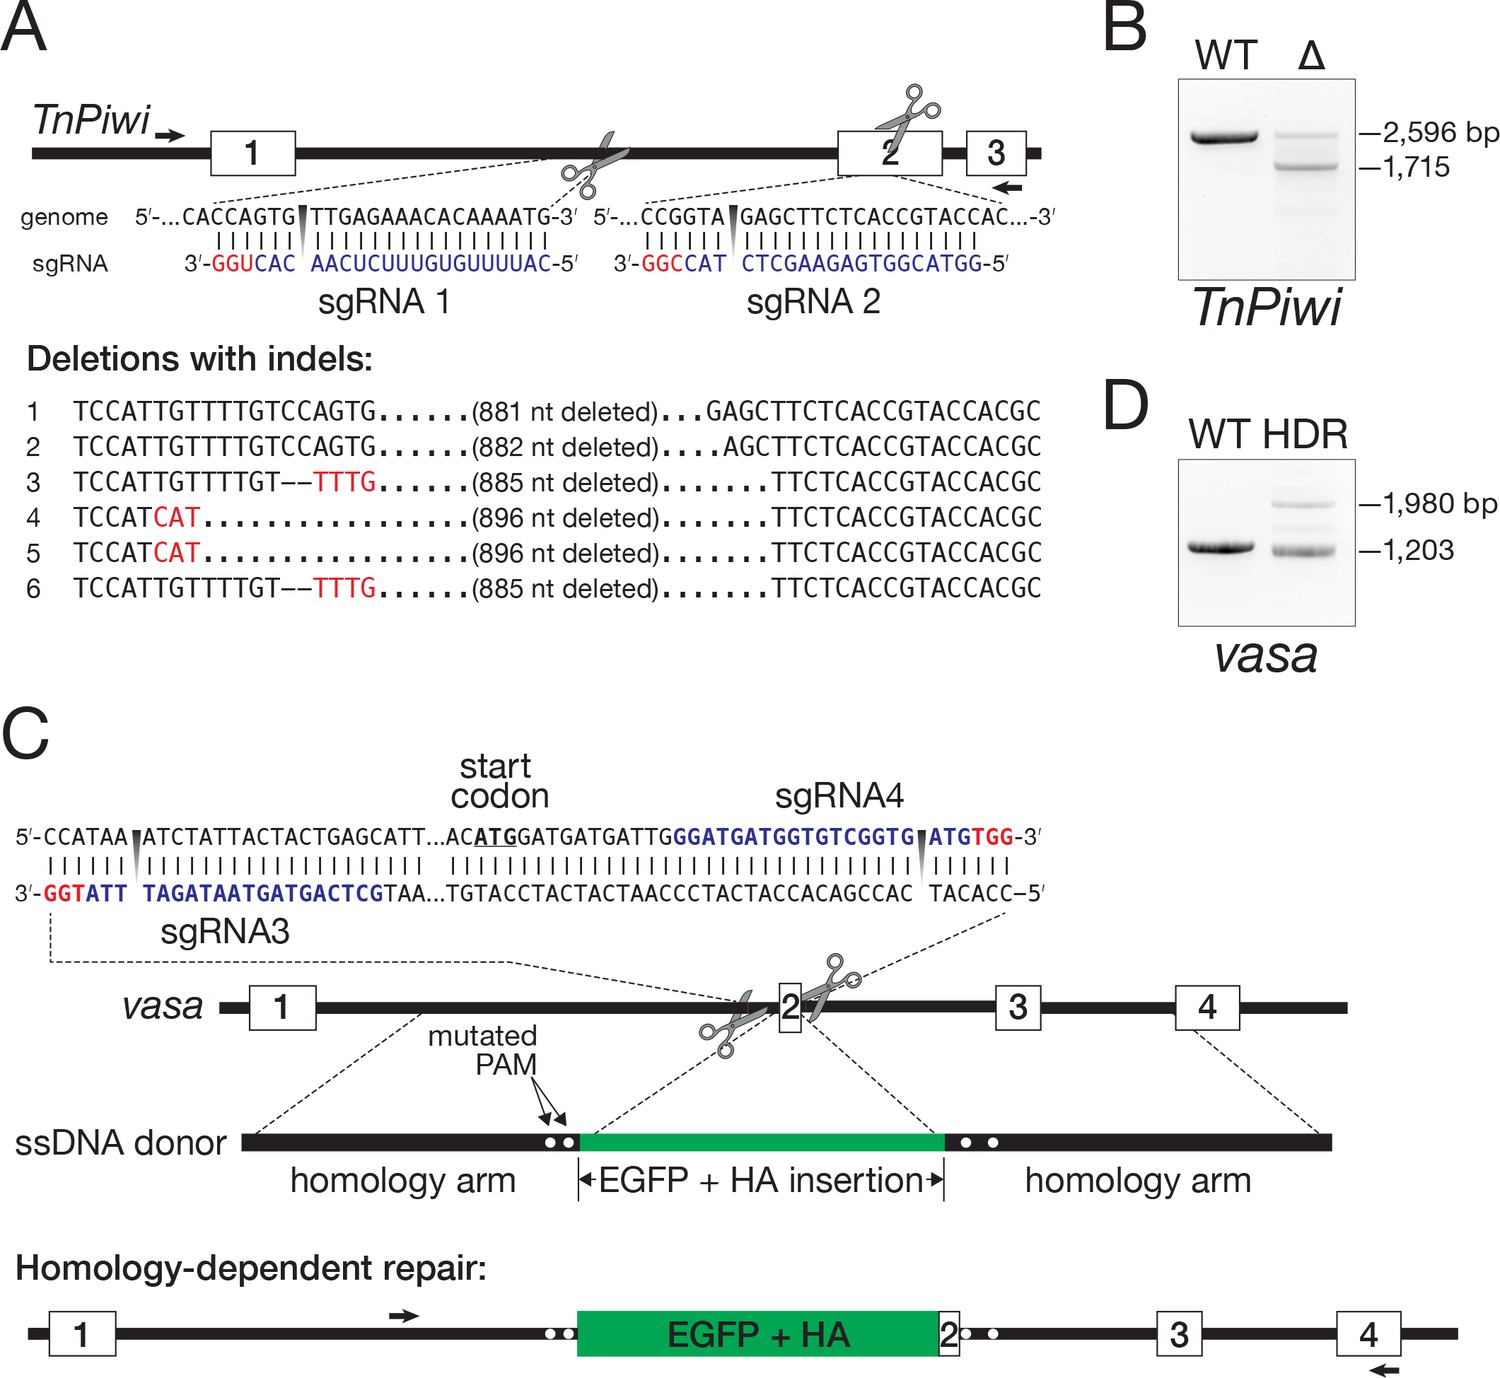
Genome editing in Hi5 cells.
(A) Strategy for using Cas9/sgRNA RNPs to generate a loss-of-function TnPiwi deletion allele. Red, protospacer-adjacent motif (PAM); blue, protospacer sequence. Arrows indicate the diagnostic forward and reverse primers used in PCR to detect genomic deletions (Δ). Sanger sequencing of the ~1700 bp PCR products validated the TnPiwi deletions. (B) An example of PCR analysis of a TnPiwi deletion event. (C) Strategy for using Cas9/sgRNA RNPs and a single-stranded DNA homology donor to insert EGFP and an HA-tag in-frame with the vasa open-reading frame. (D) An example of PCR analysis of a successful HDR event. DNA isolated from wild type (WT) and FACS-sorted, EGFP-expressing Hi5 cells (HDR) were used as templates.
Figure 8
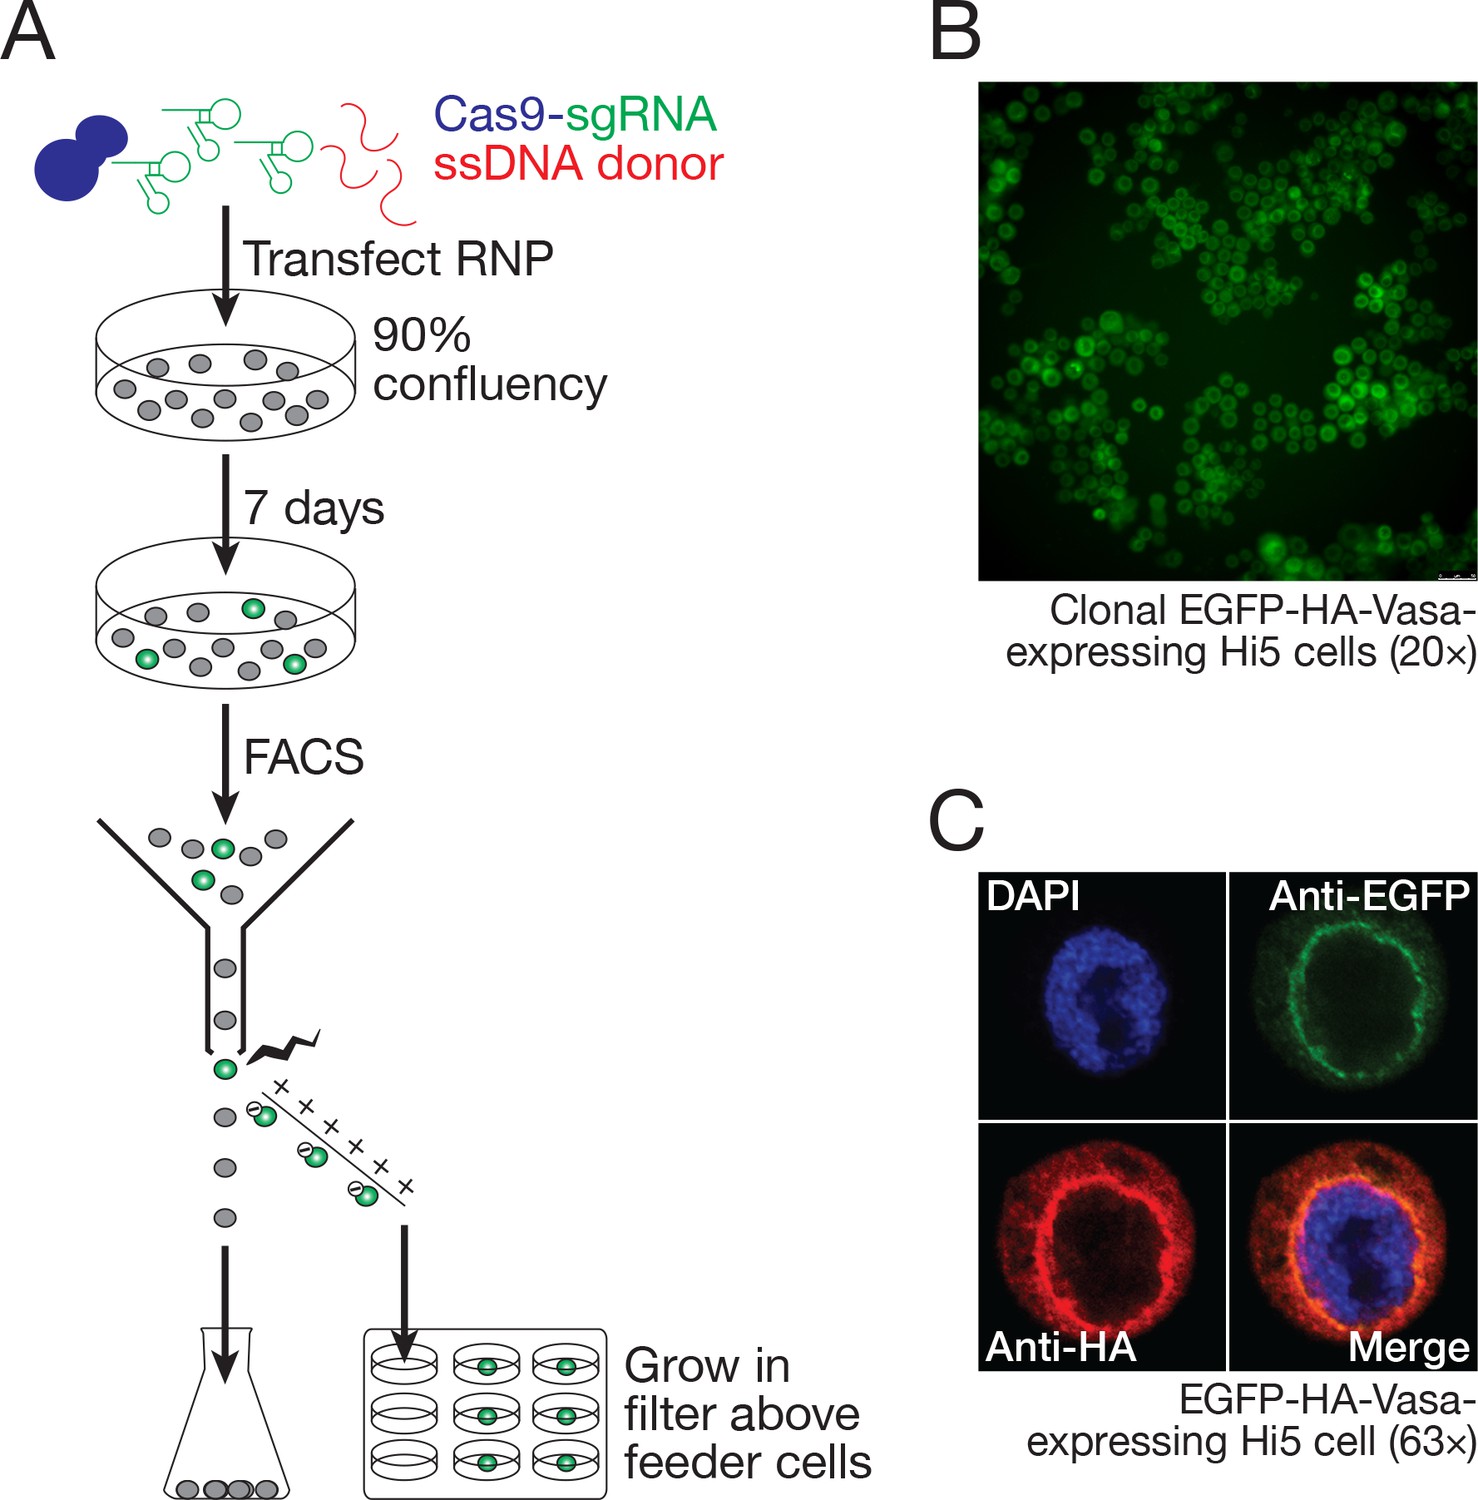
Hi5 cells contain nuage.
(A) Schematic of single-clone selection of genome-edited Hi5 cells using the strategy described in Figure 7C. (B) A representative field of Hi5 cells edited to express EGFP-HA-Vasa from the endogenous locus. (C) A representative image of a fixed, EGFP-HA-Vasa-expressing Hi5 cell stained with DAPI, anti-EGFP and anti-HA antibodies. EGFP and HA staining colocalize in a perinuclear structure consistent with Vasa localizing to nuage.
Tables
Table 1
Genome and gene set statistics for T. ni and B. mori (International Silkworm Genome Consortium, 2008).
Cytochrome P450s, glutathione S-transferases, carboxylesterases, and ATP-binding cassette transporters for B. mori were retrieved from (Yu et al., 2008; Yu et al., 2009; Ai et al., 2011; Liu et al., 2011b).
| T. ni | B. mori | |
|---|---|---|
| Genome metrics | ||
| Genome size (Mb) | 368.2 | 431.7 |
| Chromosome count | 28 | 28 |
| Scaffold N50 (Mb) | 14.2 | 3.7 |
| Contig N50 (kb) | 621.9 | 15.5 |
| Mitochondrial genome (kb) | 15.8 | 15.7 |
| Quality control metrics | ||
| BUSCO complete (%) | 97.5 | 95.5 |
| CRP genes (%) | 100% | 100% |
| OXPHOS genes (%) | 100% | 100% |
| Genomic features | ||
| Repeat content (%) | 20.5% | 43.6% |
| GC content | 35.6% | 37.3% |
| CpG (O/E) | 1.07 | 1.13 |
| Coding (%) | 5.58 | 4.11 |
| Sex chromosomes | ZW | ZW |
| Gene statistics | ||
| Protein-coding genes | 14,043 | 14,623 |
| with Pfam matches | 9295 | 9685 |
| with GO terms | 9790 | 10,148 |
| Cytochrome P450 proteins | 108 | 83 |
| Glutathione S-transferases | 34 | 23 |
| Carboxylesterases | 87 | 76 |
| ATP-binding cassette transporters | 54 | 51 |
| Universal orthologs lost | 156 | 75 |
| Species-specific genes | 3098 | 2313 |
Key resources table
| Reagent type (species) or resource | Designation | Source or reference | Identifiers | Additional information | |||
|---|---|---|---|---|---|---|---|
| gene (Trichoplusia ni) | vasa | this paper | TNI000568 | ||||
| gene (T. ni) | ciwi | this paper | TNI008009 | ||||
| biological sample (T. ni) | Somatic tissue | Benzon Research | male pupa | ||||
| biological sample (T. ni) | Somatic tissue | Benzon Research | female pupa | ||||
| biological sample (T. ni) | Thorax | Benzon Research | male adult | ||||
| biological sample (T. ni) | Testes | Benzon Research | male adult | ||||
| biological sample (T. ni) | Thorax | Benzon Research | female adult | ||||
| biological sample (T. ni) | Ovaries | Benzon Research | female adult | ||||
| cell line (T. ni) | High Five (BTI-TN-5B1-4) | Thermo Fisher | Thermo Fisher: B85502 | wild type cell line | |||
| cell line (T. ni) | EGFP-HA-Vasa | this paper | polyclonal stable cell line | ||||
| cell line (T. ni) | Ciwi-mCherry | this paper | monoclonal stable cell line | ||||
| recombinant protein | EnGen Cas9 NLS | New England Biolabs | New England Biolabs: M0646T | ||||
| antibody | anti-GFP (mouse monoclonal) | Developmental Studies Hybridoma Bank | DSHB: DSHB-GFP-1D2; RRID:AB_2617419 | (1:200) | |||
| antibody | anti-HA (rabbit monoclonal) | Cell Signaling Technology | Cell Signaling Technology: 3724; RRID:AB_1549585 | (1:200) | |||
| antibody | Alexa Fluor 488-labeled donkey anti-mouse | Thermo Fisher | Thermo Fisher: A-21202 | (1:500) | |||
| antibody | Alexa Fluor 680-labeled donkey anti-rabbit | Thermo Fisher | Thermo Fisher: A10043 | (1:500) | |||
| recombinant DNA reagent | EGFP-HA-Vasa (linear dsDNA) | this paper | synthesized gBlock from Integrated DNA technologies | ||||
| sequence based reagents (DNA oligos) | GTTTTAGAGCTAGAAATAGCAAGTTAAAATAAGGCTAGTCCGTTATCAACTTGAAAAAGTGGCACCGAGTCGGTGC | this paper | tracr RNA Core | Used as template for sgRNA in vitro transcription | |||
| sequence based reagents (DNA oligos) | CATTTTGTGTTTCTCAACACTGG | this paper | sgRNA1 | sgRNA target site for ciwi deletion (PAM) | |||
| sequence based reagents (DNA oligos) | GGTACGGTGAGAAGCTCTACCGG | this paper | sgRNA2 | sgRNA target site forciwi deletion (PAM) | |||
| sequence based reagents (DNA oligos) | GCTCAGTAGTAATAGATTTATGG | this paper | sgRNA3 | sgRNA target site for EGFP-HA-vasa mutation (PAM) | |||
| sequence based reagents (DNA oligos) | GGATGATGGTGTCGGTGATGTGG | this paper | sgRNA4 | sgRNA target site for EGFP-HA-vasa mutation (PAM) | |||
| sequence based reagents (DNA oligos) | ATGCTGCAGCTCCGGCGCGTAGG | this paper | sgRNA5 | sgRNA target site for mCherry-ciwi knockout (PAM) | |||
| sequence based reagents (DNA oligos) | TTTTCAATAACCCAAACATATGG | this paper | sgRNA6 | sgRNA target site for mCherry-ciwi knockout (PAM) | |||
| sequence based reagents (DNA oligos) | CtaatacgactcactataGGCATTTTGTGTTTCTCAACACgttttagagct | this paper | T7-sgRNA1 forward primer | Forward primer for sgRNA in vitro transcription template generation | |||
| sequence based reagents (DNA oligos) | CtaatacgactcactataGGGGTACGGTGAGAAGCTCTACgttttagagct | this paper | T7-sgRNA2 forward primer | Forward primer for sgRNA in vitro transcription template generation | |||
| sequence based reagents (DNA oligos) | CtaatacgactcactataGGGCTCAGTAGTAATAGATTTAgttttagagct | this paper | T7-sgRNA3 forward primer | Forward primer for sgRNA in vitro transcription template generation | |||
| sequence based reagents (DNA oligos) | CtaatacgactcactataGGGGATGATGGTGTCGGTGATGgttttagagct | this paper | T7-sgRNA4 forward primer | Forward primer for sgRNA in vitro transcription template generation | |||
| sequence based reagents (DNA oligos) | CtaatacgactcactataGGATGCTGCAGCTCCGGCGCGTgttttagagct | this paper | T7-sgRNA5 forward primer | Forward primer for sgRNA in vitro transcription template generation | |||
| sequence based reagents (DNA oligos) | CtaatacgactcactataGGTTTTCAATAACCCAAACATAgttttagagct | this paper | T7-sgRNA6 forward primer | Forward primer for sgRNA in vitro transcription template generation | |||
| sequence based reagents (DNA oligos) | GCACCGACTCGGTGCCACT | this paper | sgRNA reverse primer | Reverse primer for sgRNA in vitro transcription template generation | |||
| sequence based reagents (DNA oligos) | /Biotin/CGAATCGAAATCTAAGGCAAG | this paper | vasa donor forward | Forward primer for vasa HDR donor amplification | |||
| sequence based reagents (DNA oligos) | ATCTTTGGTGTGAGCTCAAGC | this paper | vasa donor reverse | Reverse primer for vasa HDR donor amplification | |||
| sequence based reagents (DNA oligos) | GCTATTTACCTACACAAACCAATTT | this paper | ciwi deletion forward | Forward primer for ciwi deletion detection | |||
| sequence based reagents (DNA oligos) | ACCACGACGTGATCCA | this paper | ciwi deletion reverse | Reverse primer for ciwi deletion detection | |||
| sequence based reagents (DNA oligos) | TGACTTGTGAATCCTTGGTTAC | this paper | vasa HR forward | Forward primer for vasa HR detection | |||
| sequence based reagents (DNA oligos) | CATTTTCATAATCCCTTGGTTCTC | this paper | vasa HR reverse | Reverse primer for vasa HR detection | |||
| sequence based reagents (DNA oligos) | GCGATAAATTGTTGGAAAC | this paper | GFP-HA-Vasa N-Fw | Forward primer for vasa HR insertion junction sequencing | |||
| sequence based reagents (DNA oligos) | TCATCCATCCCGCTAC | this paper | GFP-HA-Vasa N-Rv | Reverse primer for vasa HR insertion junction sequencing | |||
| sequence based reagents (DNA oligos) | GTTTAGAAACATGgtgagcaagg | this paper | GFP-HA-Vasa C-Fw | Forward primer for vasa HR insertion junction sequencing | |||
| sequence based reagents (DNA oligos) | CATTTTCATAATCCCTTGGTTCTC | this paper | GFP-HA-Vasa C-Rv | Reverse primer for vasa HR insertion junction sequencing | |||
| sequence based reagents (DNA oligos) | GTAAAACGACGGCCAG | this paper | M13 (-20) Fw | Forward primer for colony PCR | |||
| sequence based reagents (DNA oligos) | CAGGAAACAGCTATGAC | this paper | M13 Rv | Reverse primer for colony PCR | |||
| commercial kit | Express Five Serum Free Medium | Thermo Fisher | Thermo Fisher: 10486025 | Supplemented with 16mM L-Glutamine | |||
| commercial kit | NextSeq 500/550 High Output v2 kit (150 cycles) | Illumina | Illumina: FC-404-2005 | ||||
| commercial kit | NextSeq 500/550 High Output v2 kit (75 cycles) | Illumina | Illumina: FC-404-2002 | ||||
| commercial kit | Nextera Mate Pair Sample Prep Kit | Illumina | Illumina: FC-132-1001 | ||||
| commercial kit | TruSeq DNA LT Sample Prep Kit | Illumina | Illumina: FC-121-2001 | ||||
| commercial kit | Qubit dsDNA HS Assay kit | Thermo Fisher | Thermo Fisher: Q32851 | ||||
| commercial kit | SMRTbell Template Prep Kit 1.0 SPv3 | Pacific Biosciences | Pacific Biosciences: 100-991-900 | ||||
| commercial kit | ProLong Gold Antifade Mountant with DAPI | Thermo Fisher | Thermo Fisher: P36931 | ||||
| commercial kit | MirVana miRNA isolation kit | Thermo Fisher | Thermo Fisher: AM1561 | ||||
| commercial kit | Ribo-Zero Gold kit (Human/Mouse/Rat) | Epicentre | epicentre: MRZG12324 | ||||
| commercial kit | Trans-IT insect transfection reagent | Mirus Bio | Mirus Bio:MIR 6104 | ||||
| commercial kit | QIAquick Gel Extraction Kit | QIAGEN | QIAGEN:28704 | ||||
| commercial kit | Zero Blunt TOPO PCR Cloning Kit | Thermo Fisher | Thermo Fisher: K280020 | ||||
| commercial kit | M-280 streptavidin Dynabeads | Thermo Fisher | Thermo Fisher: 11205D | ||||
| software | online CRISPR design tool | http://crispr.mit.edu/ | PMID: 23873081 | ||||
| chemical compound | proteinase K | Sigma Aldrich | Sigma Aldrich: RPROTK-RO | ||||
| chemical compound | phenol:chloroform:isoamyl alcohol | Sigma Aldrich | Sigma Aldrich: P2069 | ||||
| chemical compound | RNase A | Sigma Aldrich | Sigma Aldrich: R4642 | ||||
| chemical compound | KaryoMAX Colcemid Solution in PBS | Life Technologies | Life Technologies: 15212012 | ||||
| chemical compound | Triton X-100 | Thermo Fisher | Thermo Fisher: NC1365296 | ||||
| chemical compound | PBS | Life Technologies | Life Technologies: 10010049 | ||||
| chemical compound | 16% formaldehyde | Thermo Fisher | Thermo Fisher: 28908 | ||||
| chemical compound | Photoflo 200 | Detek Inc | Detek Inc: 1464510 | ||||
| other | 22 x 22 mm cover slips | Thermo Fisher | Thermo Fisher:12541B | ||||
| other | 6-well plate | Corning | Corning: 351146 | ||||
| other | Transwell 96-well Receiver | Corning Life Sciences Plastic | Corning Life Sciences Plastic: 3382 | ||||
| Software | Canu v1.3 | doi:10.1101/gr.215087.116 | |||||
| Software | LACHESIS | doi:10.1038/nbt.2727 | |||||
| Software | BUSCO v3 | doi:10.1093/bioinformatics/btv351 | |||||
| Software | piPipes | doi:10.1093/bioinformatics/btu647 | |||||
| Software | MAKER | 10.1101/gr.6743907 | |||||
Additional files
-
Supplementary file 1
T. ni genome statistics.
(A) BUSCO assessments of T. ni and six other genomes. (B) CRP genes. (C) Genes in the OXPHOS pathway. (D) Genome comparisons. Genomes assembled using paired-end DNA-seq data from male and female T. ni pupae are compared with the Hi5 genome as the reference. The dot plots show genome alignments for contigs ≥ 1 kb. (E) Numbers of genes in lepidopteran genomes. (F) Positions of telomeric repeats: position of (TTAGG)n longer than 100 nt. (G) Transposons in T. ni subtelomeric regions. (H) Repeat statistics for the T. ni genome. (I) Transposon family divergence rates. (J) Manual curation of W-linked protein-coding genes and miRNAs.
- https://doi.org/10.7554/eLife.31628.022
-
Supplementary file 2
Genes encoding small RNA pathway proteins.
(A) Genes encoding miRNA and siRNA pathway proteins. (B) Genes encoding piRNA pathway proteins (grouped by sequence orthology).
- https://doi.org/10.7554/eLife.31628.023
-
Supplementary file 3
T. ni miRNAs, siRNAs and piRNAs.
(A) miRNA annotation. (B) Mapping statistics for endogenous siRNAs in T. ni and D. melanogaster. (C) piRNA cluster lengths. piRNA cluster coordinates in Hi5 (D), ovary (E), testis (F), female thorax (G), and male thorax (H).
- https://doi.org/10.7554/eLife.31628.024
-
Supplementary file 4
mirDeep2 output for T. ni miRNAs
- https://doi.org/10.7554/eLife.31628.025
-
Supplementary file 5
Genomes used in this study.
- https://doi.org/10.7554/eLife.31628.026
-
Supplementary file 6
T. ni detoxification-related genes.
(A) P450 gene counts by clade in T. ni and B. mori. (B) Sequences of P450 proteins. (C) Sequences of glutathione-S-transferase proteins. (D) Carboxylesterase gene counts by clade in T. ni and B. mori. (E) Sequences of carboxylesterase proteins. (F) ATP-binding cassette transporter gene counts by clade in T. ni and B. mori. (G) Sequences of ATP-binding cassette transporter proteins.
- https://doi.org/10.7554/eLife.31628.027
-
Supplementary file 7
T. ni chemoreception genes.
(A) Sequences of olfactory receptor proteins. (B) Sequences of gustatory receptor proteins. (C) Sequences of ionotropic receptor proteins.
- https://doi.org/10.7554/eLife.31628.028
-
Supplementary file 8
Genes in the juvenile hormone biosynthesis and degradation pathways.
- https://doi.org/10.7554/eLife.31628.029
-
Supplementary file 9
Genome-modified sequences.
- https://doi.org/10.7554/eLife.31628.030
-
Supplementary file 10
Single-stranded DNA donor purification
- https://doi.org/10.7554/eLife.31628.031
-
Transparent reporting form
- https://doi.org/10.7554/eLife.31628.032
Download links
A two-part list of links to download the article, or parts of the article, in various formats.
Downloads (link to download the article as PDF)
Open citations (links to open the citations from this article in various online reference manager services)
Cite this article (links to download the citations from this article in formats compatible with various reference manager tools)
The genome of the Hi5 germ cell line from Trichoplusia ni, an agricultural pest and novel model for small RNA biology
eLife 7:e31628.
https://doi.org/10.7554/eLife.31628


