Shade-induced nuclear localization of PIF7 is regulated by phosphorylation and 14-3-3 proteins in Arabidopsis
- Fudan University, China
Figures
Figure 1 with 1 supplement
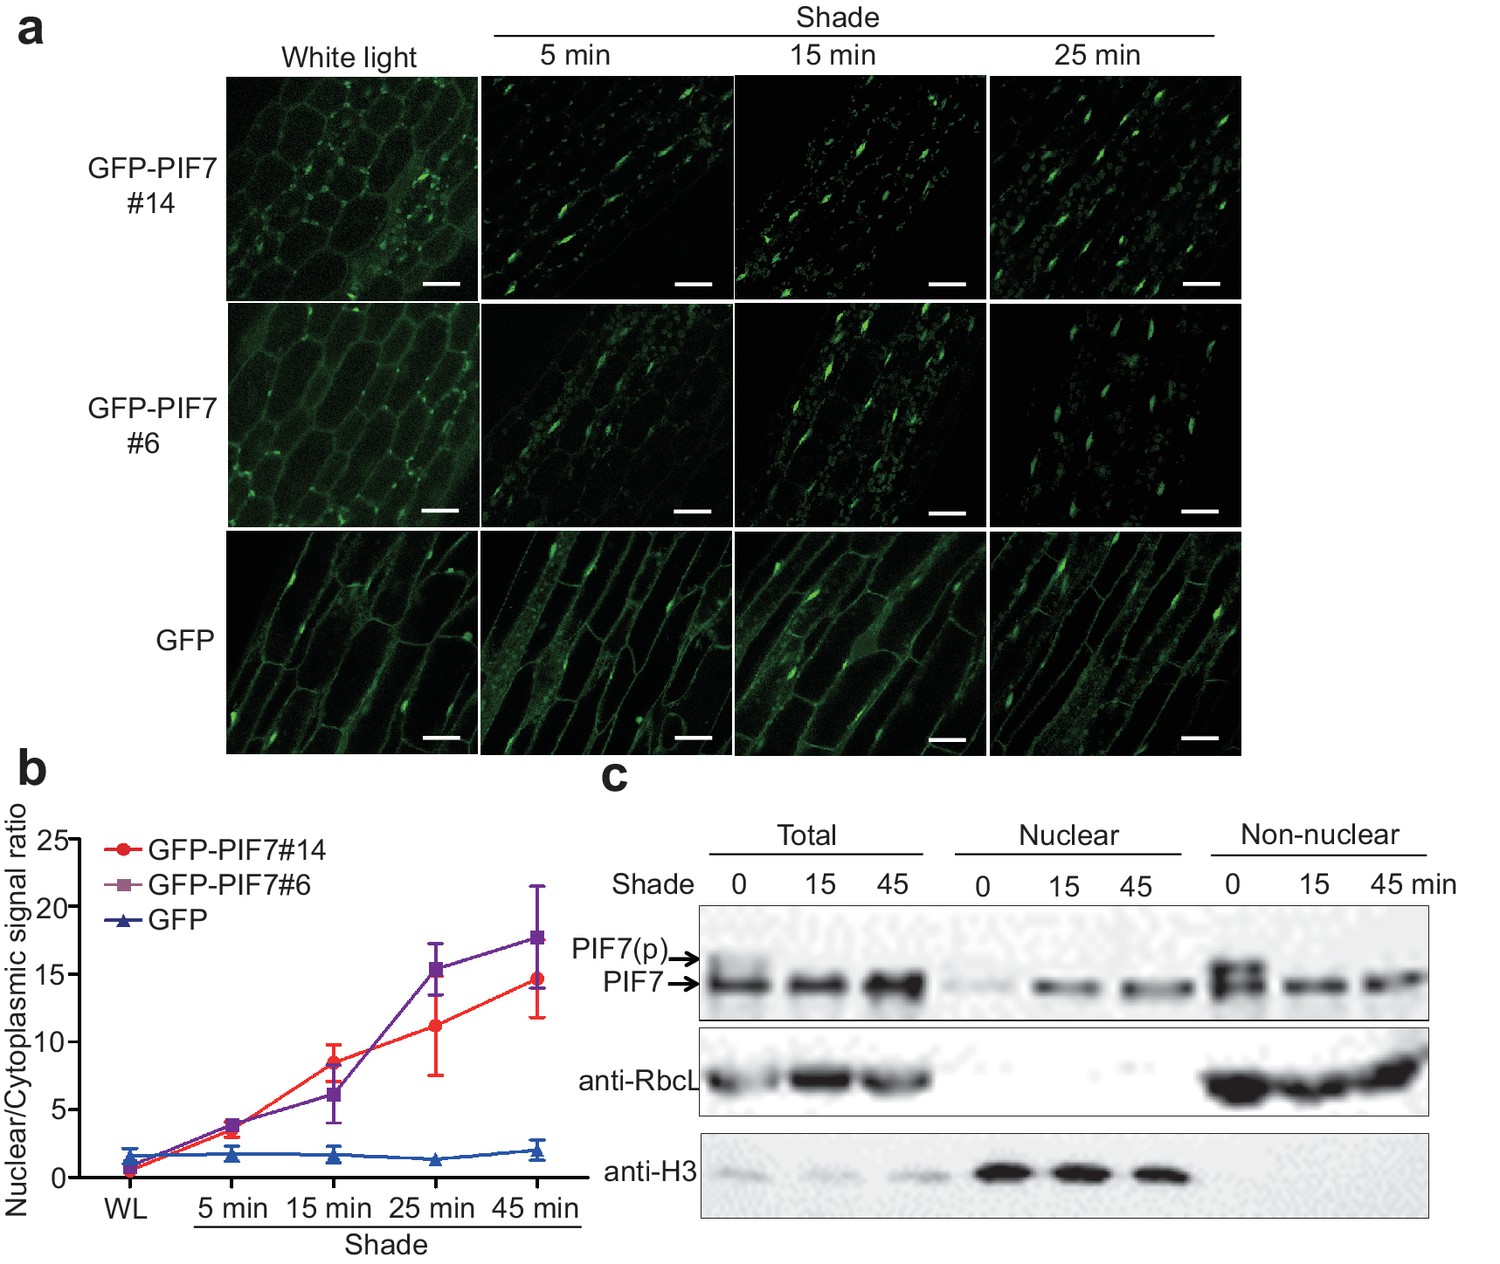
Shade induces the nuclear localization of PIF7.
(a) Subcellular localization of GFP-PIF7 at the top of the hypocotyls of two independent transgenic seedlings grown under white light at different time points after transfer to shade. Transgenic Arabidopsis expressing GFP-PIF7 or GFP was grown on 1/2 MS medium under white light for 5 days. Seedlings were treated with shade for 5, 15, or 25 min, and images of the GFP signal were obtained using confocal microscopy. White scale bar represents 25 μm. (b) Kinetics of the shade-induced nuclear accumulation of GFP-PIF7. GFP-PIF7 or GFP seedlings were treated as in (a). ImageJ was used to quantify the fluorescence intensities. Ratios of the nuclear and cytoplasmic signal intensities were calculated from 10 cells for each treatment. Error bars represent standard deviations. (c) Shade induces the nuclear localization of dephosphorylated PIF7. Immunoblot of the PIF7-Flash proteins using anti-Myc antibody in the total, nuclear and non-nuclear fractions from white-light- and shade-treated seedlings. Histone H3 is a nuclear marker, and the RuBisCO large subunit (RbcL), a chloroplast protein, is a non-nuclear fraction marker.
-
Figure 1—source data 1
Source files for the ratios of the nuclear and cytoplasmic signal intensities in Figure 1b.
- https://doi.org/10.7554/eLife.31636.004
Figure 1—figure supplement 1
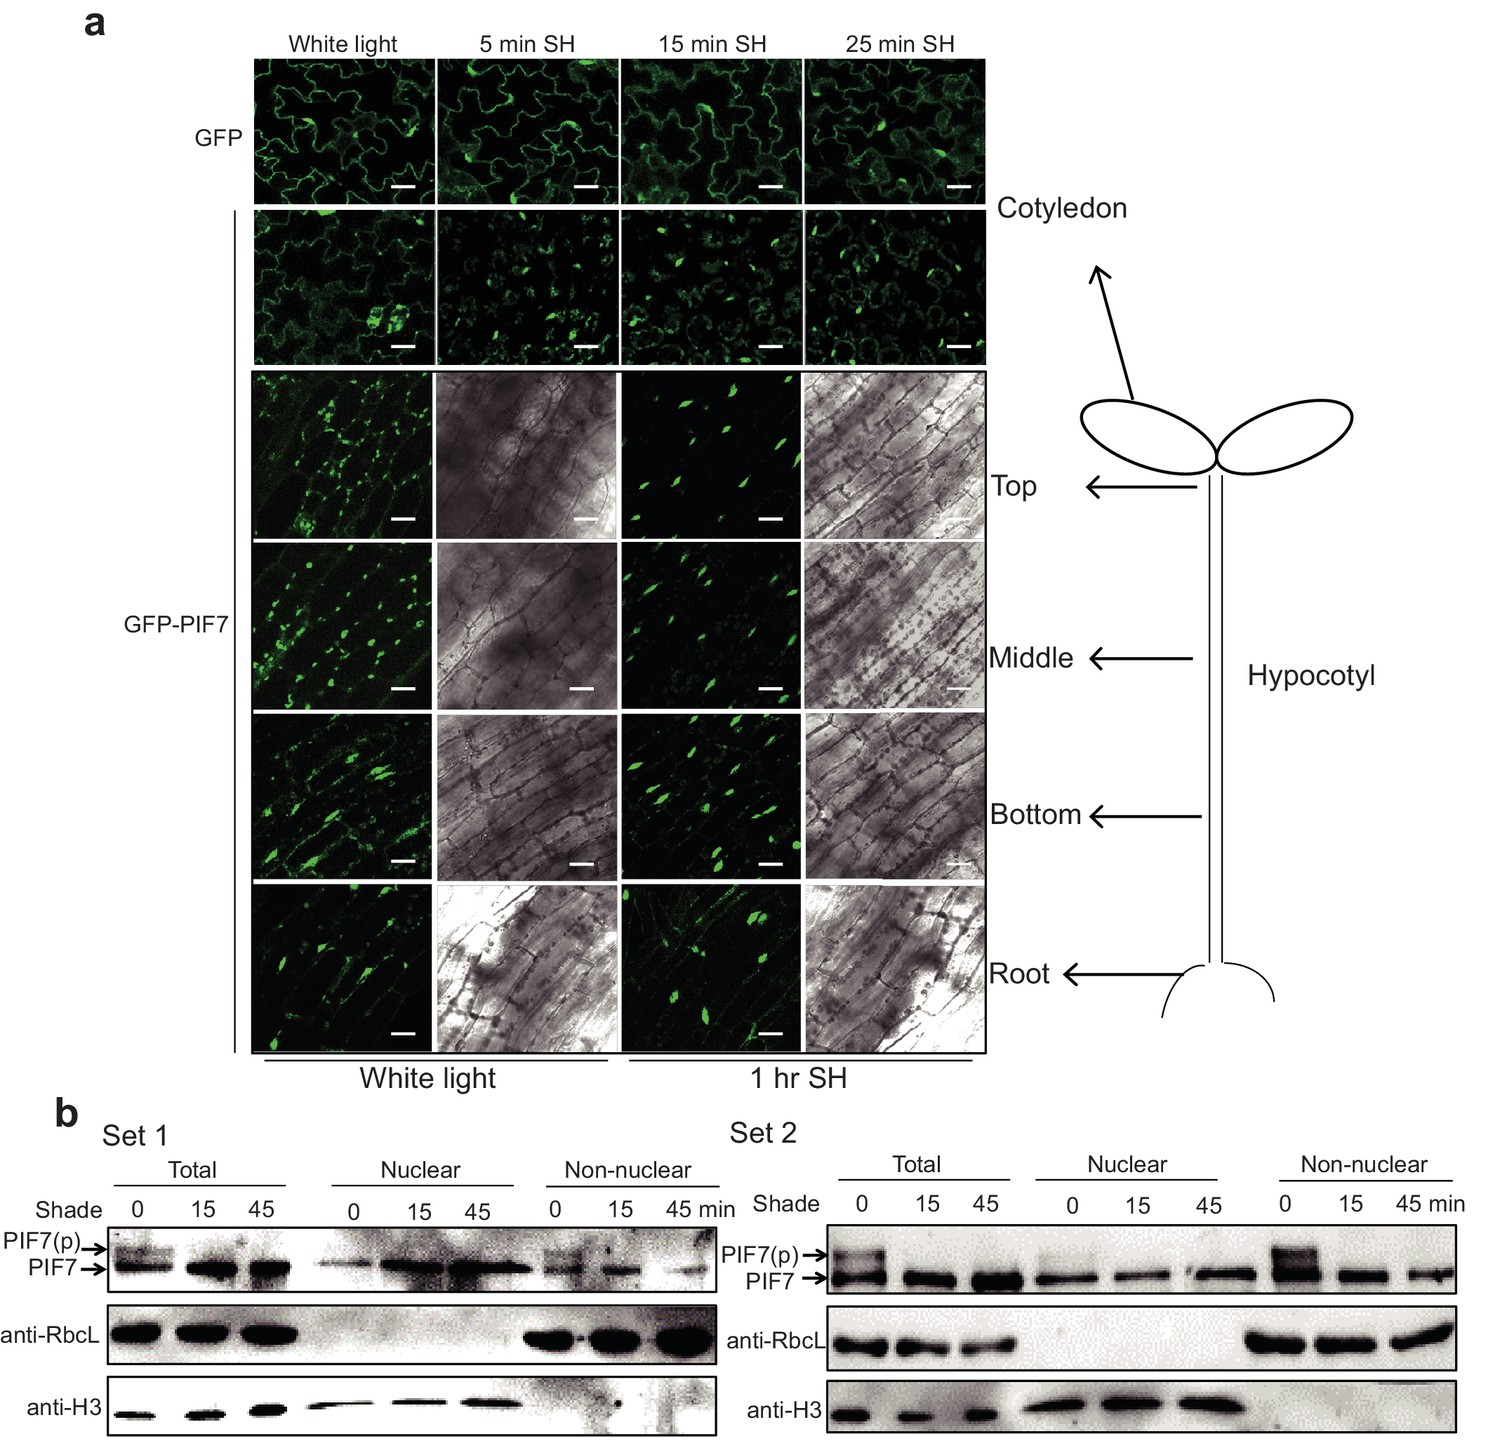
Shade induces the nuclear localization of PIF7 in the hypocotyl and cotyledon.
(a) Subcellular localization of GFP-PIF7 in the cotyledon, the top, middle and bottom portions of the hypocotyls, and the root of transgenic seedlings grown under white light or transferred to shade for the indicated periods. White scale bar represents 25 μm. (b) Immunoblots show that shade induces the nuclear localization of dephosphorylated PIF7. Immunoblot of PIF7-Flash proteins using anti-Myc antibody in the total, nuclear and non-nuclear fractions from white-light- and shade-treated seedlings. The same amount of the sample was loaded in the different gels for detections using different antibodies.
Figure 2 with 1 supplement

PIF7 interacts with 14-3-3 proteins.
(a) PIF7 interacts with 14-3-3 λ and 14-3-3 κ in a yeast two-hybrid assay. Each yeast clone containing pGADT7 (AD) or pGADT7-PIF7 (AD-PIF7), together with pGBKT7 (BD), pGBKT7-14-3-3 λ (BD-14-3-3 λ) or pGBKT7-14-3-3 κ (BD-14-3-3 κ), was grown on transformation selection (SD-L-T) or interaction selection (SD-L-T-H+3AT) plates. Dilution of the inoculation is shown at the top of the picture. Yeast growth on SD-L-T-H+3AT indicates a positive protein–protein interaction. (b) Interaction between PIF7 and 14-3-3 λ or 14-3-3 κ as detected by BiFC. The C-terminal half of yellow fluorescent protein (YFP) was fused to 14-3-3 λ or 14-3-3 κ and the N-terminal half of YFP was fused to PIF7. The constructs were co-transformed into tobacco leaf cells, and fluorescence images were obtained by confocal microscopy. White scale bar represents 75 μm. (c) Interaction between PIF7 and 14-3-3 λ or 14-3-3 κ as detected by semi-in vivo pull-down assay. 14-3-3 λ and 14-3-3 κ fused to GST were expressed and purified from Escherichia coli. Protein extracts from plants that overexpressed PIF7-Flash, grown under white light conditions or after 1 hr of shade, were used for the pull-down assay. Immunoblots of the PIF7-Flash proteins used anti-Myc antibody. CBB: Coomassie Brilliant Blue stain. (d) Interaction between PIF7 and 14-3-3s as detected by co-immunoprecipitation. Anti-FLAG M2 agarose beads were used to precipitate PIF7-Flash from PIF7 overexpression plants grown under white light or after 1 hr of shade. Western blots using anti-Myc and anti-14-3-3s antibodies were performed as indicated in the 'Materials and methods'.
Figure 2—figure supplement 1
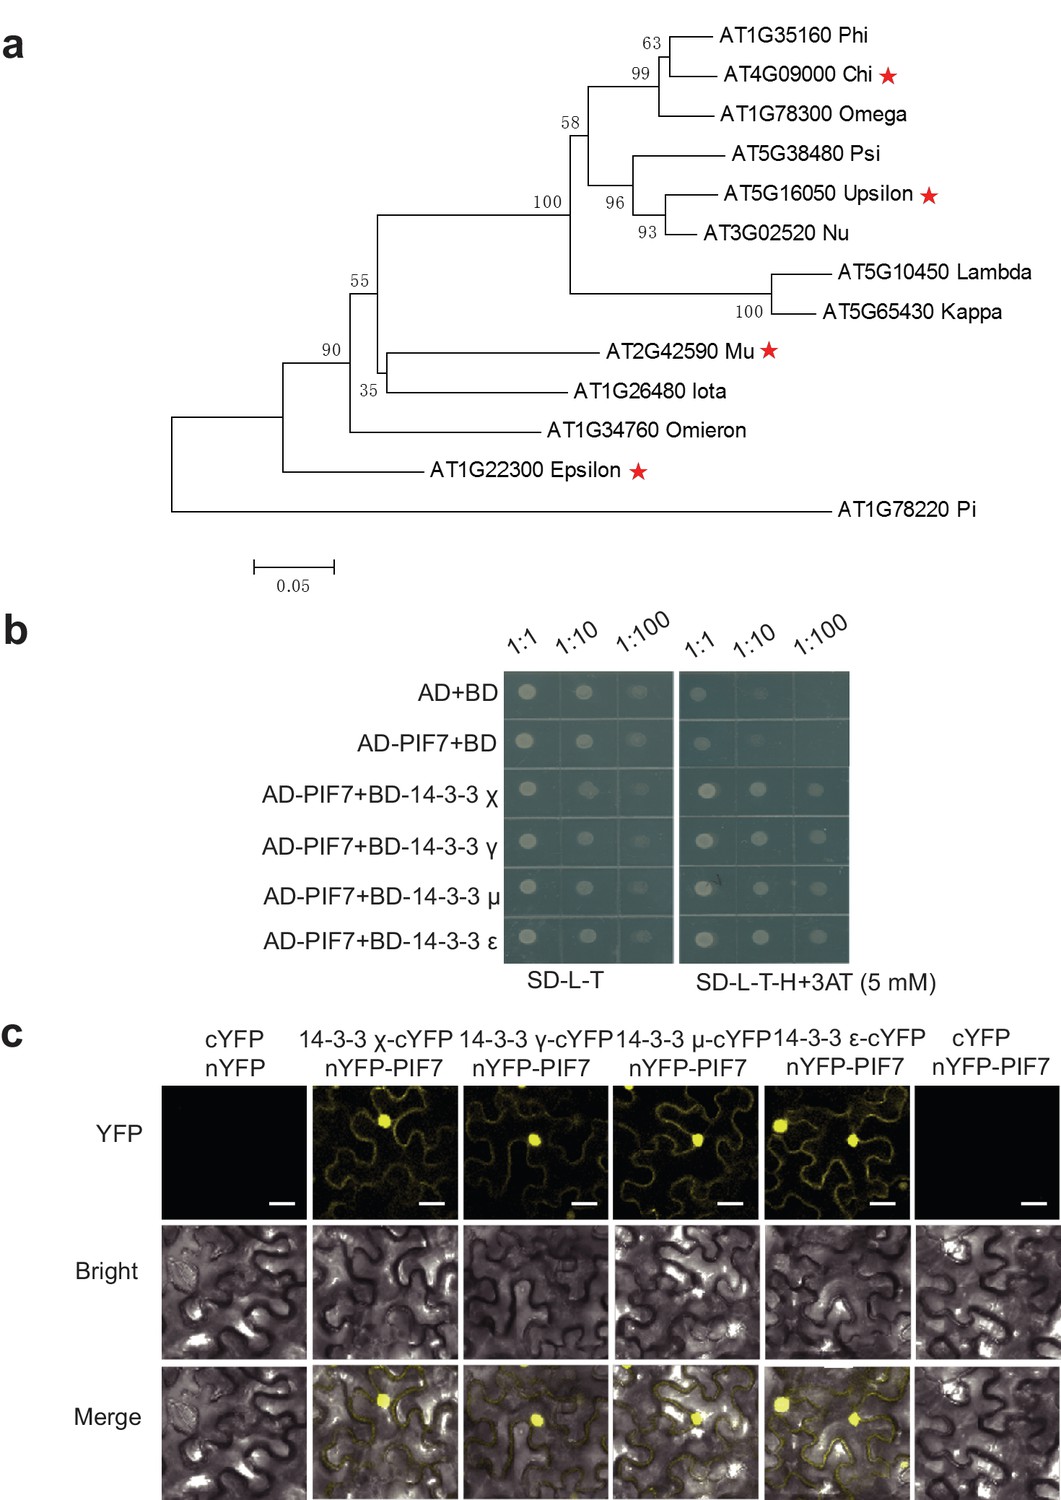
PIF7 can interact with 14-3-3 χ, γ, μ and ε proteins.
(a) Phylogenic tree of 14-3-3 proteins in Arabidopsis. The tree was generated using predicted full-length amino acid sequences and neighbor-joining in MEGA5. The numbers on the nodes indicate the confidence values when 1000 replications were used. The positions of 14-3-3 χ, γ, μ and ε are marked by red stars. (b) PIF7 interacts with 14-3-3 χ, γ, μ and ε in a yeast two-hybrid assay. Each yeast clone containing the pGADT7 (AD) or pGADT7-PIF7 (AD-PIF7), together with pGBKT7 (BD) or pGBKT7-14-3-3 χ, γ, μ or ε (BD-14-3-3 χ, γ, μ or ε), was grown on transformation selection (SD-L-T) or interaction selection (SD-L-T-H+3AT) plates. Dilution of the inoculation is shown at the top of the picture. (c) Interaction between PIF7 and 14-3-3 χ, γ, μ or ε detected by BiFC. The C-terminal half of YFP was fused to 14-3-3 χ, γ, μ or ε and N-terminal half of YFP was fused to PIF7. The constructs were co-transformed into tobacco leaf cells, and fluorescence images were obtained by confocal microscopy. White scale bar represents 75 μm.
Figure 3 with 3 supplements
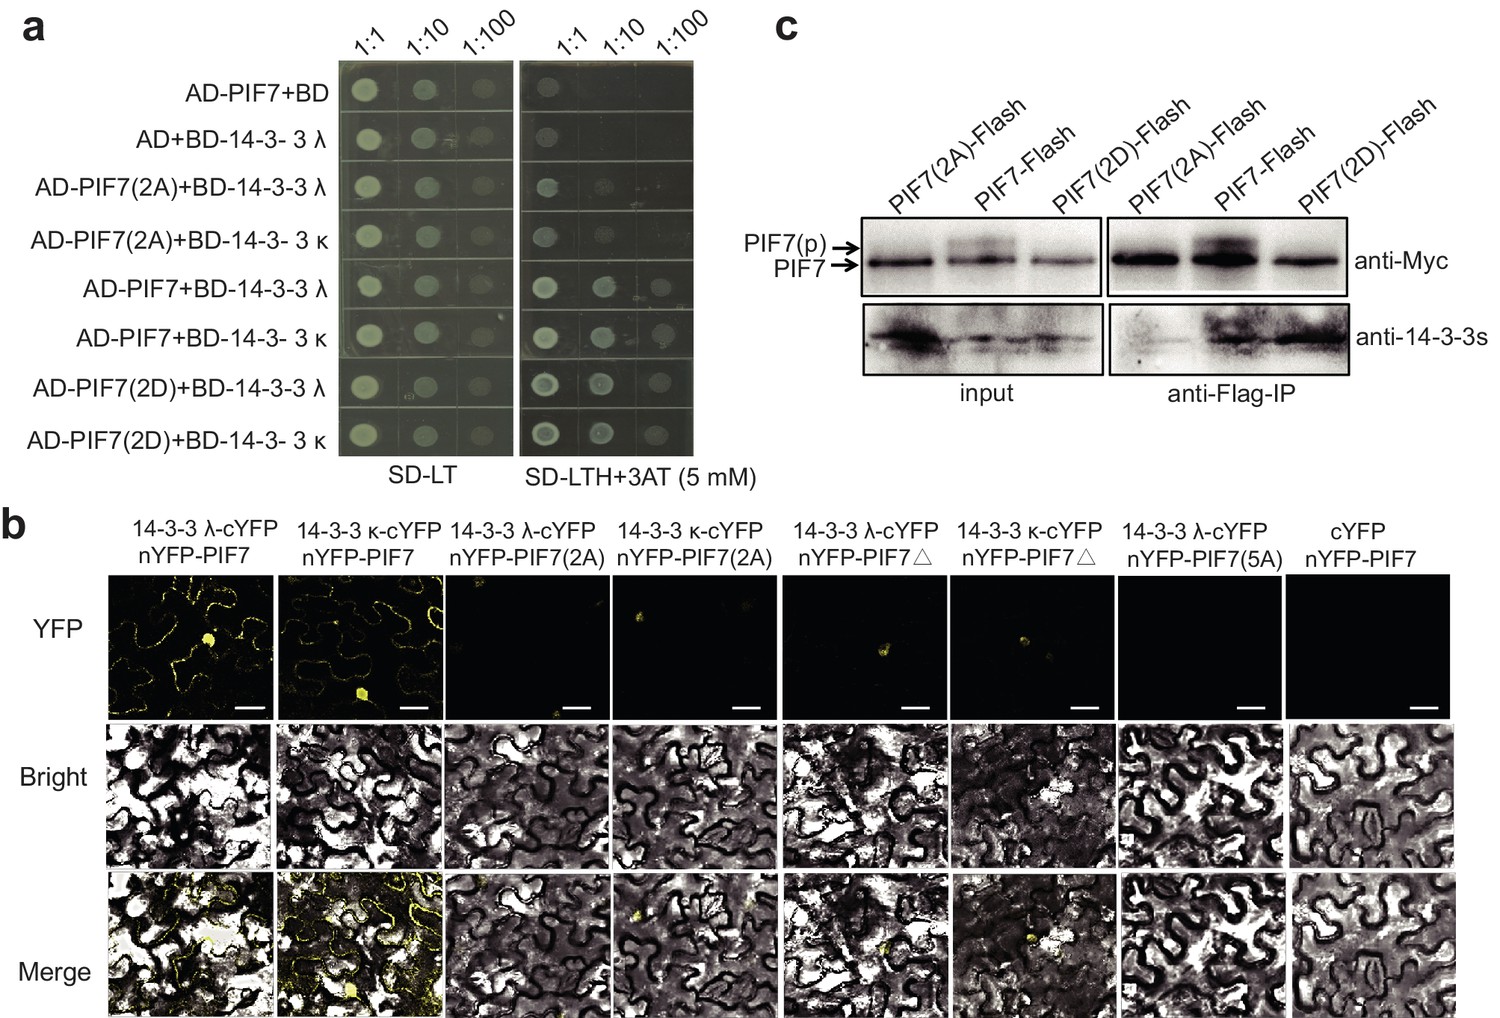
Interactions between PIF7 derivatives and 14-3-3 proteins.
(a) Interactions between PIF7, PIF7(2A) or PIF7(2D) and 14-3-3 λ or 14-3-3 κ in a yeast two-hybrid assay. Each yeast clone containing the pGADT7 (AD), or AD-PIF7 (2A), or AD-PIF7 or AD-PIF7 (2D) together with pGBKT7 (BD) or BD-14-3-3 λ or BD-14-3-3 κ was grown on transformation selection (SD-L-T) or interaction selection (SD-L-T-H+3AT) plates. Dilution of the inoculation is shown at the top of the picture. Yeast growth on SD-L-T-H+3AT indicates a positive protein–protein interaction. (b) Interaction between PIF7 derivatives and 14-3-3 λ or 14-3-3 κ detected by BiFC. nYFP-PIF7, nYFP-PIF7(2A), nYFP-PIF7△ or nYFP-PIF7(5A) and 14-3-3 λ-cYFP or 14-3-3 κ-cYFP constructs were co-transformed into tobacco leaf cells. YFP fluorescence images were obtained using a confocal microscope. White scale bar represents 75 μm. (c) Interaction between PIF7, PIF7(2A) or PIF7(2D) and 14-3-3s as detected by co-immunoprecipitation. Anti-FLAG M2 agarose beads were used to precipitate PIF7-Flash, PIF7(2A)-Flash or PIF7(2D)-Flash from overexpression plants grown under white light. Western blots were performed using anti-Myc and anti-14-3-3s antibodies as indicated in the 'Materials and methods'.
Figure 3—figure supplement 1
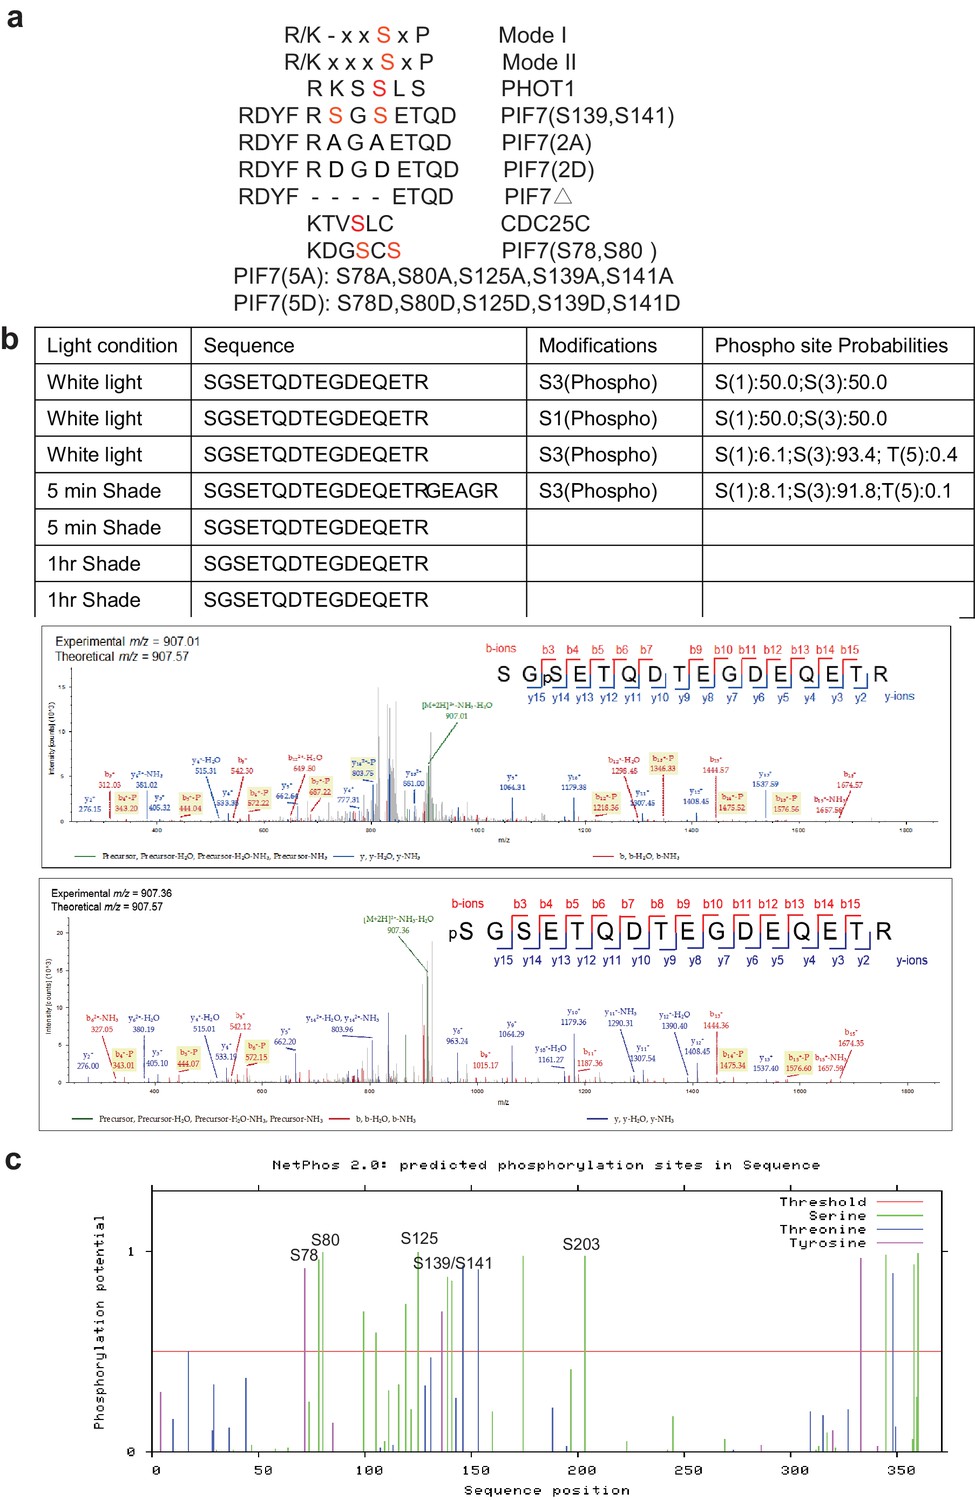
Potential phosphorylation sites on PIF7.
(a) Two known 14-3-3 binding sequences (mode I and mode II) and putative 14-3-3 binding sequences in PIF7, PHOT1 and CDC25C are listed. The consensus phosphorylation sites are labeled in red. S139 and S141 of PIF7 were identified by LC-MS/MS from PIF7 immunoprecipitated proteins isolated from transgenic plants overexpressing PIF7-Flash. S78 and S80 of PIF7 were predicted as phosphorylation sites by NetPhos 2.0. (b) Identification of PIF7 phosphorylation sites from an LC-MS/MS experiment using immunoprecipitated PIF7 proteins isolated from 35S::PIF7-Flash transgenic plants. The light treatment of the samples, the sequence of the mapped peptide, the modifications of the peptide, and the probability for each site are presented in the table. The peptide with phosphorylated modifications was identified by mass spectrometry. (c) Phosphorylation sites of PIF7 as predicted by NetPhos 2.0 (http://www.cbs.dtu.dk/services/NetPhos/).
Figure 3—figure supplement 2
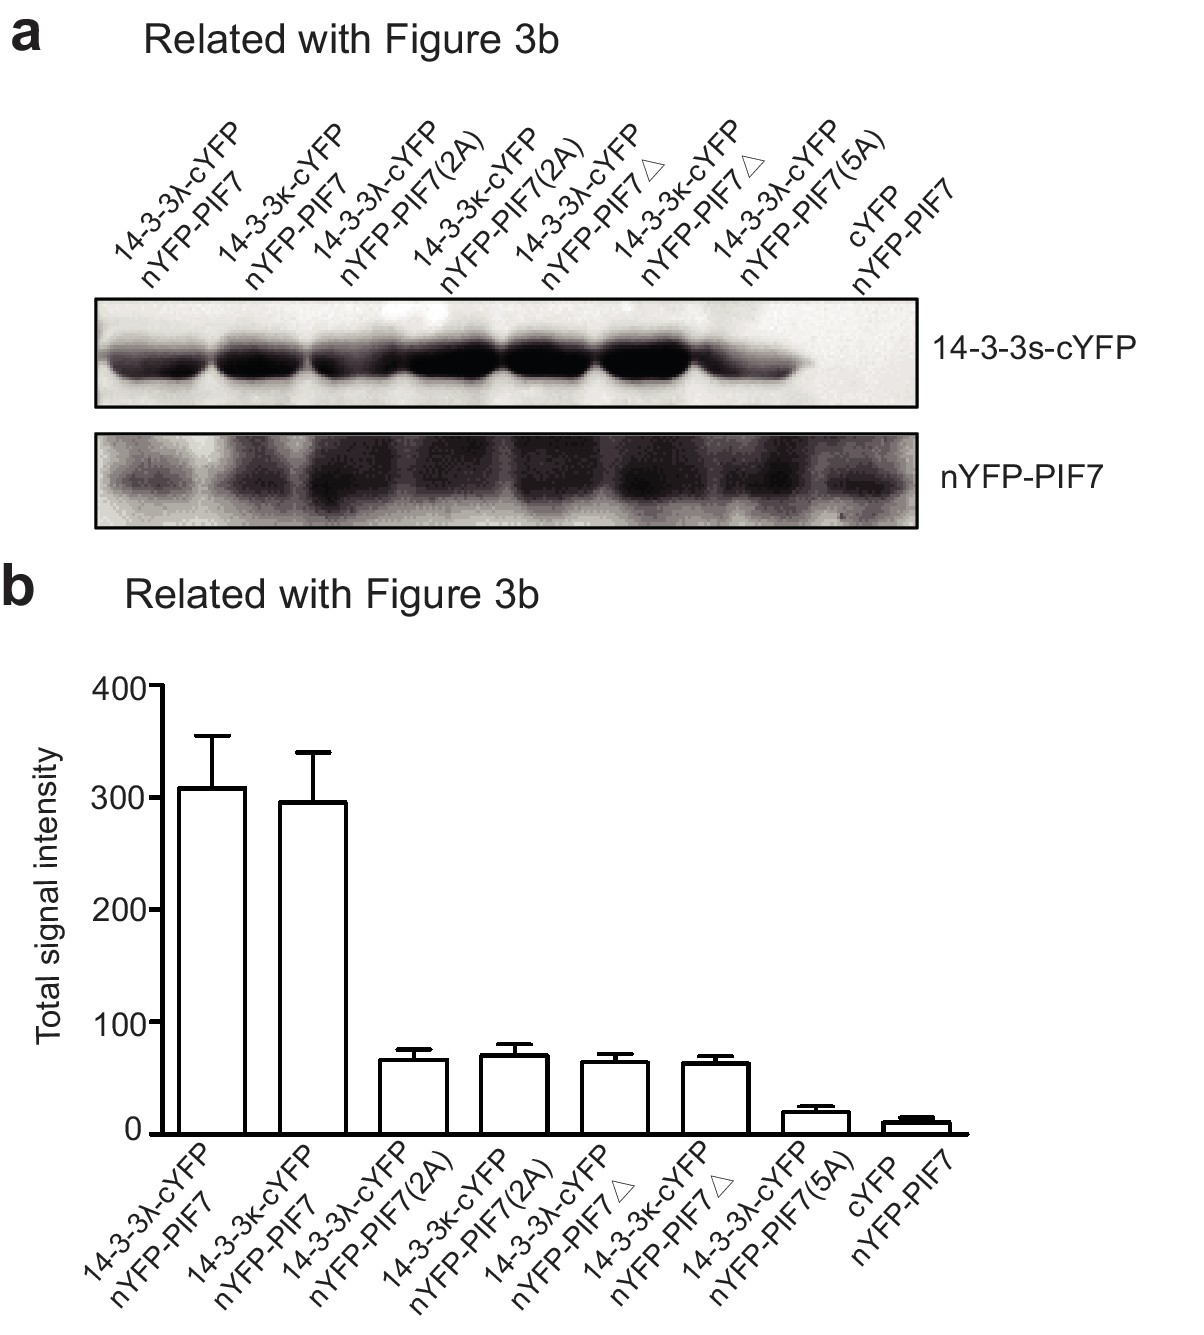
Expression of 14-3-3 proteins and PIF7, and quantification of YFP signals in Figure 3b.
(a) Anti-GFP antibody from Covance (MMS-118P-200G) was used to detect the nYFP-tagged protein. Anti-14-3-3 antibody from Agrisera (AS12 2119) was used to detect 14-3-3 λ-cYFP. The tobacco leaves were collected for western blotting 36 hr after infiltration. (b) Quantification of the YFP signals in Figure 3b.
Figure 3—figure supplement 3
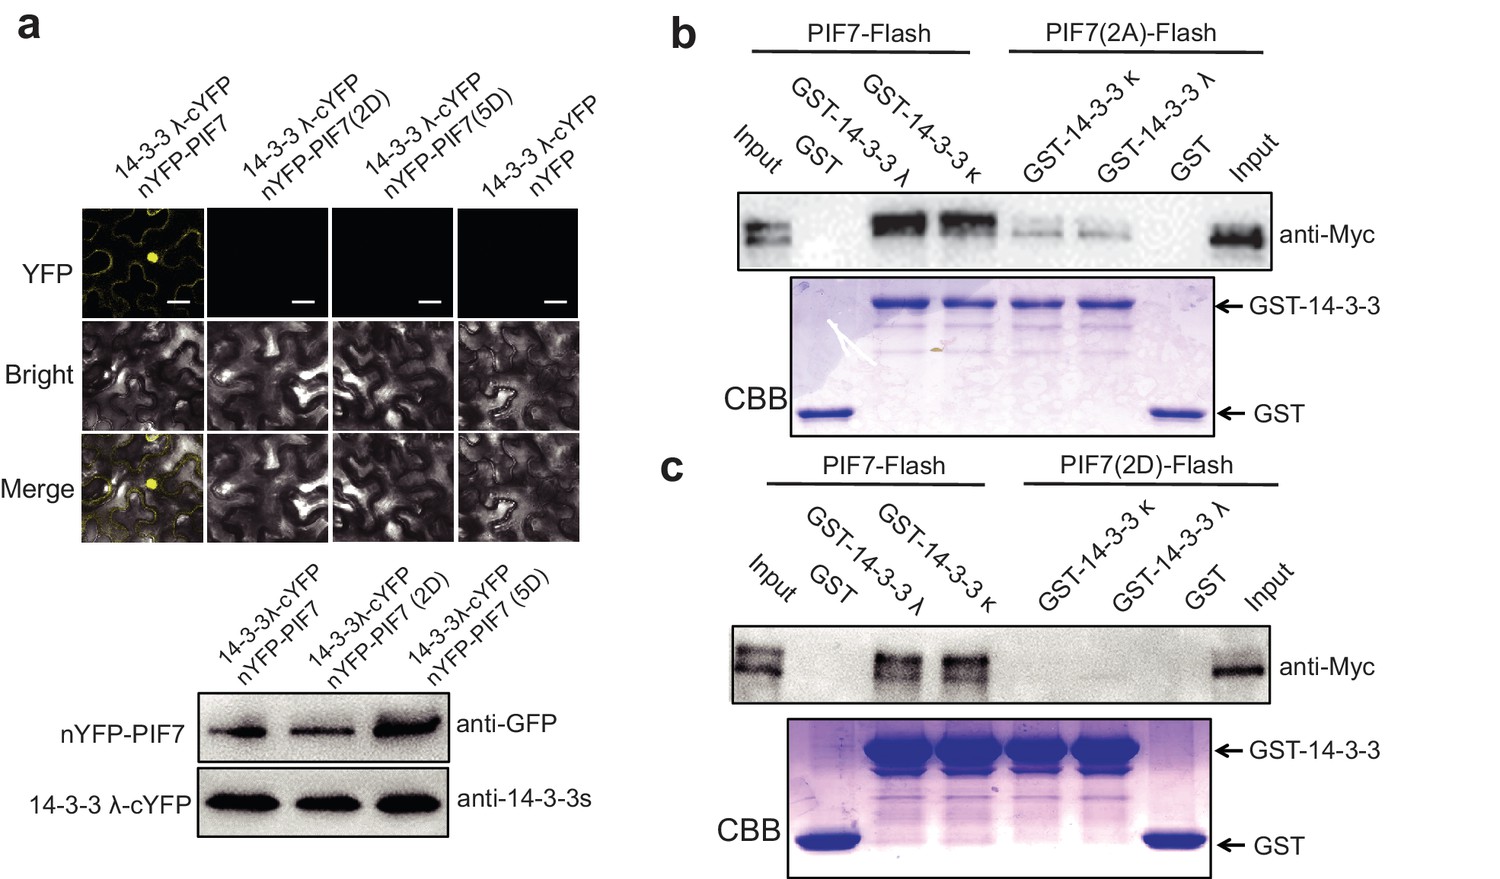
Interactions between PIF7, PIF7(2A) or PIF7(2D) and 14-3-3 λ or 14-3-3 κ in BiFC and in a pull-down assay.
(a) Interaction between PIF7(2D) or PIF7(5D) and 14-3-3 λ as detected by BiFC. The C-terminal half of YFP was fused to 14-3-3 λ and the N-terminal half of YFP was fused to PIF7, PIF7(2D) or PIF7(5D). White scale bar represents 75 μm. The expression of the 14-3-3 λ protein and PIF7(2D) or PIF7(5D) are presented at the bottom. Anti-GFP antibody was used to detect the nYFP-tagged protein. Anti-14-3-3 antibody was used to detect 14-3-3s. (b, c) Interactions between PIF7 and PIF7(2A) (b) or PIF7(2D) (c) and 14-3-3 λ or 14-3-3 κ were detected using a semi-in vivo pull-down assay. 14-3-3 λ and 14-3-3 κ fused with GST were expressed and purified from E. coli. Protein extracts from plants overexpressing PIF7-Flash, PIF7(2A)-Flash and PIF7(2D)-Flash grown under white-light conditions. Immunoblot of PIF7-Flash proteins using anti-Myc antibody. CBB: Coomassie Brilliant Blue stain.
Figure 4 with 1 supplement
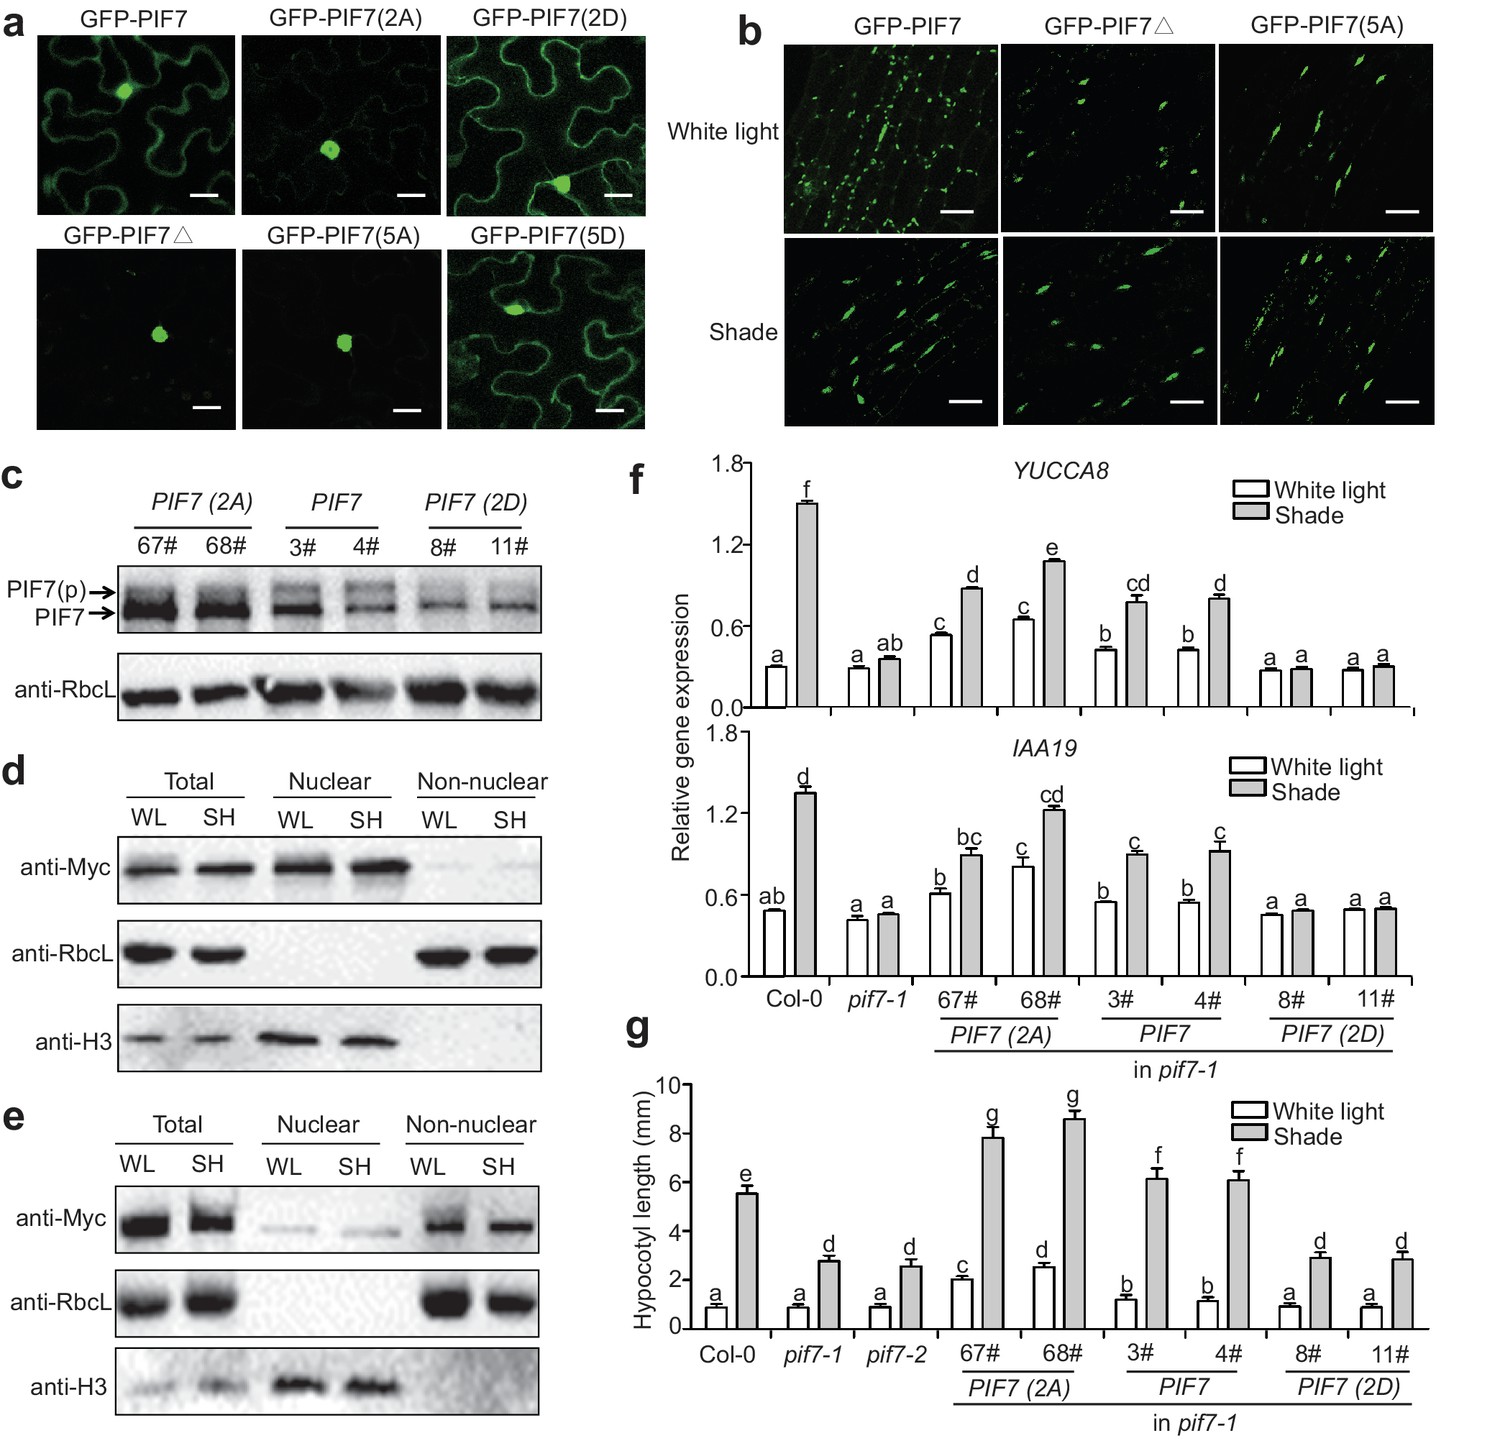
Phosphorylation sites of PIF7 are important for the localization and function of this protein.
(a) Subcellular localization of GFP-PIF7, GFP-PIF7(2A), GFP-PIF7 (2D), GFP-PIF7△, GFP-PIF7(5A) and GFP-PIF7 (5D) in tobacco cells. White scale bar represents 25 μm. (b) Subcellular localization of the GFP-PIF7, GFP-PIF7△ and GFP-PIF7(5A) proteins at the top of the hypocotyl in transgenic Arabidopsis plants treated with white light or after 1 hr in shade. White scale bar represents 25 μm. (c) Expression of PIF7 in white-light-grown 35S::PIF7(2A)-Flash, 35S::PIF7-Flash and 35S::PIF7(2D)-Flash transgenic lines as determined using anti-Myc antibody. RbcL is used as the loading control. (d) Subcellular fractionation experiments using 35S::PIF7(2A)-Flash transgenic lines. Immunoblot of the PIF7(2A)-Flash proteins using anti-Myc antibody in the total, nuclear and non-nuclear fractions from white-light- and shade-treated transgenic seedlings. Histone H3 is a nuclear maker and RbcL is a non-nuclear fraction marker. (e) Subcellular fractionation experiments using 35S::PIF7(2D)-Flash transgenic lines. Immunoblot of the PIF7(2D)-Flash proteins using anti-Myc antibody in the total, nuclear and non-nuclear fractions from white-light- and shade-treated transgenic seedlings. Histone H3 is a nuclear marker and RbcL is a non-nuclear fraction marker. (f) Expression levels of IAA19 and YUCCA8 in Col-0, pif7-1 and transgenic lines harboring PIF7-Flash, PIF7(2A)-Flash and PIF7(2D)-Flash in the pif7-1 background. Mean ± SE from three independent biological replicates, after normalization to the internal control AT2G39960, are shown. Bars marked with different letters denote significant differences (p<0.05) in the mean expression levels. (g) Quantification of the hypocotyl lengths of transgenic lines harboring PIF7-Flash, PIF7(2A)-Flash and PIF7(2D)-Flash in the pif7-1 background. Seedlings were grown under white light for 4 days and maintained in white light or transferred to shade for the next 5 days, before hypocotyl lengths were measured. More than 20 seedlings were measured for each line. Bars marked with different letters denote significant differences (p<0.05) in the mean hypocotyl lengths.
Figure 4—figure supplement 1
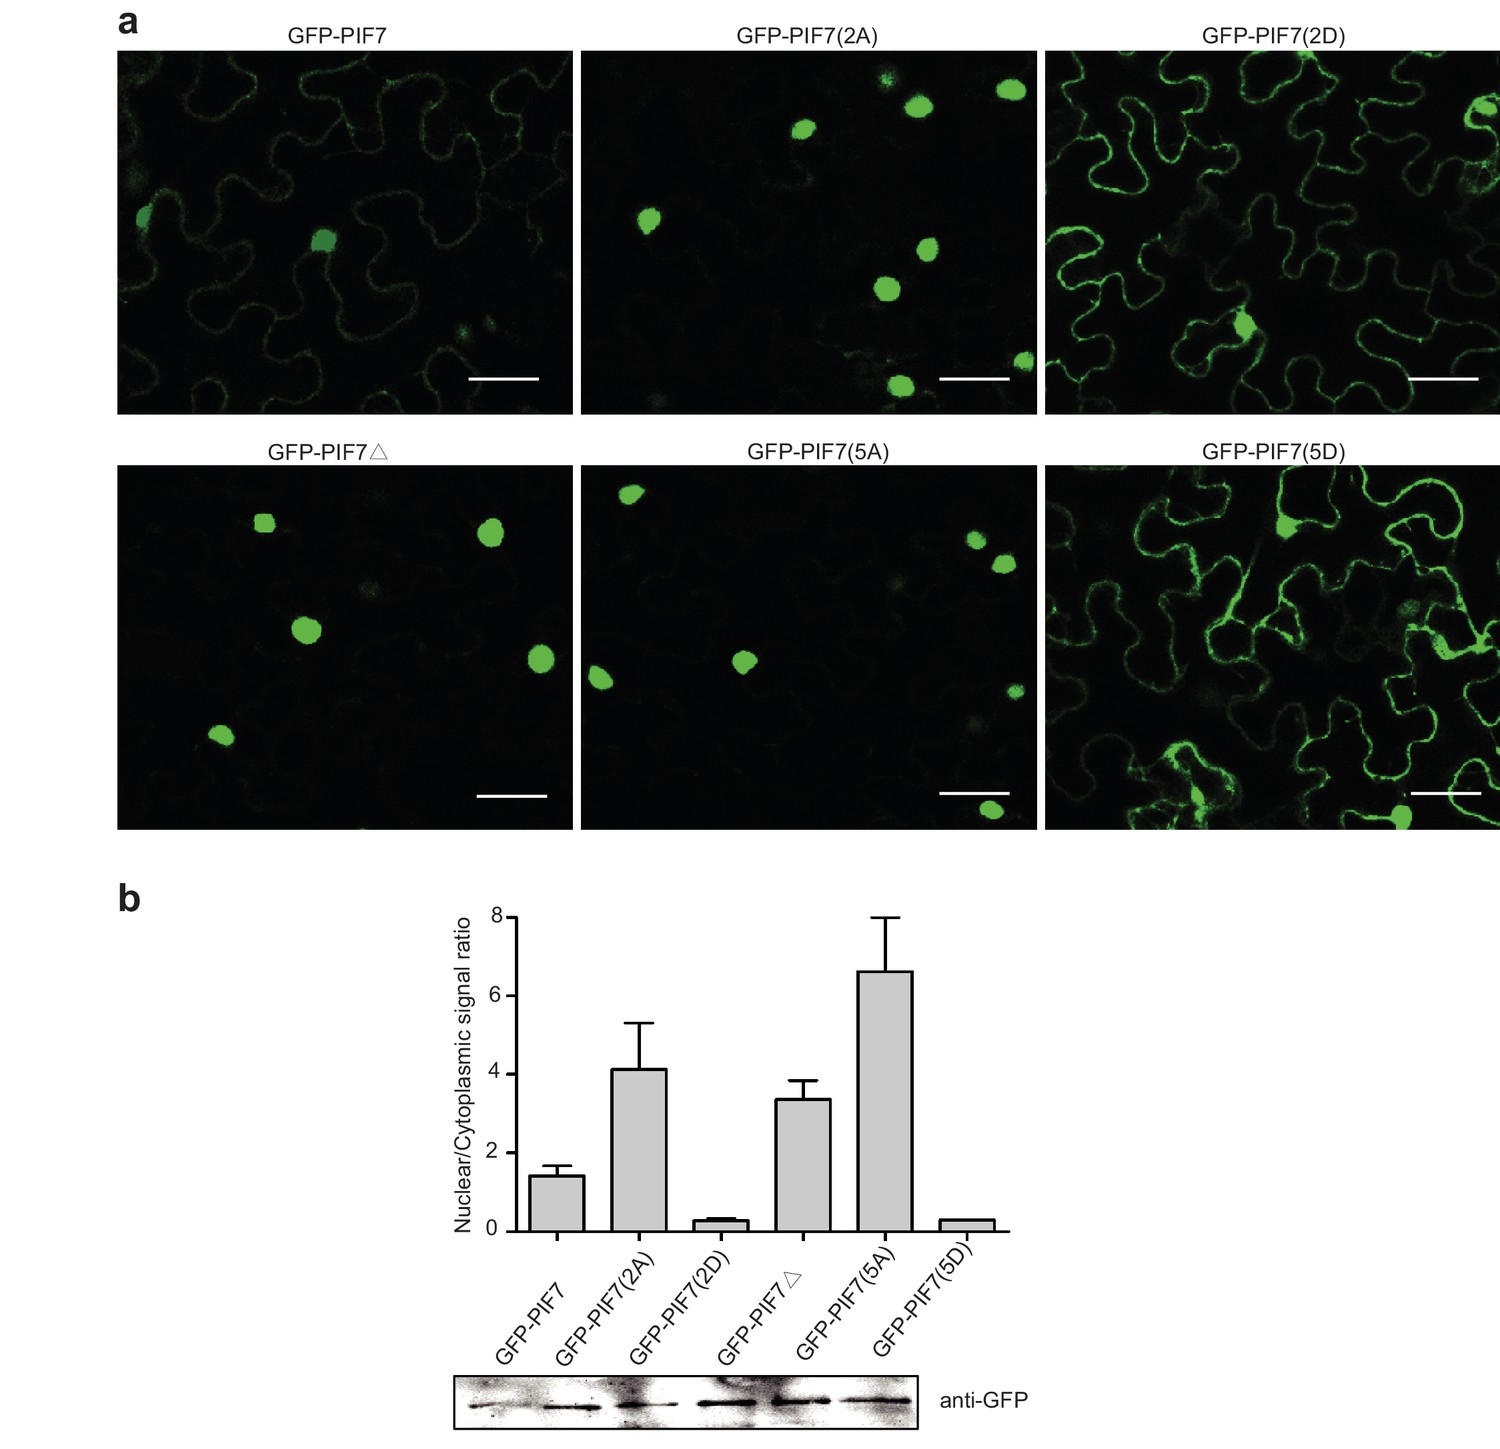
Subcellular localization of GFP-PIF7, GFP-PIF7(2A), GFP-PIF7(2D), GFP-PIF7△, GFP-PIF7(5A) and GFP-PIF7 (5D) in tobacco cells.
(a) Images of GFP-PIF7, GFP-PIF7(2A), GFP-PIF7(2D), GFP-PIF7△, GFP-PIF7(5A) and GFP-PIF7(5D) in tobacco cells. White bar represents 25 μm. (b) Quantification of the ratios of the nuclear and cytoplasmic intensities of GFP related to Figure 4a and Figure 4—figure supplement 1a. Immunoblot of GFP-PIF7, GFP-PIF7(2A), GFP-PIF7(2D), GFP-PIF7△, GFP-PIF7(5A) and GFP-PIF7(5D) in tobacco cells detected by anti-GFP antibody are shown at the bottom.
Figure 5 with 2 supplements
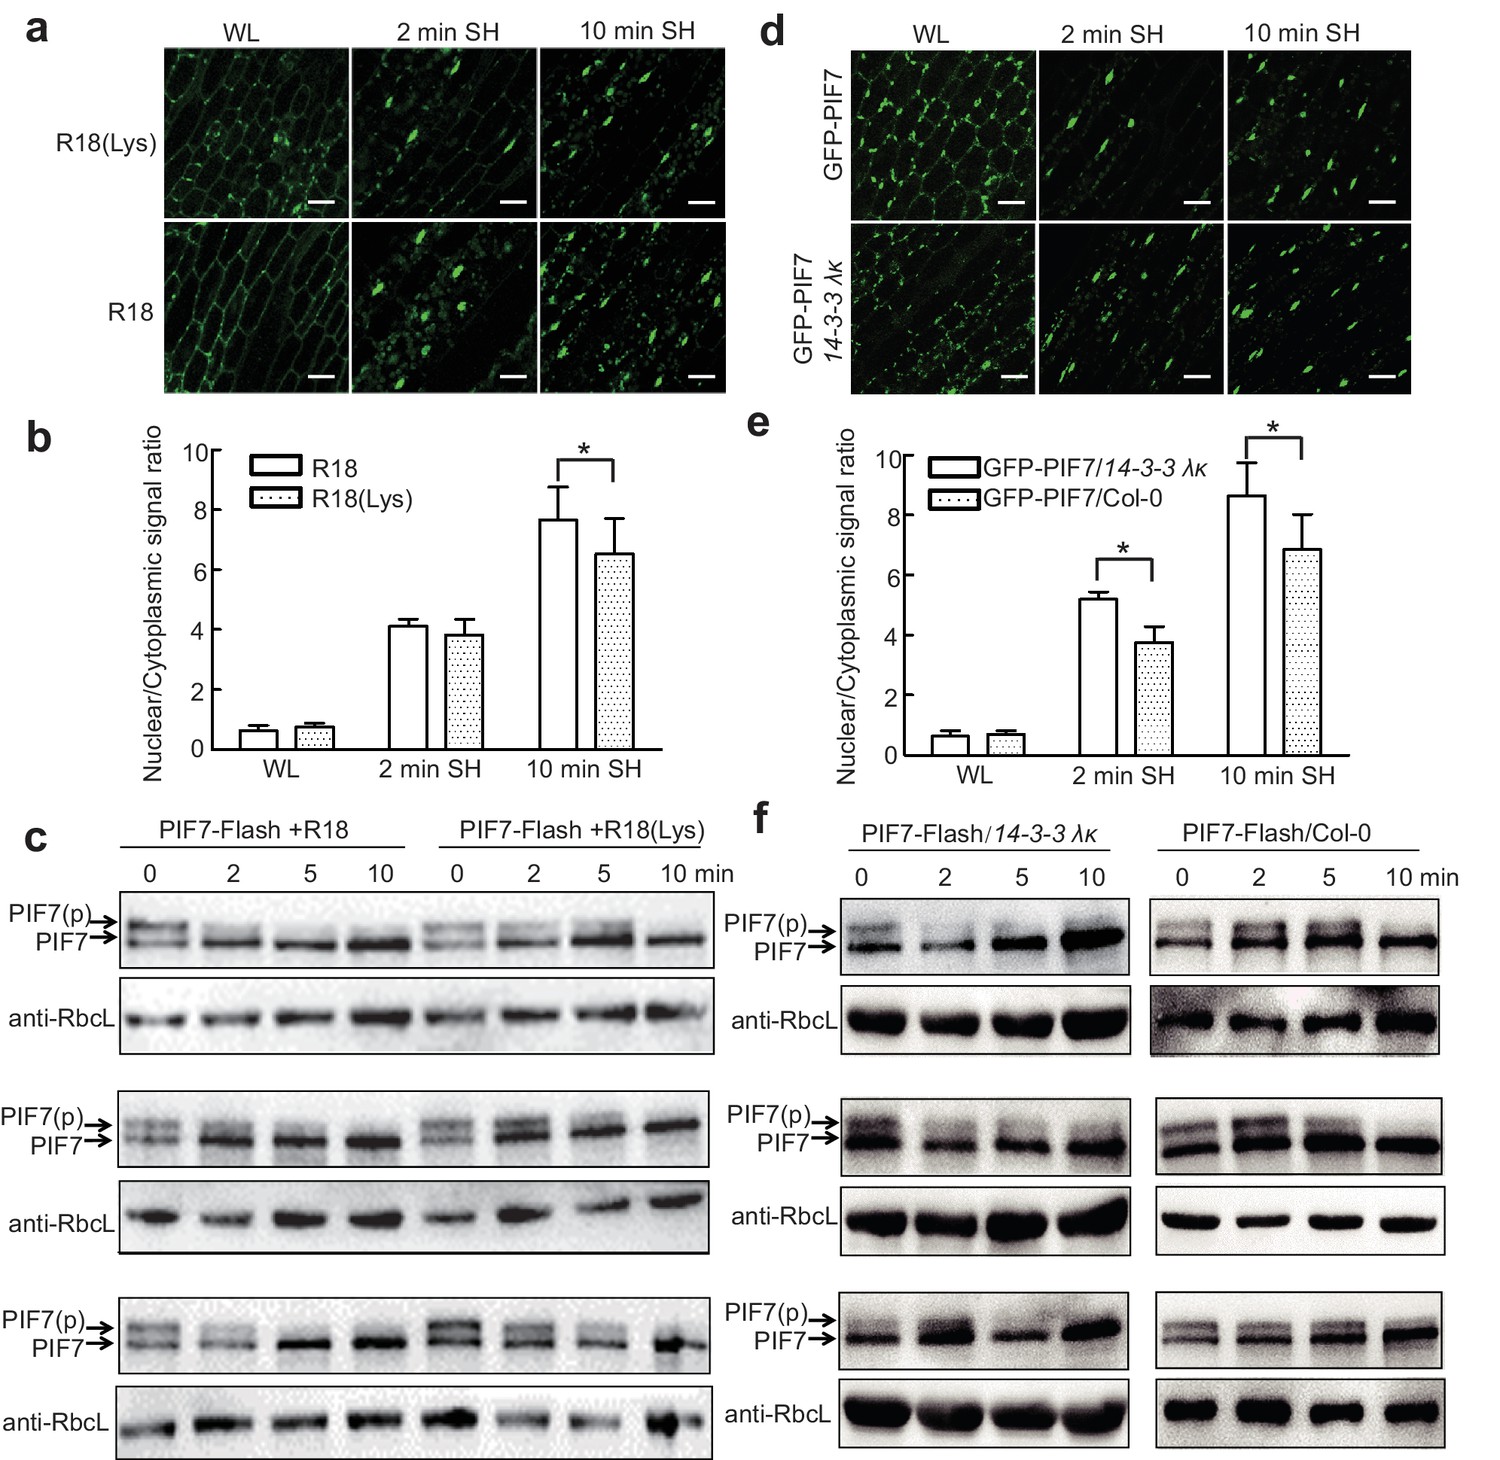
14-3-3 proteins delay shade-induced nuclear translocation and dephosphorylation of PIF7.
(a) The effect of R18 on the shade-induced nuclear localization of GFP-PIF7. GFP-PIF7 #14 transgenic plants grown under white light were treated with R18 or R18(Lys) for 3 hr after 10 min of vacuum, and were transferred to shade for indicated periods. White scale bar represents 25 μM. (b) Quantification of the shade-induced nuclear accumulation of GFP-PIF7. ImageJ was used to quantify the fluorescence intensities. Ratios of the nuclear and cytoplasmic signal intensities were calculated from 10 cells for each treatment. Error bars represent standard deviations. Significant differences between two treatments are shown as asterisks. *p<0.05 by Student’s t-test. (c) The effect of R18 on the shade-induced dephosphorylation of PIF7-Flash. Five-day-old 35S::PIF7-Flash transgenic seedlings were treated with R18 or R18(Lys) for 3 hr after 10 min of vacuum under white light, and transferred to shade for the indicated periods. Data for three biological replicates are presented. The level of PIF7-Flash was detected using anti-Myc antibody. RbcL was used as the loading control. (d) Shade-induced nuclear localization of GFP-PIF7 in 14-3-3 λκ (Salk-075219CxSalk-071097). A GFP-PIF7 #14 transgenic plant was crossed with 14-3-3 λκ. Five-day-old white-light-grown GFP-PIF7/14-3-3 λκ and GFP-PIF7/Col-0 seedlings were transferred to shade for the indicated periods. White scale bar represents 25 μM. (e) Quantification of the shade-induced nuclear accumulation of GFP-PIF7. ImageJ was used to quantify the fluorescence intensities. Ratios of the nuclear and cytoplasmic signal intensities were calculated from 10 cells for each treatment. Error bars represent standard deviations. Significant differences between14-3-3 λκ and Col-0 background are shown as asterisks. *p<0.05 by Student’s t-test. (f) Shade-induced dephosphorylation of PIF7-Flash in 14-3-3 λκ. A 35S::PIF7-Flash transgenic plant was crossed with 14-3-3 λκ. Five-day-old white-light-grown PIF7-Flash/14-3-3 λκ and PIF7-Flash/Col-0 seedlings were transferred to shade for the indicated periods. Three biological replicates were presented. The level of PIF7-Flash was detected using anti-Myc antibody. RbcL was used as the loading control.
-
Figure 5—source data 1
Source files for the ratios of the nuclear and cytoplasmic signal intensities in Figure 5b and Figure 5e.
- https://doi.org/10.7554/eLife.31636.016
-
Figure 5—source data 2
Source files for the ratios of phosphorylated PIF7(PIF7[p]) relative to total PIF7 proteins in Figure 5—figure supplement 1.
- https://doi.org/10.7554/eLife.31636.017
Figure 5—figure supplement 1
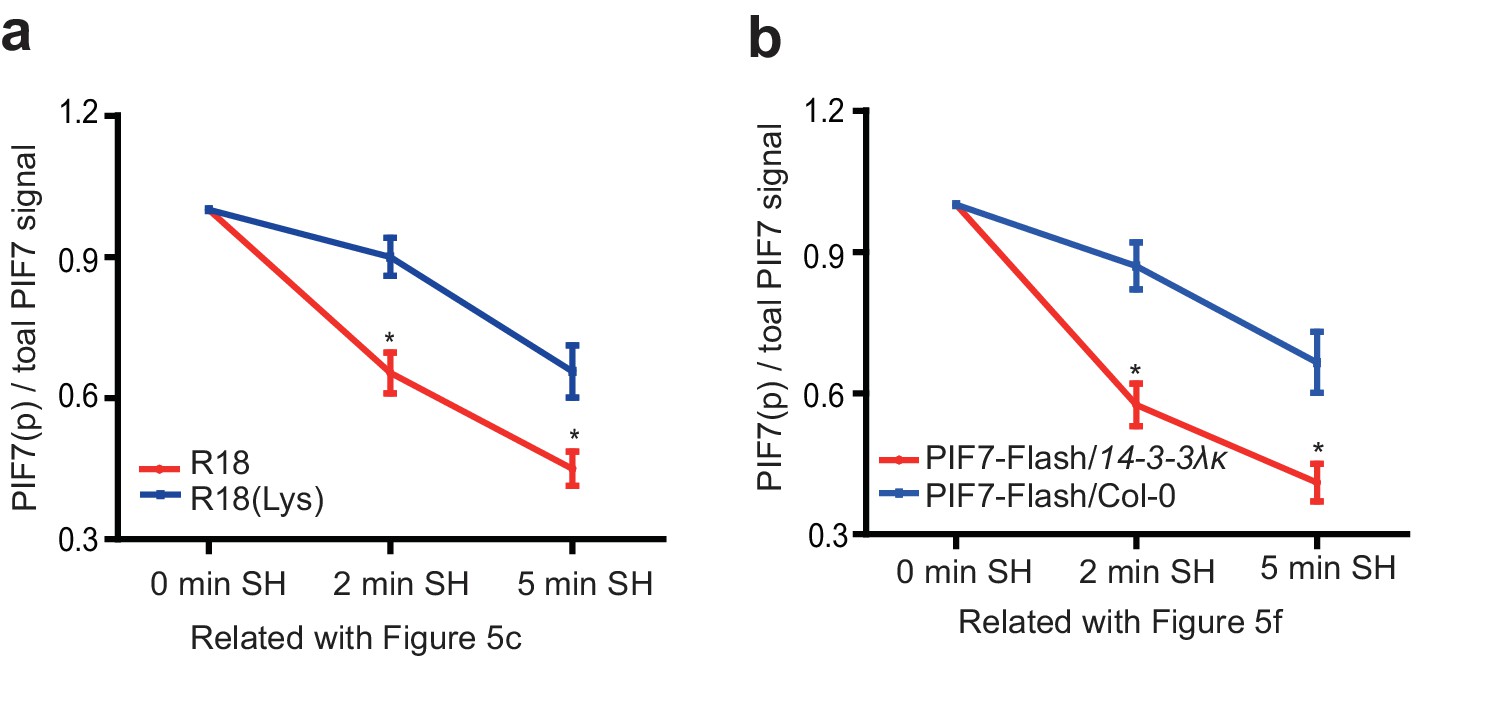
Quantification of phosphorylated PIF7(PIF7[p]) relative to total PIF7 proteins in Figure 5c and f.
(a) Quantification of R18 and R18(Lys) treatment in Figure 5c. (b) Quantification of PIF7-Flash/14-3-3λκ and PIF7-Flash/Col-0 background in Figure 5f. The intensities of phosphorylated PIF7 (top) and total PIF7 proteins were measured using Image J (http://rsb.info.nih.gov/ij/). The original images were converted to 8-bit format and then inverted so the background was dark and the bands were white. The signal intensity was integrated from all pixels in the selected area. The intensities of top bands were measured as phosphorylated PIF7 and the intensities of all bands as total PIF7 proteins. The ratios of phosphorylated PIF7 relative to total PIF7 proteins were calculated. The ratio at 0 min SH was set artificially as 1.0, and the ratio at 2 min SH/5 min SH were normalized to it. Quantitative data in (a) and (b) are shown as means ± SE, n = 3.
Figure 5—figure supplement 2
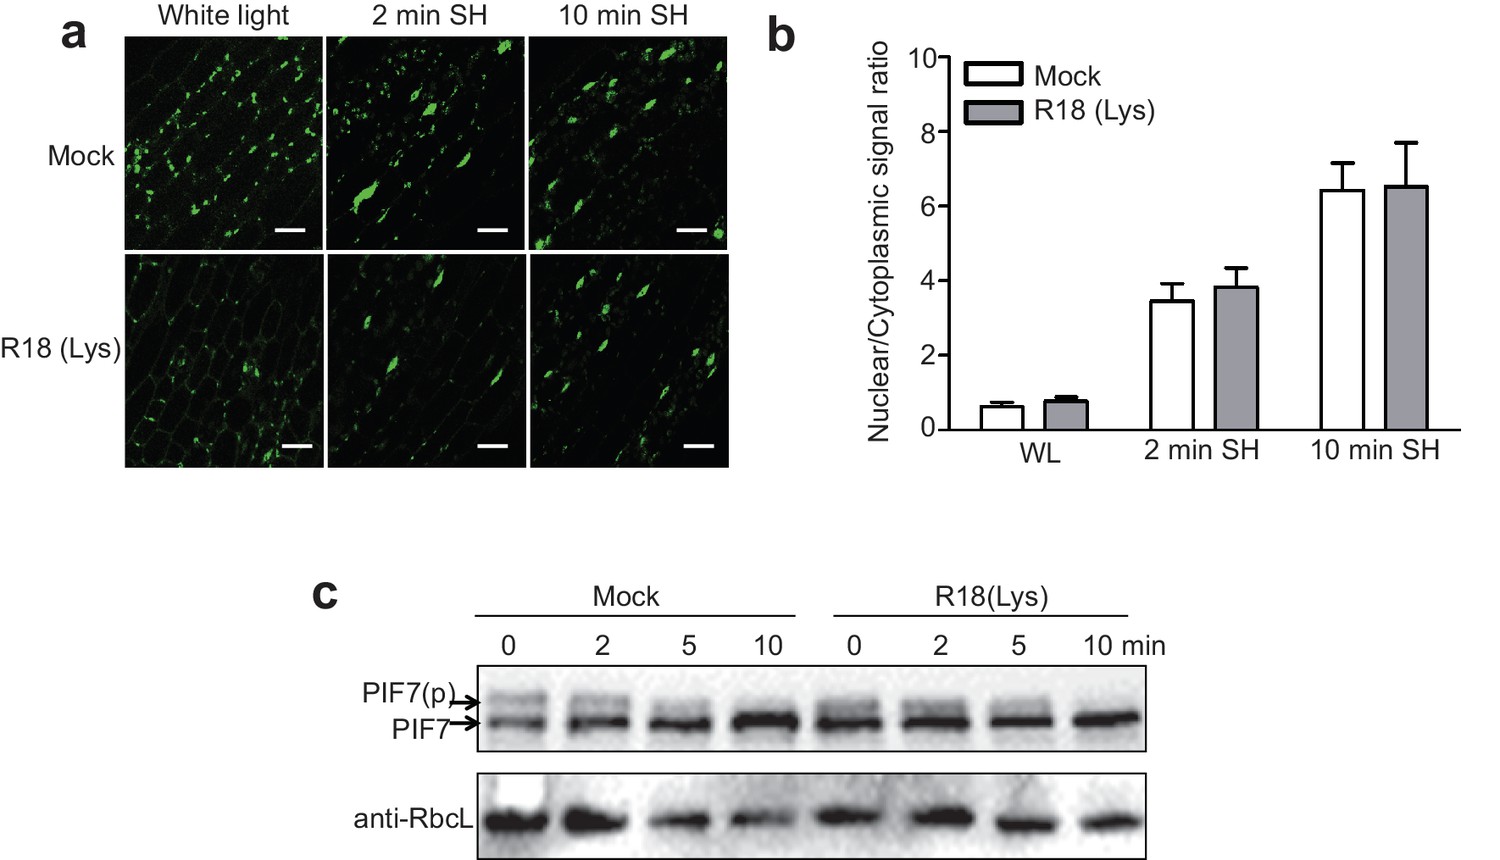
R18(Lys) is a non-functional peptide control for R18.
(a) The effects of R18(Lys) and Mock on shade-induced nuclear localization of GFP-PIF7 do not differ. GFP-PIF7 #14 transgenic plants grown under white light were treated with R18 or R18(Lys) for 3 hr after 10 min of vacuum, and transferred to shade for the indicated periods. White scale bar represents 25 μM. (b) Quantification of the shade-induced nuclear accumulation of GFP-PIF7. ImageJ was used to quantify the fluorescence intensities. Ratios of the nuclear and cytoplasmic signal intensities were calculated from 10 cells for each treatment. (c) The effects of R18(Lys) and Mock on the shade-induced de-phosphorylation of PIF7-Flash. Five-day-old 35S::PIF7-Flash transgenic seedlings were treated with R18 or R18(Lys) for 3 hr after 10 min of vacuum under white light, and transferred to shade for indicated time. The level of PIF7-Flash was detected using anti-Myc antibody. RbcL was used as a loading control.
Figure 6 with 1 supplement
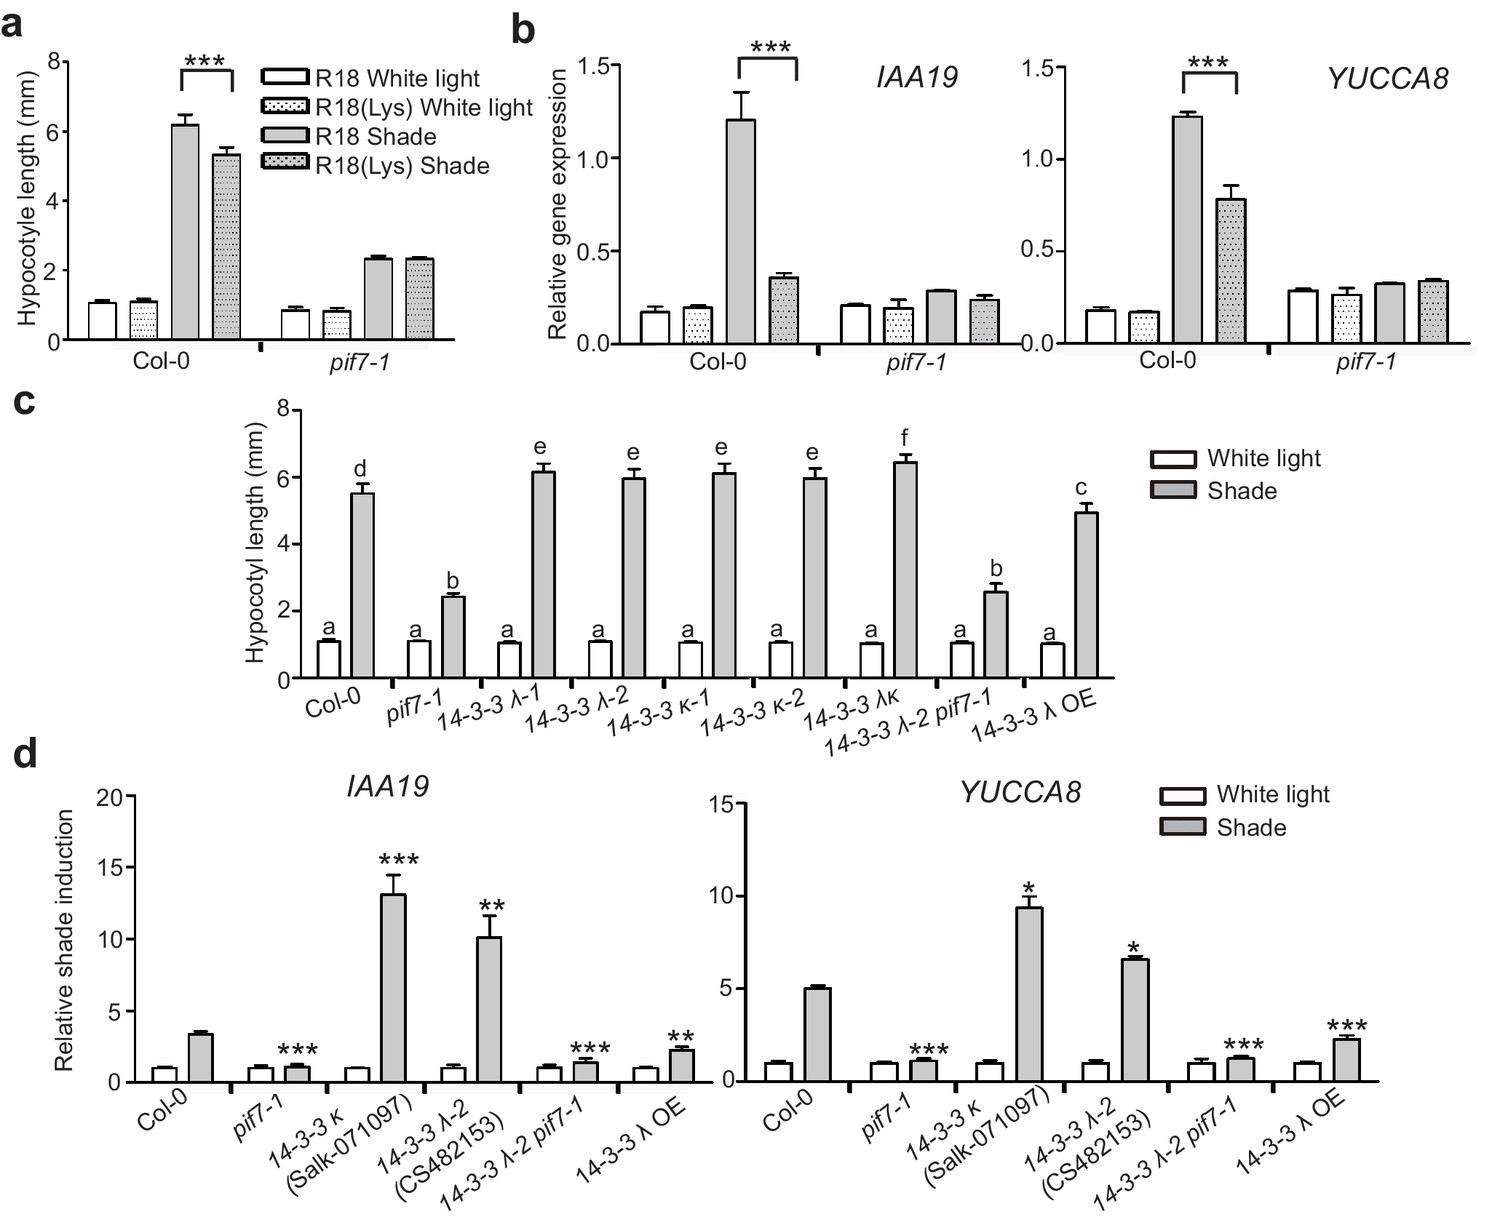
14-3-3 proteins negatively regulate shade-induced hypocotyl elongation and gene expression.
(a) Quantification of the hypocotyl length of Col-0 seedlings grown in plates containing 200 μg/ml R18 or R18(Lys) peptide under white light or shade conditions. Seedlings were grown under white light for 4 days and maintained in white light or transferred to shade for next 5 days before the measurement of hypocotyl length. More than 20 seedlings were measured. Significant differences between two treatments are shown as asterisks. ***p<0.001 by Student’s t-test. (b) IAA19 and YUCCA8 expression level in the Col-0 and pif7-1 seedlings treated with R18 and R18(Lys) under white light or shade. Seedlings were grown with 1/2 MS medium containing 200 μg/ml R18 or R18(Lys) under white light for 5 days. Then, the seedlings were kept in white light or transferred to shade for 1 hr. Mean ± SE from three independent biological replicates, after normalization to the internal control AT2G39960, are shown. Significant differences between two treatments are indicated by asterisks. ***p<0.001, by Student’s t-test. (c) Quantification of the hypocotyl length of Col-0, pif7-1, 14-3-3 mutants and the overexpression line grown under white light or shade. More than 20 seedlings were measured. Bars marked with different letters denote significant differences (p<0.05) of the means of hypocotyl length. (d) Shade induction of IAA19 and YUCCA8 in Col-0, pif7-1, 14-3-3 mutants and 14-3-3 λ OE. The seedlings were grown under white light for 5 days. Then, the seedlings were kept in white light or transferred to shade for 1 hr. The expression levels were normalized to a reference gene (AT2G39960) and then normalized to the expression under white light condition. The relative shade inductions were shown. Significant differences between mutants and Col-0 are indicated by asterisks. *p<0.05, **p<0.01,***p<0.001 by Student’s t-test.
Figure 6—figure supplement 1
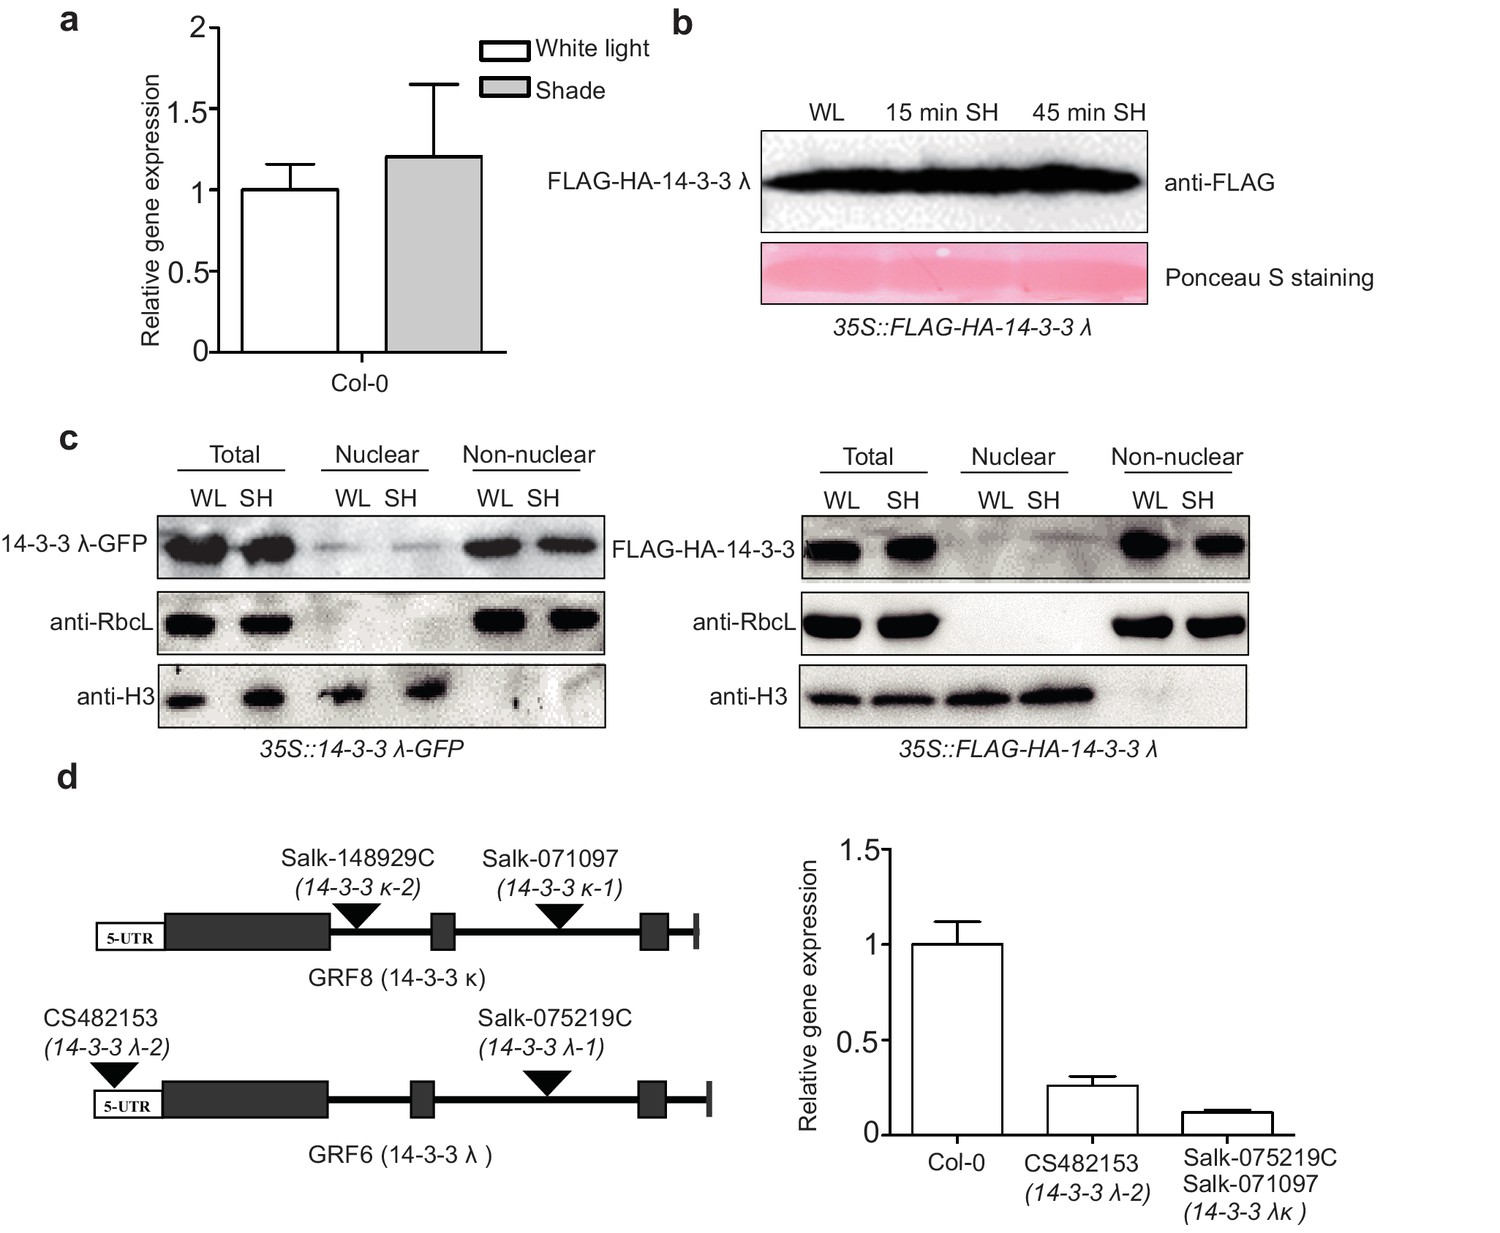
Effects of shade on the mRNA level, protein level and localization of 14-3-3 λ.
(a) Relative gene expression of 14-3-3 λ in Col-0 grown under white light and shade. The seedlings were grown under white light for 5 days. Then, the seedlings were kept in white light or transferred to the shade for 1 hr for qRT-PCR. Means ± SEs from three independent biological replicates, after normalization to the internal control AT2G39960, are shown. (b) Immunoblot of FLAG-HA-14-3-3 λ using anti-FLAG in white-light-grown and the shade-treated 35S::FLAG-HA-14-3-3 λ transgenic seedlings. The seedlings were grown under white light for 5 days. Then, the seedlings were kept in white light or transferred to the shade for 15 min or 45 min for western blotting. Ponceau S staining was used to display the loading control for western blotting. (c) Shade effects on the localization of 14-3-3 λ-GFP and FLAG-HA-14-3-3 λ. Immunoblot of the 14-3-3 λ-GFP proteins using anti-GFP antibody and FLAG-HA-14-3-3 λ proteins using anti-FLAG in the total, nuclear and non-nuclear fractions from white-light- and shade-treated seedlings. (d) T-DNA insertion sites and 14-3-3 λ expression level in 14-3-3 λ mutants used in Figure 6c.
Figure 7
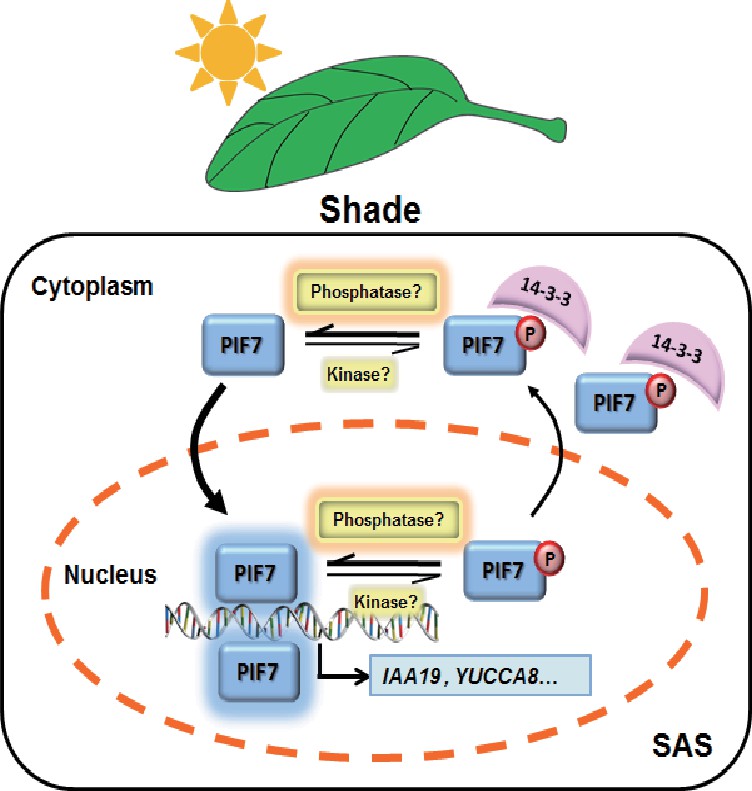
A molecular model illustrating the role of 14-3-3 proteins in PIF7-mediated SAS.
In response to shade light, de-phosphorylated PIF7 accumulates in the nucleus. 14-3-3 proteins retain phosphorylated PIF7 in the cytoplasm and hence regulate shade-induced hypocotyl elongation negatively.
Author response image 1
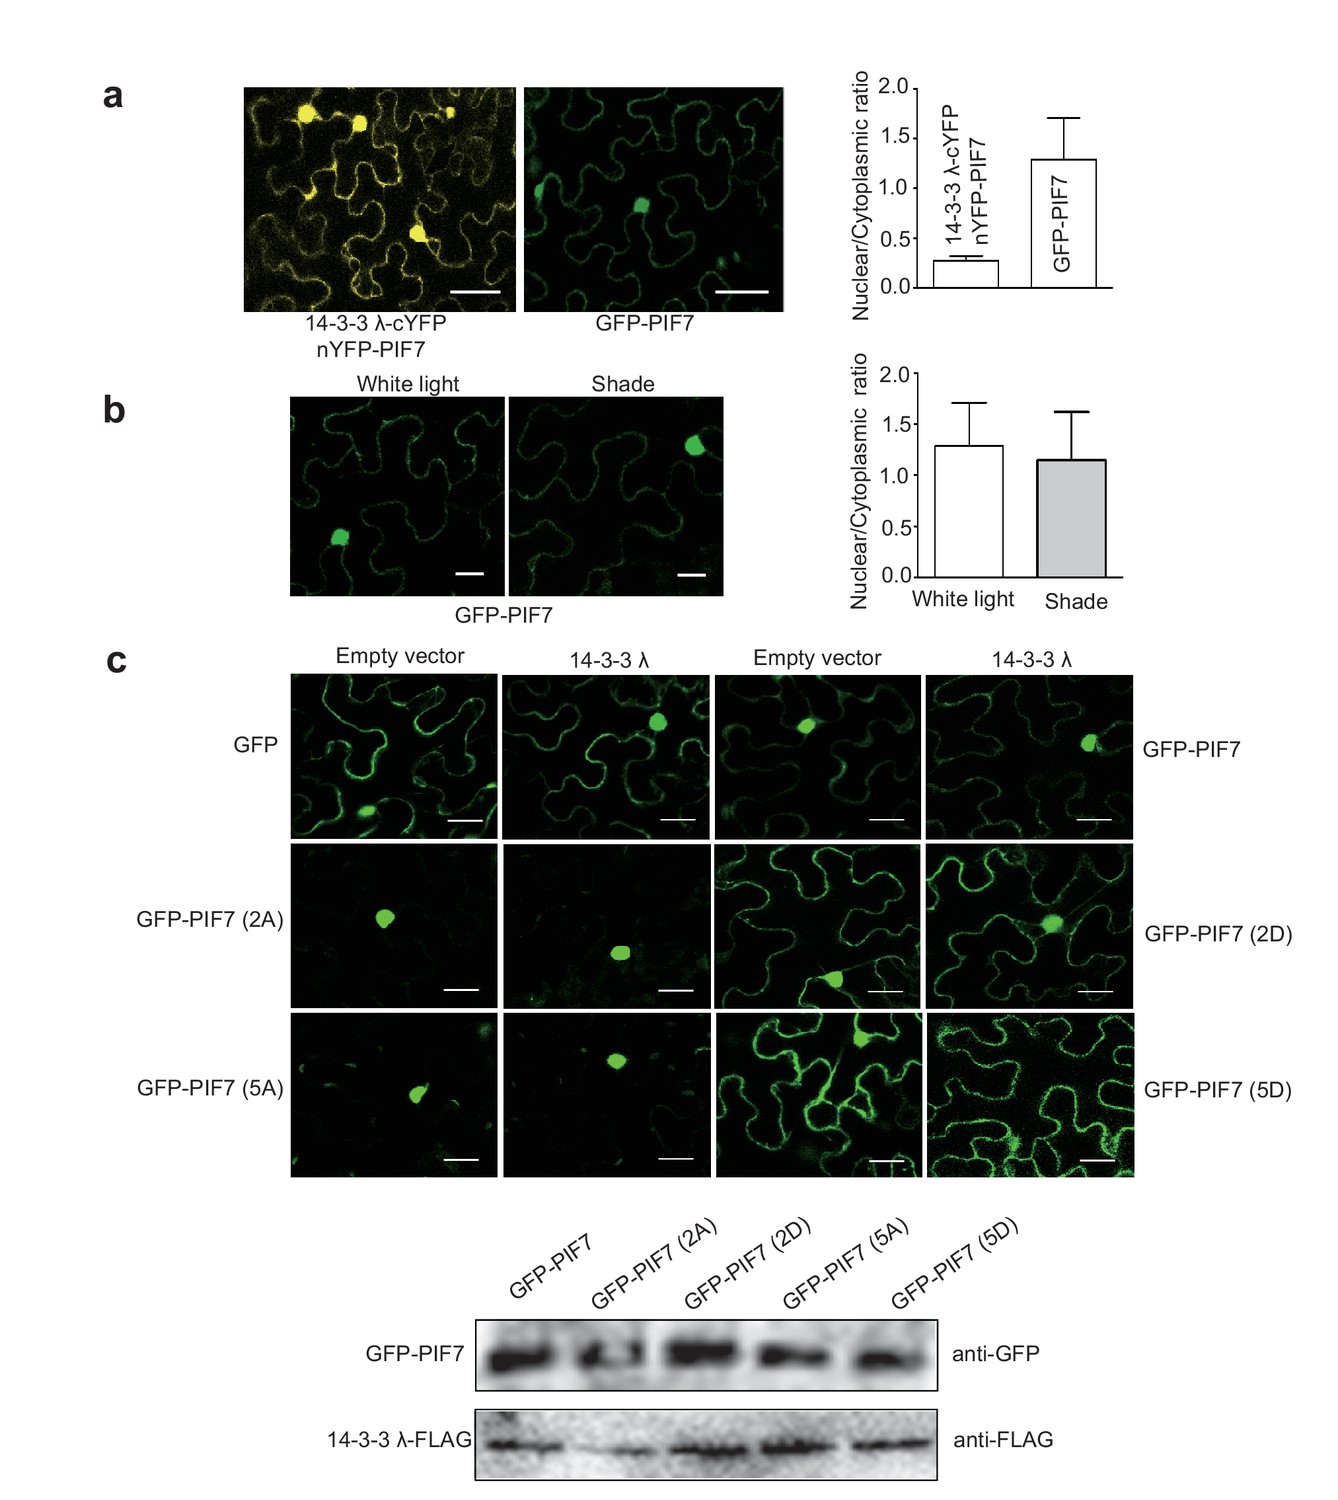
(a) Quantification of ratios between nuclear and cytoplasmic intensities of YFP/GFP in tobacco leaf cells (n>10) which co-expressed 14-3-3λ-cYFP and nYFP-PIF7 or only expressed GFP-PIF7.
(b) Shade light doesn’t affect the localization of GFP-PIF7 expressed in tobacco leaf cells. (c) Co-expressed 14-3-3λ doesn’t affect the localization of PIF7 derivatives in tobacco leaf cells. Subcellular localization of GFP, GFP-PIF7, GFP-PIF7 (2A), GFP-PIF7 (5A), GFP-PIF7 (2D) and GFP-PIF7 (5D) co-expressed with 14-3-3λ or empty vector in tobacco leaf cells. The expression levels of GFP-PIF7 derivatives and 14-3-3λ-FLAG was detected using anti-GFP antibody and anti-FLAG antibody, respectively.
Author response image 2

The effect of R18 on the localization of BES1-GFP.
BES1-GFP transgenic plants (a gift from Dr. Xuelu Wang’s lab) grown under white light were treated with R18 or R18(Lys) for 3 hr after 10 min of vacuum. ImageJ was used to quantify the fluorescence intensities. Ratios between the nuclear and cytoplasmic signal intensities were calculated from at least 10 cells for each treatment.
Author response image 3
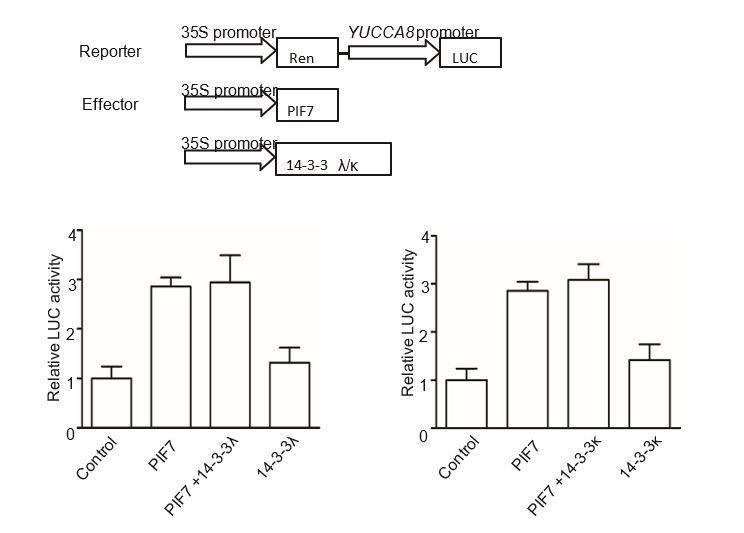
The effect of 14-3-3λ and 14-3-3κ on PIF7-mediated activation of YUCCA8 promoter.
The effector constructs contain the CaMV 35S promoter fused to the transcription factor PIF7 or 14-3-3s. The reporter construct contains the 2.2 Kb upstream of the translation initiation site of YUCCA8 fused to the LUC reporter gene. Both effector and reporter were co-expressed in tobacco leaf cells. The ratio of Luc to Ren from leaves transfected reporter and empty effector was normalized as 1.
Additional files
-
Supplementary file 1
Primers used in this study.
- https://doi.org/10.7554/eLife.31636.021
-
Transparent reporting form
- https://doi.org/10.7554/eLife.31636.022
Download links
A two-part list of links to download the article, or parts of the article, in various formats.
Downloads (link to download the article as PDF)
Open citations (links to open the citations from this article in various online reference manager services)
Cite this article (links to download the citations from this article in formats compatible with various reference manager tools)
Shade-induced nuclear localization of PIF7 is regulated by phosphorylation and 14-3-3 proteins in Arabidopsis
eLife 7:e31636.
https://doi.org/10.7554/eLife.31636


