NRF2 regulates core and stabilizing circadian clock loops, coupling redox and timekeeping in Mus musculus
- University of Memphis, United States
- University of Pittsburgh, United States
Figures
Figure 1 with 2 supplements
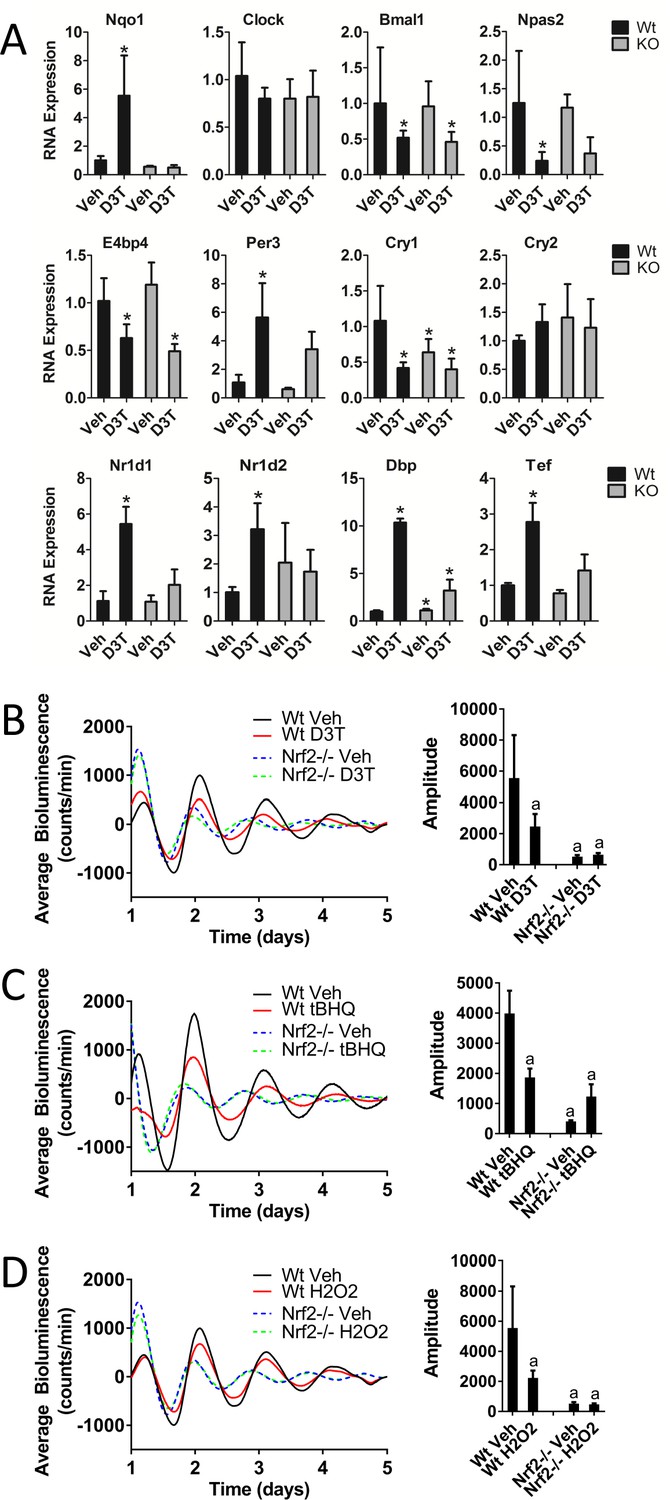
Keap1/Nrf2-activators affect circadian gene expression in mouse liver tissue and perturb circadian rhythmicity in vitro.
(A) Expression of circadian genes in the liver of Wt and Nrf2-/- (KO) mice treated with either vehicle (Veh) or 300 μmol/kg bw D3T. All expression values were determined by qPCR and normalized to Gapdh. Data is shown as the average fold-change ±standard deviation (n = 4 animals/treatment/genotype each) relative to the expression in the Wt Veh sample, which was set to 1. Results were analyzed using Holm-Sidak’s multiple comparisons test; * indicates a p-value<0.05 relative to the Wt Veh control. (B–D) Per2:Luc-driven bioluminescence in Wt or Nrf2-/- MEFs in the presence of DMSO (0.05%) (Veh), (B) 100 μM D3T, (C) 50 μM tBHQ, or (D) 100 μM H2O2. Average luminescence recordings are shown on the left in each panel. Amplitude is expressed as an average ±standard deviation (n = 3). Results were analyzed using a two-way ANOVA followed by Tukey’s multiple comparisons test; a indicates a p-value<0.05 relative to the Wt Veh control.
Figure 1—figure supplement 1
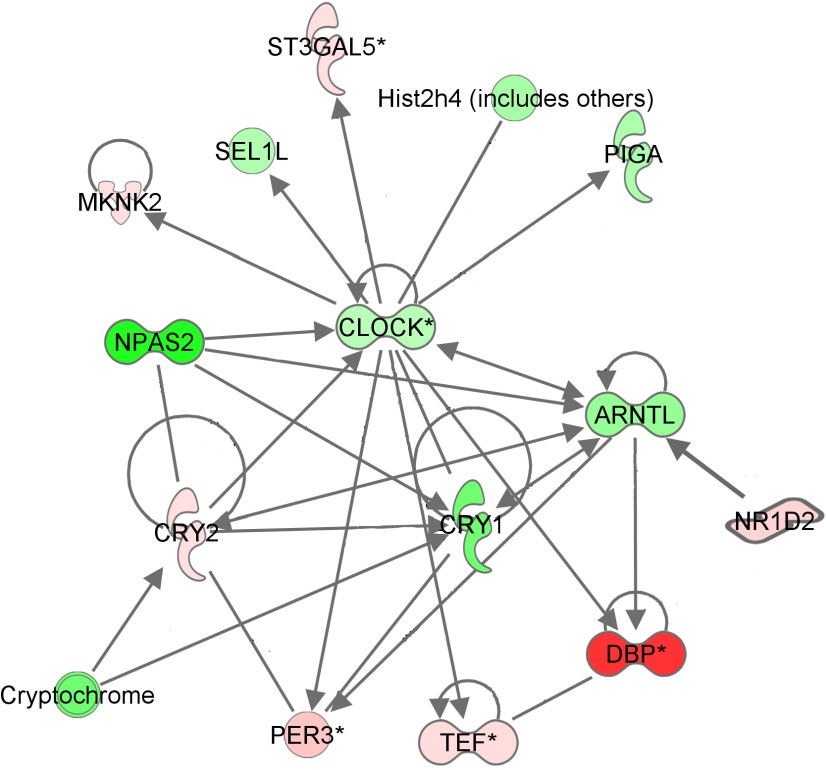
Circadian pathway enriched by D3T in mouse liver.
Circadian gene expression, as determined by Affymetrix microarray, in the liver tissue of Wt mice treated with either vehicle or 300 μmol/kg bw D3T. Ingenuity Pathway Analysis identified the indicated differentially expressed genes as significantly enriching the rhythmic processes network. The hue of each node indicates the magnitude of up- (red) or down- (green) regulation as a function of D3T treatment.
Figure 1—figure supplement 2
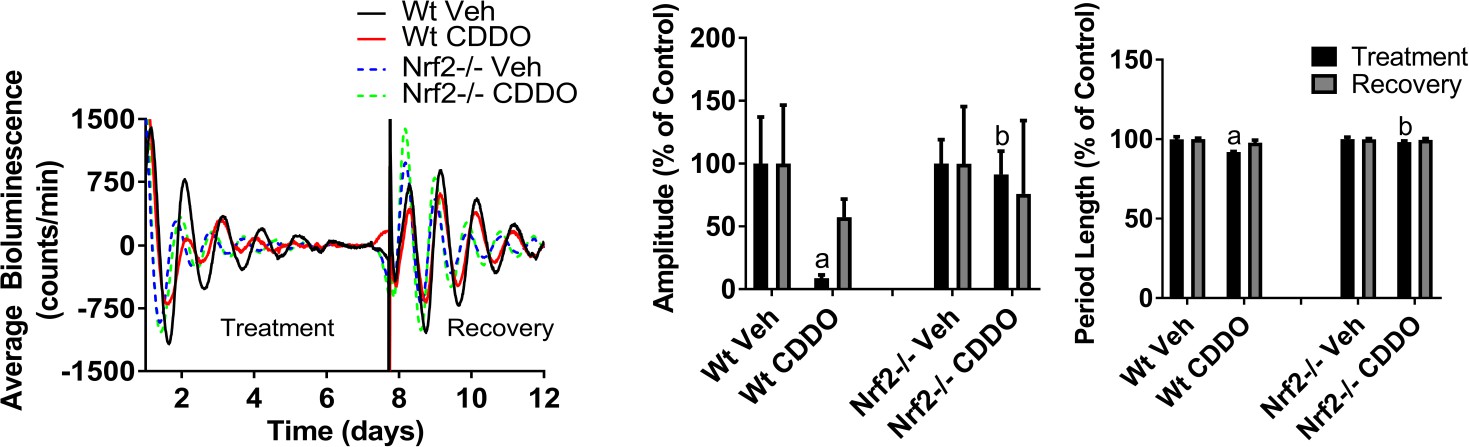
Effect of CDDO-Im on circadian rhythmicity in MEFs.
Per2:Luc-driven bioluminescence from Wt and Nrf2-/- MEFs in the presence of DMSO (Veh) or 300 nM CDDO-Im (Treatment). Following ~8 days of treatment, DMSO and CDDO-Im-containing media was replaced with fresh recording media absent of any chemicals (Recovery). Average luminescence recordings are shown on the left. Amplitude and period length are shown as an average percent ±standard deviation (n = 3) relative to the genotype-matched Veh, which was set to 100%. Results were analyzed using a two-way ANOVA followed by Tukey’s multiple comparisons test; a indicates a p-value<0.05 relative to the Veh control, b indicates a p-value<0.05 relative to the treated Wt sample.
Figure 2 with 3 supplements
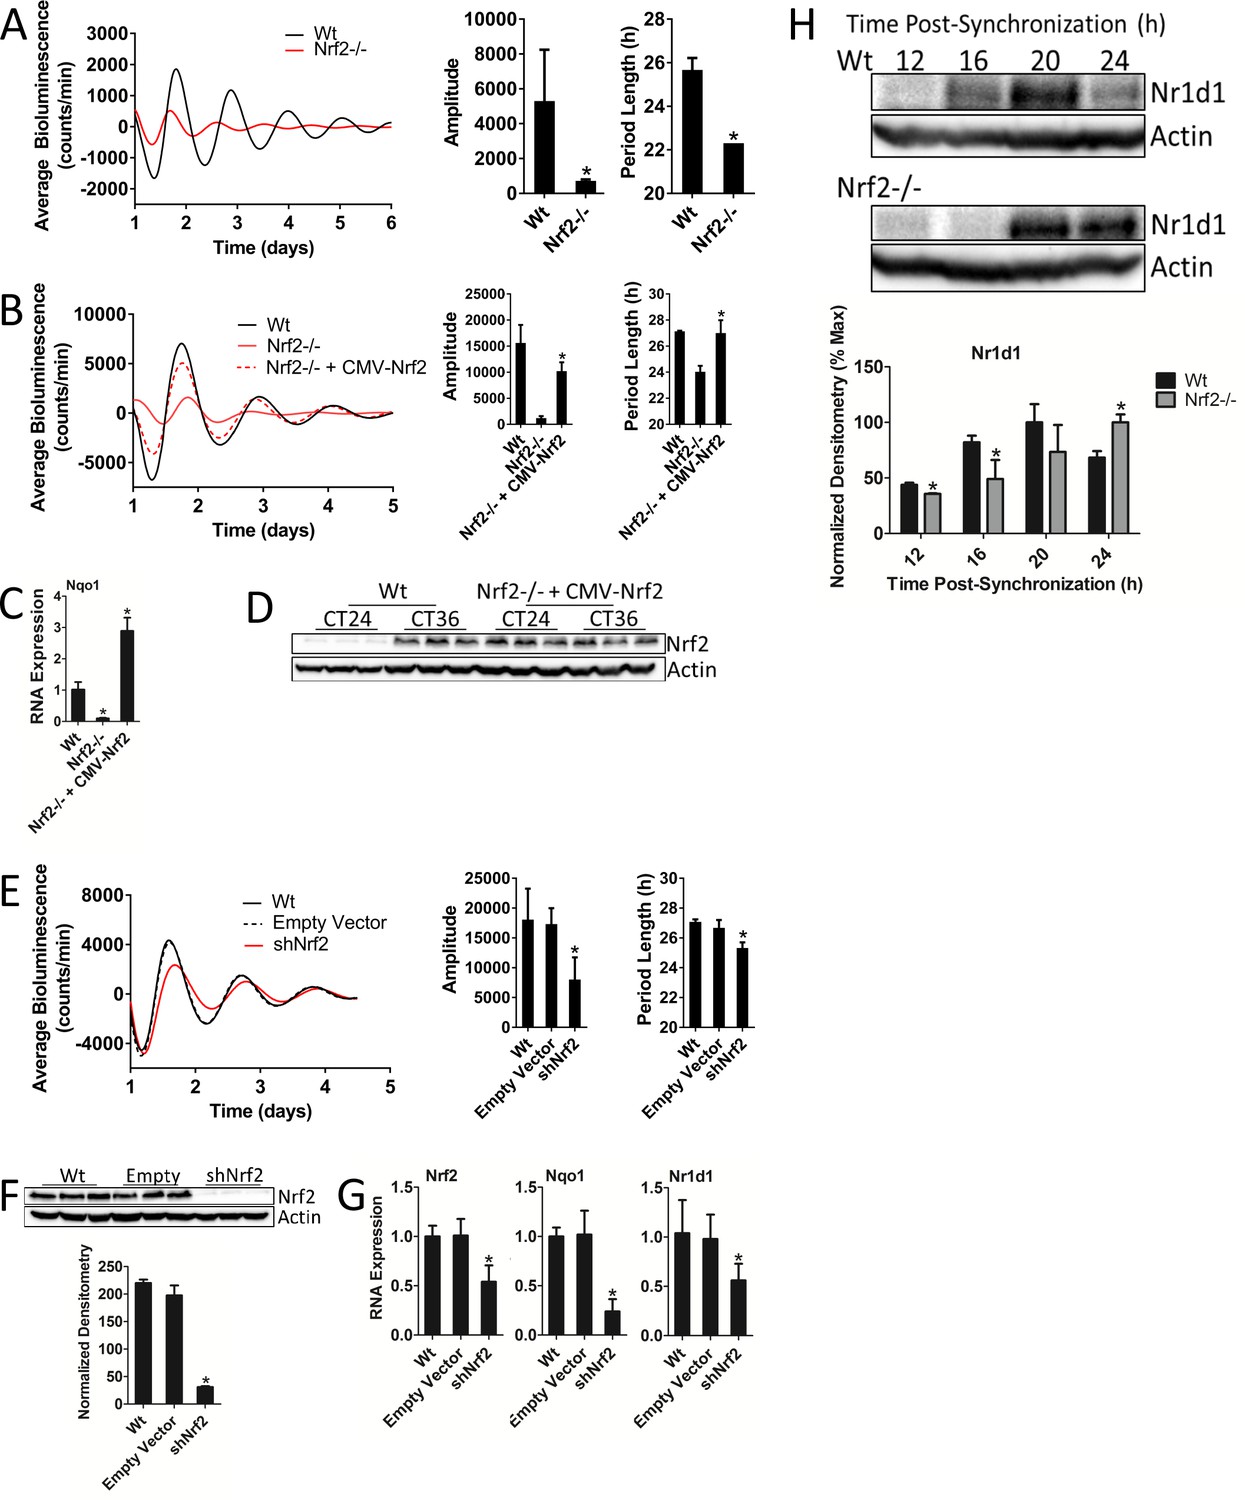
Nrf2 is required for normal circadian timekeeping.
(A) Per2:Luc-driven bioluminescence from Wt and Nrf2-/- MEFs. Average luminescence recordings are shown on the left. Amplitude and period length are expressed as an average ±standard deviation (n = 3). Results were analyzed using Student’s t-test; * indicates a p-value<0.05 relative to Wt. (B) Per2:Luc-driven bioluminescence from Wt, Nrf2-/-, and Nrf2-/- MEFs stably expressing an Nrf2 expression construct (Nrf2-/- + CMV-Nrf2). Average luminescence recordings are shown on the left. Amplitude and period length are expressed as an average ±standard deviation (n = 3). Results were analyzed using Student’s t-test; * indicates a p-value<0.05 relative to Nrf2-/-. (C) Nqo1 gene expression in Wt, Nrf2-/-, and Nrf2-/- + CMV-Nrf2 MEFs. Expression values were determined by qPCR and normalized to Gapdh. Data is shown as the average fold-change ±standard deviation (n = 3) relative to the expression in Wt, which was set to 1. Results were analyzed using a one-way ANOVA followed by Dunnett’s multiple comparisons test; * indicates a p-value<0.05 relative to Wt. (D) NRF2 expression in 50 μg of whole cell lysate from Wt and Nrf2-/- + CMV-Nrf2 MEFs and harvested 24 hr or 36 hr post-synchronization. β-Actin, which was unchanged by exogenous Nrf2 expression, was used as a loading control. Average densitometric values ± standard deviation equal 14.22 ± 2.39 and 107.14 ± 16.68 for Wt 24 hr and 36 hr post-synchronization, respectively. Average densitometric values (±standard deviation) equal 157.4 ± 12.37 and 160.16 ± 18.09 for Nrf2-/- + CMV-Nrf2 24 hr and 36 hr post-synchronization, respectively. (E) Per2:Luc-driven bioluminescence from Wt and Wt MEFs stably expressing an empty shRNA vector (Empty Vector) or a shNrf2 vector (shNrf2). Average luminescence recordings are shown on the left. Amplitude and period length are expressed as an average ±standard deviation (n = 4). Results were analyzed using Student’s t-test; * indicates a p-value<0.05 relative to the Empty Vector. (F) NRF2 expression in 50 μg of whole cell lysate from Wt, Empty Vector (Empty), and shNrf2 MEFs. β-Actin, which was unchanged by shRNA expression, was used as a loading control. Values are expressed as the normalized average densitometry ±standard deviation (n = 3). Results were analyzed using Student’s t-test; * indicates a p-value<0.05 relative to the Empty Vector. (G) Nrf2, Nqo1, and Nr1d1 gene expression in Wt, Empty Vector, and shNrf2 MEFs. Expression values were determined by qPCR and normalized to Gapdh. Data is shown as the average fold-change ±standard deviation (n = 3) relative to the expression in Wt, which was set to 1. Results were analyzed using Student’s t-test; * indicates a p-value<0.05 relative to the Empty Vector. (H) NR1D1 protein in 50 μg of whole cell lysate from Wt and Nrf2-/- MEFs at the indicated times post-synchronization. β-Actin, which was unchanged by genotype or collection time, was used as a loading control. Values are expressed as the normalized average densitometry ±standard deviation (n = 3) relative to the time point in which expression was maximal, which was set to 100%. Results were analyzed using Student’s t-test; * indicates a p-value<0.05 relative to the time matched Wt sample.
Figure 2—figure supplement 1
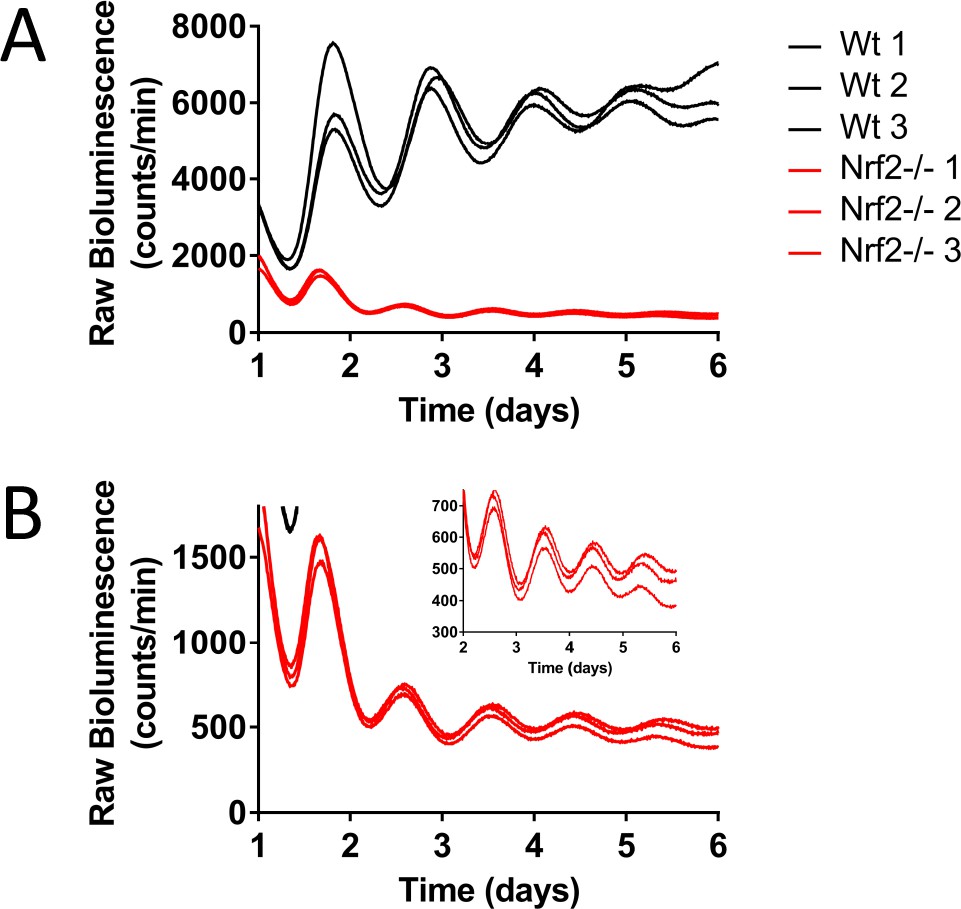
Nrf2 is required for normal circadian timekeeping.
(A) Raw Per2:Luc-driven bioluminescence for each replicate sample from Wt and Nrf2-/- MEFs shown in Figure 2A. (B) Raw Per2:Luc-driven bioluminescence from Nrf2-/- MEFs shown in ‘A’ with an adjusted Y-axis scale. Raw luminescence data collected on days 2–6 is shown in the inset with a further adjusted Y-axis scale.
Figure 2—figure supplement 2

Nrf2 is required for normal circadian timekeeping.
Raw Per2:Luc-driven bioluminescence for each replicate sample from Wt, Nrf2-/-, and Nrf2-/- MEFs stably expressing an Nrf2 expression construct (Nrf2-/- + CMV-Nrf2) shown in Figure 2B.
Figure 2—figure supplement 3
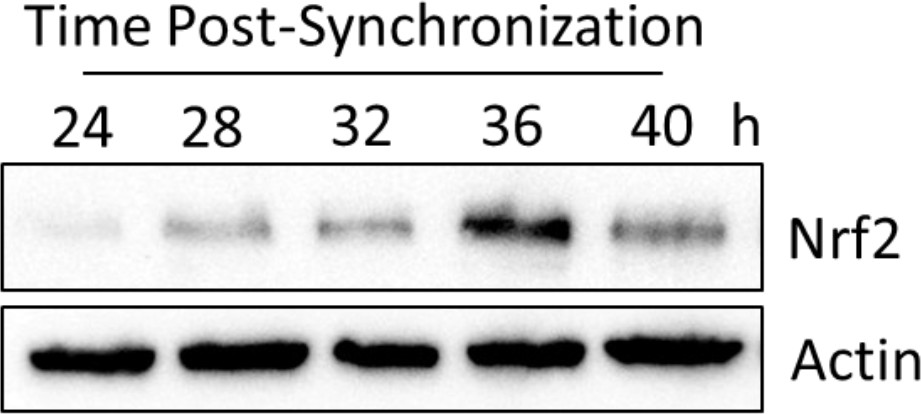
Characterization of Nrf2 circadian expression dynamics for Figure 4D.
NRF2 expression in 50 μg of whole cell lysate from Wt MEFs harvested 24–40 hr post-synchronization. β-Actin, which was unchanged, was used as a loading control. Temporal NRF2 expression patterns are consistent with that which has been reported previously in Rat1 fibroblasts (Pekovic-Vaughan et al., 2014).
Figure 3 with 1 supplement
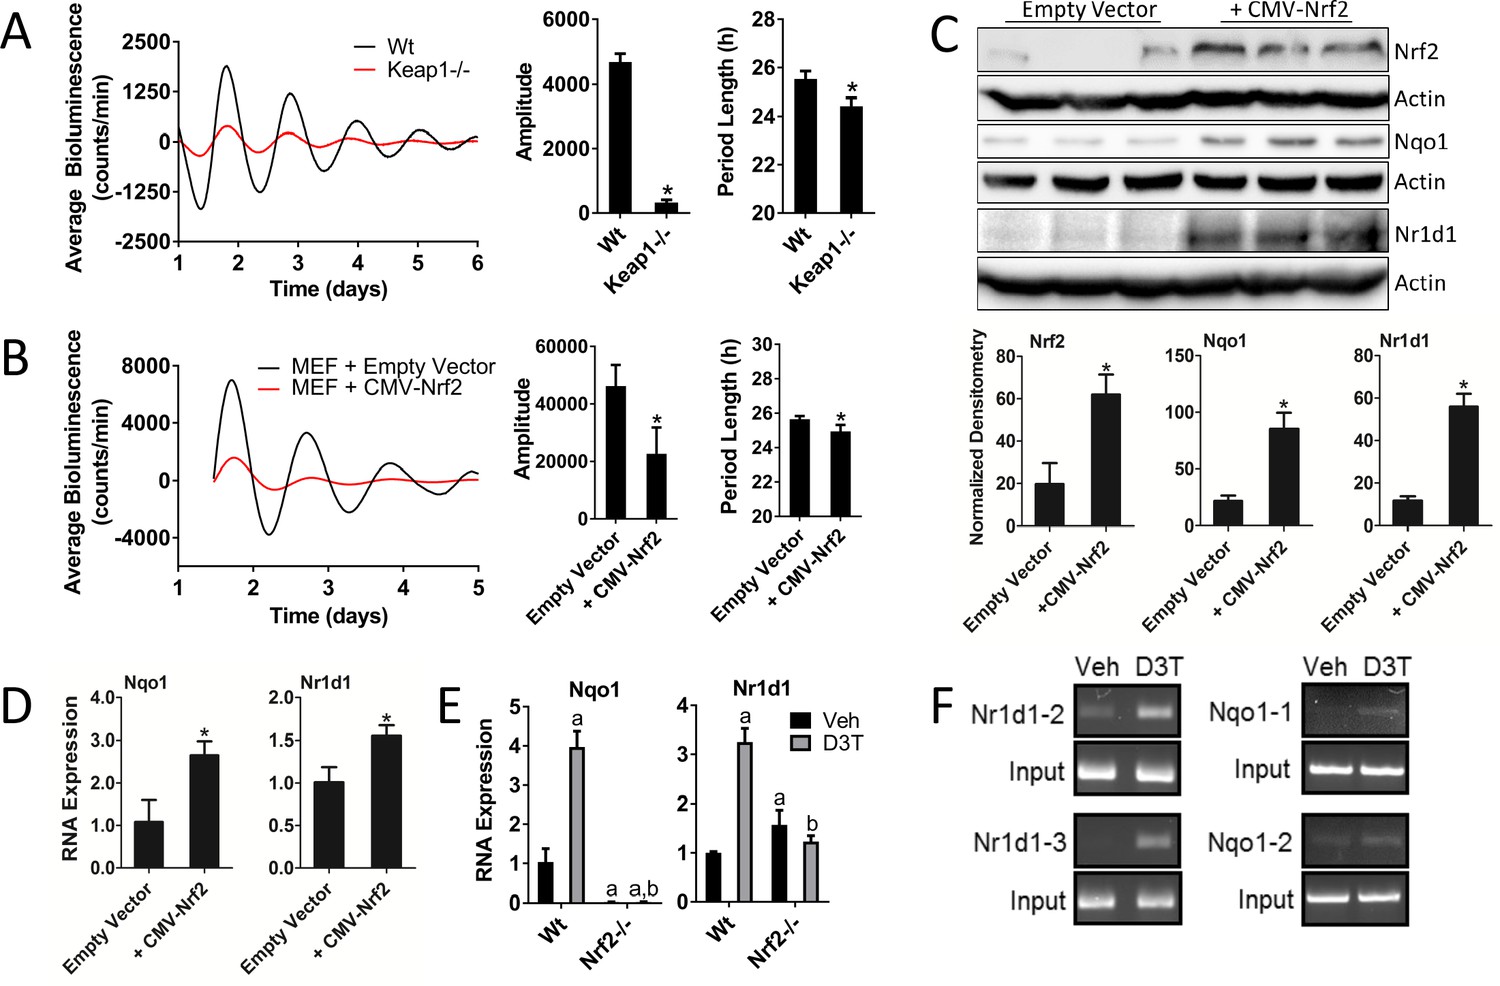
Genetic activation of NRF2 perturbs circadian rhythmicity and regulates Nr1d1 gene expression.
(A) Per2:Luc-driven bioluminescence from Wt and Keap1-/- MEFs. Average luminescence recordings are shown on the left. Amplitude and period length are expressed as an average ±standard deviation (n = 5). Results were analyzed using Student’s t-test; * indicates a p-value<0.05 relative to Wt. (B) Per2:Luc-driven bioluminescence from Wt MEFs stably expressing an empty vector (Wt) or a Nrf2 expression construct (CMV-Nrf2). Average luminescence recordings are shown on the left. Amplitude and period length are expressed as an average ±standard deviation (n = 3). Results were analyzed using Student’s t-test; * indicates a p-value<0.05 relative to Wt. (C) NRF2, NQO1, and NR1D1 protein in 50 μg of whole cell lysate from Wt and Wt +CMV-Nrf2 MEFs. β-Actin, which was unchanged by exogenous Nrf2 expression, was used as a loading control. Values are expressed as the normalized average densitometry ±standard deviation (n = 3). Results were analyzed using Student’s t-test; * indicates a p-value<0.05 relative to the Wt. (D) Nqo1 and Nr1d1 gene expression, in Wt and Wt +CMV-Nrf2 MEFs. Expression values were determined by qPCR and normalized to Gapdh. Data is shown as the average fold-change ±standard deviation (n = 3) relative to the expression in Wt, which was set to 1. Results were analyzed using Student’s t-test; * indicates a p-value<0.05 relative to the Wt. (E) Nqo1 and Nr1d1 gene expression in Wt and Nrf2-/- MEFs treated with DMSO (Veh) or 100 μM D3T for 24 hr. Expression values were determined by qPCR and normalized to Gapdh. Data is shown as the average fold-change ±standard deviation (n = 3) relative to the expression in the Wt Veh, which was set to 1. Results were analyzed using a two-way ANOVA followed by Tukey’s multiple comparisons test; a indicates a p-value<0.05 relative to the Wt Veh control, b indicates a p-value<0.05 relative to treated Wt sample. (F) Chromatin immunoprecipitation-PCR using an NRF2 antibody to detect binding of NRF2 to the indicated gene promoters. Wt MEFs were treated with DMSO (Veh) or 100 μM D3T for 24 hr. Putative ARE sequences can be found in Supplementary file 2 and their location in the respective promoter regions can be found in Figure 3—figure supplement 1.
Figure 3—figure supplement 1
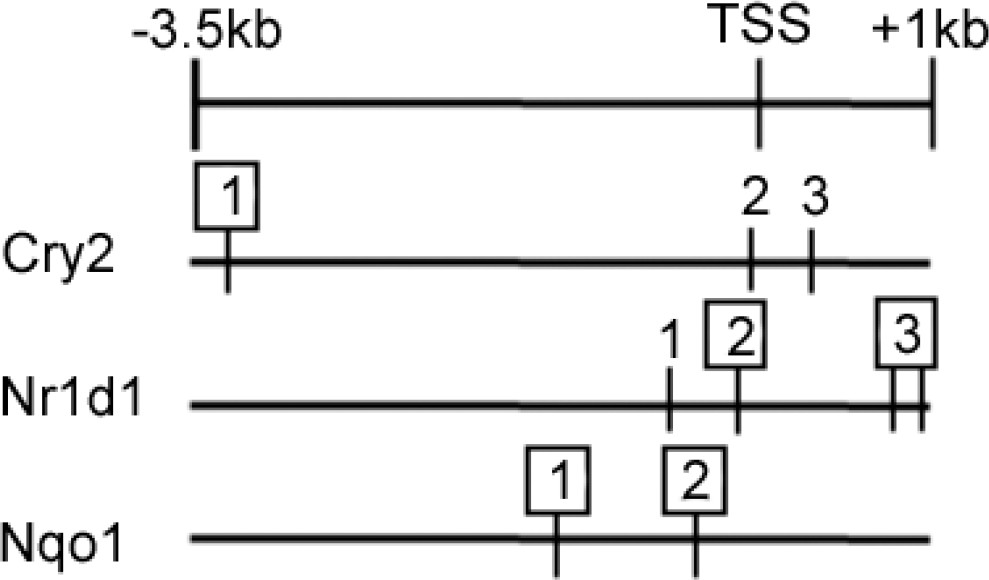
Genetic activation of NRF2 perturbs circadian rhythmicity and regulates Nr1d1 gene expression.
Putative ARE sites in Cry2, Nr1d1, and Nqo1 genes as determined by a position weight matrix implemented in JASPAR using sequence from 3.5 kb upstream to 1 kb downstream of the transcriptional start sites (TSS). The vertical lines indicate each of the predicted binding sites. The number above the vertical lines indicates the primer pair used to amplify the region by ChIP-PCR. The square around the number indicates the sites where binding of NRF2 increased following D3T treatment. Binding to the other sites was not changed by treatment.
Figure 4 with 5 supplements
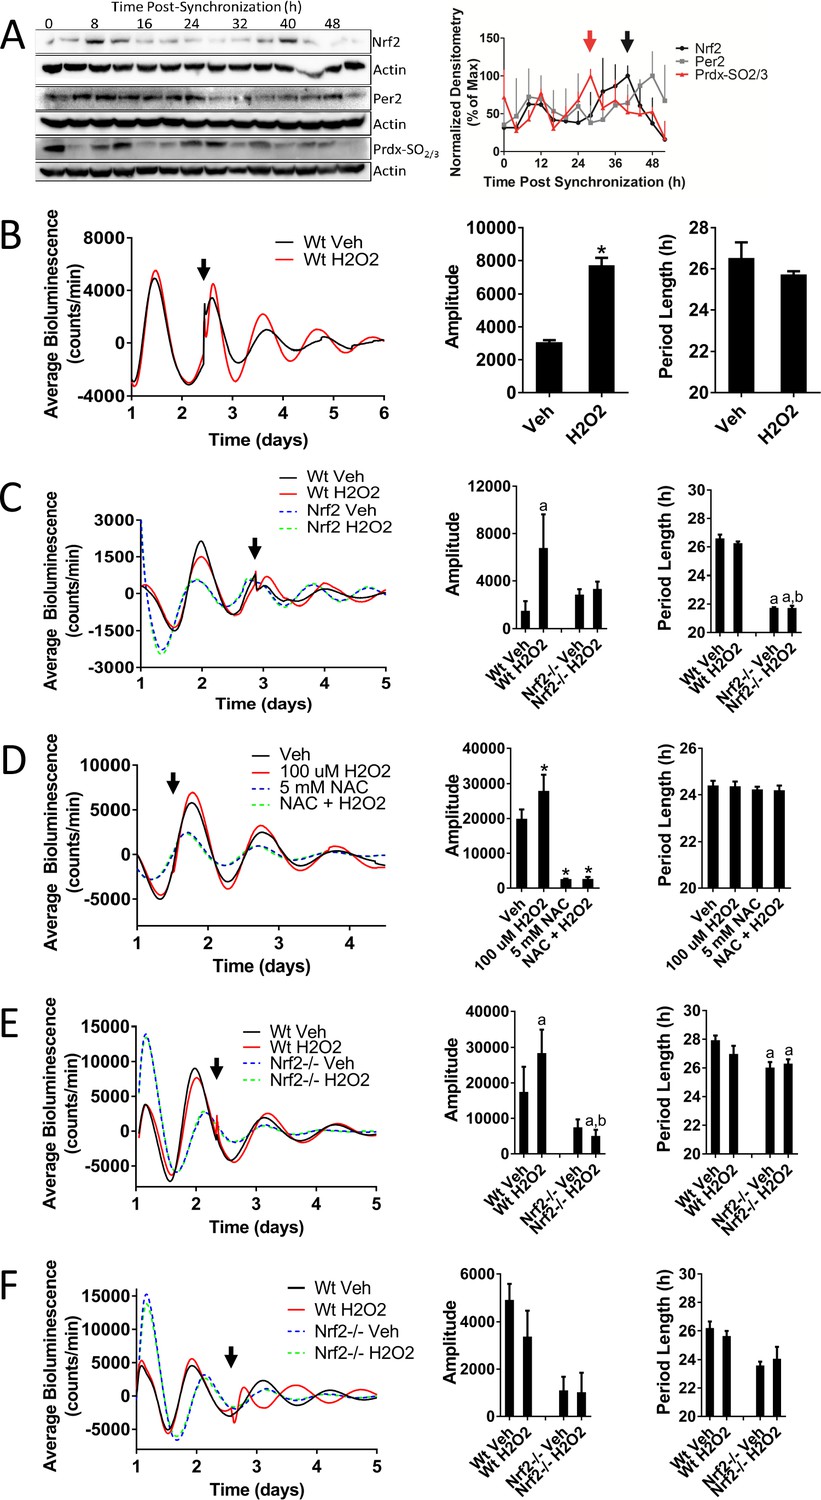
Nrf2 couples the intracellular redox state to the molecular circadian clock, reinforces rhythm amplitude, and shifts circadian phase.
(A) NRF2, PER2, and PRDX-SO2/3 protein in 50 μg of whole cell lysate from differentiated MMH-D3 hepatocytes at the indicated times post-synchronization. β-Actin, which was unchanged across time points, was used as a loading control. Values are expressed as the normalized average densitometry ±standard error mean (n = 3) relative to the time point in which expression was maximal, which was set to 100%. Red and black arrows indicate the time of peak expression of PRDX-SO2/3 and NRF2, respectively. (B) Per2:Luc-driven bioluminescence from Wt MEFs treated with DMSO (0.05%) (Veh) or 100 μM H2O2 at the time indicated by the arrow. Average luminescence recordings are shown on the left. Amplitude and period length are expressed as an average ±standard deviation (n = 3). Results were analyzed using Student’s t-test; * indicates a p-value<0.05 relative to Veh. (C) Per2:Luc-driven bioluminescence from Wt and Nrf2-/- MEFs treated with water (Veh) or 100 μM H2O2 at the time indicated by the arrow. Average luminescence recordings are shown on the left. Amplitude and period length are expressed as an average ±standard deviation (n = 3). Results were analyzed using two-way ANOVA followed by Tukey’s multiple comparisons test; a indicates a p-value<0.05 relative to the Wt Veh control, b indicates a p-value<0.05 relative to the H2O2-treated Wt sample. (D) Per2:Luc-driven bioluminescence from Wt MEFs in the presence of water (Veh) or 5 mM NAC then treated with 100 μM H2O2 at the time indicated by the arrow. Average luminescence recordings are shown on the left. Amplitude and period length are expressed as an average ±standard deviation (n = 3). Results were analyzed using one-way ANOVA followed by Dunnett’s multiple comparisons test; * indicates a p-value<0.05 relative to the Veh control. (E–F) Per2:Luc-driven bioluminescence from Wt and Nrf2-/- MEFs treated with water (Veh) or 100 μM H2O2 at the time indicated by the arrow. Average luminescence recordings are shown on the left in each panel. Amplitude and period length are expressed as an average ±standard deviation (n = 3). Results were analyzed using two-way ANOVA followed by Tukey’s multiple comparisons test; a indicates a p-value<0.05 relative to the Wt Veh control, b indicates a p-value<0.05 relative to the H2O2-treated Wt sample.
Figure 4—figure supplement 1
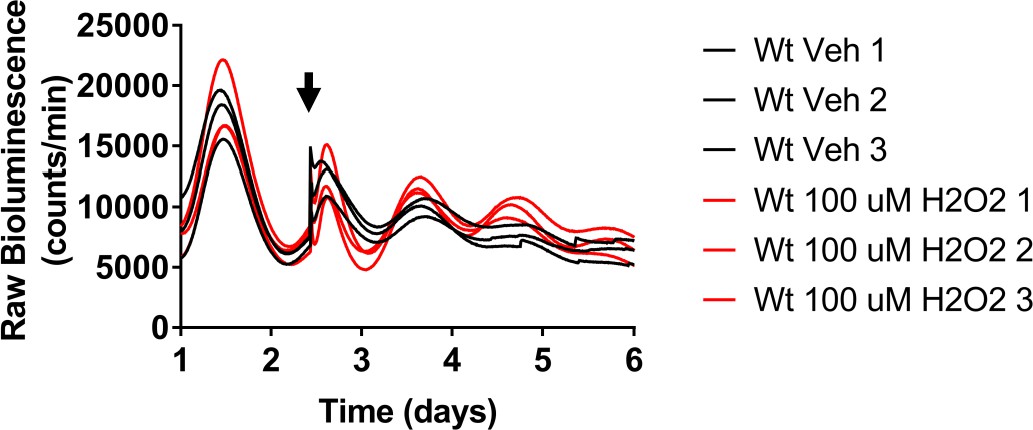
Nrf2 couples the intracellular redox state to the molecular circadian clock, reinforces rhythm amplitude, and shifts circadian phase.
Raw Per2:Luc-driven bioluminescence for each replicate sample from Wt MEFs treated with DMSO (0.05%) (Veh) or 100 μM H2O2, shown in Figure 4B, at the time indicated by the arrow.
Figure 4—figure supplement 2
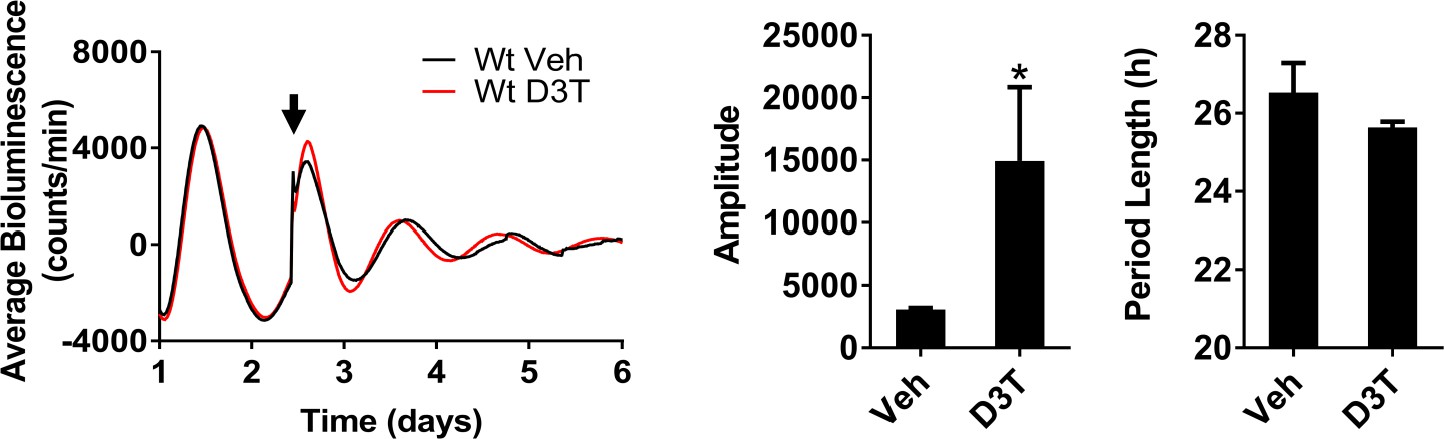
Nrf2 couples the intracellular redox state to the molecular circadian clock, reinforces rhythm amplitude, and shifts circadian phase.
Effects of Nrf2 activation on circadian rhythmicity in Wt MEFs. Per2:Luc-driven bioluminescence from Wt MEFs treated with DMSO (0.05%) (Veh) or 30 μM D3T at the time indicated by the arrow. Average luminescence recordings are shown on the left. Amplitude and period length are expressed as an average ±standard deviation (n = 3). Results were analyzed using Student’s t-test; * indicates a p-value<0.05 relative to Veh.
Figure 4—figure supplement 3
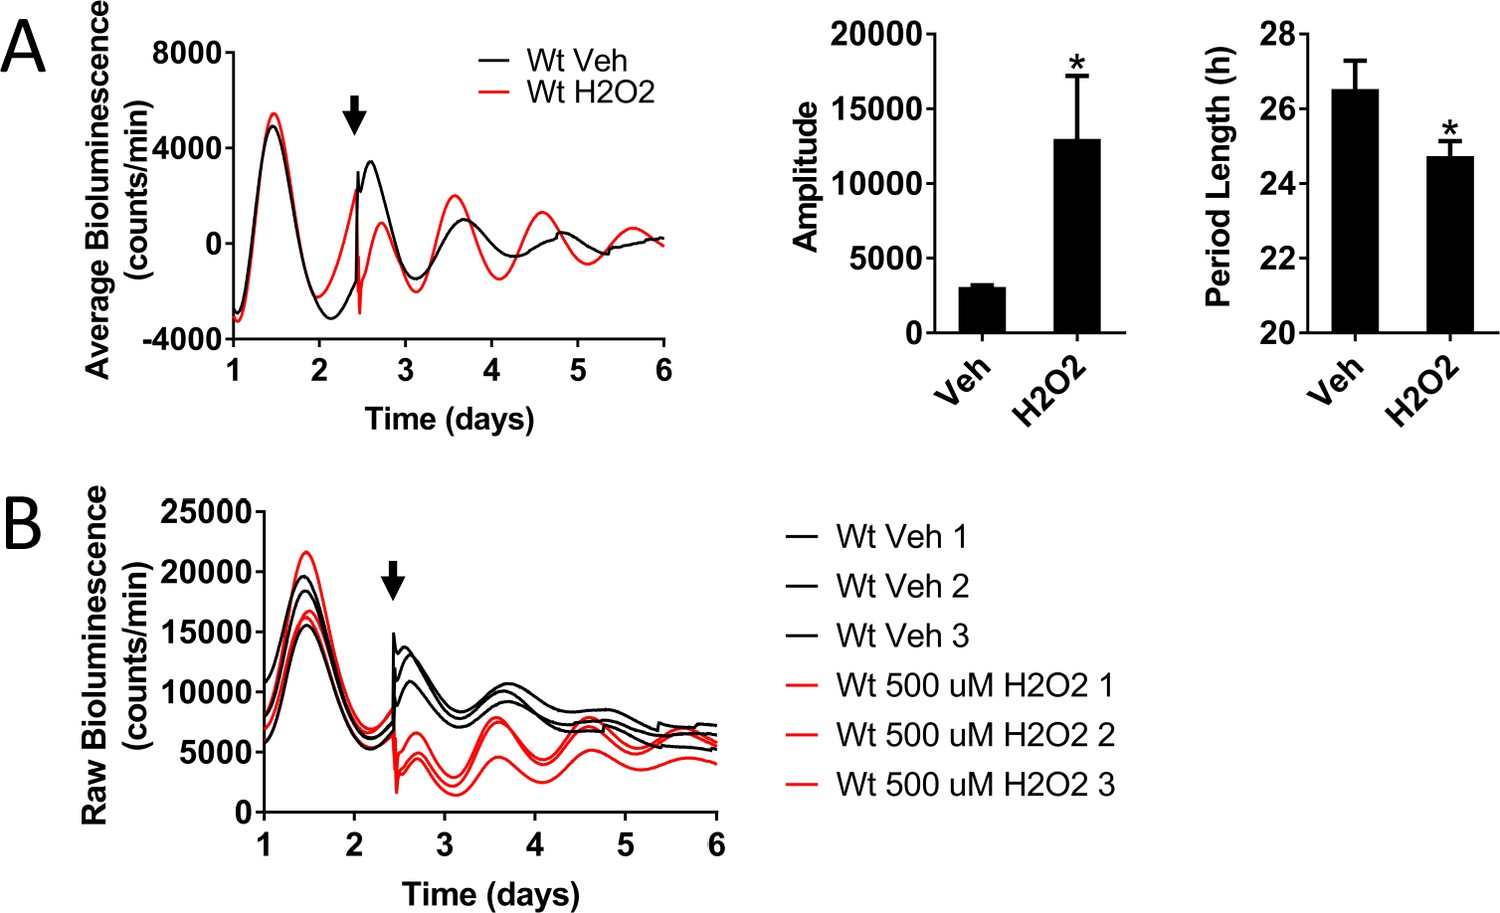
Nrf2 couples the intracellular redox state to the molecular circadian clock, reinforces rhythm amplitude, and shifts circadian phase.
(A) Per2:Luc-driven bioluminescence from Wt MEFs treated with DMSO (0.05%) (Veh) or 500 μM H2O2 at the time indicated by the arrow. Average luminescence recordings are shown on the left. Amplitude and period length are expressed as an average ±standard deviation (n = 3). Results were analyzed using Student’s t-test; * indicates a p-value<0.05 relative to Veh. (B) Raw Per2:Luc-driven bioluminescence for each replicate sample from Wt MEFs treated with DMSO (0.05%) (Veh) or 500 μM H2O2, shown above, at the time indicated by the arrow.
Figure 4—figure supplement 4
Nrf2 couples the intracellular redox state to the molecular circadian clock, reinforces rhythm amplitude, and shifts circadian phase.
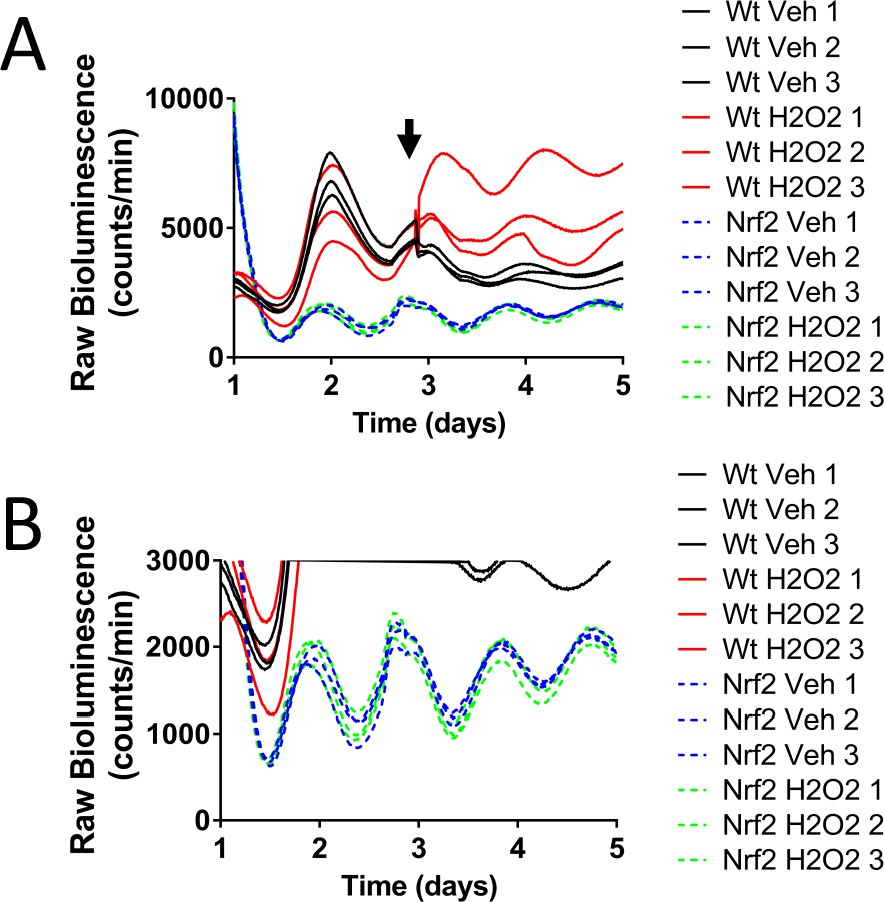
(A) Raw Per2:Luc-driven bioluminescence for each replicate sample from Wt and Nrf2-/- MEFs treated with water (Veh) or 100 μM H2O2 shown in Figure 4C, at the time indicated by the arrow. (B) Raw Per2:Luc-driven bioluminescence from Nrf2-/- MEFs shown in ‘A’ with an adjusted Y-axis scale.
Figure 4—figure supplement 5
Nrf2 couples the intracellular redox state to the molecular circadian clock, reinforces rhythm amplitude, and shifts circadian phase.
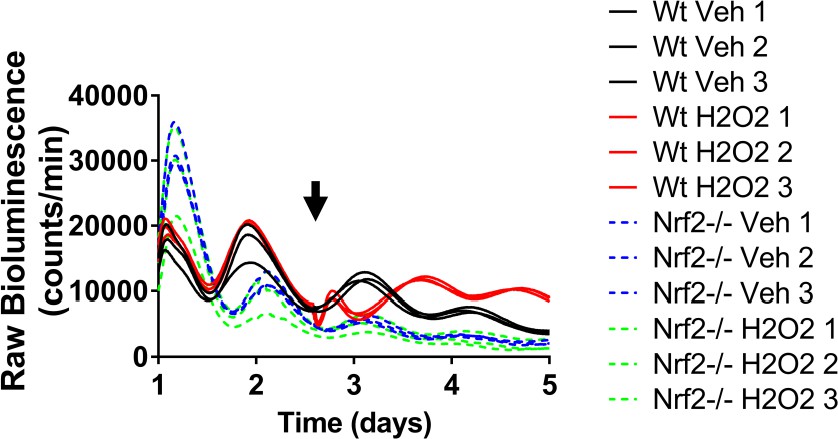
Raw Per2:Luc-driven bioluminescence for each replicate sample from Wt and Nrf2-/- MEFs treated with water (Veh) or 100 μM H2O2, shown in Figure 4F, at the time indicated by the arrow.
Figure 5 with 2 supplements
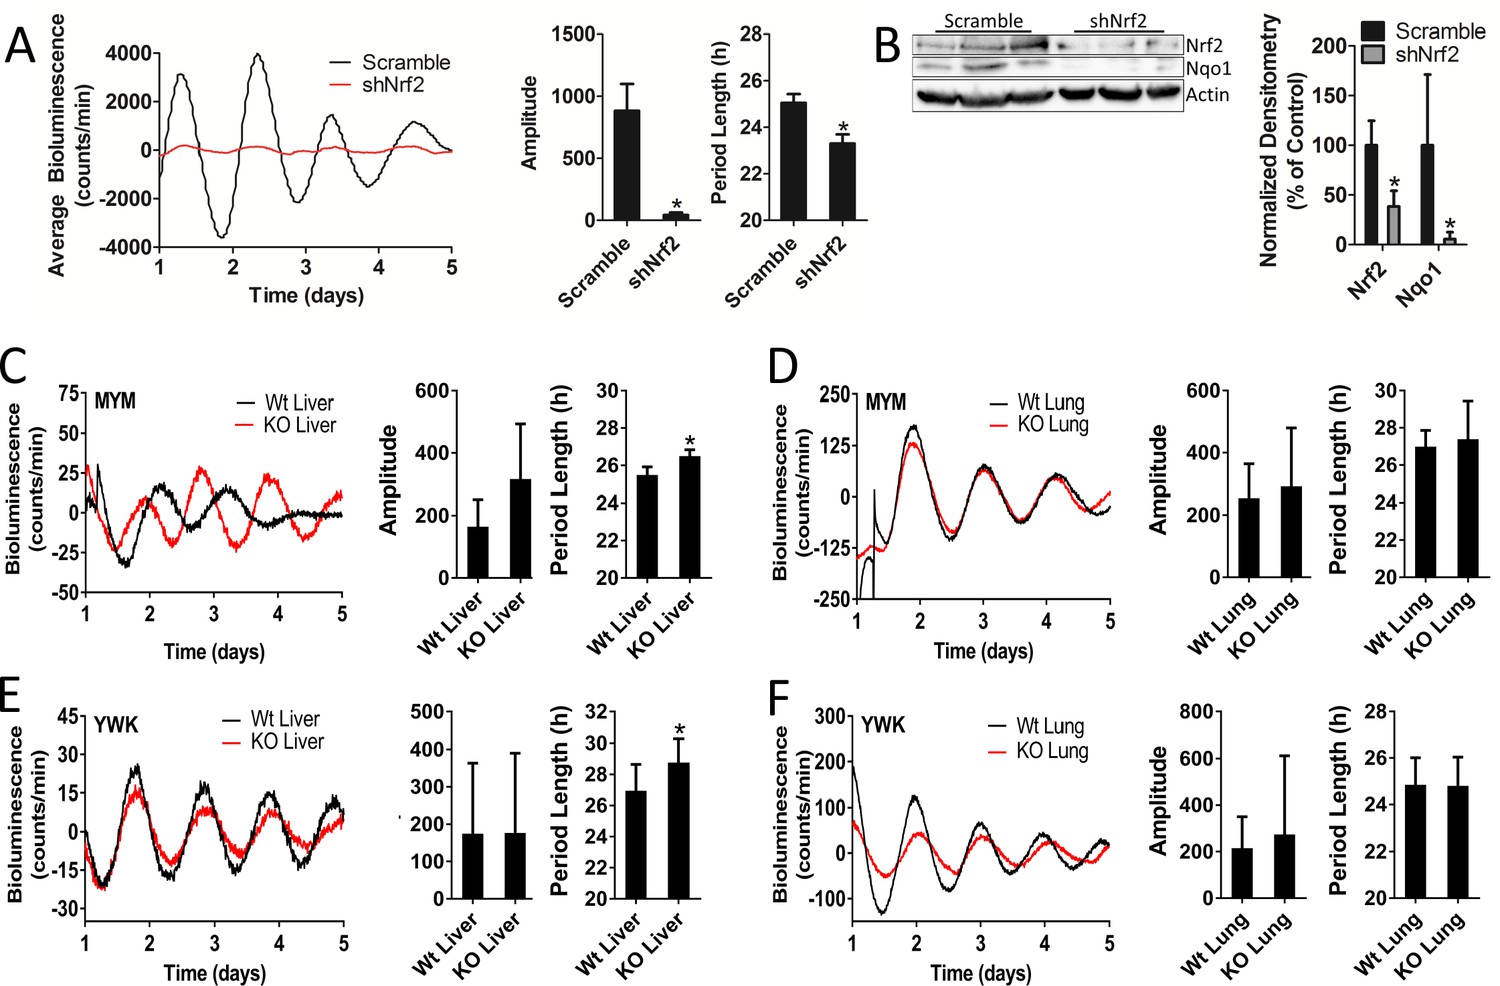
Nrf2 is required to maintain mouse hepatocyte and liver circadian pace.
(A) Per2:Luc-driven bioluminescence from differentiated MMH-D3 hepatocytes stably expressing a scramble shRNA vector (Scramble) or shNrf2. Average luminescence recordings are shown on the left. Amplitude and period length are expressed as an average ±standard deviation (n = 4). Results were analyzed using Student’s t-test; * indicates a p-value<0.05 relative to Scramble. (B) NRF2 and NQO1 protein in 50 μg of whole cell lysate from the MMH-D3 hepatocytes expressing a Scramble shRNA vector or shNrf2. β-Actin, which was unchanged by shRNA expression, was used as a loading control. Values are expressed as the normalized average densitometry ±standard deviation (n = 3) relative to Scramble, which was set to 100%. Results were analyzed using Student’s t-test; * indicates a p-value<0.05 relative to Scramble. (C–D) Per2:Luc-driven bioluminescence from (C) liver and (D) lung organotypic slices from Wt and MYM strain Nrf2-/- (KO) mice. Representative luminescence recordings are shown on the left in each panel. Amplitude and period length are expressed as an average ±standard error mean (n = 5 animals, liver; n = 4 animals, lung; 2–4 organotypic slices/tissue). Results were analyzed using Student’s t-test; * indicates a p-value<0.05 relative to Wt. (E–F) Per2:Luc-driven bioluminescence from (E) liver and (F) lung organotypic slices from Wt and YWK strain Nrf2-/- (KO) mice. Representative luminescence recordings are shown on the left in each panel. Amplitude and period length are expressed as an average ±standard error mean (n = 4 animals, liver; n = 8 animals, lung; 2–4 organotypic slices/tissue). Results were analyzed using Student’s t-test; * indicates a p-value<0.05 relative to Wt.
Figure 5—figure supplement 1

Effect of shNrf2 on circadian rhythmicity in MMH-D3 hepatocytes.
Per2:Luc-driven bioluminescence from differentiated MMH-D3 hepatocytes stably expressing a scramble shRNA vector (Scramble) or two different shNrf2 target constructs (shNrf2-2 and shNrf2-3). Average luminescence recordings are shown on the left. Amplitude and period length are expressed as an average ±standard deviation (n = 4). Results were analyzed using Student’s t-test; * indicates a p-value<0.05 relative to Scramble.
Figure 5—figure supplement 2
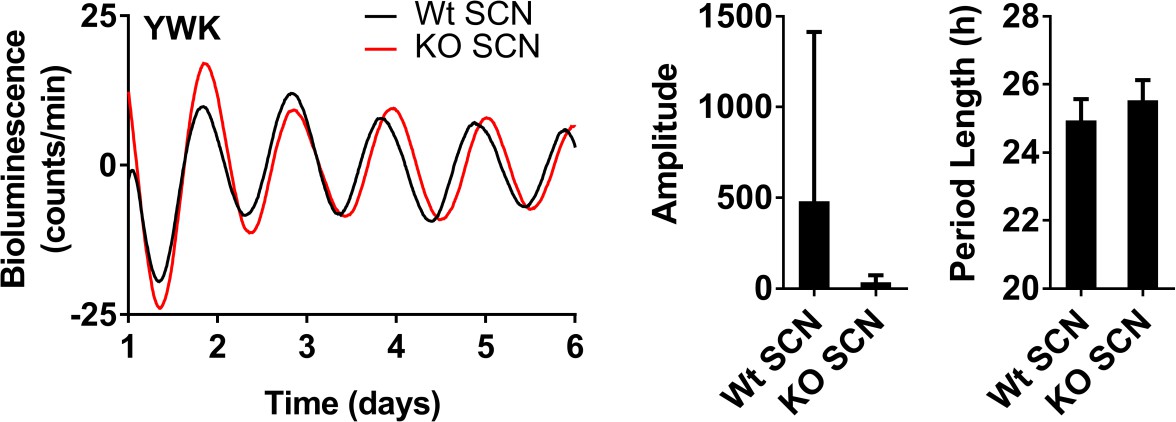
SCN explant circadian rhythmicity in Wt and Nrf2-null mice.
Per2:Luc-driven bioluminescence from SCN organotypic slices from Wt and YWK strain Nrf2-/- (KO) mice. Representative bioluminescence recordings are shown. Amplitude and period length are expressed as an average ±standard error mean (n = 5 animals). SCN organotypic slice cultures of both genotypes showed low amplitude rhythms; however, slices from Wt animals were highly variable with amplitude measurements ranging from 4.4 to 2510.7.
Figure 6 with 2 supplements
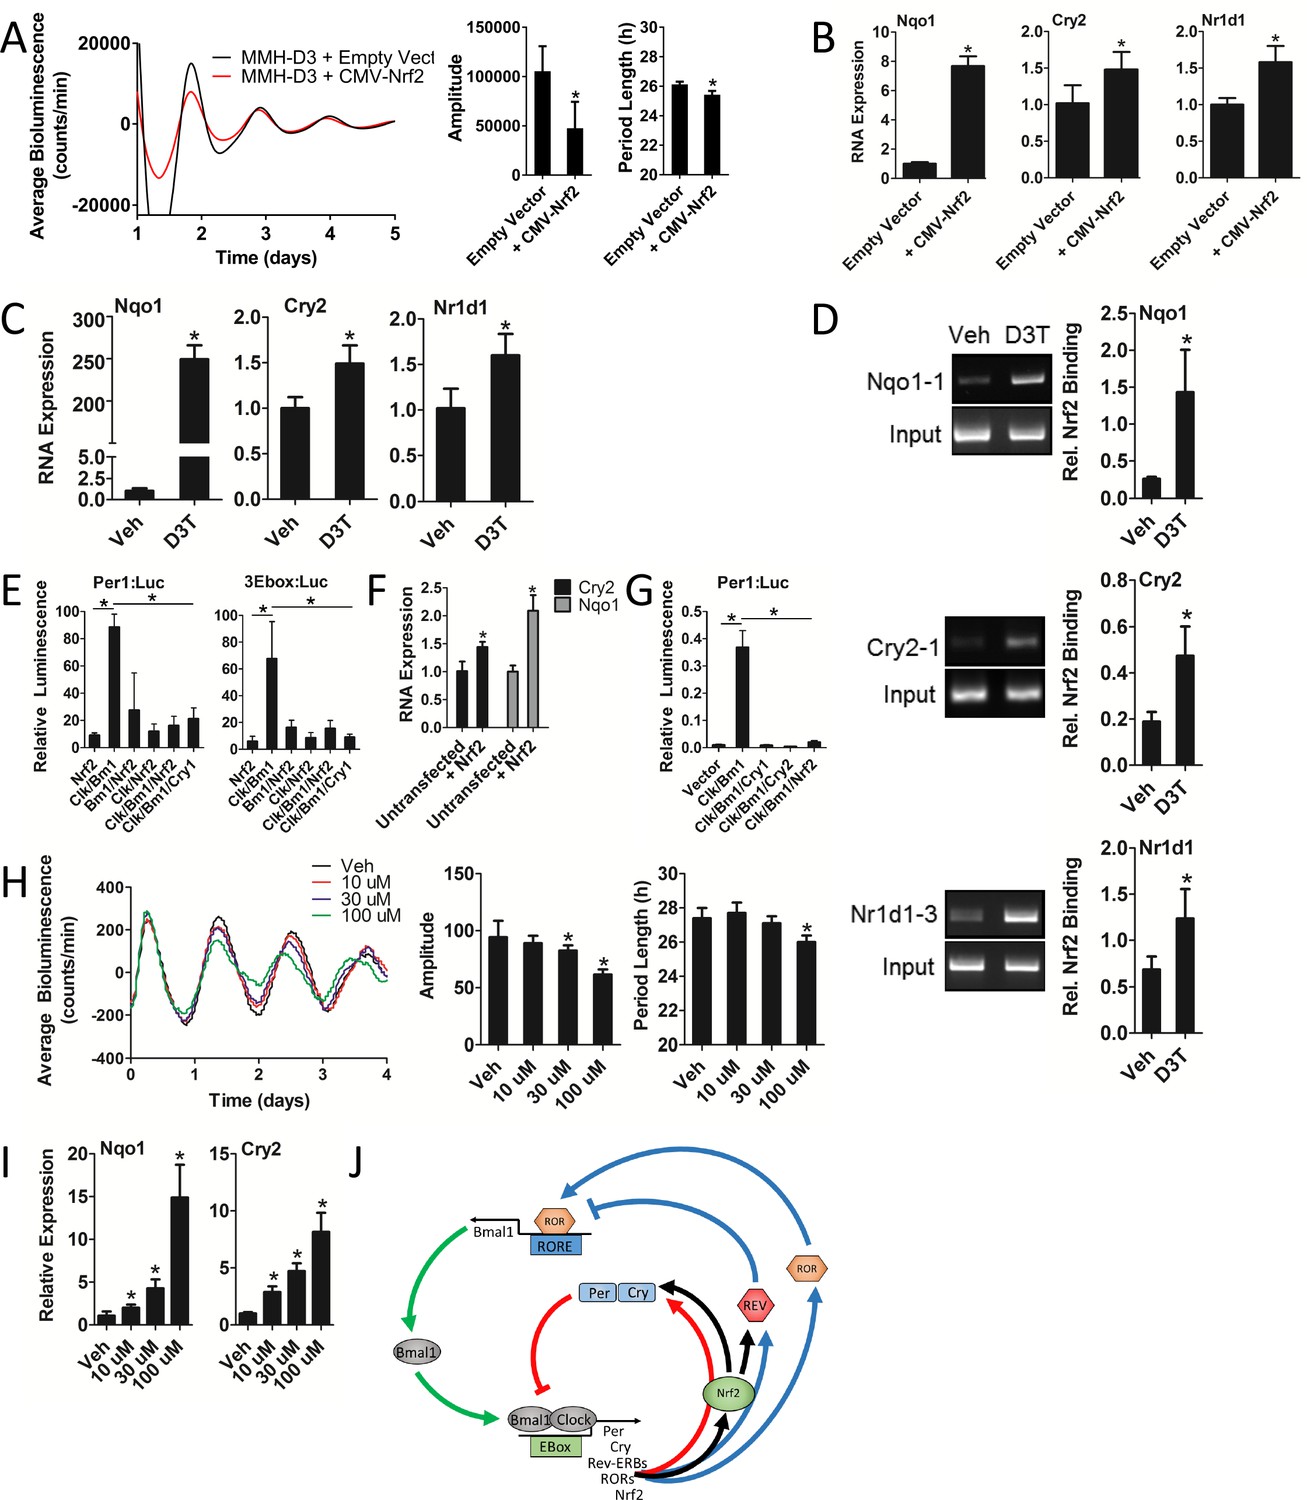
Nrf2 regulates Cry2 expression, indirectly repressing CLOCK/BMAL1 transcriptional activity and disrupting circadian rhythmicity in mouse hepatocytes.
(A) Per2:Luc-driven bioluminescence in differentiated MMH-D3 hepatocytes stably expressing an empty vector (Empty Vector) or a Nrf2-expression construct (CMV-Nrf2). Average luminescence recordings are shown on the left. Amplitude and period length are expressed as an average ±standard deviation (n = 3). Results were analyzed using Student’s t-test; * indicates a p-value<0.05 relative to the Empty Vector. (B) Nqo1, Cry2, and Nr1d1 gene expression in the differentiated MMH-D3 hepatocytes expressing an empty vector or CMV-Nrf2 used in ‘A’. Expression values were determined by qPCR and normalized to Gapdh. Data is shown as the average fold-change ±standard deviation (n = 3) relative to the expression in the Empty Vector, which was set to 1. Results were analyzed using Student’s t-test; * indicates a p-value<0.05 relative to the Empty Vector. (C) Nqo1, Cry2, and Nr1d1 gene expression in differentiated MMH-D3 hepatocytes treated with DMSO (Veh) or 300 μM D3T for 7 hr. Expression values were determined by qPCR and normalized to Gapdh. Data is shown as the average fold-change ±standard deviation (n = 3) relative to the expression in Veh, which was set to 1. Results were analyzed using Student’s t-test; * indicates a p-value<0.05 relative to Veh. (D) Chromatin immunoprecipitation-PCR using an NRF2 antibody to detect binding of NRF2 to the indicated gene promoters. Differentiated MMH-D3 hepatocytes treated with DMSO (Veh) or 300 μM D3T for 7 hr. Putative ARE sequences can be found in Supplementary file 2 and their location in the respective promoter regions can be found in Figure 3—figure supplement 1. Quantitation by densitometry of NRF2 binding to the enhancers is indicated to the right of each representative picture. Data is shown as an average ±standard deviation (n = 3–5). Results were analyzed using Student’s t-test; * indicates a p-value≤0.05 relative to Veh. (E) CLOCK/BMAL1-mediated luciferase activity generated from Per1- or triplicate synthetic E-box-driven (3Ebox) luciferase reporter constructs in HEK293T cells as a function of transfection of the indicated expression constructs, including pLV7-P(CMV)-Nrf2. Data are shown as the average luminescence ±standard deviation (n = 3) normalized to renilla luminescence to control for transfection efficiency. Results were analyzed using a one-way ANOVA followed by Dunnett’s multiple comparisons test; * indicates a p-value<0.05 relative to the Clock/Bmal1 (Clk/Bm1) positive control. (F) Cry2 and Nqo1 gene expression in untransfected or pLenti-Nrf2 transfected HEK293T cells. Expression values were determined by qPCR and normalized to Gapdh. Data is shown as the average fold-change ±standard deviation (n = 3) relative to the expression in the untransfected cells, which was set to 1. Results were analyzed using Student’s t-test; * indicates a p-value<0.05 relative to the untransfected control. (G) CLOCK/BMAL1-mediated luciferase activity generated from a Per1-luciferase reporter construct in HEK293T cells as a function of transfection of the indicated expression constructs, including pLenti-Nrf2. Data are shown as the average luminescence ±standard deviation (n = 3) normalized to renilla luminescence to control for transfection efficiency. Results were analyzed using a one-way ANOVA followed by Dunnett’s multiple comparisons test; * indicates a p-value<0.05 relative to the Clock/Bmal1 (Clk/Bm1) positive control. (H) Per2:Luc-driven bioluminescence from differentiated MMH-D3 hepatocytes in the presence of DMSO (Veh) or D3T at the indicated concentrations. Average luminescence recordings are shown on the left. Amplitude and period length are expressed as an average ±standard deviation (n = 8). Results were analyzed using Student’s t-test; * indicates a p-value<0.05 relative to the Veh. (I) Nqo1 and Cry2 gene expression in differentiated MMH-D3 hepatocytes treated with DMSO (Veh) or the indicated concentrations of D3T. Expression values were determined by qPCR and normalized to Gapdh. Data is shown as the average fold-change ±standard deviation (n = 3) relative to the expression in Veh, which was set to 1. Results were analyzed using Student’s t-test; * indicates a p-value<0.05 relative to Veh. (J) Schema showing the proposed regulation of both core and stabilizing circadian clock loops in mouse hepatocytes. NRF2 appears to be tightly integrated into the clock mechanism. As a result of being an E-box-mediated output (Pekovic-Vaughan et al., 2014) and a transcriptional regulator of Cry2 and Nr1d1, NRF2 input can both reinforce and shift the circadian phase, thus forming a redox sensitive interlocking loop.
Figure 6—figure supplement 1

D3T-induced NRF2 binding to AREs in the Nr1d1 and Nqo1 promoter regions.
Chromatin immunoprecipitation-PCR using an NRF2 antibody to detect binding of NRF2 to the indicated gene promoters. Differentiated MMH-D3 hepatocytes were treated with DMSO (Veh) or 300 μM D3T for 7 hr. NRF2 binding to the ARE enhancers in these genes is consistent with what has been demonstrated elsewhere (Yang et al., 2014; Nioi et al., 2003). Putative ARE sequences can be found in Supplementary file 2 and their location in the respective promoter regions can be found in Figure 3—figure supplement 1.
Figure 6—figure supplement 2
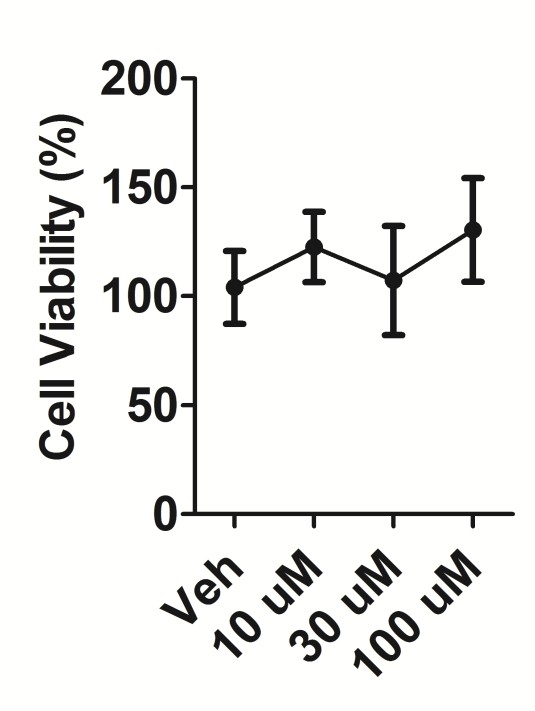
D3T cytotoxicity in MMH-D3 hepatocytes.
D3T cytotoxicity determined by MTS cytotoxicity assay in differentiated MMH-D3 hepatocytes treated with DMSO (Veh) or the indicated concentrations of D3T for 24 hr. Data is shown as the average ±standard deviation (n = 5) relative to the Veh control, which was set to 100%.
Author response image 1

Author response image 2
Tables
Key resources table
| Reagent type (species) or resource | Designation | Source or reference | Identifiers | Additional information |
|---|---|---|---|---|
| Gene (Mus musculus) | Nfe2l2 | NA | MGI:108420 | |
| Strain, strain background (M. musculus) | YWK | PMID: 8943040 | Nrf2-/-; YWK Strain | |
| Strain, strain background (M. musculus) | MYM | PMID: 9240432 | Nrf2-/-; MYM Strain | |
| Strain, strain background (M. musculus) | PER2::LUC | PMID: 14963227 | PER2::LUC | |
| Genetic reagent (M. musculus) | Per2:Luc | PMID: 23052244; 24699442; 18454201; 17482552 | Per2:Luc | |
| Cell line (M. musculus) | Wt MEF Per2:Luc | this paper | Wt MEF Per2:Luc | Immortalized Wt MEF cell line stably expressing a Per2:Luc reporter. Created by Thomas R. Sutter's Lab at the University of Memphis. |
| Cell line (M. musculus) | Nrf2-/- MEF Per2:Luc | this paper | Nrf2-/- MEF Per2:Luc | Immortalized Nrf2-/- MEF cell line stably expressing a Per2:Luc reporter. Created by Thomas R. Sutter's Lab at the University of Memphis. |
| Cell line (M. musculus) | Keap1-/- MEF Per2:Luc | this paper | Keap1-/- MEF Per2:Luc | Immortalized Keap1-/- MEF cell line stably expressing a Per2:Luc reporter. Created by Thomas R. Sutter's Lab at the University of Memphis. |
| Cell line (M. musculus) | MMH-D3 Per2:Luc | PMID: 24699442 | MMH-D3 Per2:Luc | |
| Antibody | anti-Nrf2 (rabbit polyclonal) | Santa Cruz | Santa Cruz SC-722 | (1:500) |
| Antibody | anti-Nqo1 (rabbit monoclonal) | Abcam | Abcam AB80588 | (1:10,000) |
| Antibody | anti-Nr1d1 (rabbit monoclonal) | Cell Signaling | Cell Signaling 13418 | (1:500) |
| Antibody | anti-Prdx-SO2/3 (rabbit polyclonal) | Thermo Fisher | Thermo LF-PA0004 | (1:1000) |
| Antibody | anti-Per2 (rabbit polyclonal) | ProteinTech | ProteinTech 20359 | (1:200) |
| Antibody | anti-Nrf2 (rabbit polyclonal) | Diagenode | Diagenode C15410242 | (2 ug) |
| Recombinant DNA reagent | shNrf2 (shRNA) | Sigma | Sigma NM_010902:TRCN0000012128 | |
| Recombinant DNA reagent | shNrf2 (shRNA) | this paper | shNrf2-1 | shNrf2 lentiviral vectorwas developed byAndrew Liu at theUniversity of Memphis. Target sequence is described in Supplementary file 4. |
| Recombinant DNA reagent | shNrf2-2 (shRNA) | this paper | shNrf2-2 | shNrf2 lentiviral vectorwas developed byAndrew Liu at theUniversity of Memphis. Target sequenceis described in Supplementary file 4. |
| Recombinant DNA reagent | shNrf2-3 (shRNA) | this paper | shNrf2-3 | shNrf2 lentiviral vectorwas developed byAndrew Liu at theUniversityof Memphis. Target sequenceis described in Supplementary file 4. |
| Recombinant DNA reagent | CMV-Nrf2 (Expression vector) | this paper | CMV-Nrf2 | CMV-driven Nrf2expression constructwas created inthe pLV7 lentiviral vector backbone usingGateway recombination. Primers to amplifyNrf2 cDNA and shuttlethe ORF into pLV7 are described in Supplementary file 3. |
| Recombinant DNA reagent | pLENTI-Nrf2 (Expression vector) | Origene | Origene MR226717L1 | |
| Recombinant DNA reagent | pGL3-P(Per1)-dLuc | PMID: 22692217 | Per1:Luc | |
| Recombinant DNA reagent | pGL3-3xEbox-P(SV40)-dLuc | PMID: 22692217 | 3xEbox:Luc | |
| Commercial assay or kit | Lenti-X p24 Rapid Titer Kit | Clontech | Clontech 632200 | |
| Chemical compound, drug | Hydrogen peroxide | Sigma | Sigma 216763 | |
| Chemical compound, drug | D3T | LKT Laboratories | LKT Laboratories D0010 | |
| Software, algorithm | LumiCycle Analysis | Actimetrics | Version 2.31 |
Additional files
-
Supplementary file 1
Primer Pairs Used in Chip-PCR.
- https://doi.org/10.7554/eLife.31656.024
-
Supplementary file 2
Putative ARE enhancer elements identified by JASPAR.
- https://doi.org/10.7554/eLife.31656.025
-
Supplementary file 3
Genotyping and Nrf2 cloning primer pairs.
- https://doi.org/10.7554/eLife.31656.026
-
Supplementary file 4
shRNA target sequences.
- https://doi.org/10.7554/eLife.31656.027
-
Supplementary file 5
qPCR primer pairs.
- https://doi.org/10.7554/eLife.31656.028
-
Transparent reporting form
- https://doi.org/10.7554/eLife.31656.029
Download links
A two-part list of links to download the article, or parts of the article, in various formats.
Downloads (link to download the article as PDF)
Open citations (links to open the citations from this article in various online reference manager services)
Cite this article (links to download the citations from this article in formats compatible with various reference manager tools)
NRF2 regulates core and stabilizing circadian clock loops, coupling redox and timekeeping in Mus musculus
eLife 7:e31656.
https://doi.org/10.7554/eLife.31656


