Hsf1 and Hsp70 constitute a two-component feedback loop that regulates the yeast heat shock response
- Whitehead Institute for Biomedical Research, United States
- Boston University, United States
- Louisiana State University Health Sciences Center, United States
- Harvard University, United States
Figures
Figure 1 with 1 supplement

Transcriptional induction of Hsp70 during heat shock is required for Hsf1 deactivation but not proteostasis.
(A) The Hsf1 regulatory circuit described by the mathematical model. To generate the feedback-severed yeast strain (∆FBL), all four Hsp70 paralogs (SSA1/2/3/4) were deleted from the genome and 2 copies of SSA2 under the control of the Hsf1-independent TEF1 promoter were integrated to achieve comparable Hsp70 expression under basal conditions. (B) Simulated and experimental heat shock time courses comparing the HSE-YFP reporter in wild type and ∆FBL cells. The experimental points represent the average of the median HSE-YFP level in three biological replicates, and the error bars are the standard deviation of the replicates. (C) Western blot of the expression of Hsp70 (Ssa1/2), the Hsf1 and glycolytic enzyme GAPDH (Tdh1/2/3) in wild type and ∆FBL cells under non-heat shock and 60 min heat shock conditions. The values for the ratio of Ssa1/2:GAPDH are the average of two biological replicates. (D) Dilution series spot assay of wild type, ssa1/2∆ and ∆FBL cells grown at 30°C and 37°C for 36 hr. (E) Wild type and ∆FBL cells expressing the Hsp104-mKate aggregation reporter along with the HSE-YFP imaged over a heat shock time course showing transient accumulation of Hsp104 foci and sustained induction of HSE-YFP levels in the ∆FBL cells. (F) Quantification of the number of Hsp104-mKate foci in wild type and ∆FBL cells over a heat shock time course. N > 100 cells for each time point. Error bars represent the standard error of the mean.
Figure 1—figure supplement 1
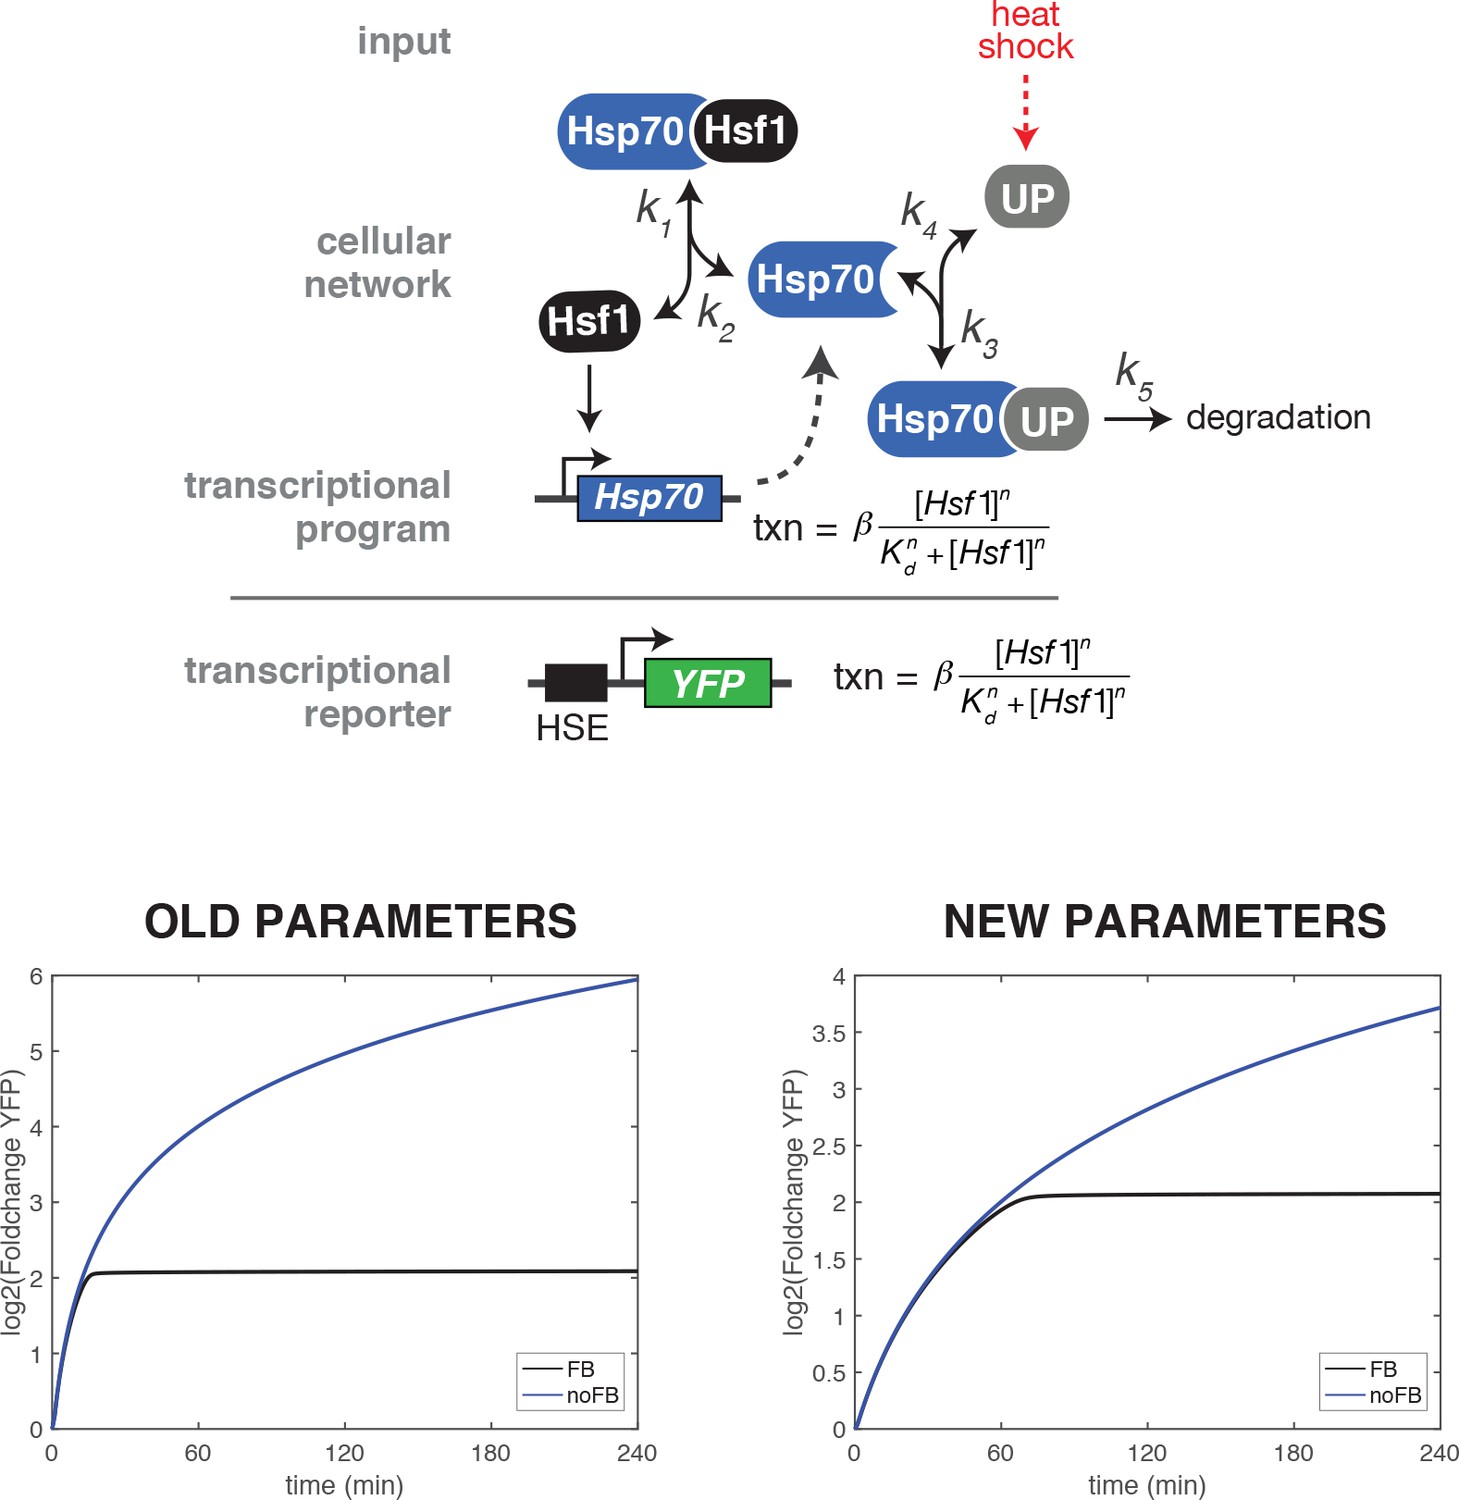
Comparison of heat shock time course simulations of the wild type and ∆FBL mutant using the original and updated values for the parameter describing the strength of the transcriptional induction (β).
The original value for β was 1.778 min−1 and the updated value is 0.3557 min−1.
Figure 2 with 1 supplement
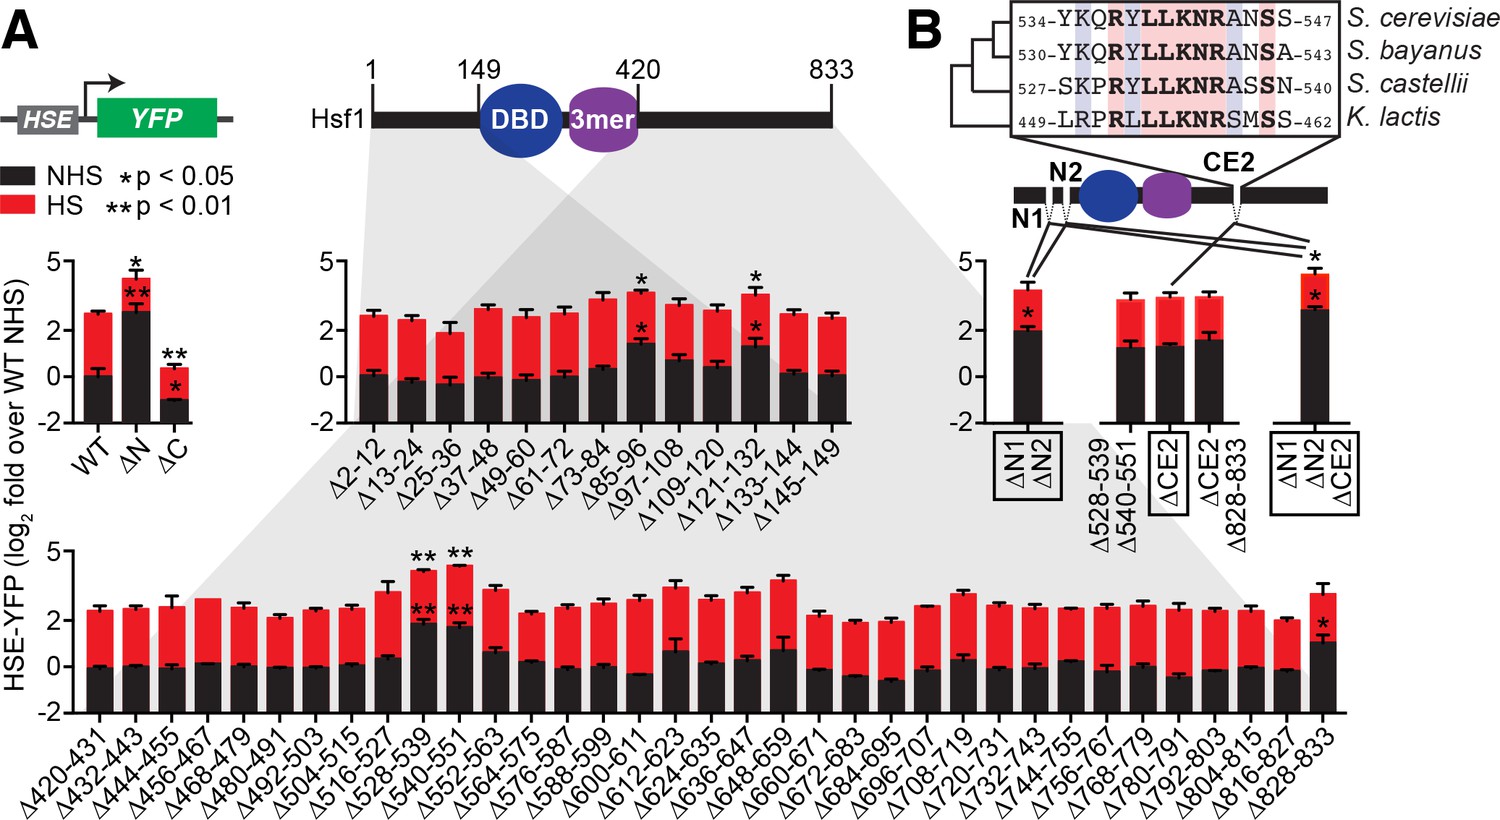
Identification of negative regulatory determinants in the N- and C-termini of Hsf1.
(A) Screen for functional determinants. The indicated Hsf1 mutants were integrated into the genome as the only copy of Hsf1 expressed from the endogenous HSF1 promoter in a strain expressing the HSE-YFP reporter. Hsf1∆N is a deletion of the first 145 amino acids following the methionine; Hsf1∆C is a truncation of the last 409 amino acids of Hsf1, retaining the first 424 amino acids. Each mutant in the scanning deletion analysis is missing a stretch of 12 amino acids in either the N-terminal 149 residues or final 414 C-terminal residues. Each strain was assayed in triplicate for its HSE-YFP level under non-heat shock (NHS) and heat shock (HS) conditions by flow cytometry. The error bars are the standard deviation of the replicates. Statistical significance was determined by one-way ANOVA (*p<0.05; **p<0.01). (B) Analysis of double and triple mutants of the functional segments. ∆N1 and ∆N2 represent ∆85–96 and ∆121–132, respectively, and each independently contribute to Hsf1 activity. CE2 is a region spanning the consecutive C-terminal determinants defined in (A) that is conserved among a subset of fungal species. Statistical significance was determined by one-way ANOVA comparing each double mutant to both of the single mutant parents (*p<0.05 for both tests).
Figure 2—figure supplement 1
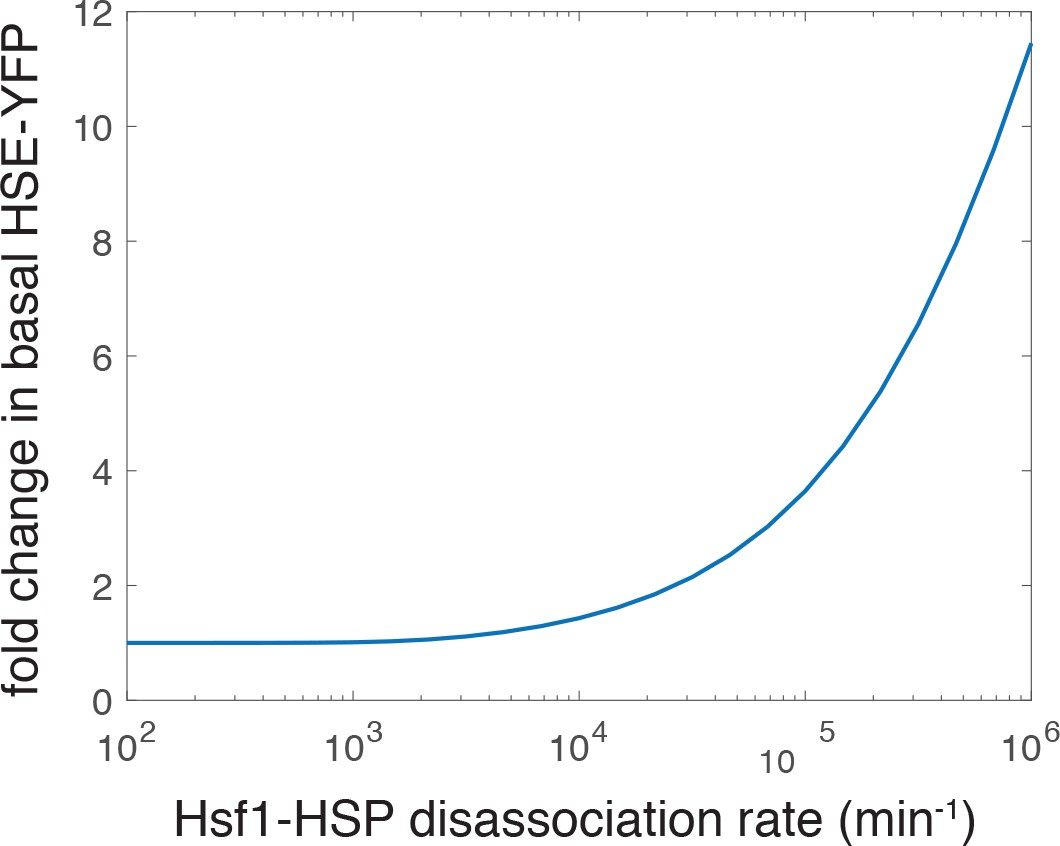
Simulation showing an increase in the basal level of the HSE-YFP reporter as a function of increased dissociation rate (decreased affinity) of the Hsp70•Hsf1 interaction.
The ‘wild type’ rate is 2.783 min−1 as in the previous iteration of the model (not shown on the graph) (Zheng et al., 2016).
Figure 3 with 1 supplement
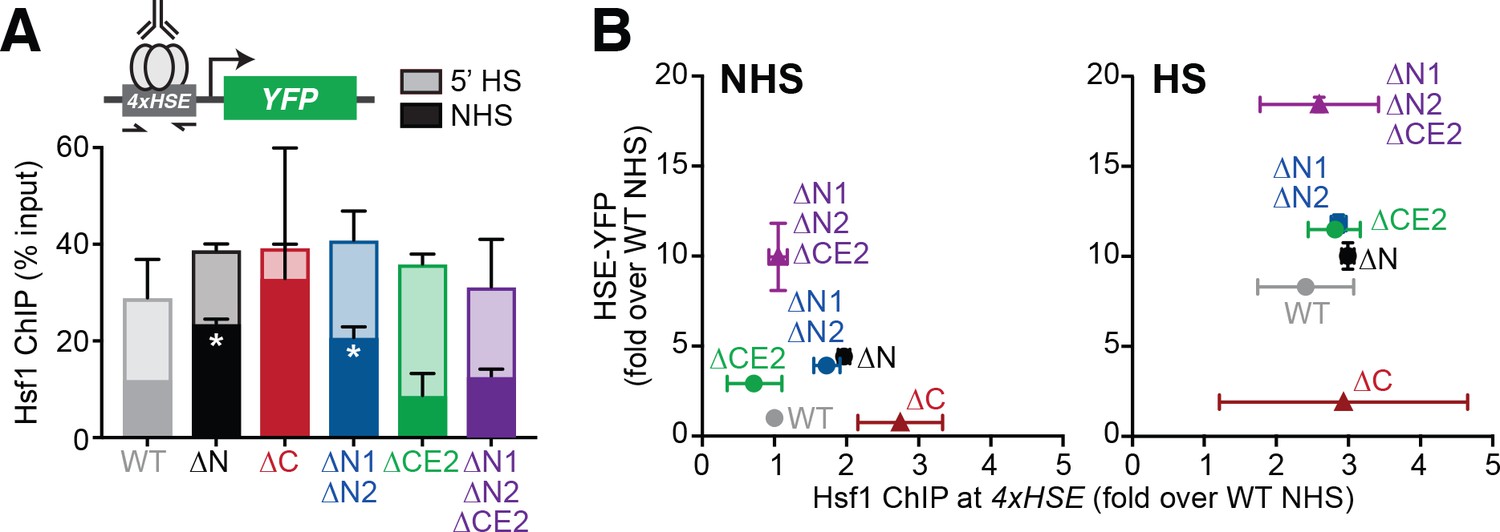
The Hsf1 N-terminus regulates DNA binding while CE2 controls transactivation.
(A) Chromatin immunoprecipitation of Hsf1 followed by quantitative PCR of the 4xHSE promoter in the indicated Hsf1 wild type and mutant strains under non-heat shock and heat shock conditions (solid and outlined bars, respectively). Error bars show the standard deviation of biological replicates. Statistical significance was determined by one-way ANOVA (*p<0.05; **p<0.01). (B) Relationship between Hsf1 binding at the 4xHSE promoter as determined by ChIP-qPCR and transcriptional activity as measured by levels of the HSE-YFP reporter under non-heat shock (NHS) and heat shock (HS) conditions for the panel of mutants assayed in (A).
Figure 3—figure supplement 1
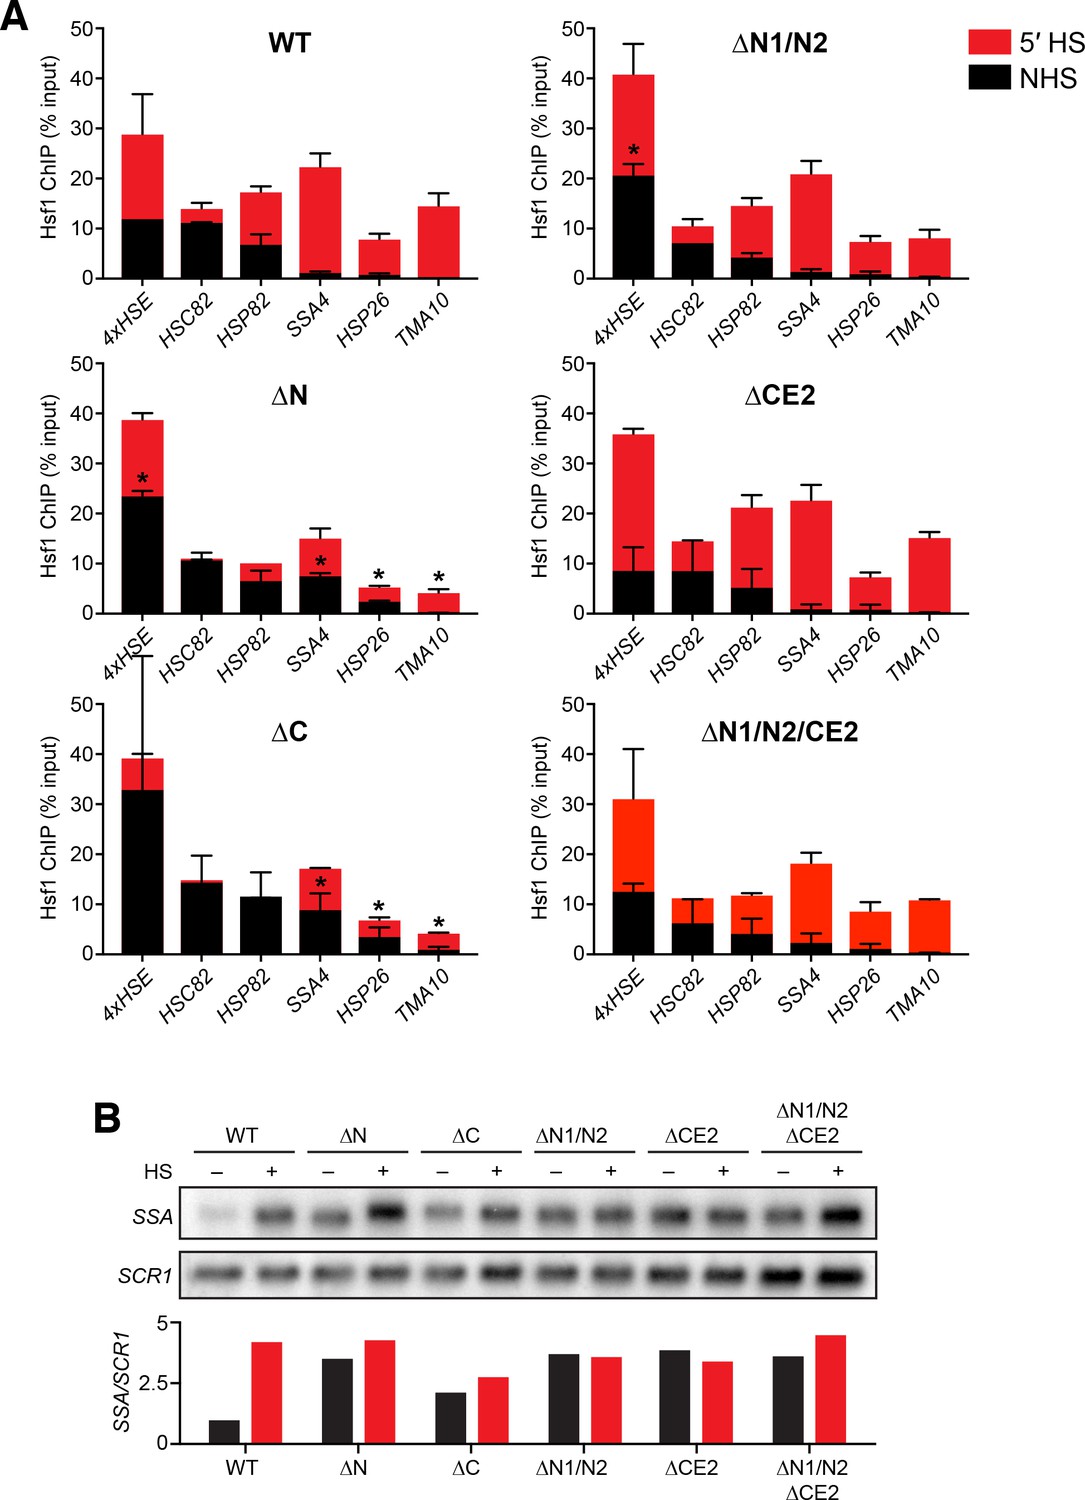
Analysis of Hsf1 binding and induction of endogenous promoters and targets.
(A) ChIP-qPCR of Hsf1 mutants at endogenous target promoters under non-heat shock and 39°C heat shock conditions. Error bars show the standard deviation of biological replicates. Statistical significance was determined by one-way ANOVA (*p<0.05; **p<0.01). (B) Northern blot analysis of SSA transcripts under non-heat shock conditions and following a 30 min heat shock at 39°C. The labeled probe recognizes all four SSA paralogs of Hsp70. The probe was generated by random priming off a 500 bp PCR product of a region of conserved sequence shared by SSA1/2/3/4.
Figure 4 with 1 supplement

CE2 is necessary for Hsp70 to bind to Hsf1.
(A) Co-immunoprecipitation of Hsf1 and Hsp70. The indicated Hsf1 mutants, C-terminally tagged with 3xFLAG-V5, were serially precipitated and subjected to mass spectrometry as described. The ratio of Hsp70 (Ssa1/2) to Hsf1 was determined in three biological replicates (bar graph, error bars are the standard deviation). Statistical significance was determined by one-way ANOVA (*p<0.05; **p<0.01). An additional replicate was analyzed by Western blot using antibodies against Ssa1/2 and the FLAG tag to recognize Hsf1. The FLAG blot was cropped in the middle to show the much smaller Hsf1∆C. The immunoblot results are not as quantitative as MS and therefore were not used in generating bar graph. (B) Cells expressing C-terminally 3xFLAG-V5-tagged wild type Hsf1 and Hsf1∆CE2 were either left untreated or heat shocked for 5 min at 39°C before serial Hsf1 immunoprecipitation and analyzed by Western blot using antibodies against Ssa1/2 and the FLAG tag to recognize Hsf1. (C) Cells expressing the indicated mutants of Hsf1, expressed as the only copy of Hsf1, were assayed for HSE-YFP levels under non-heat shock conditions by flow cytometry. The error bars are the standard deviation of three replicates. Statistical significance was determined by one-way ANOVA (*p<0.05; **p<0.01). (D) In vitro Hsf1:Hsp70 binding assay. Recombinant Hsf1-V5 and 3xFLAG-Ssa2 were purified, incubated together and assayed for binding by anti-FLAG immunoprecipitation followed by epitope-tag-specific Western blot. Addition of 5-fold molar excess of wild type Hsf1-6xHIS but not Hsf1∆CE2-6xHIS diminished the amount of Hsf1-V5 bound to 3xFLAG-Ssa2.
Figure 4—figure supplement 1
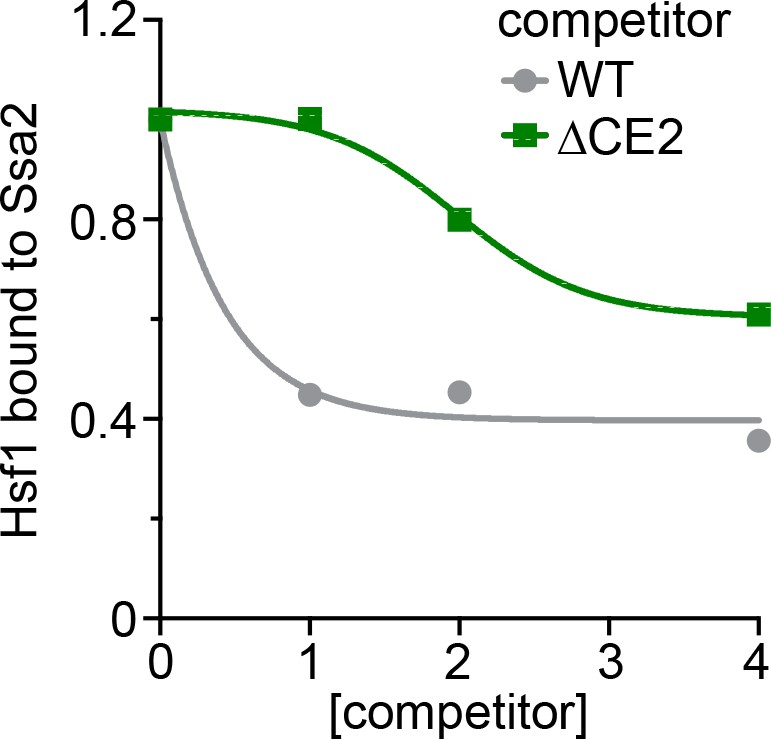
Titration series of the in vitro Hsf1:Hsp70 binding competition assay.
Untagged wild type Hsf1 and Hsf1∆CE2 were incubated at the indicated molar ratios and the amount of Hsf1-V5 bound to 3xFLAG-Ssa2 was quantified.
Figure 5
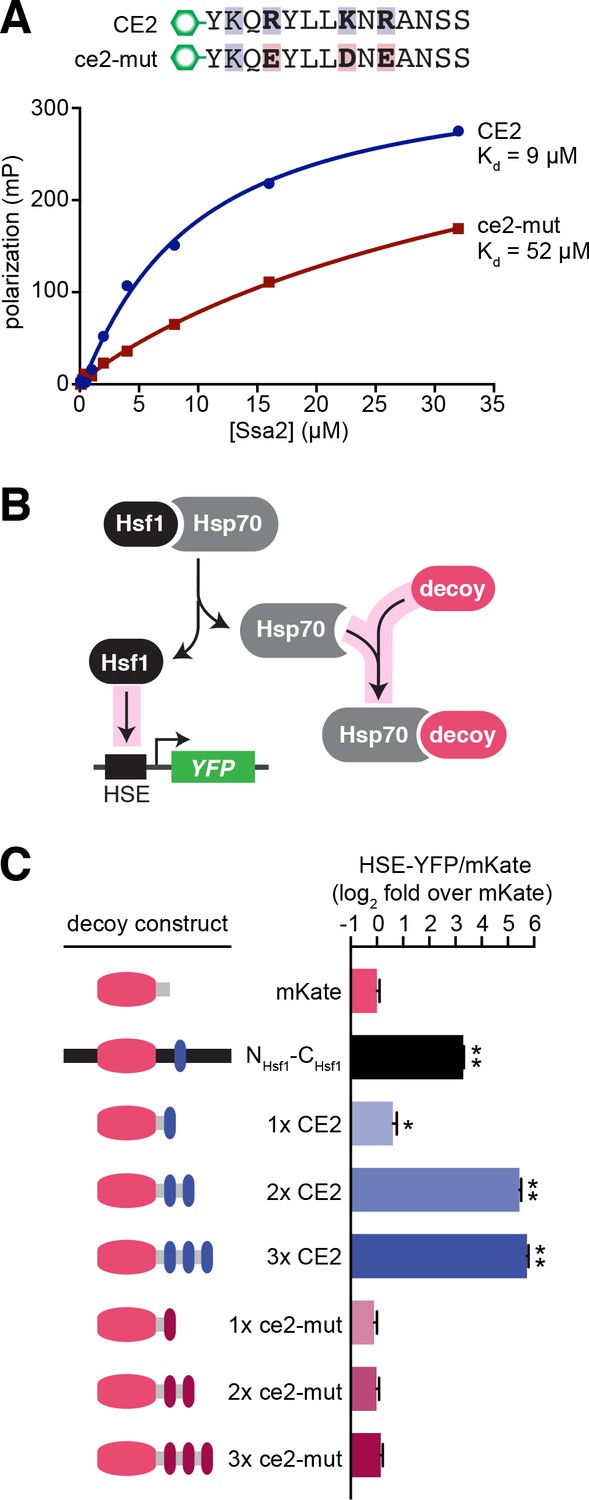
CE2 is sufficient to bind Hsp70.
(A) Fluorescence polarization assay of CE2 and ce2-mut peptides labeled with 5-carboxyfluorescein (5-FAM) and recombinant Hsp70 (Ssa2). Peptides were maintained at 100 nM while Hsp70 was titrated at the indicated concentrations. Reactions were incubated for 30 min at room temperature prior to measurement. (B) Schematic of the ‘decoy’ assay. Overexpression of mKate-based decoy constructs activates Hsf1 in trans by titrating away Hsp70. (C) Decoy assay results. Cells bearing the indicated decoy constructs were induced with 1 µM estradiol for 16 hr at 30°C and measured by flow cytometry. The HSE-YFP values in each cell were normalized by the expression of the decoy as measured by mKate fluorescence. Data are represented as median values of 10,000 cells relative to the median value of mKate alone. Error bars are the standard deviation of 3 biological replicates. Statistical significance was determined by one-way ANOVA (*p<0.05; **p<0.01).
Figure 6 with 1 supplement

The affinity of Hsp70 for Hsf1 tunes the dynamics of the heat shock response.
(A) Simulations of HSE-YFP levels over a heat shock time course as a function of increased rate of dissociation (reduced affinity) of Hsp70 from Hsf1. (B) Experimental heat shock time course of HSE-YFP levels in cells expressing wild type Hsf1, Hsf1∆CE2 or Hsf13xCE2. Each point represents the average of the median HSE-YFP level in three biological replicates, and the error bars are the standard deviation of the replicates.
Figure 6—figure supplement 1
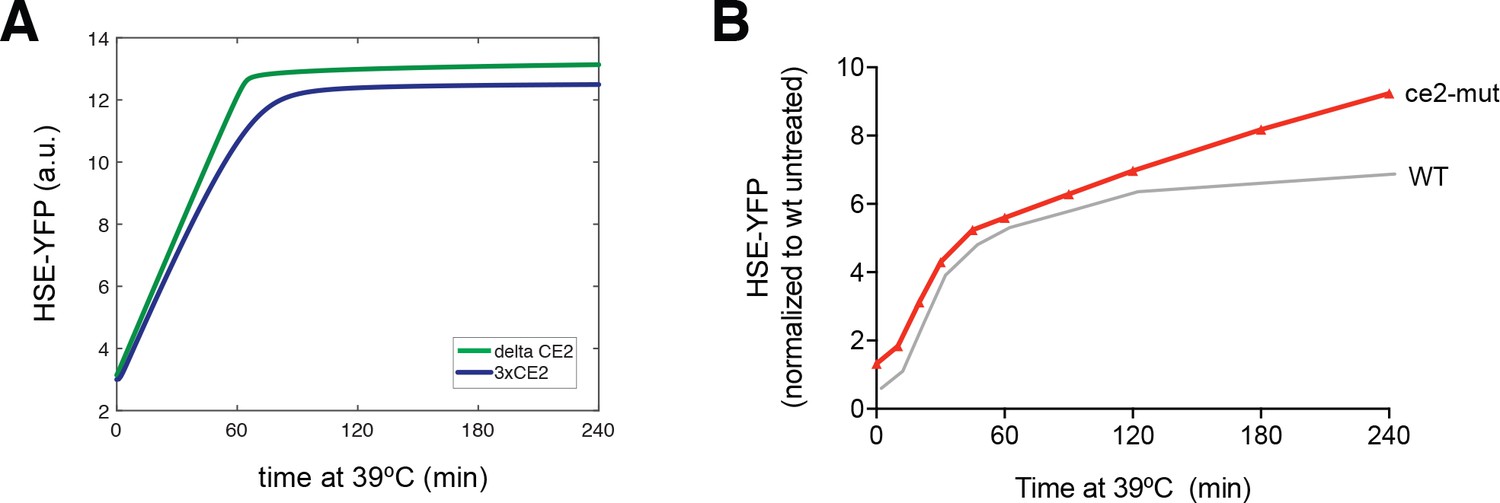
Hsp70 affinity modulation alters Hsf1 activation kinetics.
(A) Simulations of HSE-YFP levels over a heat shock time course at 3-fold higher (blue) and 5-fold lower (green) affinity for Hsp70. (B) Experimental heat shock time course of HSE-YFP levels in cells expressing WT Hsf1 (gray) and Hsf1ce2-mut (red). Each point represents the average of the median HSE-YFP level in three biological replicates, and the error bars are the standard deviation of the replicates.
Figure 7
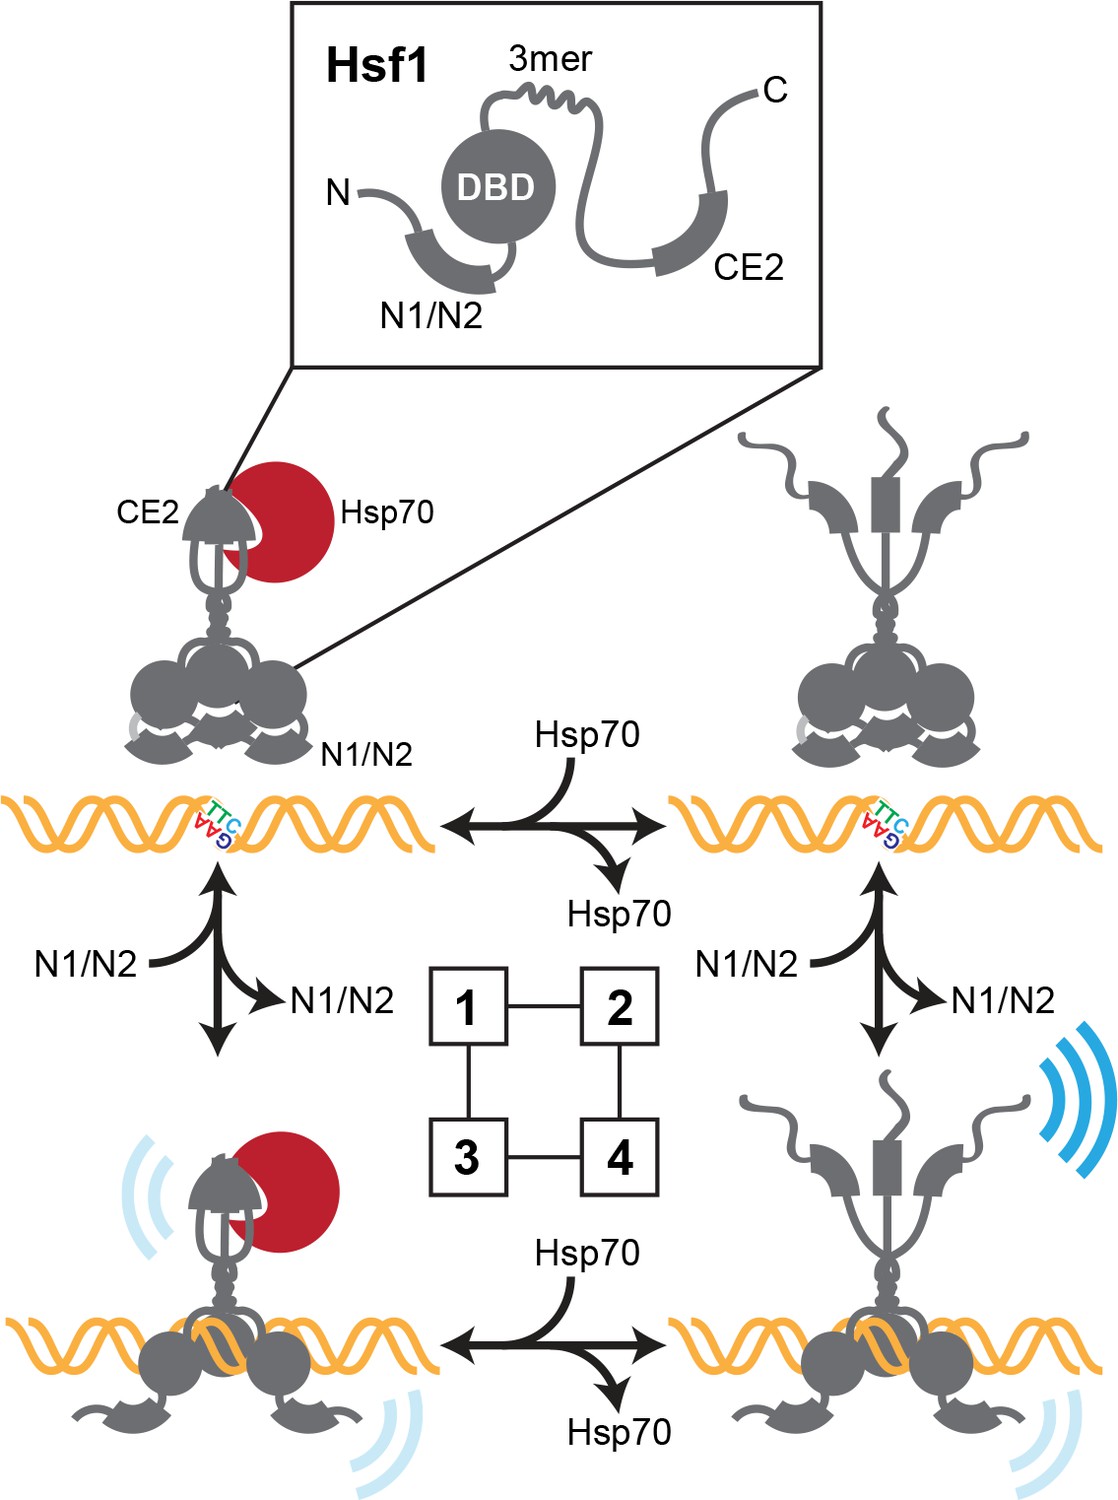
Thermodynamic representation of the four state model of Hsf1 activity.
State 1: C-terminal activation domain (CTA) closed/DBD unbound Hsp70 is bound to CE2 keeping the CTA closed; the N-terminal region is engaged in blocking the DBD from accessing available HSEs via the N1/N2 segments. State 2 CTA open/DBD unbound: Hsp70 has dissociated from CE2; the CTA is open and can potentially recruit the transcriptional machinery; the N-terminal region continues to hinder DNA binding. State 3 CTA closed/DBD bound: Hsp70 remains bound to CE2 keeping the CTA closed; the N-terminal region has reoriented to allow HSE binding; Hsf1 weakly recruits the transcriptional machinery. State 4 CTA open/DBD bound: Hsp70 has dissociated from CE2 and the CTA is open; the N-terminal region has reoriented to allow HSE binding; Hsf1 avidly recruits the transcriptional machinery.
Additional files
-
Source code 1
Simulation of Hsf1 activity with feedback in tact.
MatLab code to simulate HSE-YFP reporter production with the Hsp70 feedback loop in tact.
- https://doi.org/10.7554/eLife.31668.014
-
Source code 2
Simulation of Hsf1 activity without feedback.
MatLab code to simulate HSE-YFP reporter production with the Hsp70 feedback loop severed.
- https://doi.org/10.7554/eLife.31668.015
-
Source code 3
Simulation of basal Hsf1 activity as a function of its dissociation rate from Hsp70.
MatLab code to simulate basal HSE-YFP levels as a function of the rate of dissociation of Hsp70 from Hsf1.
- https://doi.org/10.7554/eLife.31668.016
-
Source code 4
Simulation of dynamic Hsf1 activity as a function of its dissociation rate from Hsp70.
MatLab code to simulate HSE-YFP levels over a heat shock time course as a function of the rate of dissociation of Hsp70 from Hsf1.
- https://doi.org/10.7554/eLife.31668.017
-
Supplementary file 1
Yeast strains used in this study.
Excel table of plasmids.
- https://doi.org/10.7554/eLife.31668.018
-
Supplementary file 2
Yeast strains used in this study.
Excel table of yeast strains with genotypes.
- https://doi.org/10.7554/eLife.31668.019
-
Transparent reporting form
- https://doi.org/10.7554/eLife.31668.020
Download links
A two-part list of links to download the article, or parts of the article, in various formats.
Downloads (link to download the article as PDF)
Open citations (links to open the citations from this article in various online reference manager services)
Cite this article (links to download the citations from this article in formats compatible with various reference manager tools)
Hsf1 and Hsp70 constitute a two-component feedback loop that regulates the yeast heat shock response
eLife 7:e31668.
https://doi.org/10.7554/eLife.31668


