A universal vector concept for a direct genotyping of transgenic organisms and a systematic creation of homozygous lines
- Goethe Universität, Germany
Figures
Figure 1 with 4 supplements
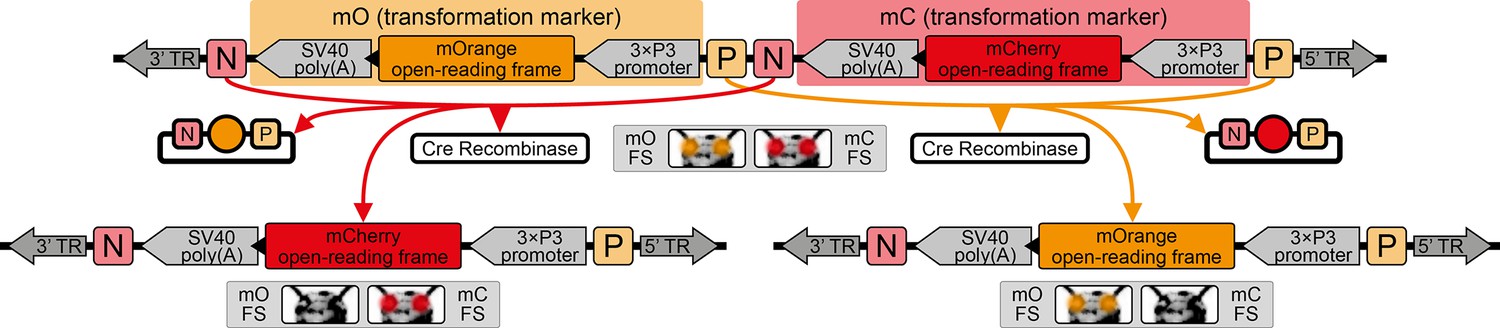
The AGameOfClones vector concept within the piggyBac-based transformation-ready pAGOC vector for Tribolium.
Two fluorescence-based transformation markers, mO and mC, are embedded into a piggyBac-based transformation-ready vector, which is characterized by 3’ and 5’ terminal repeats (TR) necessary for genomic insertion. The markers are based on the artificial eye-specific 3×P3 promoter, the open-reading frame for the respective fluorescent protein, that is, mOrange or mCherry, and the SV40 poly(A). Each transformation marker is flanked upstream by a LoxP site (P) and downstream by a LoxN site (N), forming interweaved Lox site pairs. The markers can be detected in the eyes by using appropriate filter sets (FS). Cre-mediated recombination leads to the excision of one marker from the genome. Upon removal, the other marker remains within the genome, since the remaining LoxP and LoxN sites are incompatible. Individuals that underwent recombination give rise to progeny in which only one marker is detected in the eyes.
Figure 1—figure supplement 1
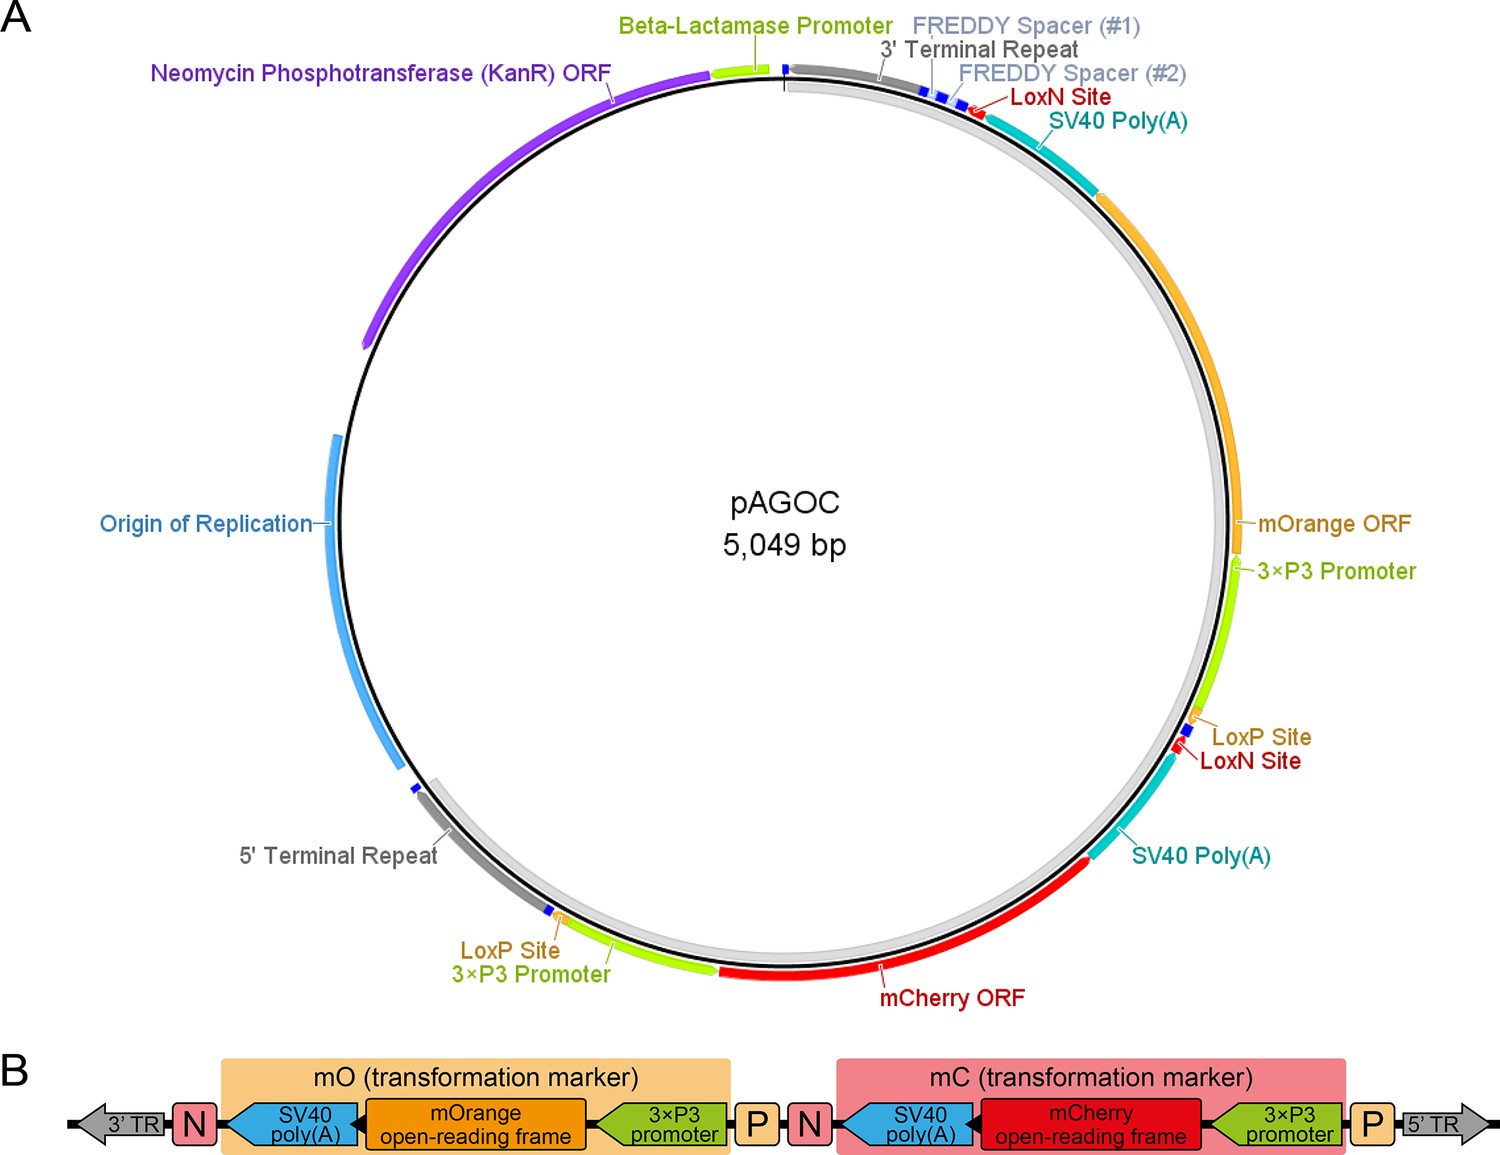
The pAGOC vector.
(A) Vector map of pAGOC, which is based on the pAVOIAF{#1–#2–#3–#4} vector (Figure 1—figure supplement 3). In this vector, #1 and #2 remain empty, while mO and mC together with their flanking upstream LoxP and downstream LoxN sites were inserted into #3 and #4, respectively. The unlabeled dark blue boxes represent the same restriction enzyme sites as shown for the pAVOIAF{#1–#2–#3–#4} vector. The light gray band on the inside indicates the transgene. (B) Scheme of mO and mC that are embedded into interweaved but incompatible LoxN and LoxP site pairs. Restriction enzyme sites are not shown. Extents of genetic elements are not to scale. ORF, open-reading frame; TR, piggyBac terminal repeat.
Figure 1—figure supplement 2

The pAGOC{#P’#O(LA)-mEmerald} vector.
(A) Vector map of pAGOC{#P’#O(LA)-mEmerald}, which is based on the pAGOC vector (Figure 1—figure supplement 1). In this vector, #1 remains empty, while the #P’#O(LA)-mEmerald two-slot cloning site was inserted into #2. The unlabeled dark blue boxes represent the same restriction enzyme sites as shown for the pAVOIAF{#1–#2–#3–#4} vector (Figure 1—figure supplement 3) as well as several new restriction enzyme sites shown in (B). The light gray band on the inside indicates the transgene. (B) Scheme of the #P’#O(LA)-mEmerald two-slot cloning site. To insert a promoter, the #P slot can be accessed by the AscI/FseI site pair, but alternatively by the double BtgZI site pair, which flanks a FREDDY spacer. BtgZI is a type I restriction enzyme with a non-palindromic recognition sequence. It digests the sequence several bp (10/14) downstream, resulting in a 4 bp sticky end. In this vector, the upstream BtgZI site (in reverse orientation) allows the opening of the AscI restriction enzyme site, while the downstream BtgZI site (in forward orientation) allows the opening of the Lifeact open-reading frame start codon and the first bp of the subsequent codon, which allows scarless insertion of respectively digested promoter sequences (indicated by arrows). The Lifeact (LA) open-reading frame, which is in #O per default, can be substituted with another open-reading frame to change the intracellular localization by the FseI/NotI site pair, while the mEmerald open-reading frame can be substituted with another fluorescence protein open-reading frame by the NotI/SbfI site pair. Extends of the genetic elements are not to scale. ORF, open-reading frame.
Figure 1—figure supplement 3

The pAVOIAF{#1–#2–#3–#4} vector.
(A) Vector map of pAVOIAF{#1–#2–#3–#4}. The vector is based on the pUC57-Kan vector, from which only the kanamycin resistance cassette and the origin of replication remain. The four-slot cloning site together with the 3’ and 5’ piggyBac terminal repeats is located between the AatII and PciI sites. The light gray band on the inside indicates the transgene. (B) Scheme of the four-slot cloning site. Each slot consists of an 18 bp spacer that translates into the amino acids Phe-Arg-Glu-Asp-Asp-Tyr and thus was termed FREDDY spacer. The slots can be accessed individually by unique restriction enzyme site pairs (XmaI/SpeI for #1, HindIII/XbaI for #2, XhoI/NheI for #3 and AflII/AvrII for #4). They are embedded into five PmeI restriction enzyme sites that allow a simple one-enzyme control digestion to determine the size of the sequences that were inserted into the slots. For convenience, the downstream restriction enzyme sites for each slot (SpeI for #1, XbaI for #2, NheI for #3 and AvrII #4) result in identical sticky ends, facilitating cloning procedures that cannot utilize the suggested restriction enzyme site pairs. Extends of the genetic elements are not to scale. ORF, open-reading frame.
Figure 1—figure supplement 4
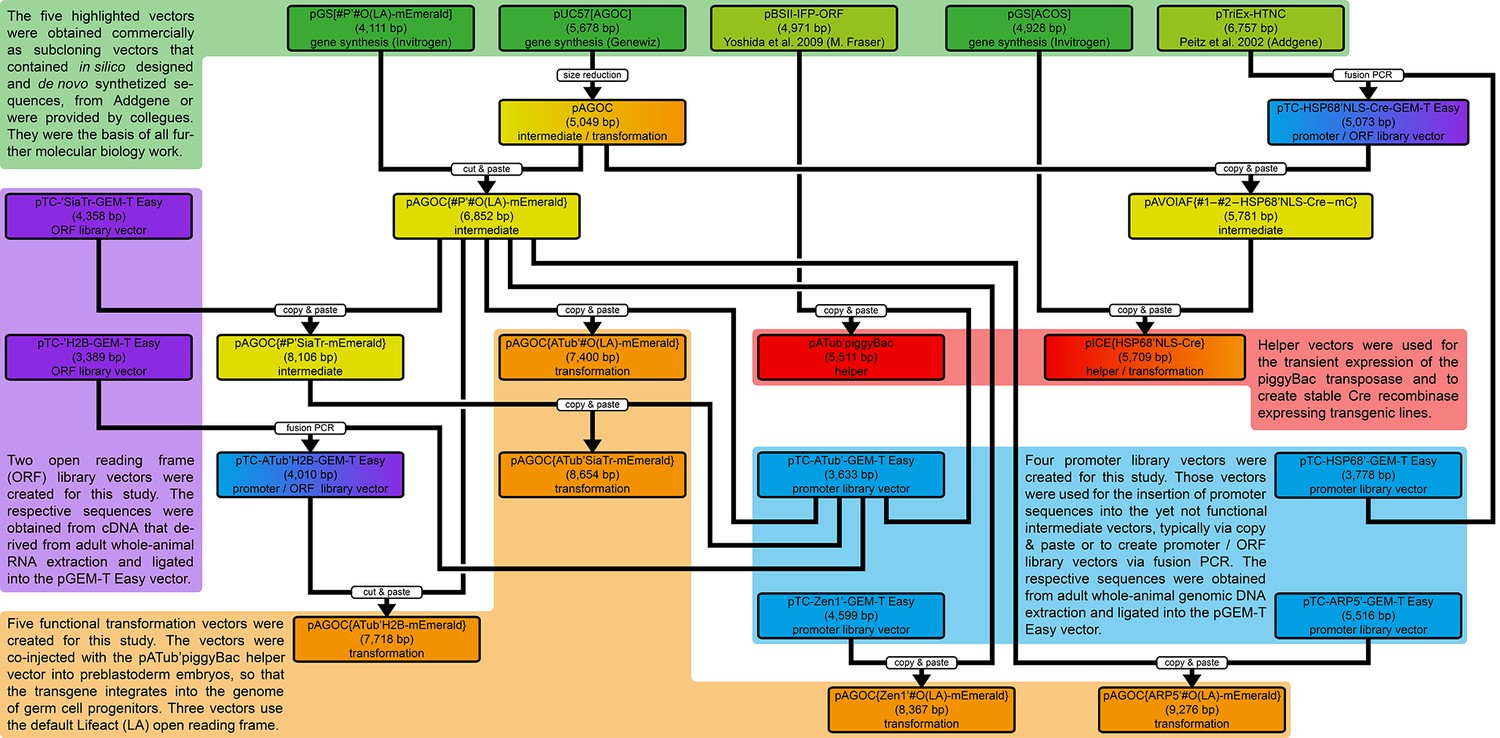
Development of the 24 vectors used in this study.
Each vector belongs to either one or two of five types, as indicated by the differently colored backgrounds. Green depicts gene synthesis and previously published vectors, blue depicts promoter library vectors, purple depicts open reading frame (ORF) library vectors, red depicts helper vectors and orange depicts transformation vectors. The ‘copy and paste’ boxes indicate a molecular biology-based procedure with PCR-based amplification of the insert, while the ‘cut and paste’ boxes indicate that the respective insert was extracted from another vector and inserted into the respective backbone without any amplification. See also the Materials and methods section.
Figure 2 with 2 supplements

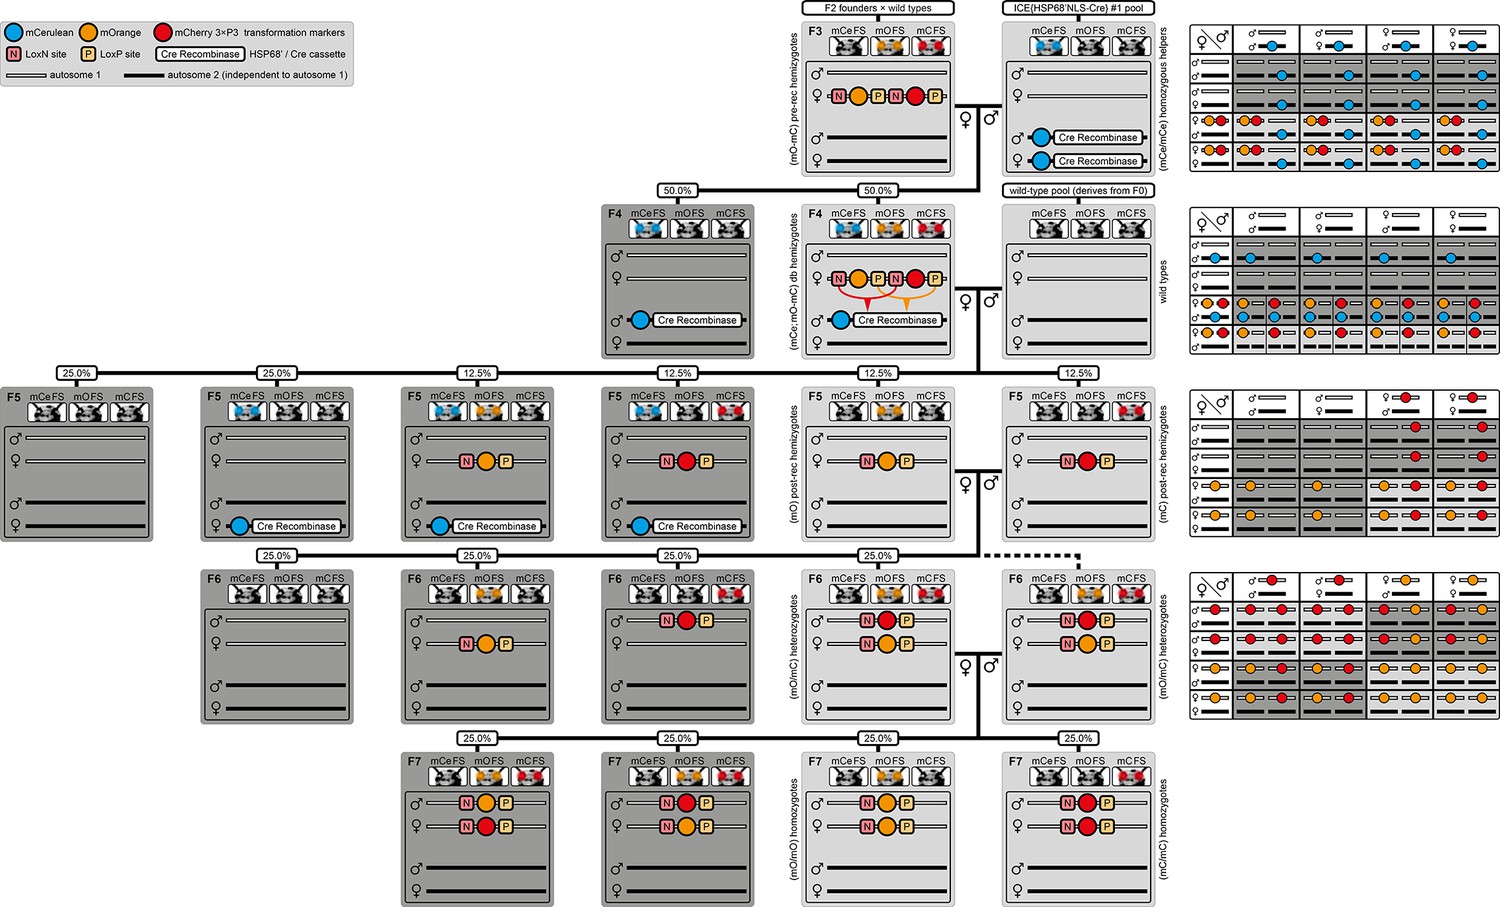
The AGameOfClones F3 to F7 mating procedure for the systematic creation of homozygous transgenic Tribolium lines.
A rounded rectangle illustrates the genotype for two independent autosomes, white bars represent the AGOC transgene location and black bars the Cre recombinase-expressing helper transgene location. A F2 (mO-mC) founder female × wild-type male cross gives rise to F3 (mO-mC) pre-recombination hemizygotes that carry mO and mC in cis configuration. A F3 (mO-mC) pre-recombination hemizygous female × mCe homozygous helper male cross results in F4 (mCe; mO-mC) double hemizygotes, in which one marker is removed through Cre-mediated recombination. Next, a F4 (mCe; mO-mC) double hemizygous female × wild-type male cross gives rise to F5 (mO) and (mC) post-recombination hemizygotes. A F5 (mO) post-recombination hemizygous female × F5 (mC) post-recombination hemizygous male sibling cross results in F6 (mO/mC) heterozygous progeny that carry mO and mC in trans configuration. Finally, a F6 (mO/mC) heterozygous female × a F6 (mO/mC) heterozygous male sibling cross gives rise to F7 (mO/mO) and (mC/mC) homozygous progeny. The percentage boxes indicate the theoretical ratio of the progeny that carry the respective genotype, the dashed line represents genotypically identical siblings. FS, filter set; rec, recombination; db, double.
Figure 2—figure supplement 1
The AGameOfClones F3 to F7 mating procedure with all outcomes and respective Punnett squares.
A light gray background indicates either F3 to F6 outcomes that are used further within the procedure or the final F7 (mO/mO) and (mC/mC) homozygotes. A dark gray background indicates progeny that can be disregarded. A rounded rectangle illustrates the genotype for two independent autosomes, white bars represent the AGOC transgene location and black bars represent the Cre recombinase-expressing helper transgene location. For convenience, the Punnett squares for the F3 to F6 crosses are provided on the right. A F2 (mO-mC) founder × wild-type cross gives rise to F3 (mO-mC) pre-recombination hemizygotes. The F3 (mO-mC) pre-recombination hemizygote × (mCe/mCe) helper homozygote (of the ICE{HSP68’NLS-Cre} #1 line) cross results in F4 (mCe; mO-mC) double hemizygotes, but also in (mCe) helper hemizygotes. The F4 (mCe; mO-mC) double hemizygote × wild type cross results in F5 (mO) and (mC) post-recombination hemizygotes but also in (mCe; mO) and (mCe; mC) post-recombination double hemizygotes, (mCe) helper hemizygotes and wild-types. The F5 (mO) post-recombination hemizygote × F5 (mC) post-recombination hemizygote sibling cross results in F6 (mO/mC) heterozygotes, but also in (mO) and (mC) hemizygotes and wild-types. Finally, the F6 (mO/mC) heterozygote × F6 (mO/mC) heterozygote sibling cross results in F7 (mO/mO) and (mC/mC) homozygotes, but also (mO/mC) heterozygotes, whereas half of the individuals obtain mO maternally and mC paternally, and the other half obtains mO paternally and mC maternally. FS, filter set; rec, recombination; db, double.
Figure 2—figure supplement 2
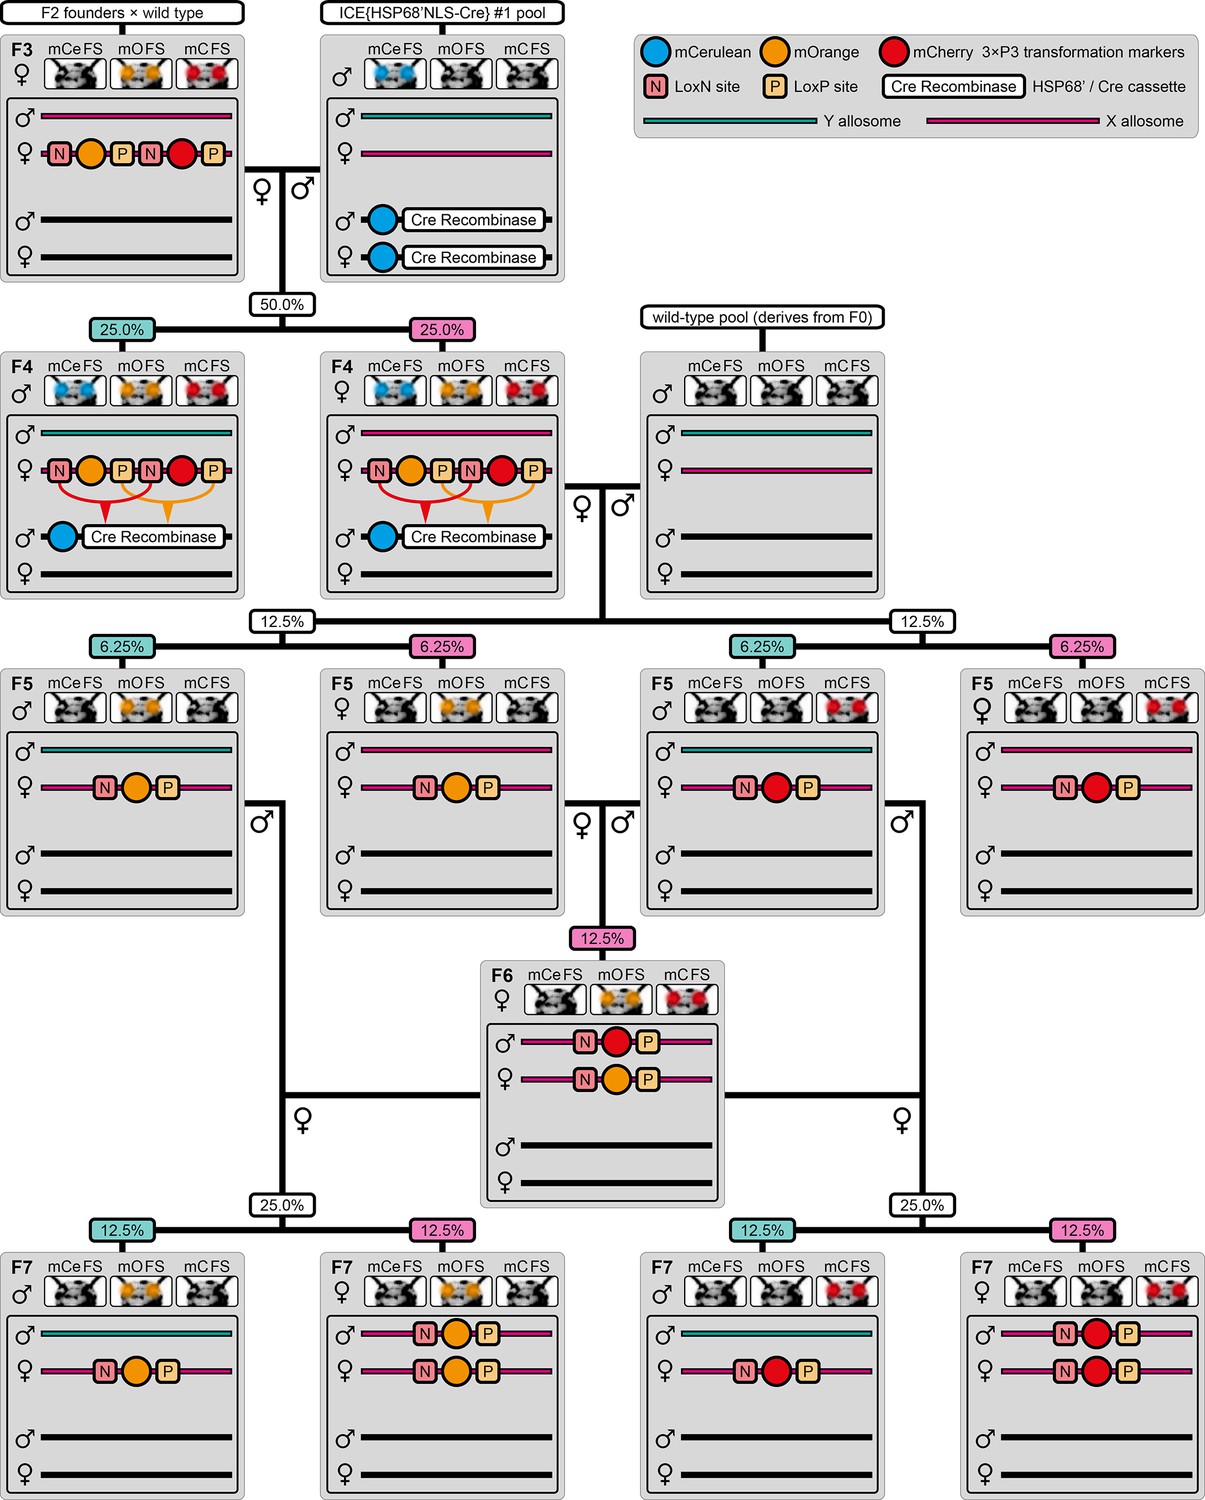
Alternative AGameOfClones F3 to F7 mating procedure for transgenes located on the X allosome.
When the transgene is located on the X allosome instead of one of the nine autosomes, the mating procedure has to be modified slightly to obtain F7 (mO/mO) and (mC/mC) homozygous females. A rounded rectangle illustrates the genotype for one autosome and both allosomes, pink bars represent the AGOC transgene location on the X allosome, turquoise bars represent the Y allosome and black bars represent the helper transgene location on an autosome. Up to the F6 (mO/mC) heterozygous generation, the procedure is identical to the standard, but all F6 (mO/mC) heterozygous individuals are female. Two of those females are separately trans-generation mated with F5 (mO) and (mC) post-recombination males, which results in F7 (mO/mO) and (mC/mC) homozygous females, respectively. The percentage boxes indicate the theoretical ratios of the progeny that display the respective phenotype. Pink boxes represent female progeny, teal boxes represent male progeny. FS, filter set.
Figure 3 with 2 supplements
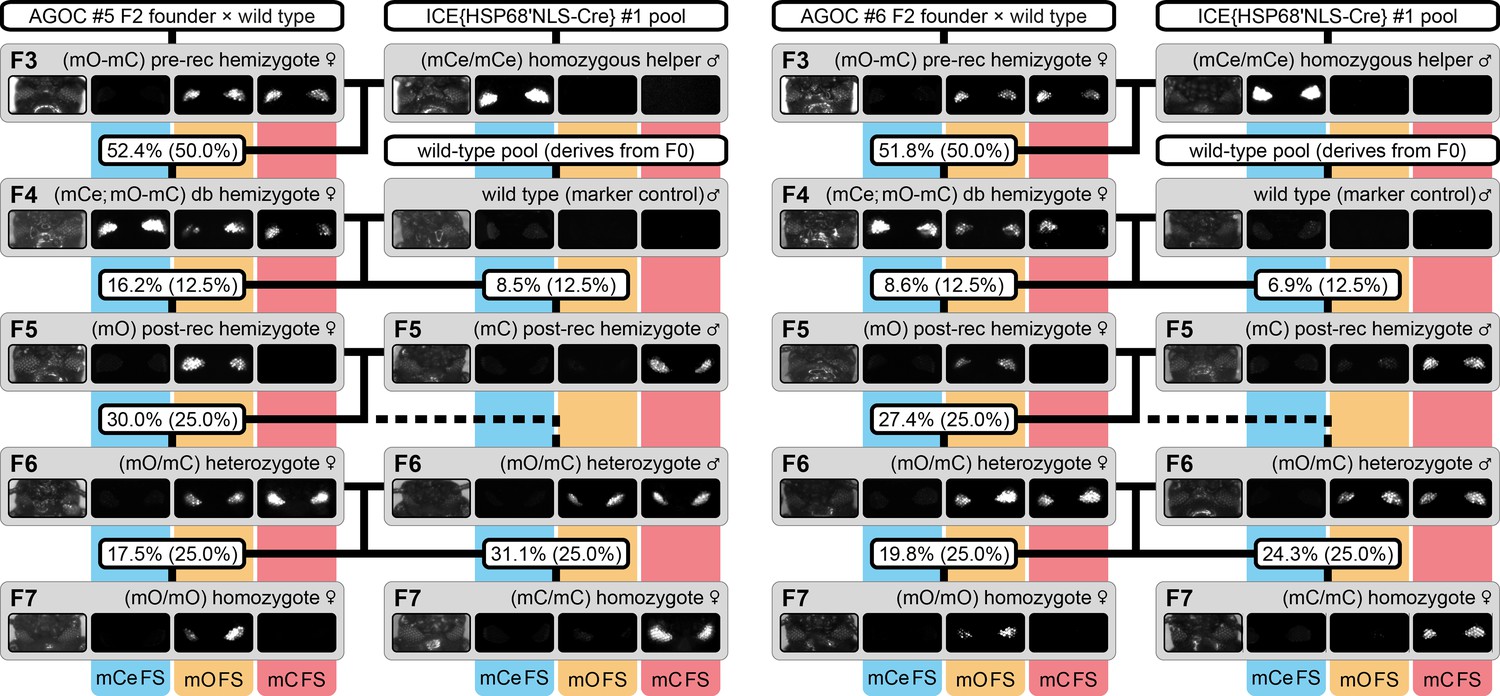
The AGameOfClones F3 to F7 mating procedure demonstrated for the AGOC #5 and #6 sublines.
From the F3 to the F7 generation, the genotype was phenotypically determined by monitoring mCe, mO and mC. For both sublines, F7 (mO/mO) and (mC/mC) homozygotes were obtained by following the mating procedure outlined in Figure 2. The wild-type male in the second row functions as the marker control. The percentage boxes indicate the experimental (and theoretical) ratio of the progeny that displayed the respective phenotype. FS, filter set; rec, recombination; db, double.
Figure 3—figure supplement 1
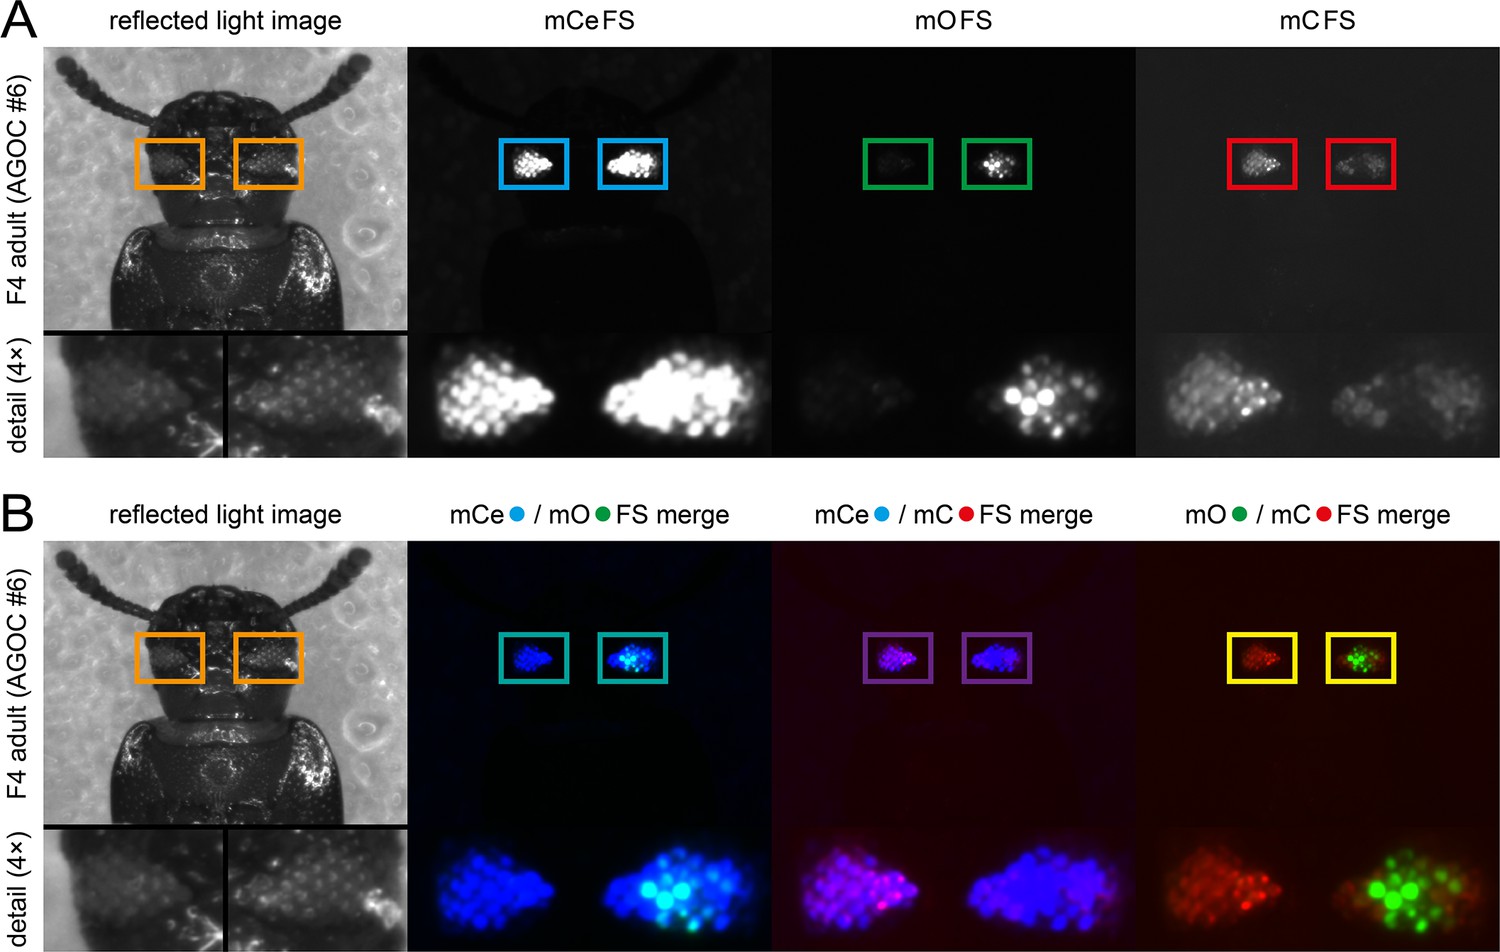
The F4 (mCe; mO-mC) double hemizygous generation.
(A) The F4 hybrids are hemizygous for both the AGOC transgene, which carries both mO and mC embedded into interweaving Lox site pairs, and the helper transgene, which carries mCe and the Cre recombinase expression cassette. Within this cassette, expression of a nuclear-localized Cre recombinase is driven by the endogenous heat shock protein 68b promoter. During the development of the F4 generation from the zygote to the fertile adult, the promoter exhibits a slight leaky expression. Over time, this leads to recombination in germ cells (i.e. the prerequisite for the AGOC vector concept procedure) but also in certain somatic progenitor cells that later on give rise to distinct, typically spatially clustered cell populations. This effect is evident in the compound eyes of adult beetles in all AGOC lines, where certain clusters of ommatidia display expression of either only mO or only mC. (B) Within the merged images, it becomes evident that most of the ommatidia express either only mO or only mC.
Figure 3—figure supplement 2
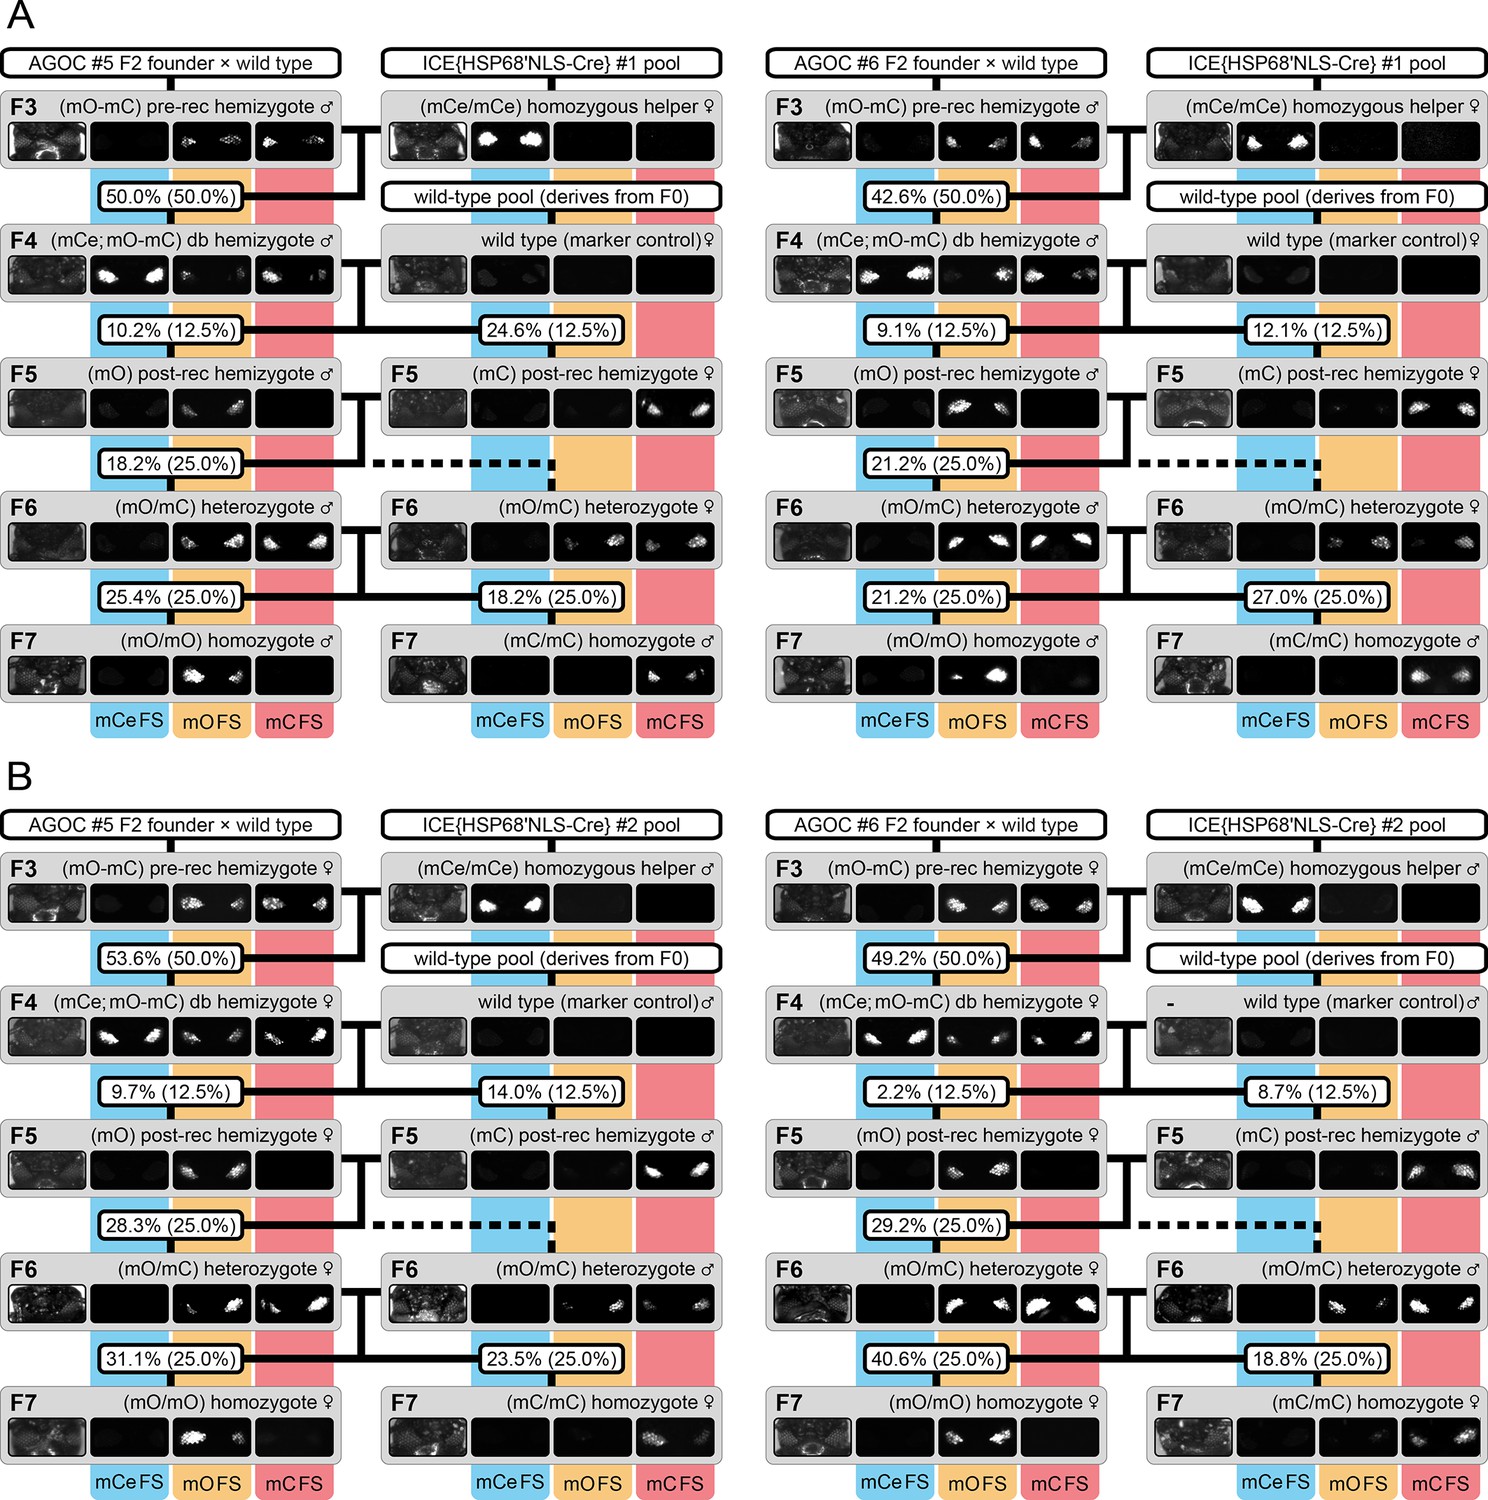
The AGameOfClones F3 to F7 mating procedure demonstrated for the AGOC #5 and #6 sublines with swapped genders as well as with an alternative Cre recombinase-expressing helper subline.
(A) To demonstrate that systematic creation of homozygous lines does not depend on the gender arrangement shown in Figure 2, the F3 to F7 mating procedure was carried out as described in the results section, but with swapped genders. F3 (mO-mC) pre-recombination hemizygous males of the AGOC #5 and #6 subline, which carried mO and mC on the maternal chromosome in cis configuration, were mated with (mCe/mCe) helper homozygous females of the ICE{HSP68’NLS-Cre} #1 subline. This resulted in F4 (mCe; mO-mC) double hemizygotes, in which Cre-mediated recombination occurs. F4 (mCe; mO-mC) double hemizygote males were mated with wild-type females, this resulted in F5 (mO) and (mC) post-recombination hemizygotes that carried either only mO or only mC on the paternal chromosome. F5 (mO) post-recombination hemizygous males were mated with F5 (mC) post-recombination hemizygous female siblings, which resulted in F6 (mO/mC) heterozygotes that carried mO on the paternal and mC on the maternal chromosome in trans configuration. F6 (mO/mC) heterozygous males were mated with genotypically identical female siblings, which resulted in F7 (mO/mO) and (mC/mC) only homozygotes that carried either only mO or only mC on both, the maternal and paternal chromosomes. The wild-type female in the second row functions as the marker control. The percentage boxes indicate the experimental (and theoretical) ratios of the progeny that display the respective phenotype. (B) To demonstrate that systematic creation of homozygous lines does not rely solely on a specific Cre recombinase-expressing helper subline, the F3 to F7 mating procedure was carried out as described in the results section, but with the ICE{HSP68’NLS-Cre} #2 helper subline, which carries the same transgene as #1 subline, but at a different genomic location. F3 (mO-mC) pre-recombination hemizygous females of the AGOC #5 and #6 subline, which carried mO and mC on the maternal chromosome in cis configuration, were mated with (mCe/mCe) homozygous helper males of the ICE{HSP68’NLS-Cre} #2 subline. This resulted in F4 (mCe; mO-mC) double hemizygotes, in which Cre-mediated recombination occurs. F4 (mCe; mO-mC) double hemizygote females were mated with wild-type males, which resulted in F5 (mO) and (mC) post-recombination hemizygotes that carried either only mO or only mC on the maternal chromosome. F5 (mO) post-recombination hemizygous females were mated with F5 (mC) post-recombination hemizygous male siblings, which resulted in F6 (mO/mC) heterozygotes that carried mO on the maternal and mC on the paternal chromosome in trans configuration. F6 (mO/mC) heterozygous females were mated with genotypically identical male siblings, which resulted in F7 (mO/mO) and (mC/mC) homozygotes that carried either only mO or only mC on both, the maternal and paternal chromosomes. The wild-type female in the second row functions as the marker control. The percentage boxes indicate the experimental (and theoretical) ratios of the progeny that display the respective phenotype. FS, filter set; rec, recombination; db, double.
Figure 4
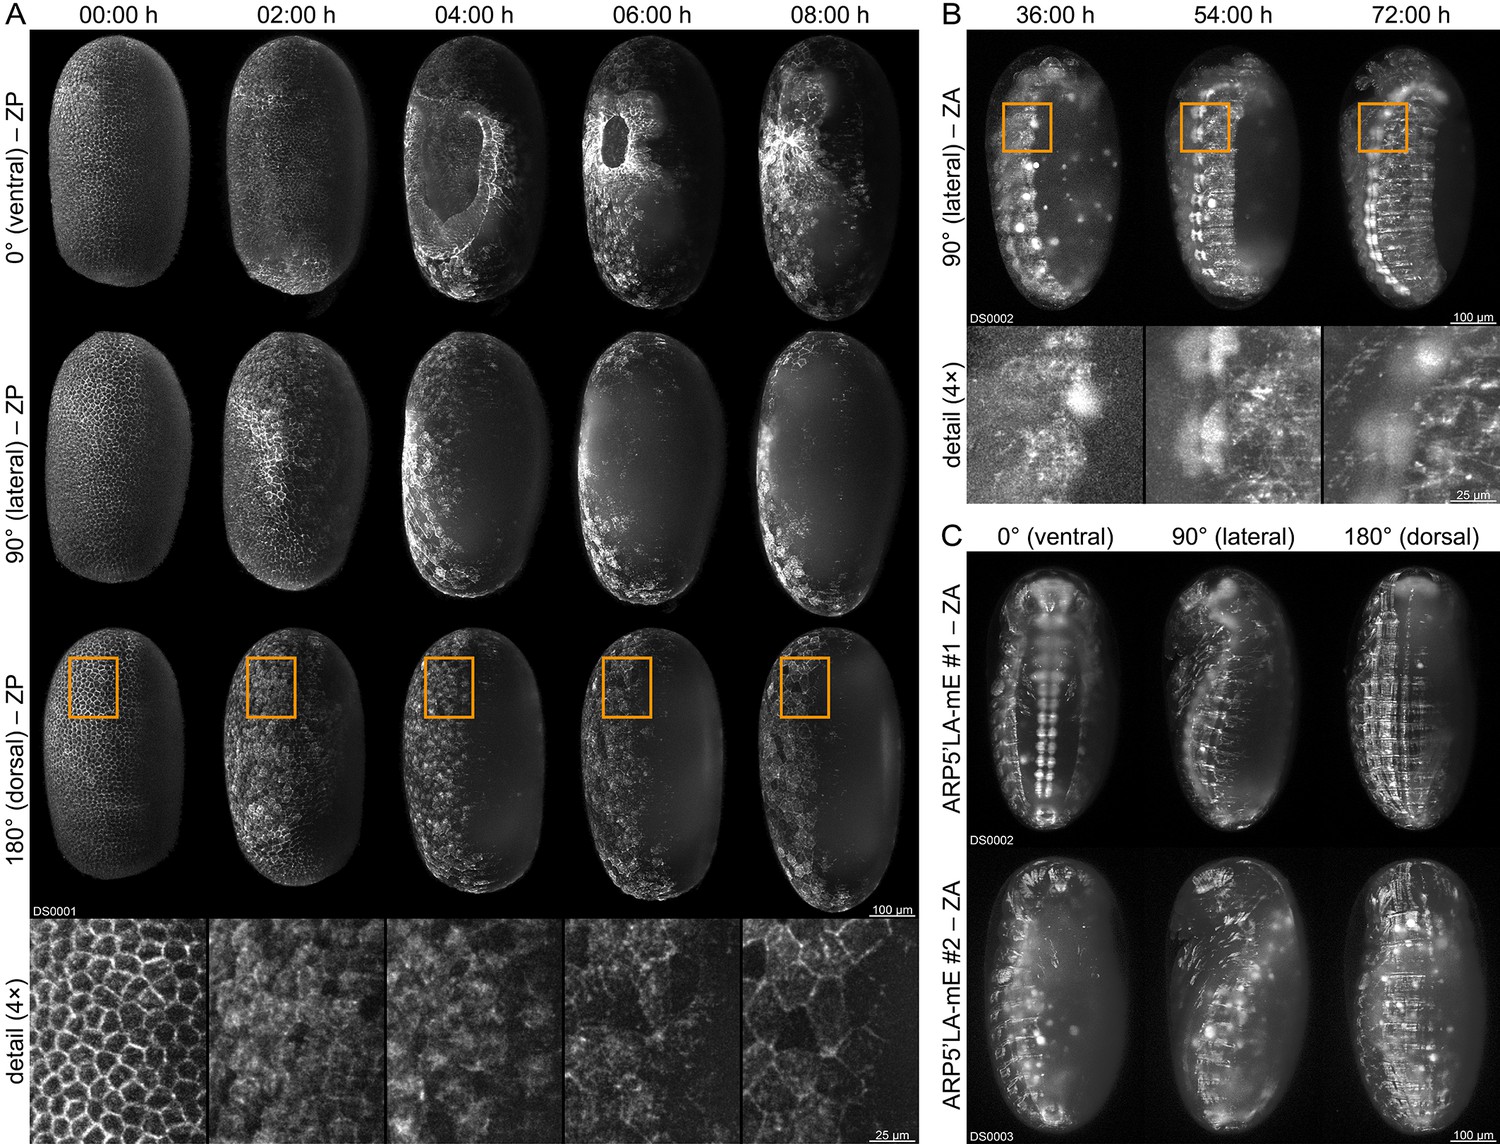
Fluorescence live imaging of selected functional (mC/mC) homozygous AGOC sublines.
(A) An AGOC{Zen1’#O(LA)-mEmerald} #2 embryo during gastrulation. This subline permits the characterization of actin and actomyosin dynamics involved in serosa window closure (first row). It can also be used to describe the cytoskeleton rearrangement of the dorsal blastoderm cells (second row) and to analyze their change in appearance during differentiation to serosa cells (third row and enlarged images). (B) An AGOC{ARP5’#O(LA)-mEmerald} #1 embryo during germband retraction. In this subline, the brain and ventral nerve cord express mEmerald-labeled Lifeact on a high level, permitting the observation of neurulation. Enlarged images show the forming ganglia of the first and second thoracic segments. (C) Comparison of embryos from the AGOC{ARP5’#O(LA)-mEmerald} #1 and #2 sublines after dorsal closure. In contrast to the #2 subline, the fluorescence signal within the nervous system of the #1 subline is noticeably strong. ZP, Z maximum projection with image processing; ZA, Z maximum projection with intensity adjustment.
Videos
Video 1
Long-term live imaging of a (mC/mC) homozygous Tribolium embryo from the AGOC{Zen1’#O(LA)-mEmerald} #2 subline.
Embryogenesis is shown along four directions from 00:00 hr to 24:00 hr with an interval of 00:30 hr between the time points. The video starts with the rearrangement of the blastoderm and ends during germband retraction. During gastrulation, the ventrally located serosa window is closed by a contracting actomyosin cable that separates the serosa and the amnion. Frame rate is five frames per second. ZP, Z maximum projection with image processing.
Video 2
Long-term live imaging of a (mC/mC) homozygous Tribolium embryo from the AGOC{ARP5’#O(LA)-mEmerald} #1 subline.
Embryogenesis is shown along four directions from 00:00 hr to 96:00 hr with an interval of 00:30 hr between the time points. The video starts with the rearrangement of the blastoderm and ends after dorsal closure. This transgenic line exhibits strong fluorophore expression in the ventral nerve cord. Frame rate is five frames per second. ZA, Z maximum projection with image adjustment.
Video 3
Long-term live imaging of a (mC/mC) homozygous Tribolium embryo from the AGOC{ARP5’#O(LA)-mEmerald} #2 subline.
Embryogenesis is shown along four directions from 00:00 hr to 120:00 hr with an interval of 00:30 hr between the time points. The video starts with the rearrangement of the blastoderm and ends after dorsal closure. In contrast to the #1 subline (Video 2), this subline does not exhibit strong fluorophore expression in the ventral nerve cord. Frame rate is five frames per second. ZA, maximum projection with image adjustment.
Tables
Table 1
Mating procedure results for the six proof-of-principle AGOC sublines from the F3 to the F7 generation.
Bold entries mark progeny that were used in the subsequent cross. F6-S, F7-O and F7-C are control crosses. No significant differences between the arithmetic means and the theoretical Mendelian ratios were found. See Source Data 1 for raw scores ordered by transgenic sublines.
| Gen | Cross | Subline | Progeny | ||||||||
|---|---|---|---|---|---|---|---|---|---|---|---|
 |  |  |  |  |  |  |  | Total | |||
| F3 | 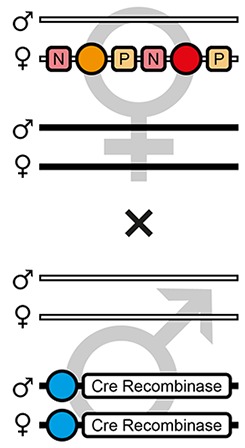 | Theoretical | - | 50.0% | - | - | - | - | - | 50.0% | - |
| AGOC #1 | - | 47.9% (46) | - | - | - | - | - | 52.1% (50) | 96 | ||
| AGOC #2 | - | 52.4% (44) | - | - | - | - | - | 47.6% (40) | 84 | ||
| AGOC #3 | - | 55.1% (49) | - | - | - | - | - | 44.9% (40) | 89 | ||
| AGOC #4 | - | 44.1% (41) | - | - | - | - | - | 55.9% (52) | 93 | ||
| AGOC #5 | - | 47.6% (39) | - | - | - | - | - | 52.4% (43) | 82 | ||
| AGOC #6 | - | 48.2% (27) | - | - | - | - | - | 51.8% (29) | 56 | ||
| Mean | - | 49.2 ± 3.9% | - | - | - | - | - | 50.8 ± 3.9% | 83.3 | ||
| F4 | 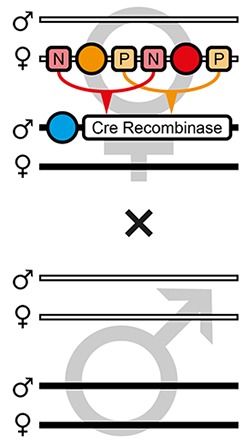 | Theoretical | 25.0% | 25.0% | 12.5% | 12.5% | 12.5% | 12.5% | - | - | - |
| AGOC #1 | 25.6% (30) | 34.2% (40) | 4.3% (5) | 10.2% (12) | 6.0% (7) | 19.7% (23) | - | - | 117 | ||
| AGOC #2 | 27.3% (36) | 28.9% (38) | 15.1% (20) | 8.3% (11) | 9.8% (13) | 10.6% (14) | - | - | 132 | ||
| AGOC #3 | 25.8% (33) | 32.8% (42) | 13.3% (17) | 10.1% (13) | 5.5% (7) | 12.5% (16) | - | - | 128 | ||
| AGOC #4* | 14.0% (14) | 15.0% (15) | 20.0% (20) | 13.0% (13) | 22.0% (22) | 9.0% (9) | 3.0% (3) | 4.0% (4) | 100 | ||
| AGOC #5 | 17.1% (20) | 40.2% (47) | 16.2% (19) | 8.5% (10) | 10.3% (12) | 7.7% (9) | - | - | 117 | ||
| AGOC #6 | 33.6% (39) | 33.6% (39) | 8.6% (10) | 6.9% (8) | 6.1% (7) | 11.2% (13) | - | - | 116 | ||
| Mean | 23.9 ± 7.2% | 30.8 ± 8.5% | 12.9 ± 5.6% | 9.5 ± 2.1% | 9.9 ± 6.3% | 11.8 ± 4.2% | 0.5% | 0.7% | 118.3 | ||
| F5 | 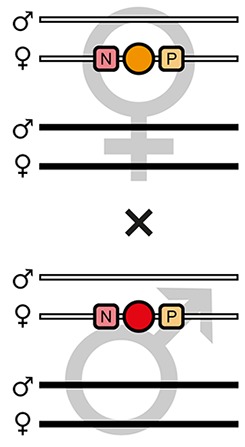 | Theoretical | 25.0% | - | 25.0% | 25.0% | - | - | 25.0% | - | - |
| AGOC #1 | 27.2% (31) | - | 26.3% (30) | 23.7% (27) | - | - | 22.8% (26) | - | 114 | ||
| AGOC #2 | 28.9% (26) | - | 33.3% (30) | 17.8% (16) | - | - | 20.0% (18) | - | 90 | ||
| AGOC #3 | 24.8% (30) | - | 27.3% (33) | 24.8% (30) | - | - | 23.1% (28) | - | 121 | ||
| AGOC #4 | 19.3% (21) | - | 22.9% (25) | 37.6% (41) | - | - | 20.2% (22) | - | 109 | ||
| AGOC #5 | 28.2% (31) | - | 29.1% (32) | 12.7% (14) | - | - | 30.0% (33) | - | 110 | ||
| AGOC #6 | 26.2% (22) | - | 29.7% (25) | 16.7% (14) | - | - | 27.4% (23) | - | 84 | ||
| Mean | 25.8 ± 3.5% | - | 28.1 ± 3.5% | 22.2 ± 8.8% | - | - | 23.9 ± 4.0% | - | 104.7 | ||
| F6-S | 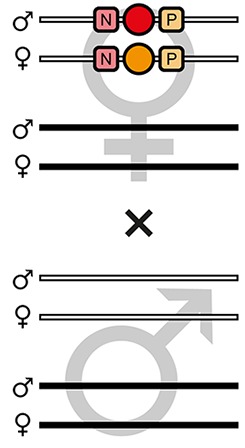 | Theoretical | - | - | 50.0% | 50.0% | - | - | - | - | |
| AGOC #1 | - | - | 46.4% (39) | 53.6% (44) | - | - | - | - | 84 | ||
| AGOC #2 | - | - | 50.0% (49) | 50.0% (49) | - | - | - | - | 98 | ||
| AGOC #3 | - | - | 54.0% (68) | 46.0% (58) | - | - | - | - | 126 | ||
| AGOC #4 | - | - | 53.8% (50) | 46.2% (43) | - | - | - | - | 93 | ||
| AGOC #5 | - | - | 51.3% (59) | 48.7% (56) | - | - | - | - | 115 | ||
| AGOC #6 | - | - | 57.0% (49) | 43.0% (37) | - | - | - | - | 86 | ||
| Mean | - | - | 52.1 ± 3.7% | 47.9 ± 3.7% | - | - | - | - | 100.3 | ||
| F6 |  | Theoretical | - | - | 25.0% | 25.0% | - | - | 50.0% | - | - |
| AGOC #1 | - | - | 20.3% (23) | 24.8% (28) | - | - | 54.9% (62) | - | 113 | ||
| AGOC #2 | - | - | 21.5% (23) | 35.5% (38) | - | - | 43.0% (46) | - | 117 | ||
| AGOC #3 | - | - | 22.9% (27) | 22.9% (27) | - | - | 54.2% (64) | - | 118 | ||
| AGOC #4 | - | - | 22.0% (29) | 22.7% (30) | - | - | 55.3% (73) | - | 132 | ||
| AGOC #5 | - | - | 17.5% (18) | 31.1% (32) | - | - | 51.4% (53) | - | 103 | ||
| AGOC #6 | - | - | 19.8% (22) | 24.3% (27) | - | - | 55.9% (62) | - | 111 | ||
| Mean | - | - | 20.7 ± 1.9% | 26.9 ± 5.2% | - | - | 52.4 ± 4.9% | - | 115.7 | ||
| F7-O | 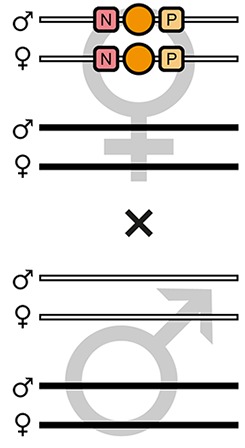 | Theoretical | - | - | 100% | - | - | - | - | - | - |
| AGOC #1 | - | - | 100% (94) | - | - | - | - | - | 94 | ||
| AGOC #2 | - | - | 100% (50) | - | - | - | - | - | 50 | ||
| AGOC #3 | - | - | 100% (49) | - | - | - | - | - | 49 | ||
| AGOC #4 | - | - | 100% (79) | - | - | - | - | - | 79 | ||
| AGOC #5 | - | - | 100% (79) | - | - | - | - | - | 79 | ||
| AGOC #6 | - | - | 100% (63) | - | - | - | - | - | 63 | ||
| Mean | - | - | 100 ± 0% | - | - | - | - | - | 69.0 | ||
| F7-C | 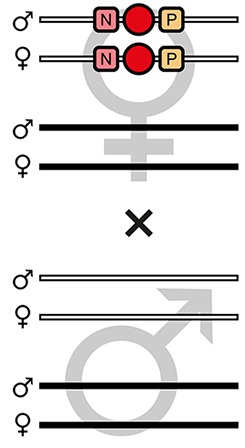 | Theoretical | - | - | - | 100% | - | - | - | - | - |
| AGOC #1 | - | - | - | 100% (101) | - | - | - | - | 101 | ||
| AGOC #2 | - | - | - | 100% (105) | - | - | - | - | 105 | ||
| AGOC #3 | - | - | - | 100% (89) | - | - | - | - | 89 | ||
| AGOC #4 | - | - | - | 100% (54) | - | - | - | - | 54 | ||
| AGOC #5 | - | - | - | 100% (74) | - | - | - | - | 74 | ||
| AGOC #6 | - | - | - | 100% (64) | - | - | - | - | 64 | ||
| Mean | - | - | - | 100 ± 0% | - | - | - | - | 81.2 | ||
-
*In the AGOC #4 subline, incomplete recombination occurred in the F4 (mCe; mO-mC) double hemizygous generation, as we obtained several F5 individuals that still carried both transformation markers (7.0% in total). We continued the mating procedure with the F5 (mO) and (mC) post-recombination hemizygous progeny.
-
Table 1—source data 1
Raw scores for all mating procedure result tables ordered by transgenic sublines.
- https://doi.org/10.7554/eLife.31677.015
Key resources table
| Reagent type (species) or resource | Designation | Source or reference | Identifiers | Additional information |
|---|---|---|---|---|
| Gene (Tribolium castaneum) | Tubulin alpha 1-like protein (ATub) | PMID: 18625397 | Gene ID: 656649 | - |
| Gene (T. castaneum) | Heat shock protein 68b (HSP68) | PMID: 22890852 | Gene ID: 100142517 | - |
| Gene (T. castaneum) | Zerknüllt 1 (Zen1) | This paper | Gene ID: 641533 | The Tribolium Zen1 promoter was not cloned previously |
| Gene (T. castaneum) | Actin-related protein 5 (ARP5) | This paper | Gene ID: 655949 | The Tribolium ARP5 promoter was not cloned previously |
| Gene (T. castaneum) | Histone H2B (H2B) | This paper | Gene ID: 661713 | The Tribolium H2B open-reading frame was not cloned previously |
| Gene (T. castaneum) | Beta-galactoside alpha-2,6- sialyltransferase 1 (SiaTr) | This paper | Gene ID: 657186 | The Tribolium SiaTr open-reading frame was not cloned previously |
| Strain, strain background (T. castaneum) | Plain-White-As-Snow (PWAS) background strain | PMID: 25555987 | - | New hybrid: pearl background strain that also carries the light ocular diaphragm mutation |
| Recombinant DNA reagent | pUC57[AGOC] | This paper | - | Gene synthesis (Genewiz) |
| Recombinant DNA reagent | pGS[#P’#O(LA)-mEmerald] | This paper | - | Gene synthesis (Invitrogen) |
| Recombinant DNA reagent | pGS[ACOS] | This paper | - | Gene synthesis (Invitrogen) |
| Recombinant DNA reagent | pBSII-IFP-CDS | PMID: 19716359 | - | Kind gift from Malcom Fraser (University of Notre Dame, Indiana, United States) |
| Recombinant DNA reagent | pTriEx-HTNC | PMID: 11904364 | Addgene ID: 13763 | Ordered from Addgene. |
| Recombinant DNA reagent | pGEM-T Easy | Promega | Catalog No: A1360 | - |
Additional files
-
Supplementary file 1
F2 insert number determination cross.
F2 (mO-mC) founder females were mated with wild-type males and the progeny were scored. Segregation of 60% or fewer transgenic descendants was defined as the criterion for one insert. No deviators could be identified.
- https://doi.org/10.7554/eLife.31677.020
-
Supplementary file 2
F3 homozygous viability crosses.
Two F3 (mO-mC) pre-recombination hemizygous siblings were mated and the progeny were scored. Segregation of 70% or more transgenic descendants was defined as the criterion for homozygous viability. Deviators are marked bold.
- https://doi.org/10.7554/eLife.31677.021
-
Supplementary file 3
Insertion junctions.
In the Junction column, the piggyBac TTAA insertion/excision target sequence is marked bold.
- https://doi.org/10.7554/eLife.31677.022
-
Supplementary file 4
Generations.
In this table, the F0 to F7 and their characteristics are summarized.
- https://doi.org/10.7554/eLife.31677.023
-
Supplementary file 5
Mating procedure results for the two proof-of-principle AGOC #5 and #6 sublines from the F3 to the F7 generation with swapped genders as well as with an alternative Cre-expressing homozygous helper subline, ICE{HSP68’NLS-Cre} #2.
Bold entries mark progeny that were used in the subsequent cross. F6-S, F7-O and F7-C are control crosses. No significant differences between the arithmetic means and the theoretical Mendelian ratios were found. See Source Data 1 for raw scores ordered by transgenic sublines.
- https://doi.org/10.7554/eLife.31677.024
-
Supplementary file 6
Mating procedure results for six of the thirteen functional AGOC sublines (Lifeact only) from the F3 to the F7 generation.
Bold entries mark progeny that were used in the subsequent cross. F6-S, F7-O and F7-C are control crosses. No significant differences between the arithmetic means and the theoretical Mendelian ratios were found. See Source Data 1 for raw scores ordered by transgenic sublines.
- https://doi.org/10.7554/eLife.31677.025
-
Supplementary file 7
Mating procedure results for seven of the thirteen functional AGOC sublines (Non-Lifeact) from the F3 to the F7 generation.
Bold entries mark progeny that were used in the subsequent cross. F6-S, F7-O and F7-C are control crosses. No significant differences between the arithmetic means and the theoretical Mendelian ratios were found. See Source Data 1 for raw scores ordered by transgenic sublines.
- https://doi.org/10.7554/eLife.31677.026
-
Supplementary file 8
Vector summary.
The 24 vectors used/created in this study listed in order of their type. Numbers in square brackets within the Source/molecular cloning column refer to the respective entry. See also (Figure 1—figure supplement 4).
- https://doi.org/10.7554/eLife.31677.027
-
Supplementary file 9
Cloning and inverse PCR primer pairs.
Primer pairs are listed in order of appearance in the Materials and methods section and Supplementary file 3. The Applied Biosciences web calculator (www6.appliedbiosystems.com/support/techtools/calc) was used to calculate the melting temperature TM. In case of primers with overhangs, the TM was only calculated for the annealing part. Primer that introduce a restriction enzyme site also carry a 6 bp (5’-AAATTT-3’) buffer at the 5’ end. Several primers have been used in multiple inverse PCRs and are therefore also listed multiple times, as annotated within the Comment column. ExPCR, extraction polymerase chain reaction; SiRePCR, size reduction polymerase chain reaction; FuPCR, fusion polymerase chain reaction; TrPCR, transfer polymerase chain reaction; InvPCR, inverse polymerase chain reaction; ConPCR, control polymerase chain reaction; FD, forward; RV, reverse.
- https://doi.org/10.7554/eLife.31677.028
-
Supplementary file 10
Transgenic lines and sublines.
In total, 7 transgenic lines with 21 sublines were created, that is, 6 proof-of-principle AGOC sublines, 13 functional AGOC sublines and 2 helper sublines. Two of the functional AGOC sublines have been analyzed with live imaging previously, live imaging data for three more is provided in this study.
- https://doi.org/10.7554/eLife.31677.029
-
Supplementary file 11
Fluorescence stereo microscope filter sets.
All components were obtained from AHF Analysentechnik, Tübingen, Germany.
- https://doi.org/10.7554/eLife.31677.030
-
Supplementary file 12
Metadata and parameter for the long-term live-imaging datasets DS0001-0003.
- https://doi.org/10.7554/eLife.31677.031
-
Supplementary file 13
All 25 vector sequences as Genebank (.gb) and Geneious (.geneious) files compressed into a single zipped folder (.zip).
- https://doi.org/10.7554/eLife.31677.032
-
Transparent reporting form
- https://doi.org/10.7554/eLife.31677.033
Download links
A two-part list of links to download the article, or parts of the article, in various formats.
Downloads (link to download the article as PDF)
Open citations (links to open the citations from this article in various online reference manager services)
Cite this article (links to download the citations from this article in formats compatible with various reference manager tools)
A universal vector concept for a direct genotyping of transgenic organisms and a systematic creation of homozygous lines
eLife 7:e31677.
https://doi.org/10.7554/eLife.31677


