Revised roles of ISL1 in a hES cell-based model of human heart chamber specification
- Max Planck Institute for Molecular Biomedicine, Germany
- Chemical Genomics Centre of the Max Planck Society, Germany
- University of Münster, Germany
- IKERBASQUE, Basque Foundation for Science, Spain
- Biodonostia Health Research Institute, Spain
- Academic Medical Center, University of Amsterdam, Netherlands
- Maastricht University, Netherlands
Figures
Figure 1 with 1 supplement

ISL1 accelerates cardiac differentiation of hESCs without affecting cell proliferation.
(A) CRISPR-mediated knockout of ISL1 in hESCs. Left: Strategy to delete the intron 1/exon 2 splice junction using two pairs of CRISPR/Cas9 nickase vectors. Right: Validation of induced genomic deletion by genomic PCR in a positive cell line. (B) Schematic of differentiation protocol. The indicated signaling factor treatments underly all cardiac induction experiments throughout this study. (C) Immunoblot validating the absence of ISL1 protein in KO cells at day 5 following the protocol of panel B. (D) Time course gene expression analysis of cardiac genes by RT-qPCR (n = 2–7). (E) Immunoblot confirming the differentiation delay of ISL1 KO cells at the protein level. (F) Schematic of inducible expression vector (top) and doxycycline treatment protocol used in most experiments to mimic the temporal ISL1 expression pattern of WT cells during directed cardiac induction (bottom). (G) Immunoblot confirming ISL1 inducibility in clonal ISL1KO/I.TET-ON cells during directed cardiac differentiation. (H) Time course gene expression analysis of cardiac genes in ISL1KO/I.TET-ON cells (RT-qPCR, n = 2–6). (I) Western blot showing restored kinetics of cardiac differentiation following pulsed ISL1 induction in ISL1KO/I.TET-ON cells. (J) Immunostaining of cardiac troponin T at day 6 of directed differentiation. (K) Cell proliferation measured by cell counting (left, n = 4) and cell cycle analysis (right) of WT and ISL KO hESCs undergoing directed cardiac induction.
Figure 1—figure supplement 1
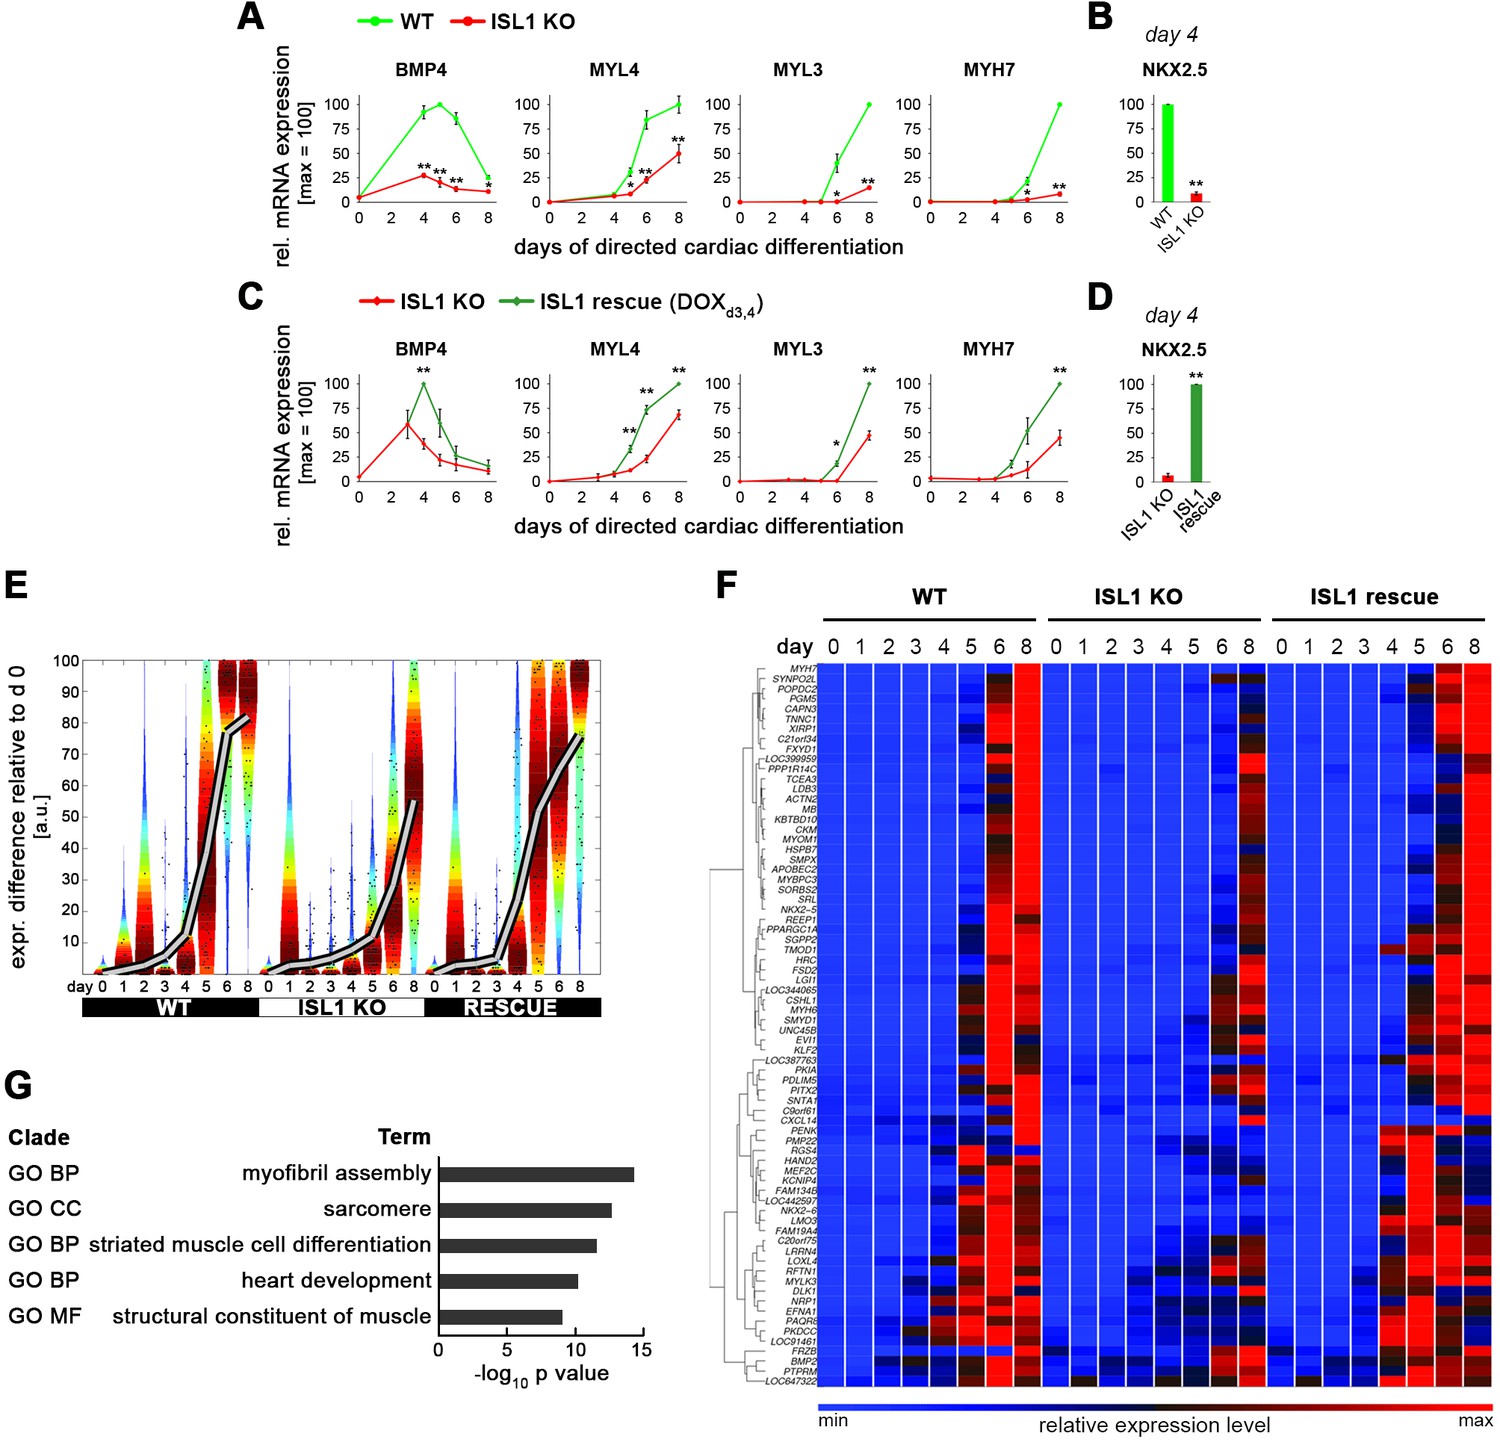
Delayed cardiac differentiation in ISL1 KO hESCs and rescue using pulsed ISL1 overexpression.
(A) Time-course gene expression analysis of additional genes involved in cardiogenesis comparing WT and ISL1 KO cells (RT-qPCR data, n = 2–5). (B) RT-qPCR analysis of NKX2.5 at day 4 of cardiac induction (n = 4). (C) Time-course gene expression analysis of genes involved in cardiac differentiation using ISL1KO/I.TET-ON cells (RT-qPCR data, n = 2–5). (D) RT-qPCR analysis of NKX2.5 at day 4 of cardiac induction using ISL1KO/I.TET-ON cells (n = 3). (E) Violin plots showing the delayed induction of a larger set of approximately 70 cardiac genes in ISL1 KO cells and the rescue using pulsed ISL1 induction on days 3 and 4. (F) Hierarchical clustering of gene set underlying the Violin plots of panel E. (G) Gene Ontology analysis of the highly cardiac-enriched gene set of panel F.
Figure 2 with 1 supplement
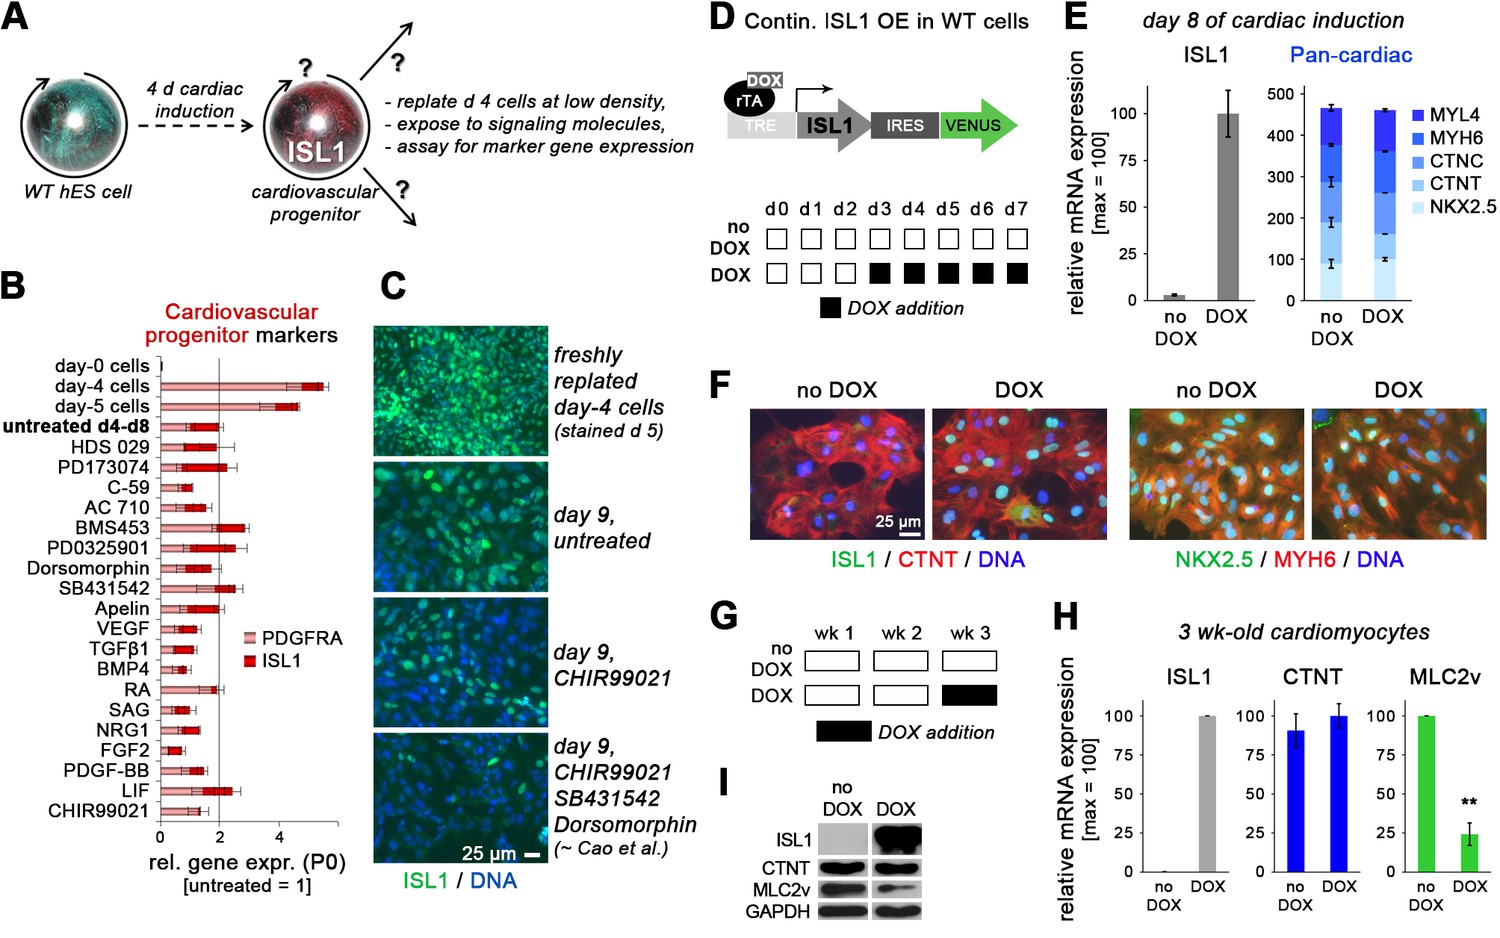
ISL1 does not stabilize the cardiovascular progenitor cell state.
(A) Assay design interrogating self-renewal and multipotent properties of ISL1-expressing cells which emerge by day 4/5 of directed cardiac differentiation. (B) RT-qPCR results from screening the indicated signaling molecules for sustaining cardiac progenitor-specific gene expression within the first passage using WT cells (n = 3–4 per sample type). (C) ISL1 immunostaining of samples treated in the indicated ways. (D) Schematic of inducible expression vector used to generate a WTI.TET-ON hESC line (top) and doxycycline treatment protocol used here to induce a continuous overexpression of ISL1 on ISL1WT background (bottom). (E) RT-qPCR analysis of ISL1 (left) and a set of 5 pan-cardiac genes (right) at day 8 of directed cardiac differentiation without or with continuous DOX treatment as shown in panel D (n = 2). (F) Immunostaining of ISL1 and early cardiomyocyte markers at day 8 of directed cardiac differentiation. Note that endogenous ISL1 has already declined in untreated cells, whereas transgenic ISL1 does not interfere with CM formation. (G) Schematic of DOX treatment protocol used here to induce ISL1 overexpression in maturating CMs. (H) RT-qPCR analysis in 3-week-old CMs following late DOX treatment of the indicated samples (n = 3). (I) Immunoblot confirming RT-qPCR analysis (H) at the protein level.
Figure 2—figure supplement 1
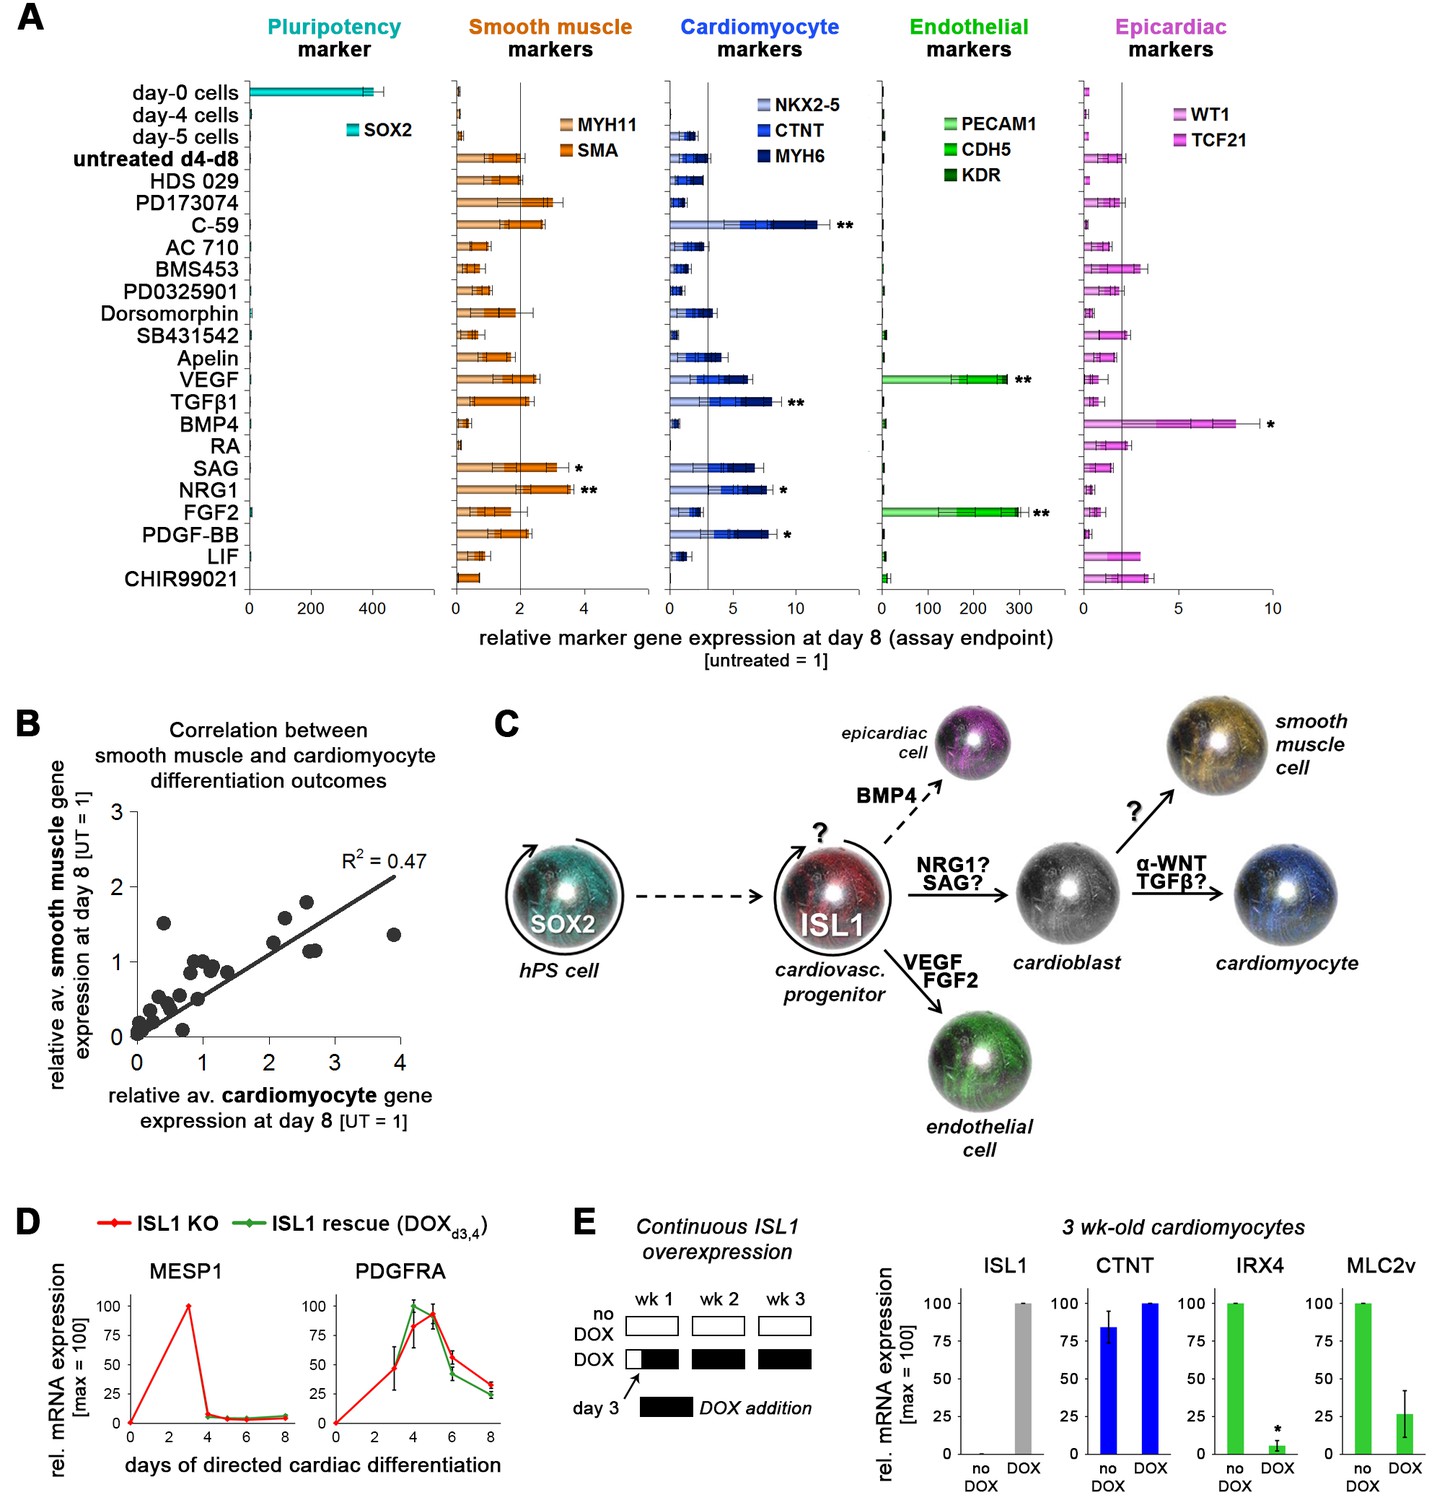
Multipotency of transient hESC-derived ISL1+ cells and effects of continuous overexpression.
(A) Marker gene expression covering various possible differentiation outcomes was assayed following exposure of ISL1-positive day-4 cells to the various molecules indicated on the left. Statistics are based on comparisons with untreated controls which are shown in the fourth row. Data are from independent experiments (n = 3–4 per sample type and gene). (B) Smooth muscle and cardiomyocyte expression data from panel B plotted against each other. (C) The data in panel B support a working model by which transient ISL1+ cells are immediately responsive to specific signaling cues giving rise to distinct cardiovascular differentiation fates. More specifically, the strong and specific induction of endothelial markers by VEGF and FGF2 suggests that this lineage becomes immediately induced from the ISL1+ state. In comparison, the correlation between smooth muscle and cardiomyocyte fates highlighted in panel C suggests that the diverging point of these two lineages lies after the ISL1+ stage, that is at a putative bipotent cardioblast state as indicated, in agreement with Wu et al. (2006). (D) Short-term ISL1 induction does not affect expression of independent cardiac mesoderm/cardiac precursor genes (RT-qPCR data, n = 2–4). (E) Continuous ISL1 overexpression on ISLKO/I.TET-ON background suppresses ventricular specification in the long term (RT-qPCR data at 3 weeks, n = 2).
Figure 3 with 1 supplement

ISL1 KO phenocopies an atrial wild-type CM phenotype induced by retinoic acid.
(A) Upon directed cardiac induction, ISL1 KO as well as RA-treated wild-type hESCs display delayed terminal CM differentiation reflected by a later initiation of spontaneous beating (semiquantitiative analysis, n = 3–14 per sample). ‘ISL1’ and ‘no RA’ denote different batches of WT HuES6 cells. (B) Immunofluorescence analysis of the early CM marker myosin heavy chain 6 upon directed cardiac differentiation of the indicated samples/cell lines. ‘ISL1’ cells are d 3/4 transgene-induced ISL1 KO hESCs. (C) Expression pattern of atrial and ventricular-enriched genes in the indicated in vivo and hESC-derived samples. Primary human heart samples served as specificity controls (microarray data). (D) Confirmation of ventricular and atrial-specific gene expression profiles by RT-qPCR in independent sets of experiments (n = 4–7 per sample type). (E) Immunoblots 3 wk after the initiation of cardiac differentiation for ventricular-specific myosin light chain and atrial natriuretic peptide. (F) Confirmation of cardiac subtype-specific phenotypes by immunostaining (~3 wk time point). (G) Model summarizing the opposing roles of ISL1 and RA signaling in cardiac subtype specification. (H) Enhanced atrial and further reduced ventricular gene expression in RA-treated ISL1 KO CMs as compared to RA-treated WT and untreated ISL1 KO cells (RT-qPCR data at ~2.5 wk, n = 3). (I) Spontaneous beating analysis of the indicated hESC-CM samples on multielectrode arrays. Left: Representative traces. Right: Beating rate quantification (ntech. = 3). Results were reproducible in independent experiments. (J) Representative action potential traces from patch clamp analyses of the indicated types of hESC-CMs. Note the additional action potential shortening upon combining ISL1 depletion with RA treatment. See Supplementary file 2 for averaged data from independent samples. In case of using ISL1KO/I.TET-ON cells, all ISL1+ data in this figure are based on a day 3–4 treatment with DOX.
Figure 3—figure supplement 1
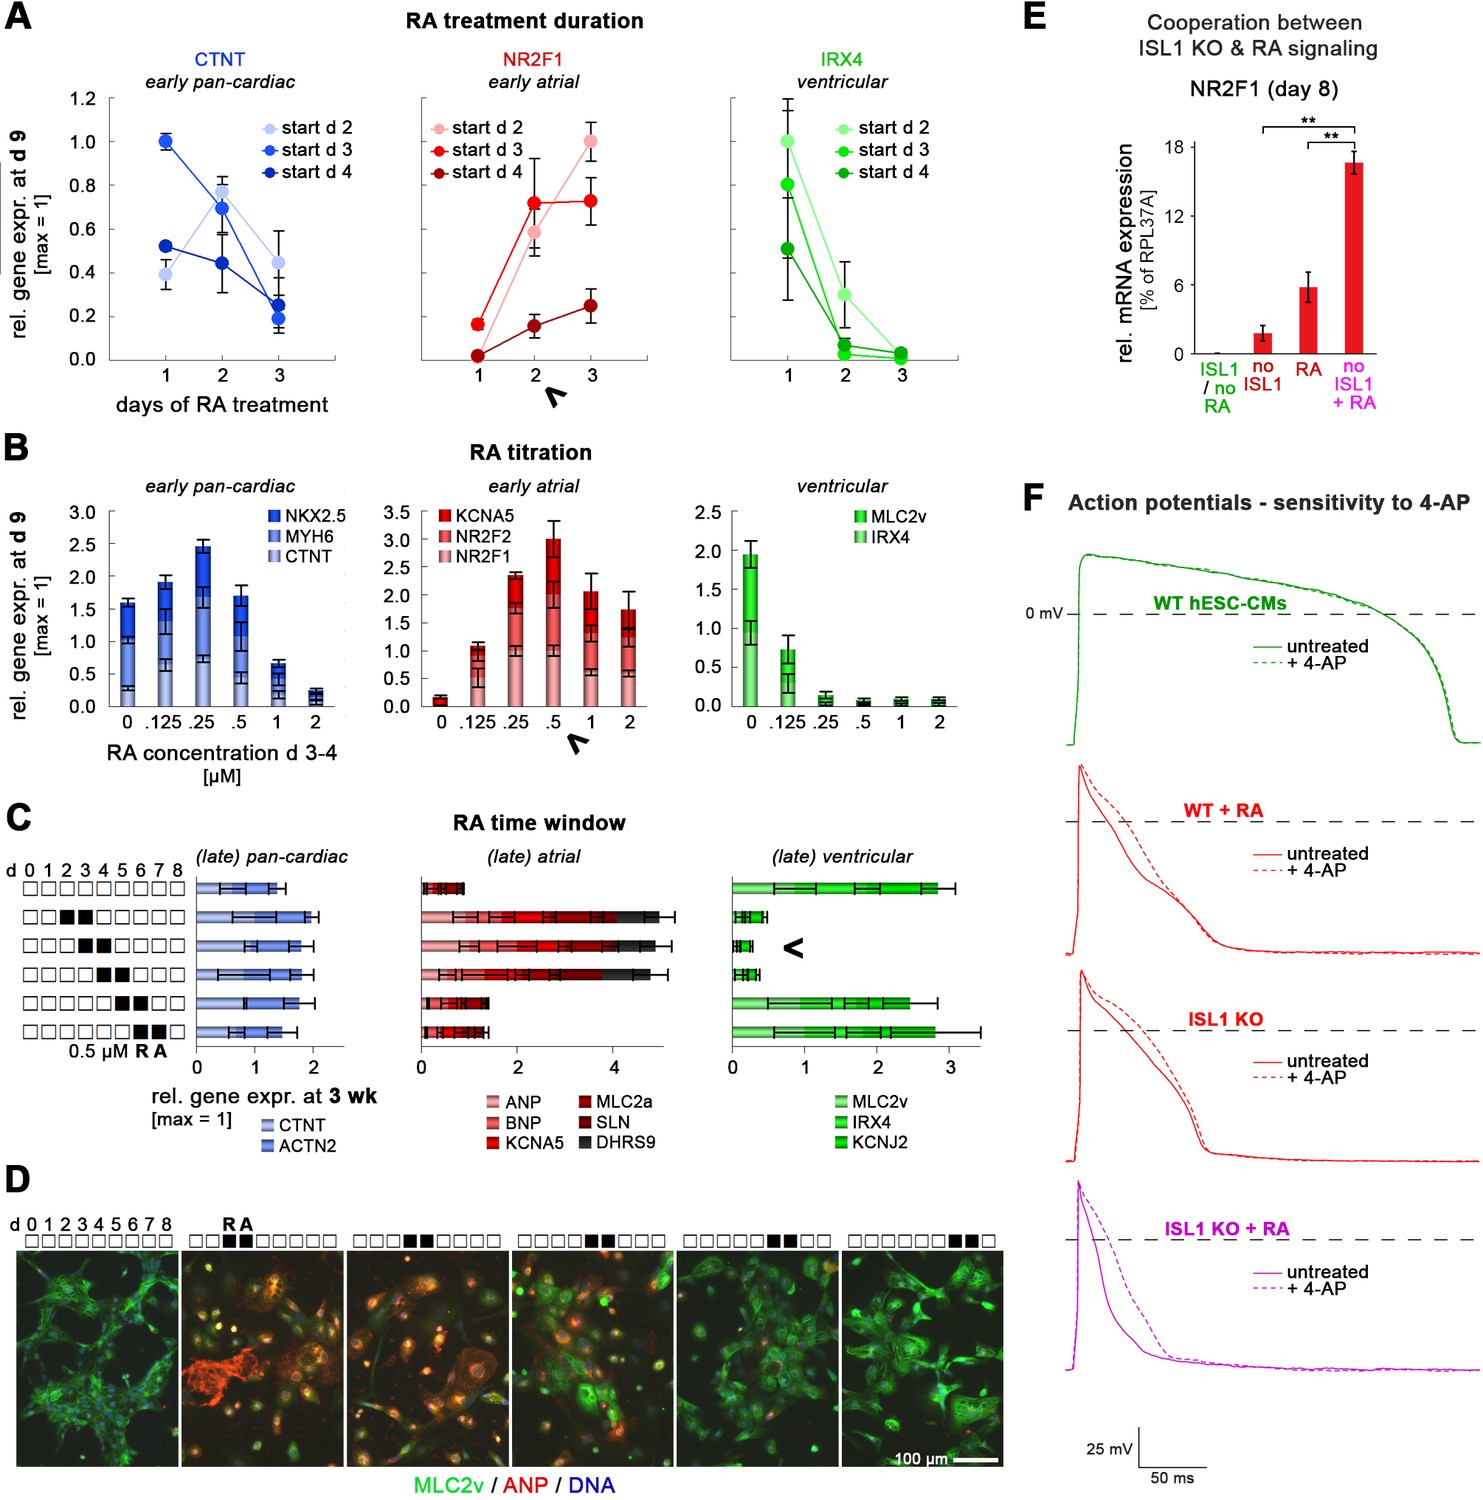
Atrial specification promoted by RA stimulation or ISL1 knockout.
Panels A-C comprise optimization experiments to elucidate experimental conditions for atrial CM induction as the expense of a ventricular fate. (A) Optimization of RA treatment duration during cardiac induction of WT hESCs (qPCR data, n = 3). Arrow head indicates that a 2-day treatment was most optimal, since it promoted atrial marker induction at the expense of ventricular-specific gene expression while not yet compromising overall cardiac differentiation (compare to data in left chart). (B) Optimization of RA concentration for promoting an atrial CM fate. Differentiating WT hESCs were RA-treated on days 3 and 4. Arrow head indicates most optimal concentration at which (i) pan-cardiac differentiation was not yet compromised (left chart), (ii) atrial markers were maximally induced (middle chart), and (iii) ventricular genes became fully repressed (right chart). Data are from three independent experiments. (C) Elucidation of the RA-responsive time window during cardiac induction for promoting an atrial cell fate in the long-term (n = 3–6 per data point). Cells were treated during the first week of differentiation as indicated and analyzed after ~3 weeks. Arrow head indicates most reliable time window for exposure to RA (0.5 µM). (D) RA sliding window experiment analyzed via immunocytochemistry 4 weeks after differentiation start. (E) Enhanced expression of the atrial inducer NR2F1 in RA-treated ISL1 KO CMs as compared to RA-treated WT and untreated ISL1 KO cells (RT-qPCR data at day 8, n = 3–12). (F) Pharmacological inhibition of the atrial-specific ion channel KCNA5 discriminates ISL1 KO cardiomyocytes from WT ones in a functional manner. Data shows representative action potential traces before and after 4-AP treatment to block KCNA5. Also see Supplementary file 2B for averaged data from various patched cells. Note that only WT hESC-CMs were insensitive to 4-AP, reflecting an overall ventricular identity. ISL1 KO CMs exposed to RA (0.5 µM on days 3 and 4) during cardiac induction show an enhanced atrial phenotype compared to WT + RA and RA-untreated ISL1 KO CMs, which is characterized by decreased AP durations and an enhanced relative AP duration increase by 4-AP (bottom panel, Supplementary file 2).
Figure 4 with 1 supplement
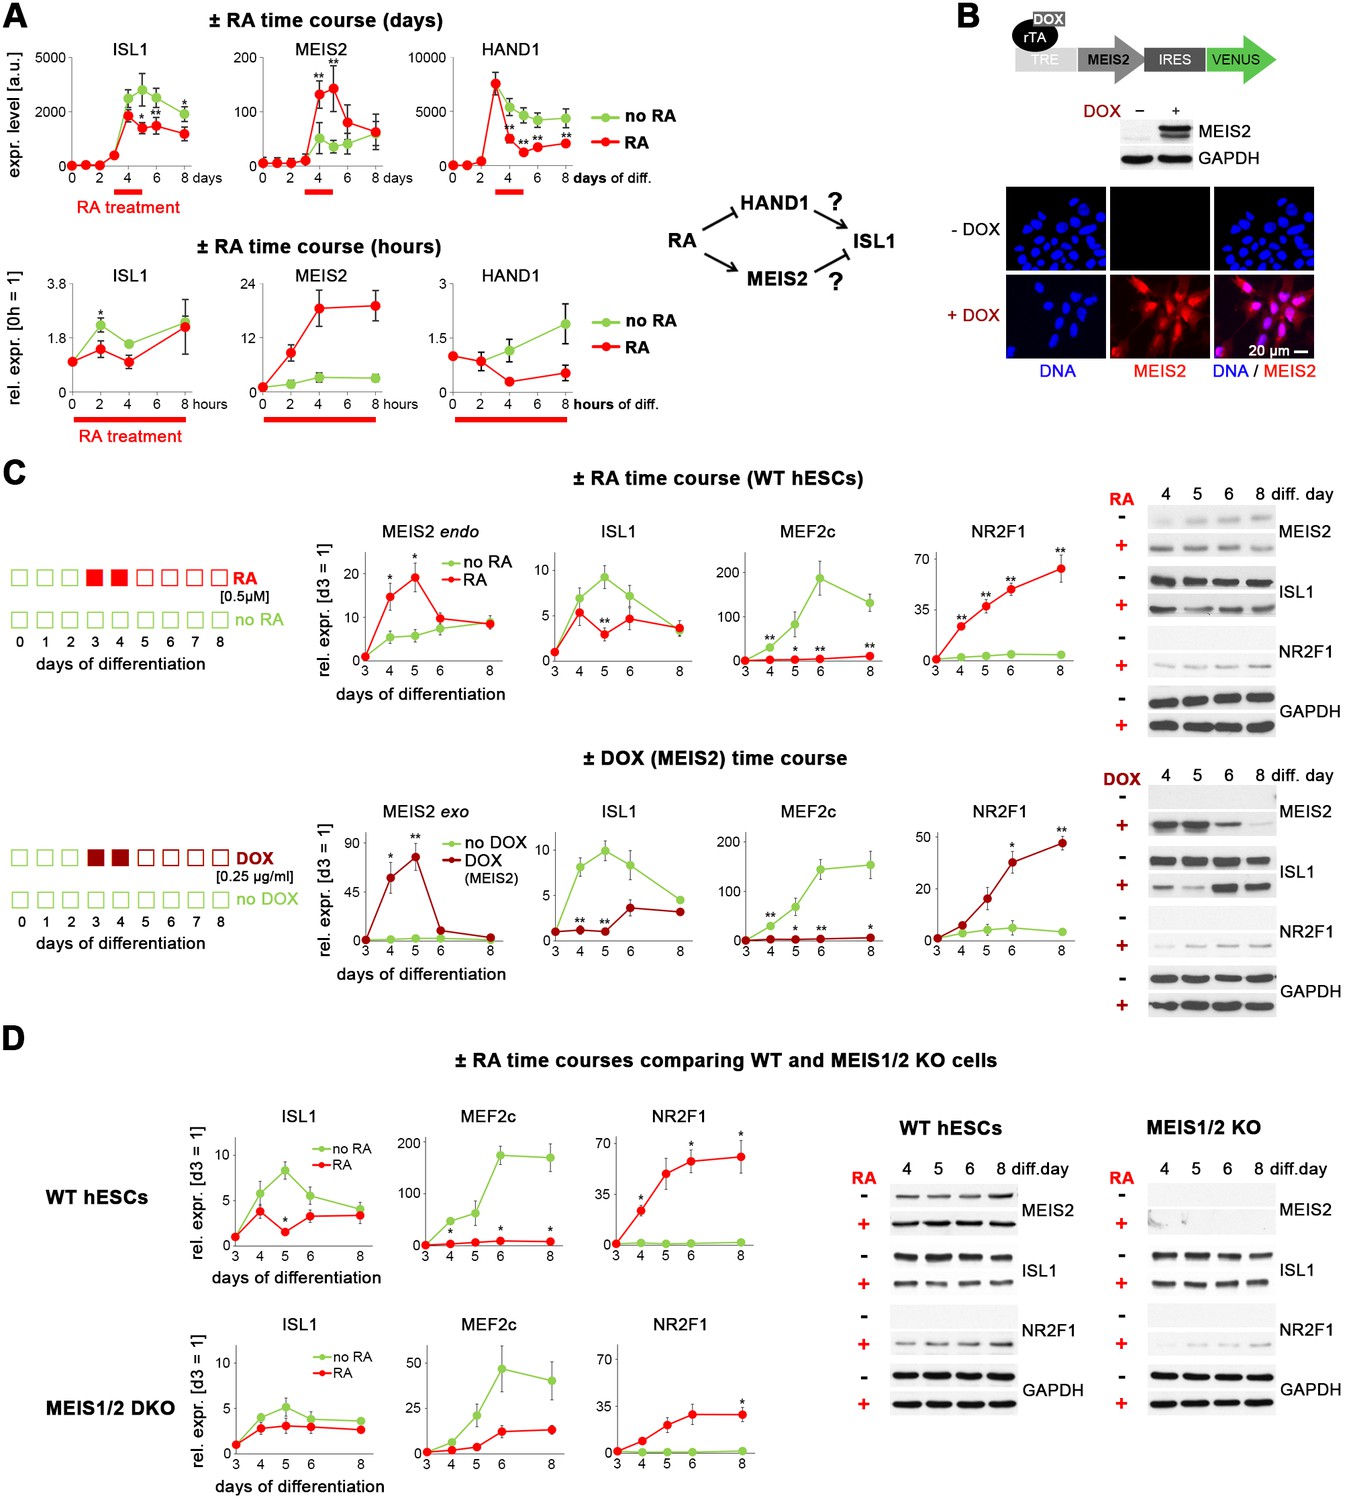
Retinoic acid signaling antagonizes ISL1 by inducing MEIS2.
(A) Top left: Microarray-based time course gene expression analysis of untreated and RA-treated (0.5 µM on d 3–4) WT hESCs subjected to cardiac induction conditions (from Supplementary file 1). Bottom left: RT-qPCR analysis over several hours on day 3 of cardiac induction (n = 2–3). Filtering criteria: >3 fold expression difference at day 5 between ± RA and confirmed short-term effect within 4 hr of RA treatment. Right: Deduced working hypotheses on indirect suppression of ISL1 by RA. (B) Top: Schematic of PiggyBac vector for DOX-inducible MEIS2 expression (top). Middle: Immunoblot on day 5 of cardiac differentiation confirming MEIS2 induction in clonal WTM.TET-ON hESCs following DOX addition (d 3–4). Bottom: Immunostaining confirming predominantly nuclear MEIS2 (isoform D) localization. (C) ± RA and ± DOX (MEIS2) differentiation time courses using WTM.TET-ON hESCs. Left: RT-qPCR analysis (n = 4–6 each). Right: Western blot analysis. (D) Comparative analysis of HuES6 WT and MEIS1/2 KO hESC differentiation without or with RA addition (d 3–4). Left: RT-qPCR analysis (n = 3 each). Right: Corresponding immunoblot analysis.
Figure 4—figure supplement 1
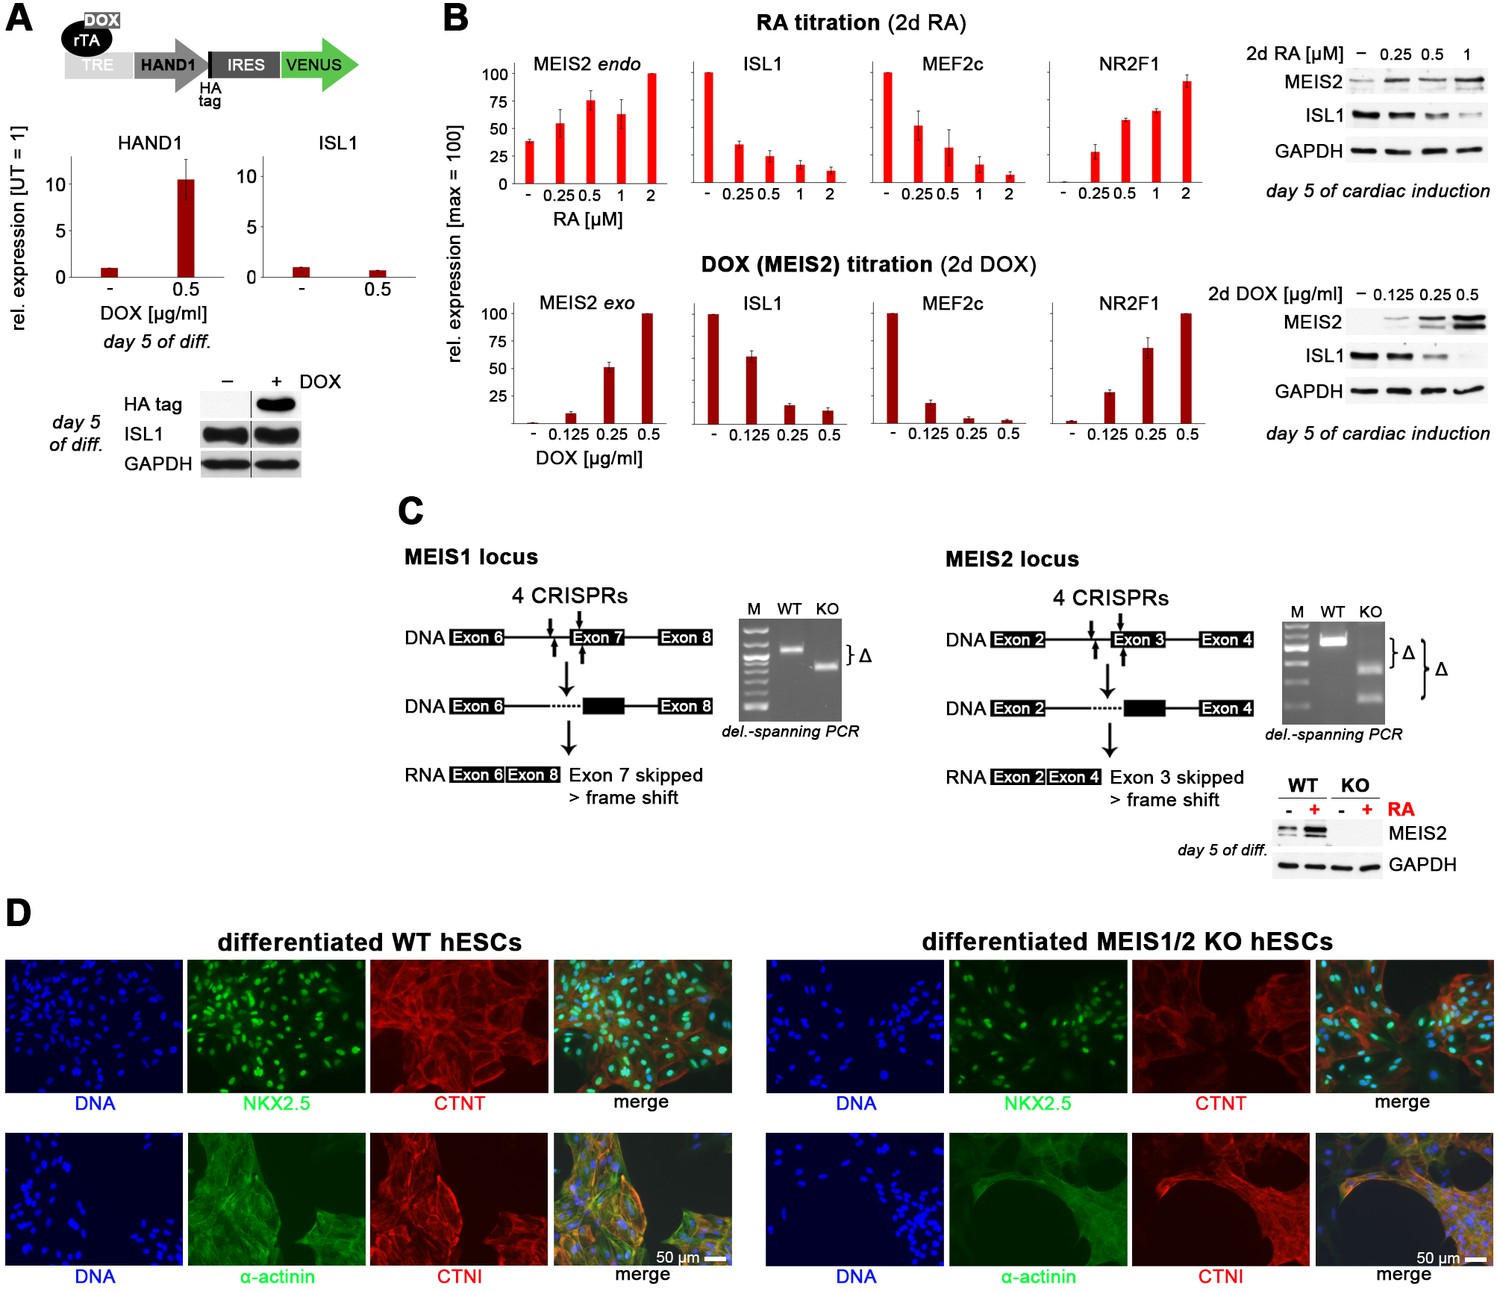
Induced HAND1 and MEIS2 overexpression experiments and MEIS1/2 double-knockout.
(A) Top: HAND1 PiggyBac construct for inducible overexpression. Middle: Induced HAND1 overexpression in differentiating clonal WTH.TET-ON hESCs does not upregulate ISL1, falsifying one of two working hypotheses. Bottom: Confirmation of this result at protein level (immunoblot). (B) Top: RA signaling dose dependency of regulated gene expression analyzed by RT-qPCR (n = 4) and western blotting at day 5 of differentiation. Bottom: MEIS2 overexpression level dependency of regulated gene expression analyzed by RT-qPCR (n = 4) and western blotting at day 5 of differentiation. (C) Illustrations of MEIS1 (left) and MEIS2 (right) knockout approaches and confirmation of deleted alleles in clonal MEIS1/2 double-knockout hESCs. Bottom right: Confirmation of MEIS2 knockout in differentiating MEIS1/2 DKO hESCs by immunoblotting. (D) MEIS1/2 DKO hESCs are not defective in upregulating key pan-cardiac markers upon directed cardiac induction. Structural CM proteins appeared to be less organized in MEIS1/2 DKO cells, however, and these cells did not show a macroscopic beating phenotype.
Figure 5 with 1 supplement
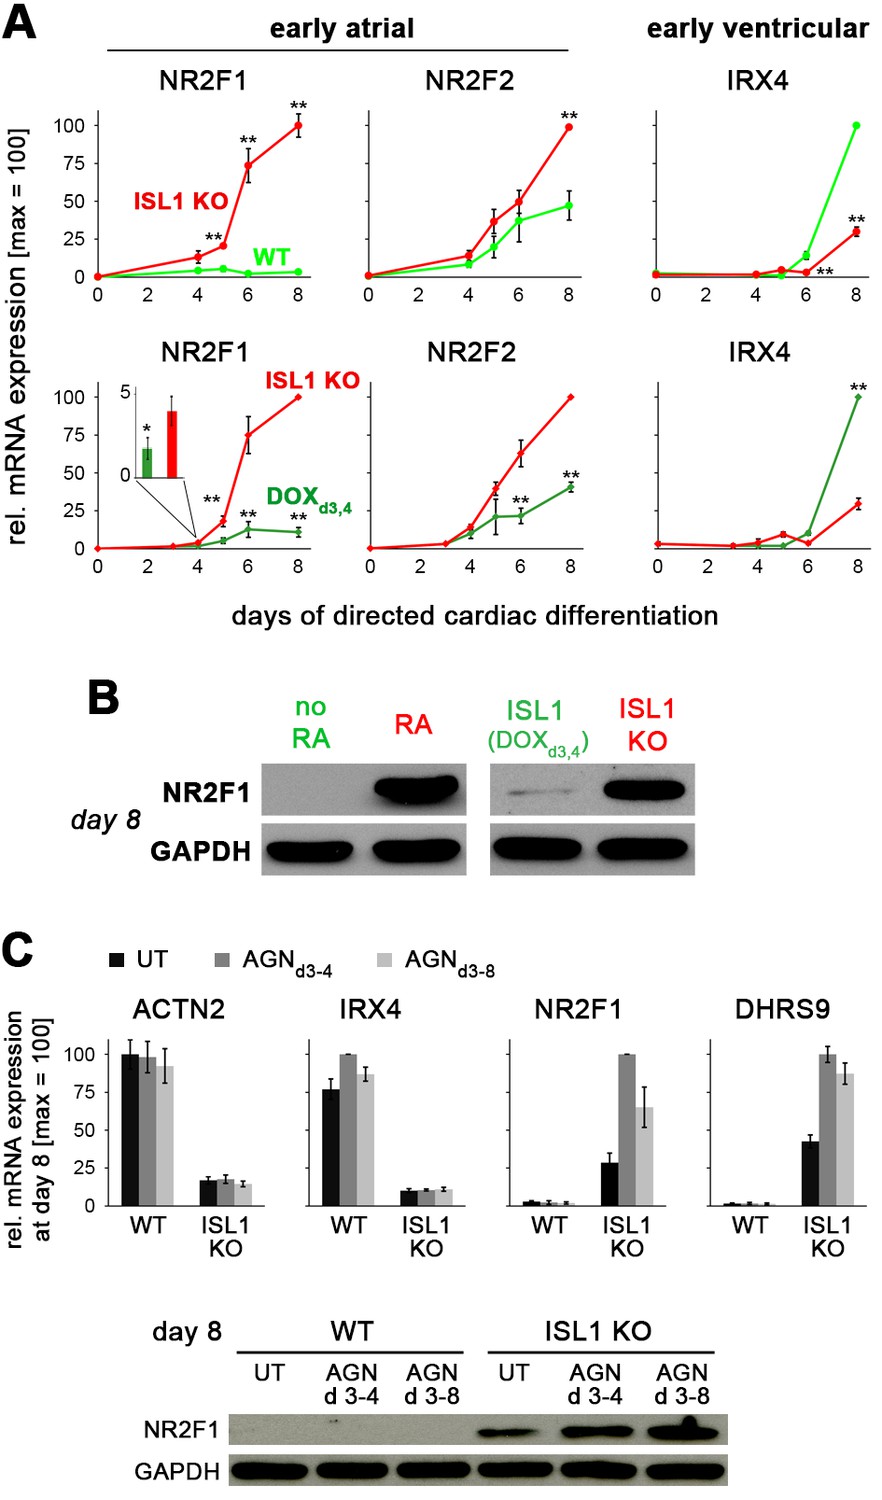
ISL1 suppresses the early atrial specifier NR2F1.
(A) Time course gene expression analysis of early atrial and ventricular genes by RT-qPCR (n = 2–10 per data point). Comparison between WT and ISL1 KO cells (top), and ISL1 KO versus pulsed ISL1 rescue (bottom, with ISL1KO/I.TET-ON cells). Note the immediate-early effect on NR2F1, which is not seen in case of NR2F2 or IRX4. (B) Immunoblot for NR2F1 at an early CM stage. (C) RA receptor antagonist AGN 193109 (100 nM) does not rescue the phenotype of ISL1 KO cells, as shown by RT-qPCR (top, n = 4) and immunoblot (bottom) in the indicated conditions.
Figure 5—figure supplement 1
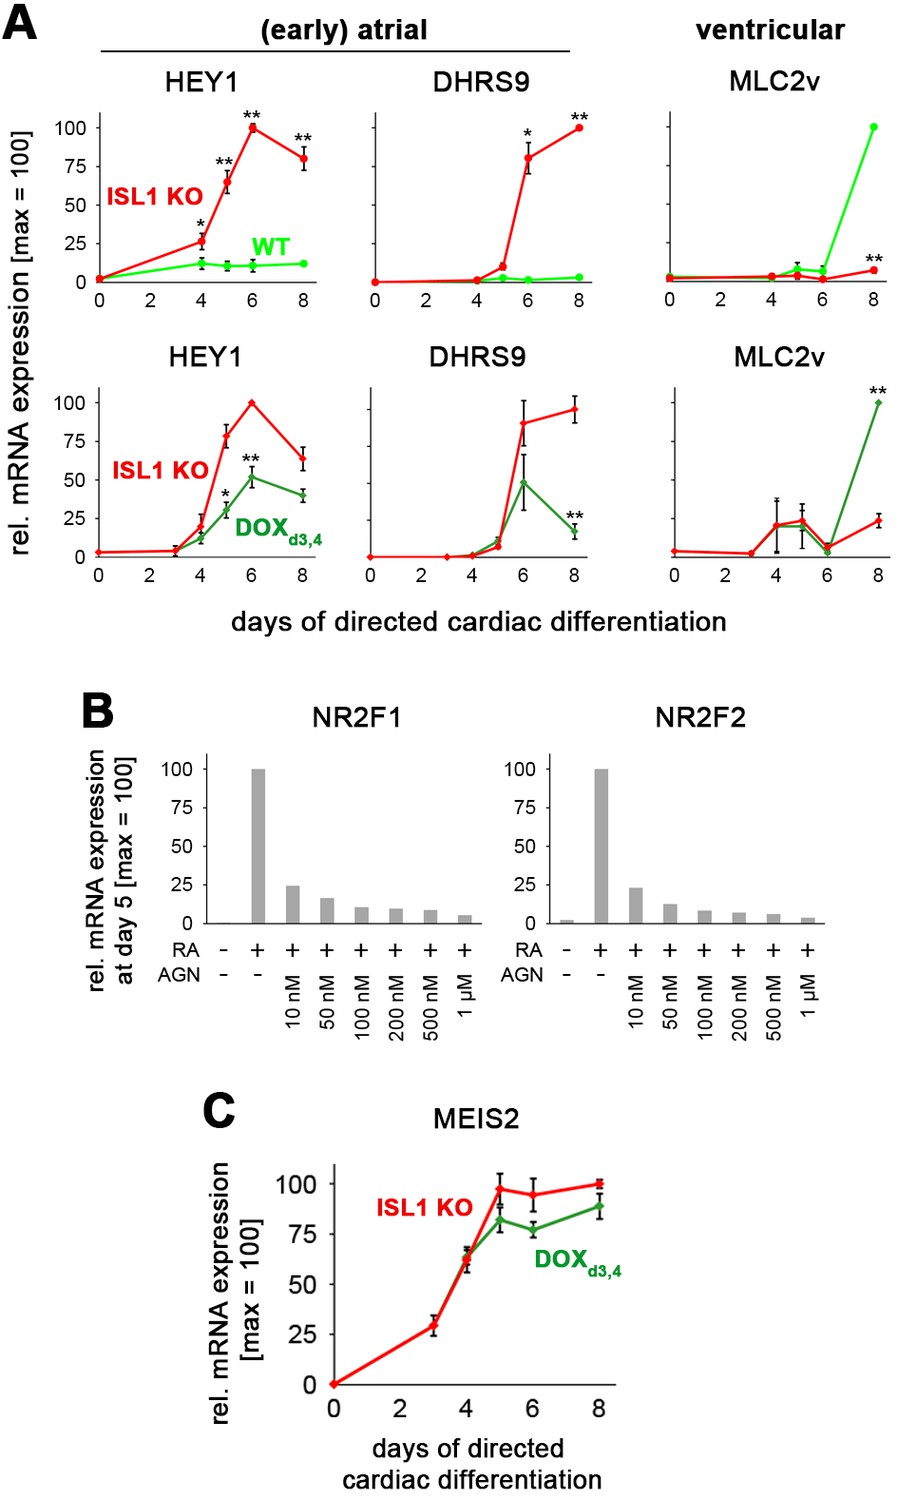
ISL1 represses the atrial program in favor of ventricular specification.
(A) Time-course gene expression analysis of atrial and ventricular markers by RT-qPCR (n = 2–10 per data point). Top: Comparison between WT and ISL1 KO cells. Bottom: Comparison between ISL1 KO versus transient DOX administration in ISL1KO/I.TET-ON cells. (B) Pan RA receptor antagonist AGN 193109 (AGN) effectively represses the RA-driven expression of the early atrial inducers NR2F1 and NR2F2 (RT-qPCR, n = 1). (C) Pulsed ISL1 induction does not determine MEIS2 downregulation (RT-qPCR, n = 3–5).
Figure 6 with 1 supplement
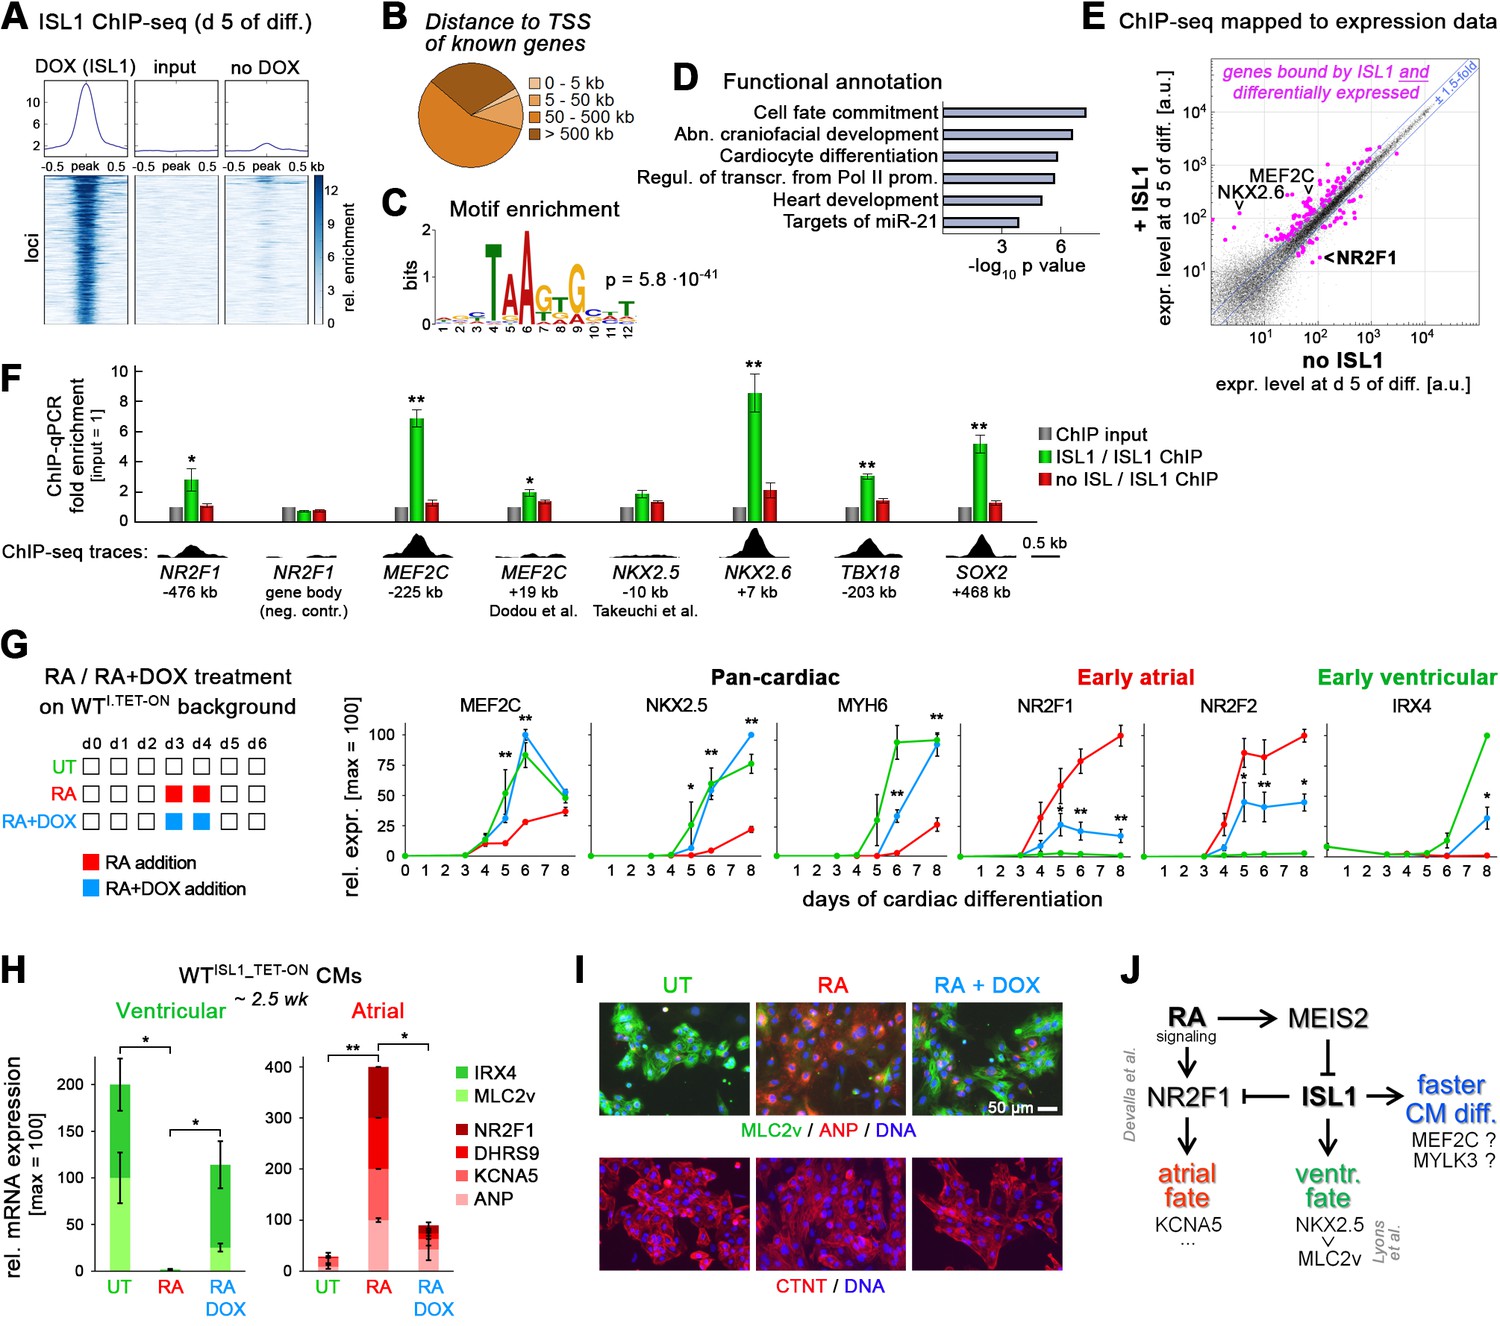
ISL1 functionally antagonizes atrial specification driven by RA signaling.
(A) ISL1 ChIP-sequencing in differentiating ISL1KO/I.TET-ON cells. Summary plot of normalized scores for ISL1 peak regions (top) and intensity-sorted heat map for detected peaks called in DOX-treated samples versus ChIP input DNA (also see Supplementary file 3). No-DOX cells served as an additional specificity control. Minor signals in this sample likely result from leaky transgene expression. (B) ISL1-bound peak distribution relative to transcription start sites of known genes. (C) Single enriched motif identified using DNA sequences underlying ISL1-bound peak regions. (D) Functional annotation of gene set associated with ISL1 peaks (also see Supplementary file 3). (E) Highlighting of ISL1-bound genes in a scatter plot revealing ISL1-induced differential gene expression at day 5 of differentiation (line ISL1KO/I.TET-ON, ± DOX treated at d 3–4). Expression ratio cutoff: 1.5-fold. Also see color-coded data in Supplementary file 3. (F) ChIP-qPCR analysis in differentiating ISL1KO/I.TET-ON hESCs of newly identified ISL1-bound sites as well as of regions homologous to published mouse ISL1 enhancers (n = 4–5). See Supplementary file 4 for amplicons used. Bottom: Corresponding ISL1 ChIP-seq pileups. (G) Left: Design of RA/ISL1 competition experiment using WTI.TET-ON cells. Right: RT-qPCR analysis (n = 4). (H) CM fate analysis of RA/ISL1 competition experiment at 2.5 wk (RT-qPCR data, n = 4). (I) CM subtype analysis of the indicated samples 3 wk after differentiation start. (J) Elucidated regulatory module controlling cardiac subtype specification and CM formation speed in differentiating hESCs. See text for discussion. The RA-NR2F1-KCNA5 axis has previously been revealed by Devalla et al. (2015).
Figure 6—figure supplement 1
ISL1-controlled gene expression in differentiating hESCs.
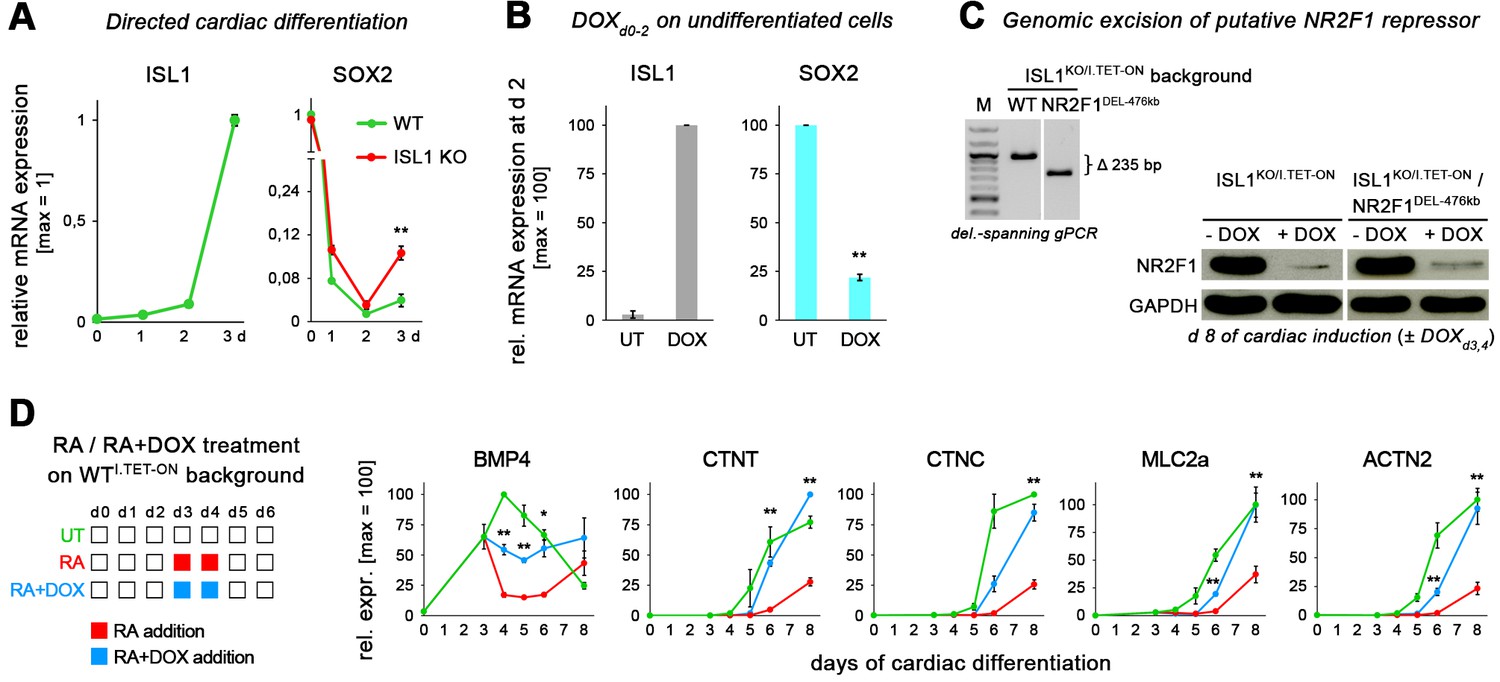
(A) Upon cardiac induction of ISL1 KO cells, anti-mesodermal SOX2 becomes reinduced at moderate levels, indicating a SOX2-repressing function of ISL1 (RT-qPCR data, n = 2). (B) ISL1 induction in undifferentiated hESCs represses SOX2 (RT-qPCR data, n = 3, line WTI.TET-ON). (C) Left: CRISPR-mediated excision of an ISL1 ChIP-seq peak region upstream of NR2F1. See Supplementary file 4 for DNA sequence information. This genetic manipulation was performed on an ISL1KO/I.TET-ON background to then monitor NR2F1 expression in both ISL1-positive and ISL1-deficient scenarios. Right: western blot analysis of differentiating hESCs with the indicated genotypes. Excision of the putative ISL1-regulated element upstream of NR2F1 did not abolish the negative regulatory effect of ISL1 (DOX) on NR2F1. (D) Additional cardiac genes monitored in RA/ISL1 competition experiments (n = 3–4).
Videos
Video 1
Spontaneously beating WT hESC-CMs.
Stereo microscopic view of WT cells at day 8 of cardiac differentiation (24-well format).
Video 2
Spontaneously beating ISL1 KO hESC-CMs.
Stereo microscopic view of ISL1 KO cells at day 8 of cardiac differentiation.
Video 3
Spontaneously beating ISL1 KO hESC-CMs rescued by transgenic ISL1 induction at days 3 and 4.
Stereo microscopic view of ISL1KO/I.TET-ON cells treated with DOXd3,4 (day 8 of cardiac differentiation).
Additional files
-
Supplementary file 1
Genome-wide expression time-series
Data denote expression levels [a.u.] of the indicated genes upon cardiac induction of hESCs which were perturbed genetically or signaling-wise: The first two time-series compare ISL1-deficient with ISL1-expressing hESCs. The latter two time-courses are based on wild-type hESCs differentiated in the presence or absence of retinoic acid. Both DOX (to induce ISL1) and RA were administered at days 3 and 4 such that the pairwise time-series are diverging from day four onwards.
- https://doi.org/10.7554/eLife.31706.017
-
Supplementary file 2
Action potential measurements by single-cell patch clamping
(A) Baseline AP measurements of four groups of hESC-CM samples: WT and ISL1 KO cells differentiated with or without RAd3,4. MDP: maximum membrane depolarization; APAmax: maximum AP amplitude; Vmax: maximum upstroke velocity; APD20, APD50, APD90: AP duration at 20, 50% and 90% of repolarization, respectively; APAplat: plateau amplitude. Conditional formatting highlights the enhanced atrial phenotype of RA-treated ISL1 KO cells. (B) Relative AP parameter values following treatment of the cells with the KCNA5 inhibitor 4-AP (50 µM). Data in each group are expressed as % of untreated controls which were set to 100. Relative changes are highlighted using conditional formatting.
- https://doi.org/10.7554/eLife.31706.018
-
Supplementary file 3
Processed ISL1 ChIP-seq data
Genomic regions with enriched ISL1 binding as compared to input ChIP DNA. Cells were captured on day 5 of directed cardiac differentiation. Up to two nearest gene loci within 1 Mb are indicated for each hit region. Columns J and M contain expression ratios between ISL1-positive versus ISL1-deficient hESCs at day 5 of differentiation, as extracted from Supplementary file 1, to indicate which binding events may directly translate into differential gene expression. Up or downregulated genes are indicated using conditional formatting (green or red shading, respectively).
- https://doi.org/10.7554/eLife.31706.019
-
Supplementary file 4
Oligonucleotides (A), antibodies (B), and signaling molecules (C) used in this study.
- https://doi.org/10.7554/eLife.31706.020
-
Transparent reporting form
- https://doi.org/10.7554/eLife.31706.021
Download links
A two-part list of links to download the article, or parts of the article, in various formats.
Downloads (link to download the article as PDF)
Open citations (links to open the citations from this article in various online reference manager services)
Cite this article (links to download the citations from this article in formats compatible with various reference manager tools)
Revised roles of ISL1 in a hES cell-based model of human heart chamber specification
eLife 7:e31706.
https://doi.org/10.7554/eLife.31706


