p53 orchestrates DNA replication restart homeostasis by suppressing mutagenic RAD52 and POLθ pathways
- University of Texas MD Anderson Cancer Center, United States
- The Wistar Institute, United States
Figures
Figure 1 with 1 supplement
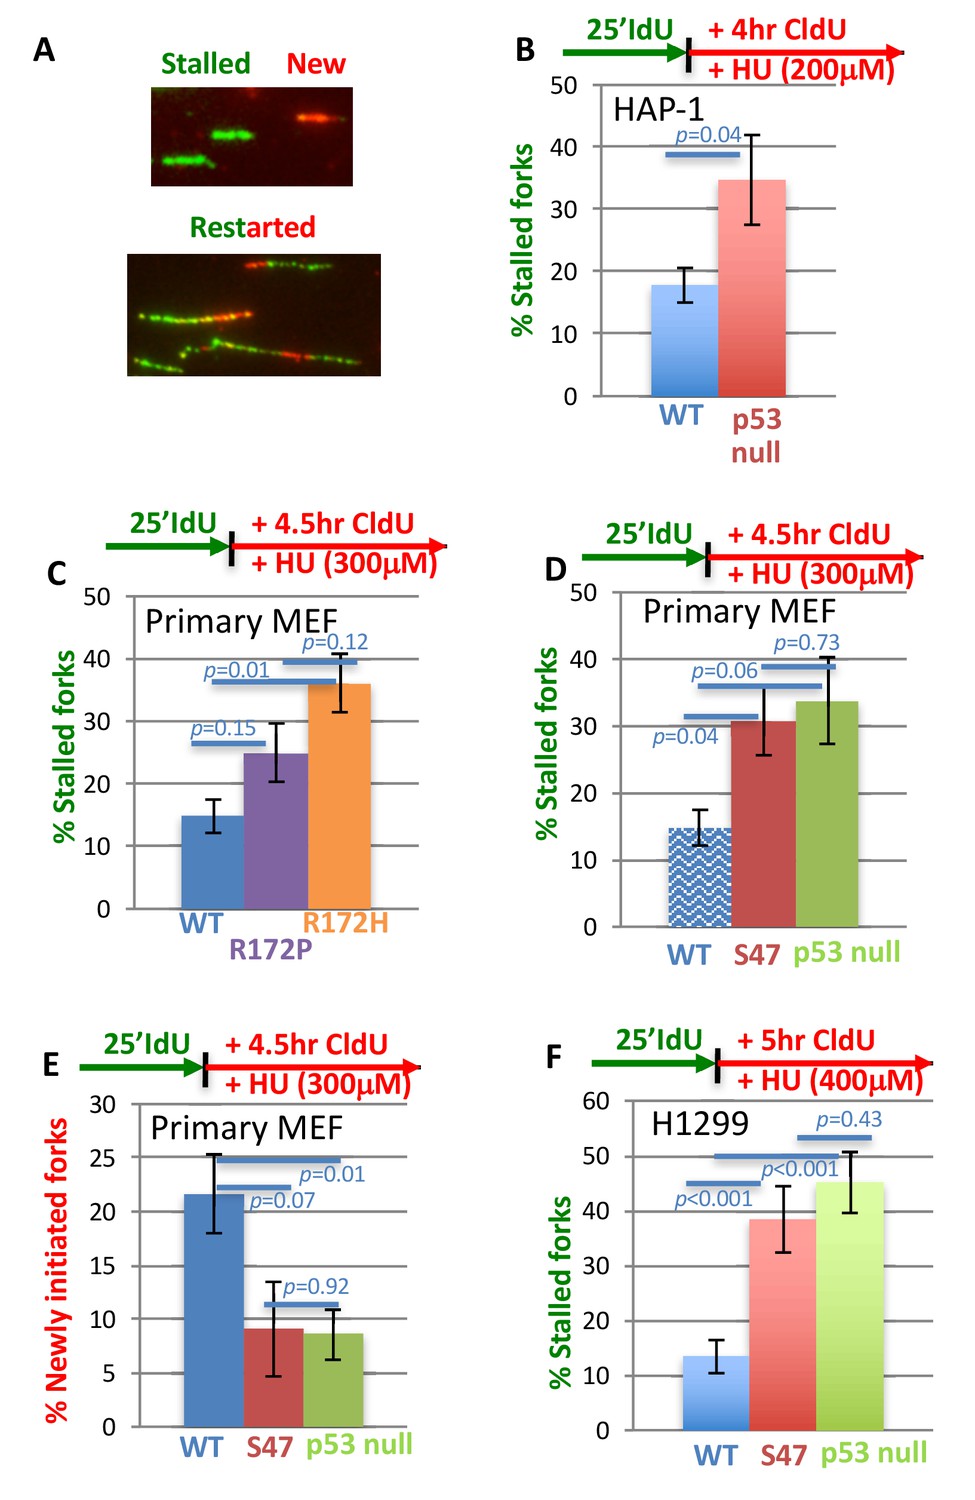
With one supplement p53 promotes efficient replication restart of stalled DNA forks.
(A) Representative image of DNA fibers. The number of stalled forks (# stalled/(# stalled +#restarted) or newly initiated origins ((# CldU/(# stalled +# restarted +#new) is obtained in the following panels. (B) HAP-1 p53 null cells (C) primary MEF with GOF p53 R172P (apoptosis deficient, mildly tumor prone) and p53 R172H (apoptosis deficient, strongly tumor prone), (D, E) primary MEF with p53 S47 (apoptosis and greatly transcription proficient) and null for p53 (for better comparison WT p53 of (C) is re-plotted, shady blue), and (F) human H1299 cells with inducible p53 WT or S47. Error bars represent the SEM. Significance values are derived from student T-test analysis.
Figure 1—figure supplement 1
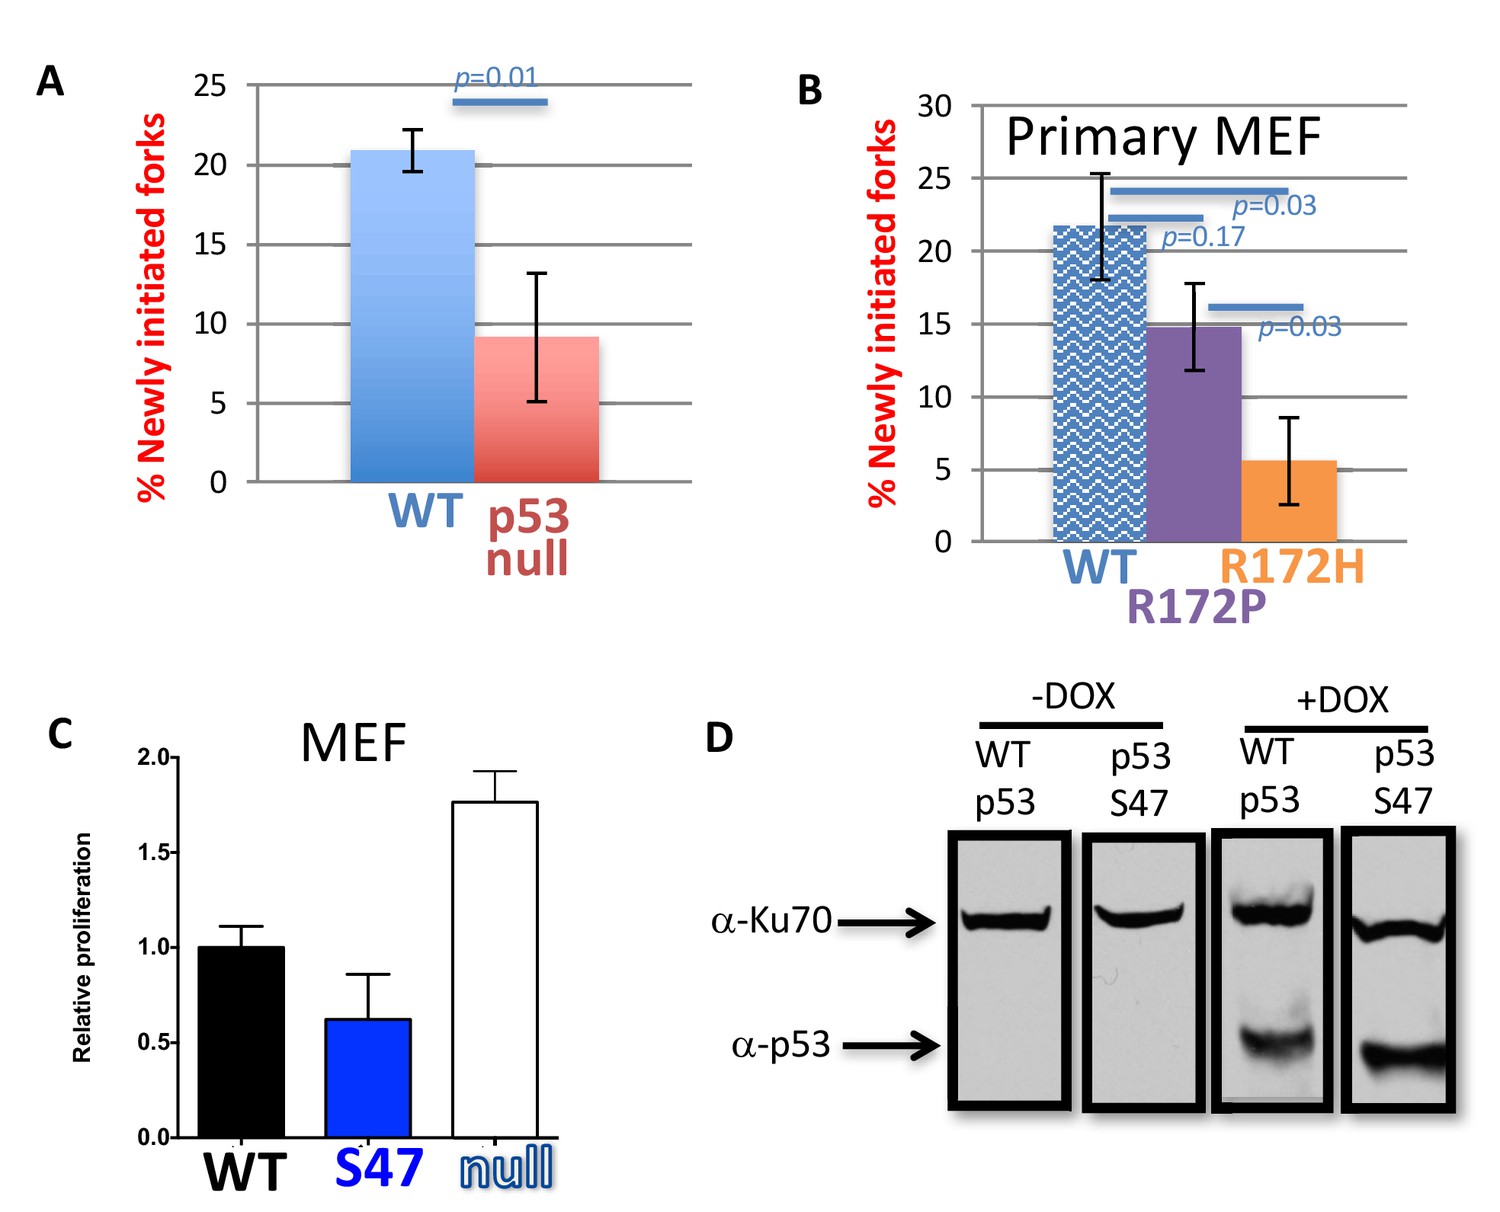
Mutant p53 exhibits unconvenional replication restart.
(A) DNA fibers analysis of newly initiated forks of p53 null and WT HAP-1 cells with replication stalling (HU, 200 mM). (B) DNA fibers analysis of newly initiated forks of primary MEF with WT, GOF p53 R172P and p53 R172H cells with replication stalling (HU, 300 mM). (C) Expression of p53 S47 and p53 WT suppress proliferation compared to primary MEF without p53 as measured by MTT proliferation assay, consistent with intact cell cycle checkpoint functions in the mutant. (D) Doxycycline induced expression of WT and mutant p53 S47 in H1299 cells.
Figure 2 with 1 supplement
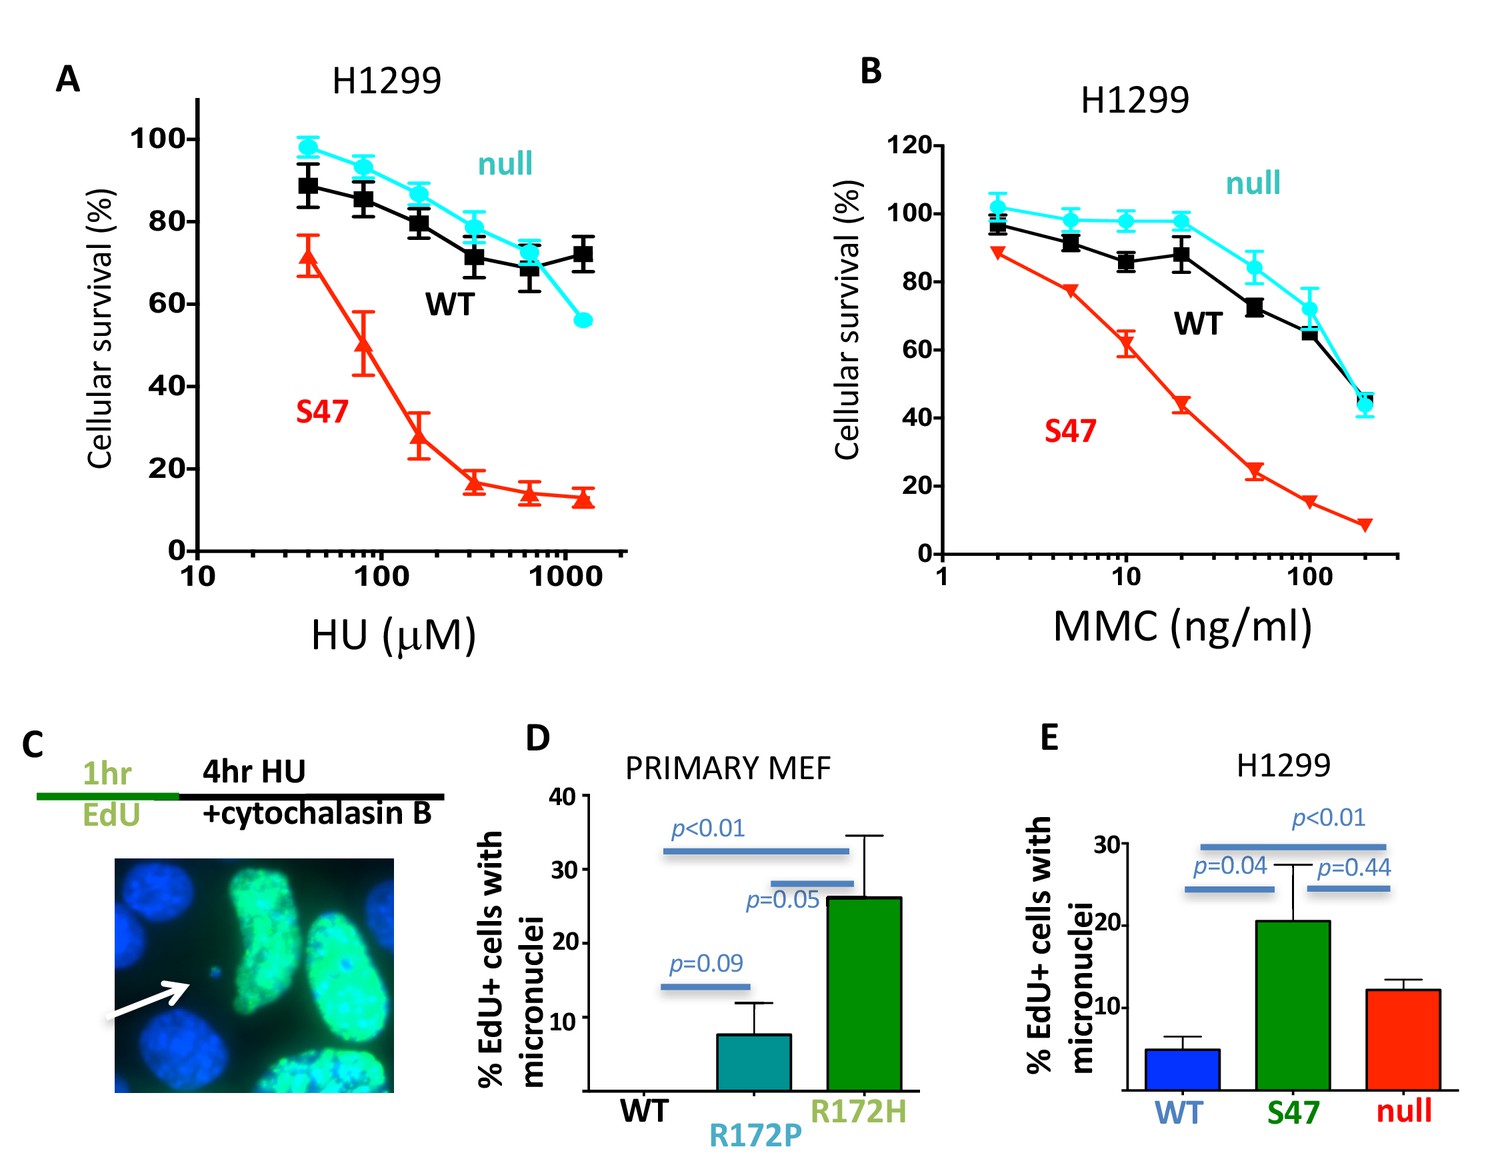
With one supplement p53 promotes replication-dependent genomic stability.
(A) Cellular sensitivity to replication stalling with hydroxyurea (HU) in H1299 cells. (B) Cellular sensitivity to replication stalling with mitomycin C (MMC) in H1299 cells. (C) Experimental scheme and representative image of micronuclei; Scored are EdU-positive cells with micronuclei only that were in S-phase during replication stalling with HU and that are blocked during cytokinesis immediately following the offending S-phase. (D) Micronuclei in primary p53 R172P and R172H MEF and (E) human H1299 p53 WT, S47 and null cells. Error bars represent the SEM. Significance values are derived from student T-test analysis.
Figure 2—figure supplement 1
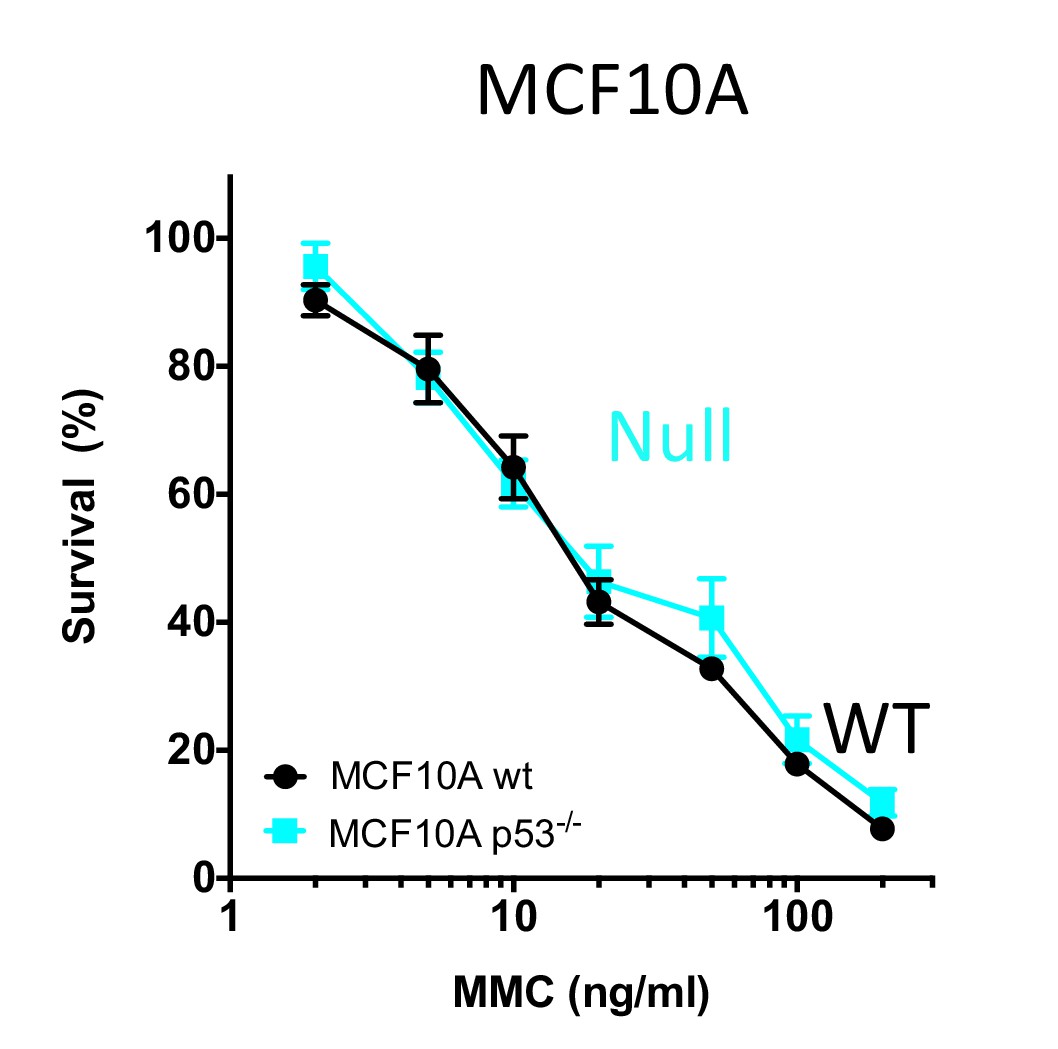
p53 null MCF10A cells show similar sensitivity to mitomycin C compared to WT p53 MCF10A cells.
https://doi.org/10.7554/eLife.31723.006
Figure 3 with 1 supplement
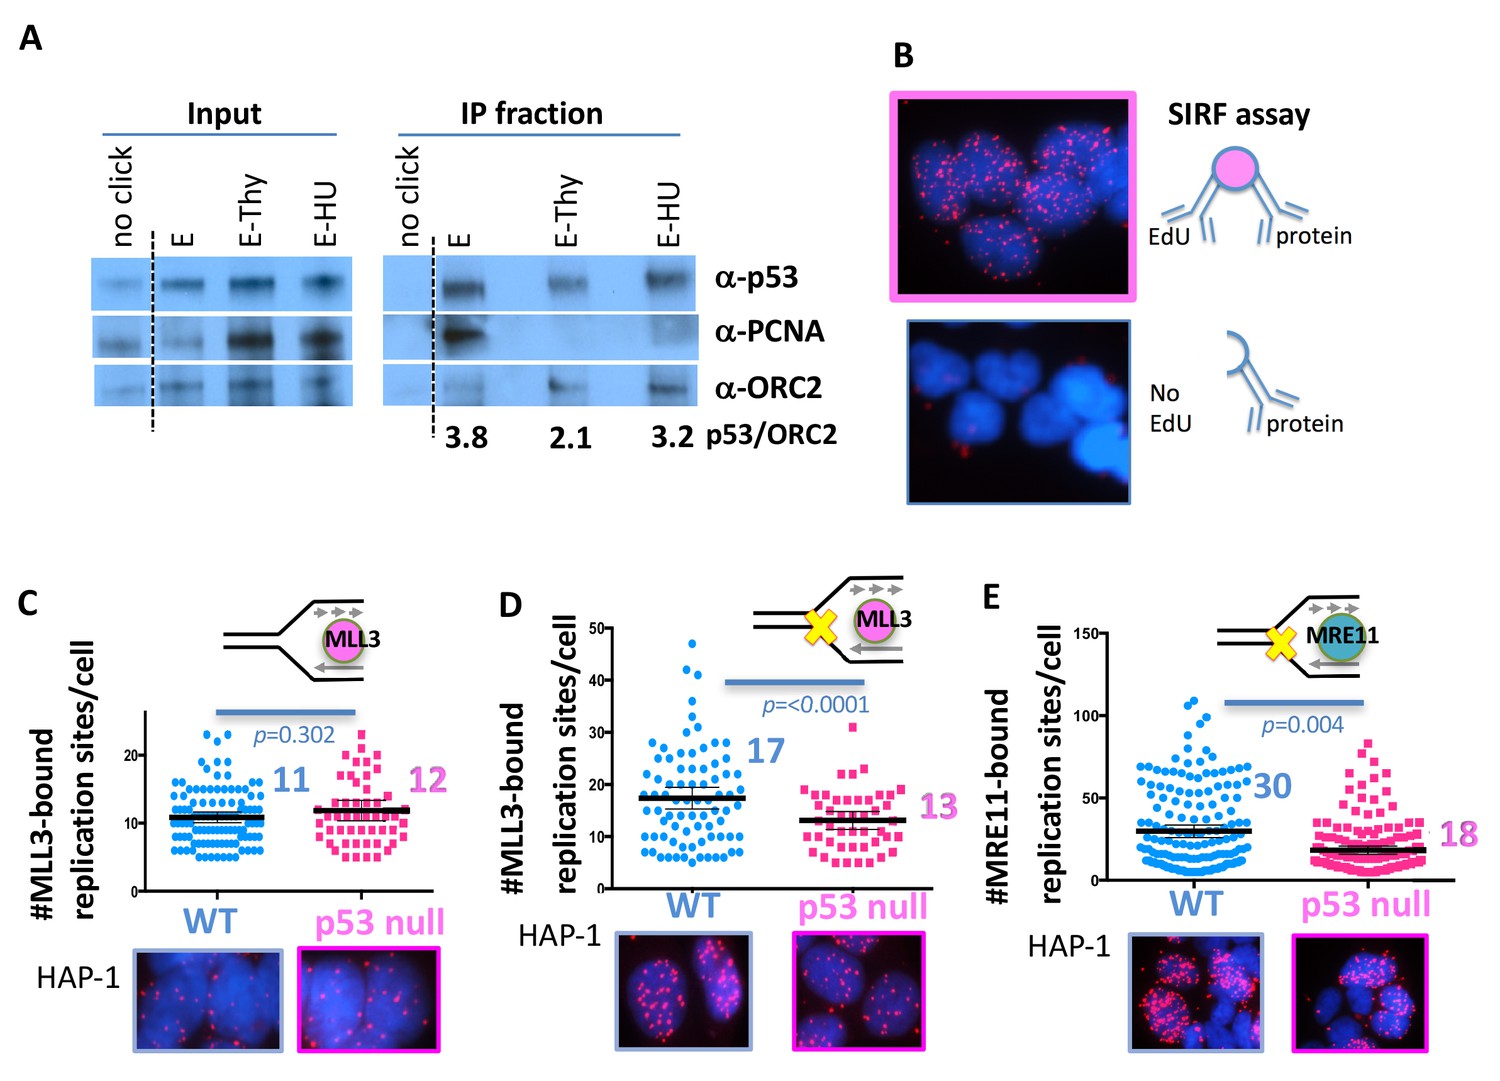
With one supplement p53 promotes recruitment of chromatin remodeler and MRE11 to stalled replication forks.
(A) iPOND (immunoprecipitation of biotinylated EdU-DNA) assay of p53, PCNA and ORC2 in HEK293 cells. No click reaction omits biotin and serves as negative control. E, EdU pulse (10 μM, 10 min), E-Thy, EdU pulse followed by thymidine chase (10 μM), E-HU, EdU pulse followed by hydroxyurea (500 μM). Values are relative p53 band intensities normalized to ORC2 band intensities. (B) Schematic and representative image of SIRF (In Situ Interactions at Replication Forks) assay for interactions between protein and nascent DNA in single cells: nascent DNA is pulse-labeled with EdU a protein of interest is crosslinked to the DNA immediately following the EdU pulse. Alternatively, EdU is washed out and cells are incubated with HU (200–400 μM HU) before crosslinking. Proximity ligation assay (PLA) amplification with antibodies against EdU and the protein of interest will result in a signal only if interactions between the nascent DNA and the protein of interest are in close proximity. No signal is produced if the cell has not incorporated EdU. (C) Quantitation of SIRF assay of epigenetic remodeler MLL3 at unchallenged replication forks and (D) at HU stalled replication forks (yellow x) in HAP-1 p53 null and WT cells. (E) Quantitation of SIRF assay of MRE11 at HU stalled replication forks in HAP-1 p53 null and WT cells. Bars represent the mean and the 95% confidence interval. Significance values are derived from student T-test analysis normalized to the respective EdU-PLA intensities (Supplementary file 1).
Figure 3—figure supplement 1
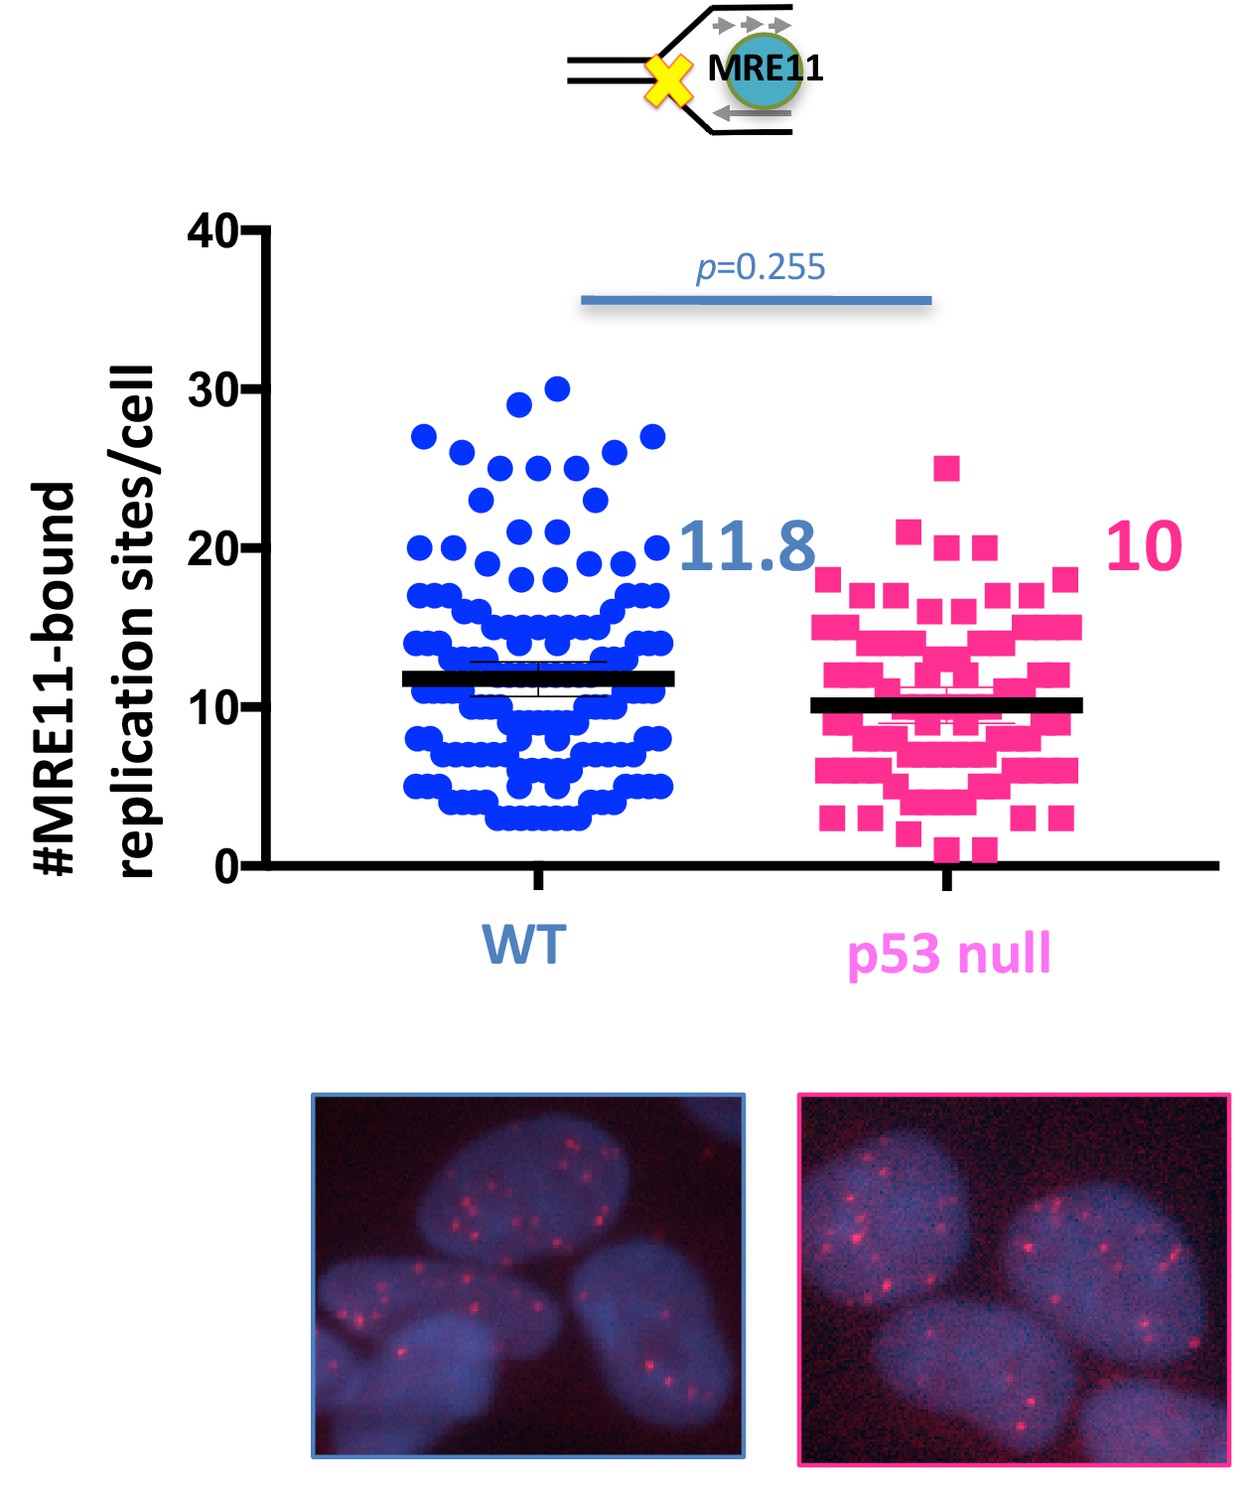
Quantitation of MRE11-SIRF in unperturbed HAP-1 p53 null and WT cells.
Bars represent the mean and the 95% confidence interval. Significance values are derived from student T-test analysis normalized to the respective EdU-PLA intensities (Supplementary file 1).
Figure 4 with 1 supplement
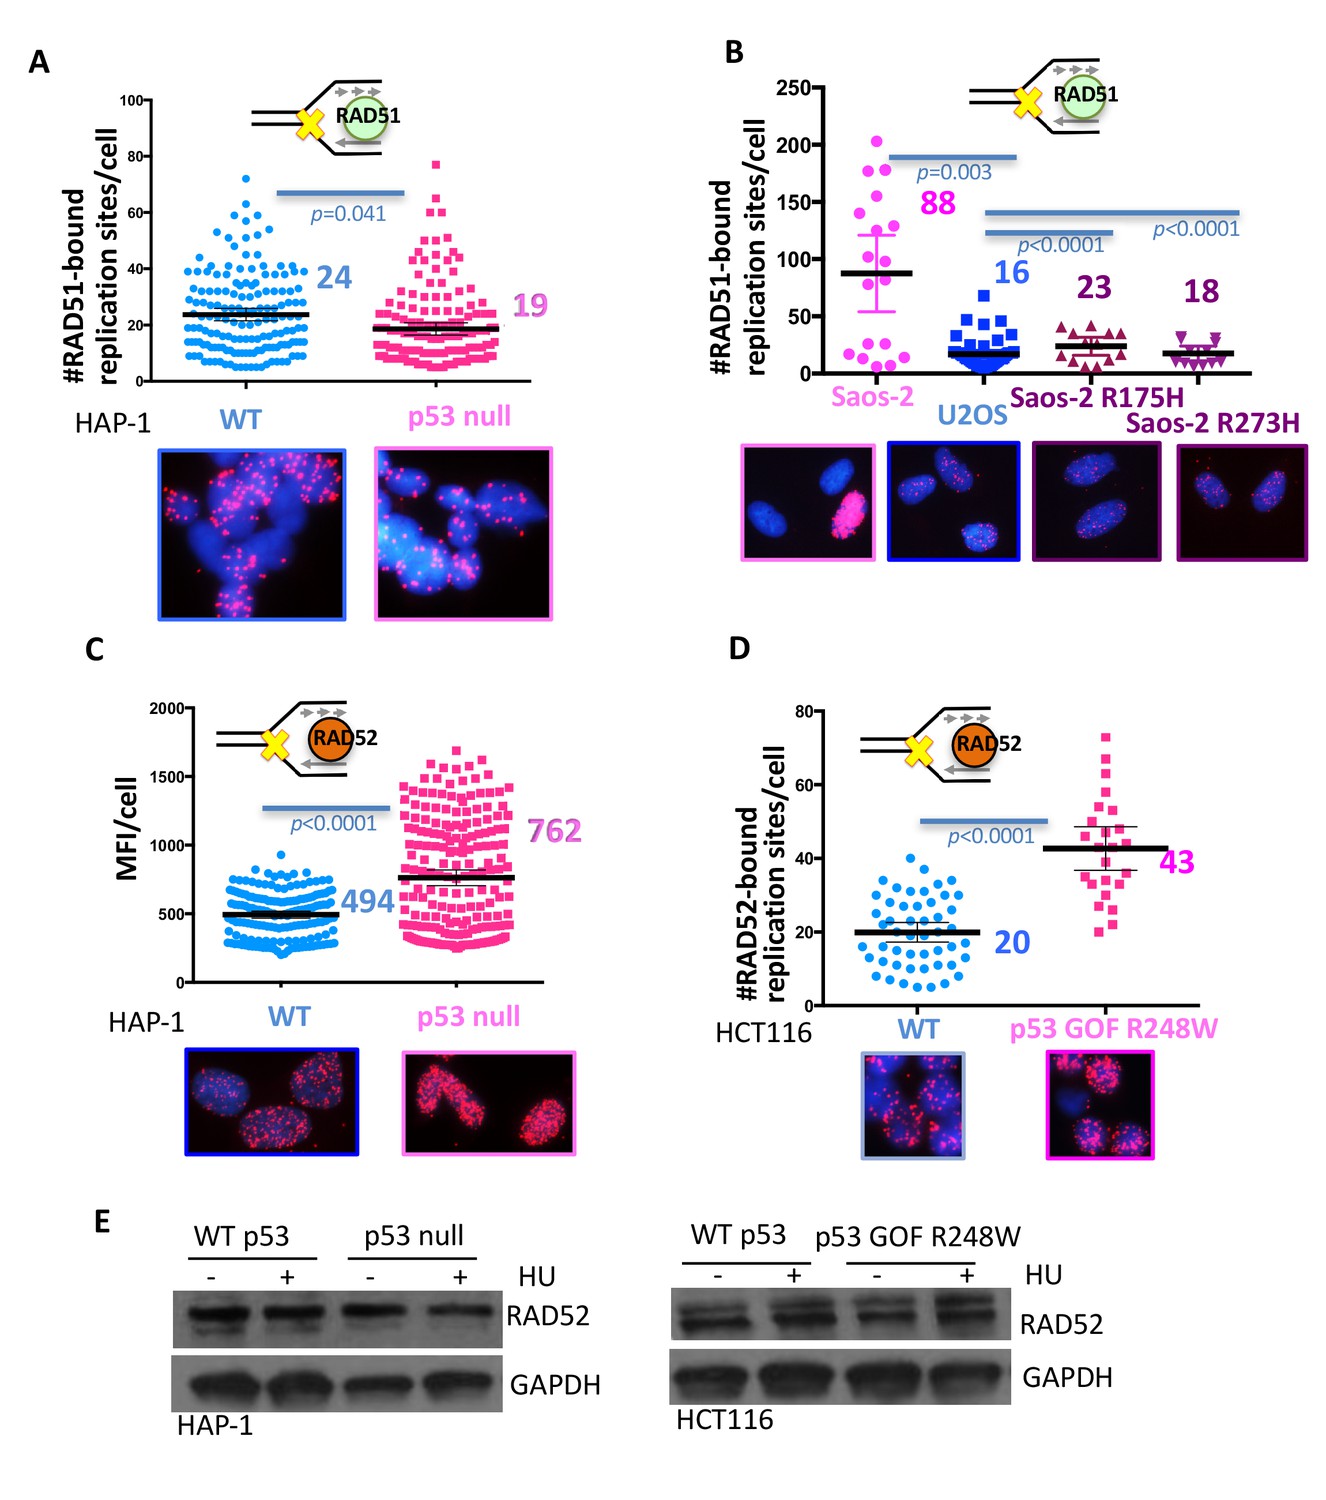
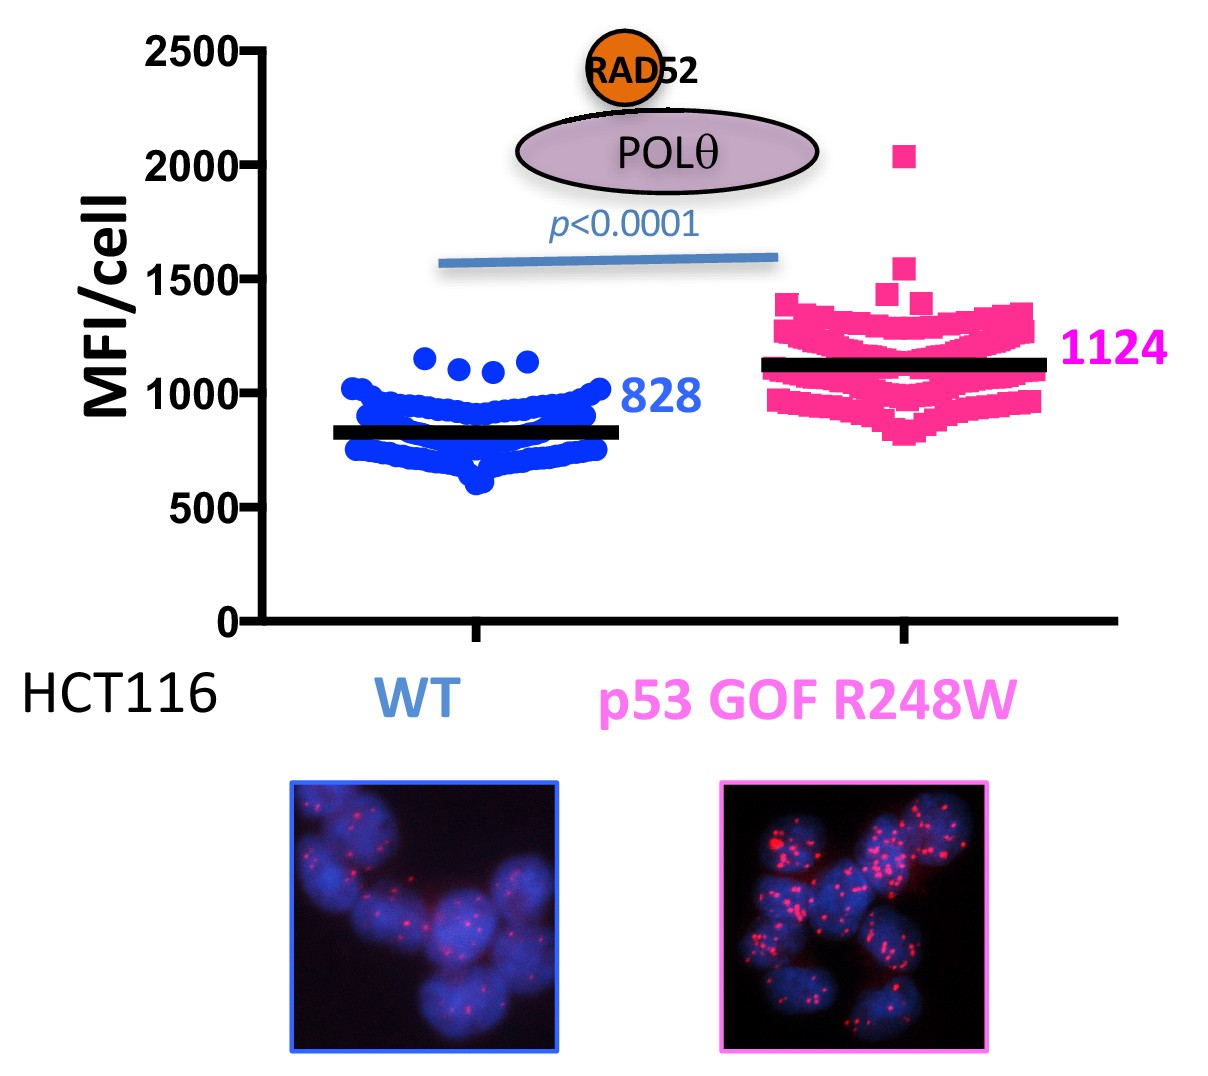
With one supplement p53 inhibits RAD52 usage at stalled replication forks.
(A) Quantitation of SIRF assay of RAD51 at HU stalled replication forks in HAP-1 p53 null and WT cells and (B) p53 null, R175H and R273H complemented Saos-2 cells, and U2OS cells. (C) Quantitation of SIRF assay of RAD52 at HU stalled replication forks in HAP-1 p53 null and WT cells (MFI, mean fluorescence intensity) and (D) WT p53 or p53 R248W-expressing HCT116 cells. (E) Western blot of RAD52 with and without HU (200 μM) in p53 null and WT HAP-1 cells, and WT p53 or p53 R248W-expressing HCT116 cells. Bars represent the mean and the 95% confidence interval. Significance values are derived from student T-test analysis normalized to the respective EdU-PLA intensities (Supplementary file 1).
Figure 4—figure supplement 1
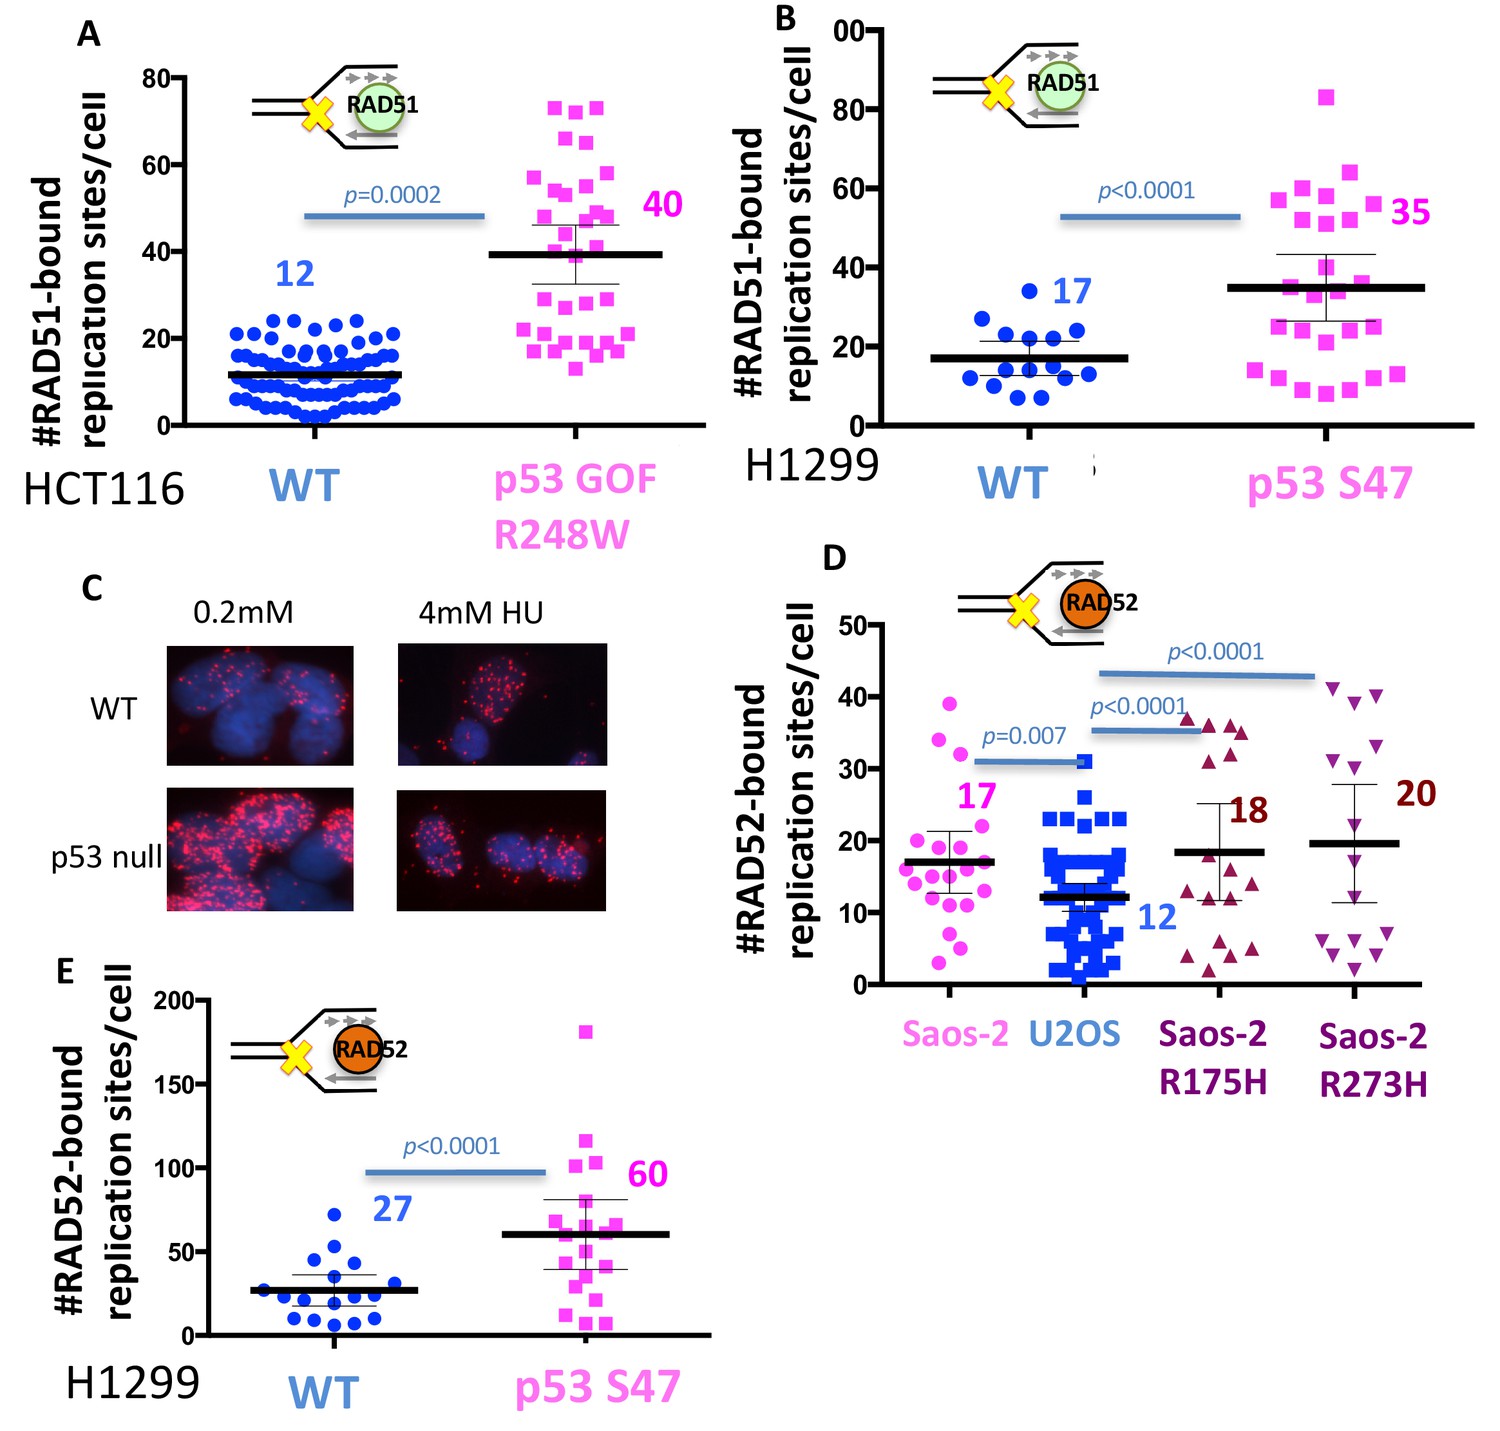
RAD52-SIRF is upregulated in mutant p53 cells.
(A) Quantitation of SIRF assay of RAD51 at HU stalled replication forks in p53 R248W and WT p53 HCT116 cells. (B) Quantitation of SIRF assay of RAD51 at HU stalled replication forks in p53 S47 and WT p53 H1299 cells. (C) Representative images of SIRF assay of RAD52 in HAP-1 cells at low (0.2 mM) and high (4 mM) HU concentrations show preferential binding of RAD52 at stalled forks with low HU concentrations compared to high HU concentrations, which are more favorable for break formation. Images are representative images from Fig. 4C (D) Quantitation of SIRF assay of RAD52 at HU stalled replication forks in p53 R175H, p53 R273H and p53 null Saos-2 sarcoma cells, and WT p53 U2OS sarcoma cells. (E) Quantitation of SIRF assay of RAD52 at HU stalled replication forks in p53 S47 and WT p53 H1299 cells. Bars represent the mean and the 95% confidence interval. Significance values are derived from student T-test analysis normalized to the respective EdU-PLA intensities (Supplementary file 1).
Figure 5 with 1 supplement
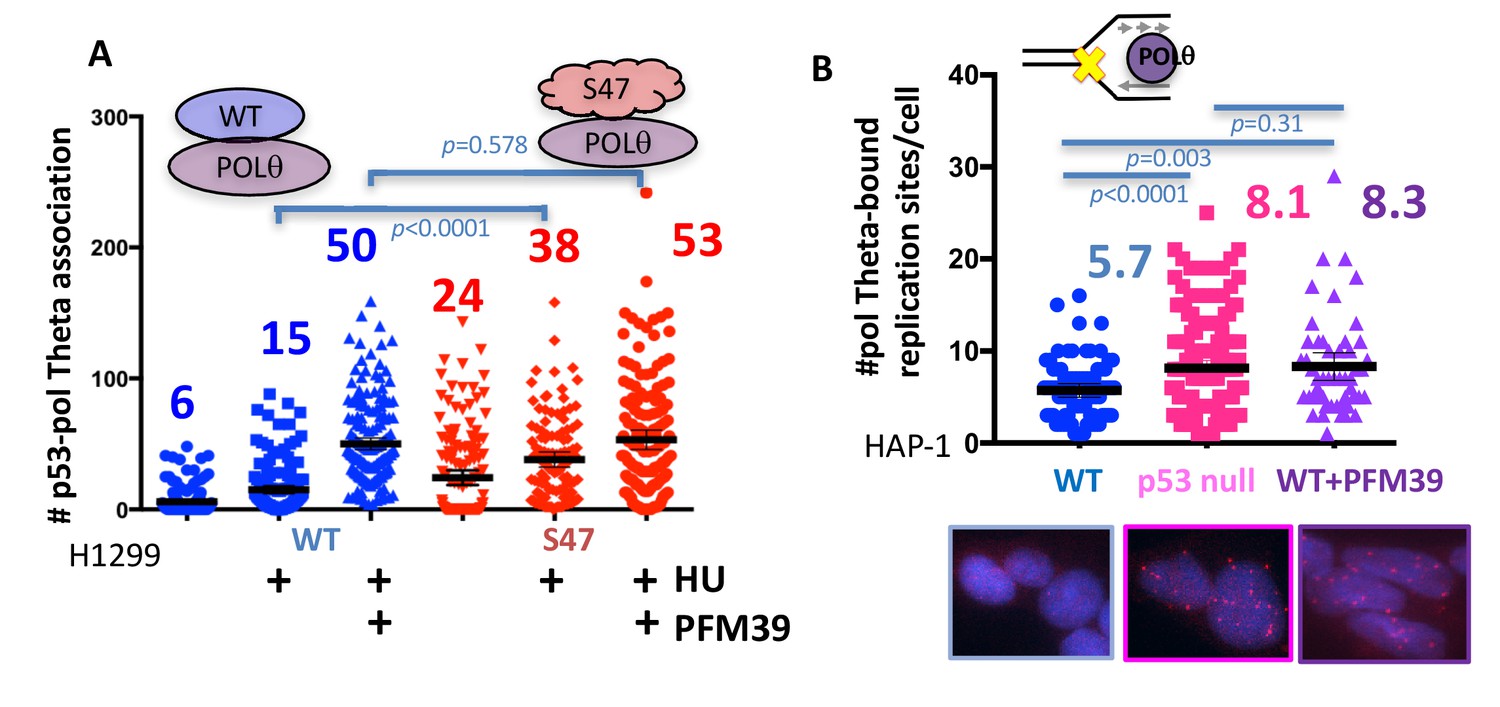
With one supplement p53 inhibits POLθ usage at stalled replication forks.
(A) Quantitation of WT p53 or p53 S47 interaction with POLθ by PLA in H1299 cells with or without HU (200 μM) and MRE11 inhibitor PFM39 (100 μM). (B) Quantitation of SIRF assay of POLθ at HU stalled replication forks in HAP-1 p53 null and WT cells. Bars represent the mean and the 95% confidence interval. Significance values are derived from student T-test analysis normalized to the respective EdU-PLA intensities (Supplementary file 1).
Figure 5—figure supplement 1
PLA assay between RAD52 and POLθ in p53 R248W and WT p53 HCT116 cells.
Bars represent the mean and the 95% confidence interval. Significance values are derived from student T-test analysis normalized to the respective EdU-PLA intensities (Supplementary file 1).
Figure 6 with 1 supplement
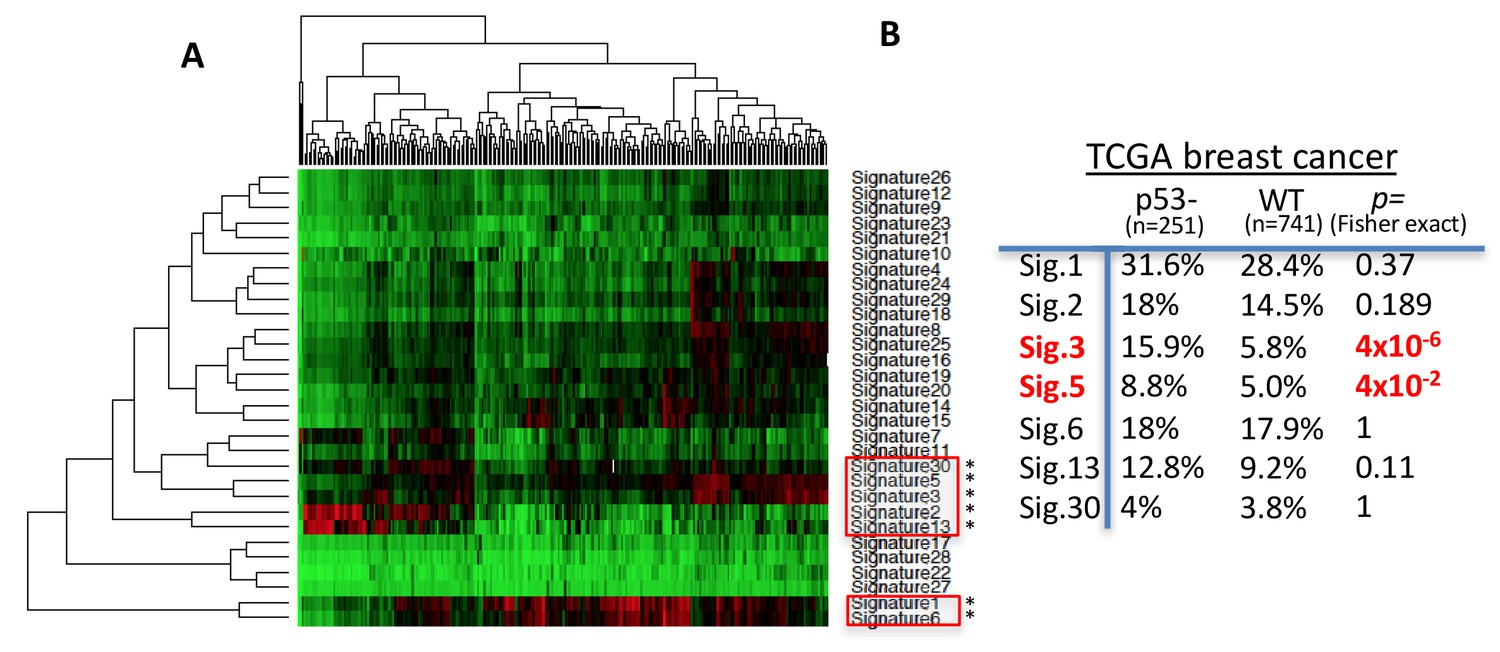
POLθ and RAD52 mutation signatures are upregulated in p53-defective breast cancers.
(A) Hierarchical clustering of cosmic mutation signatures in p53-defective breast cancer from TCGA database. (B) Comparison of frequencies of cosmic signature found unregulated in p53-defective breast cancer with frequencies found in p53 proficient breast cancers. Cosmic signature in TCGA samples were analyzed by Cosine similarity; Similarity cutoff 0.617, z-score >1.96.
Figure 6—figure supplement 1
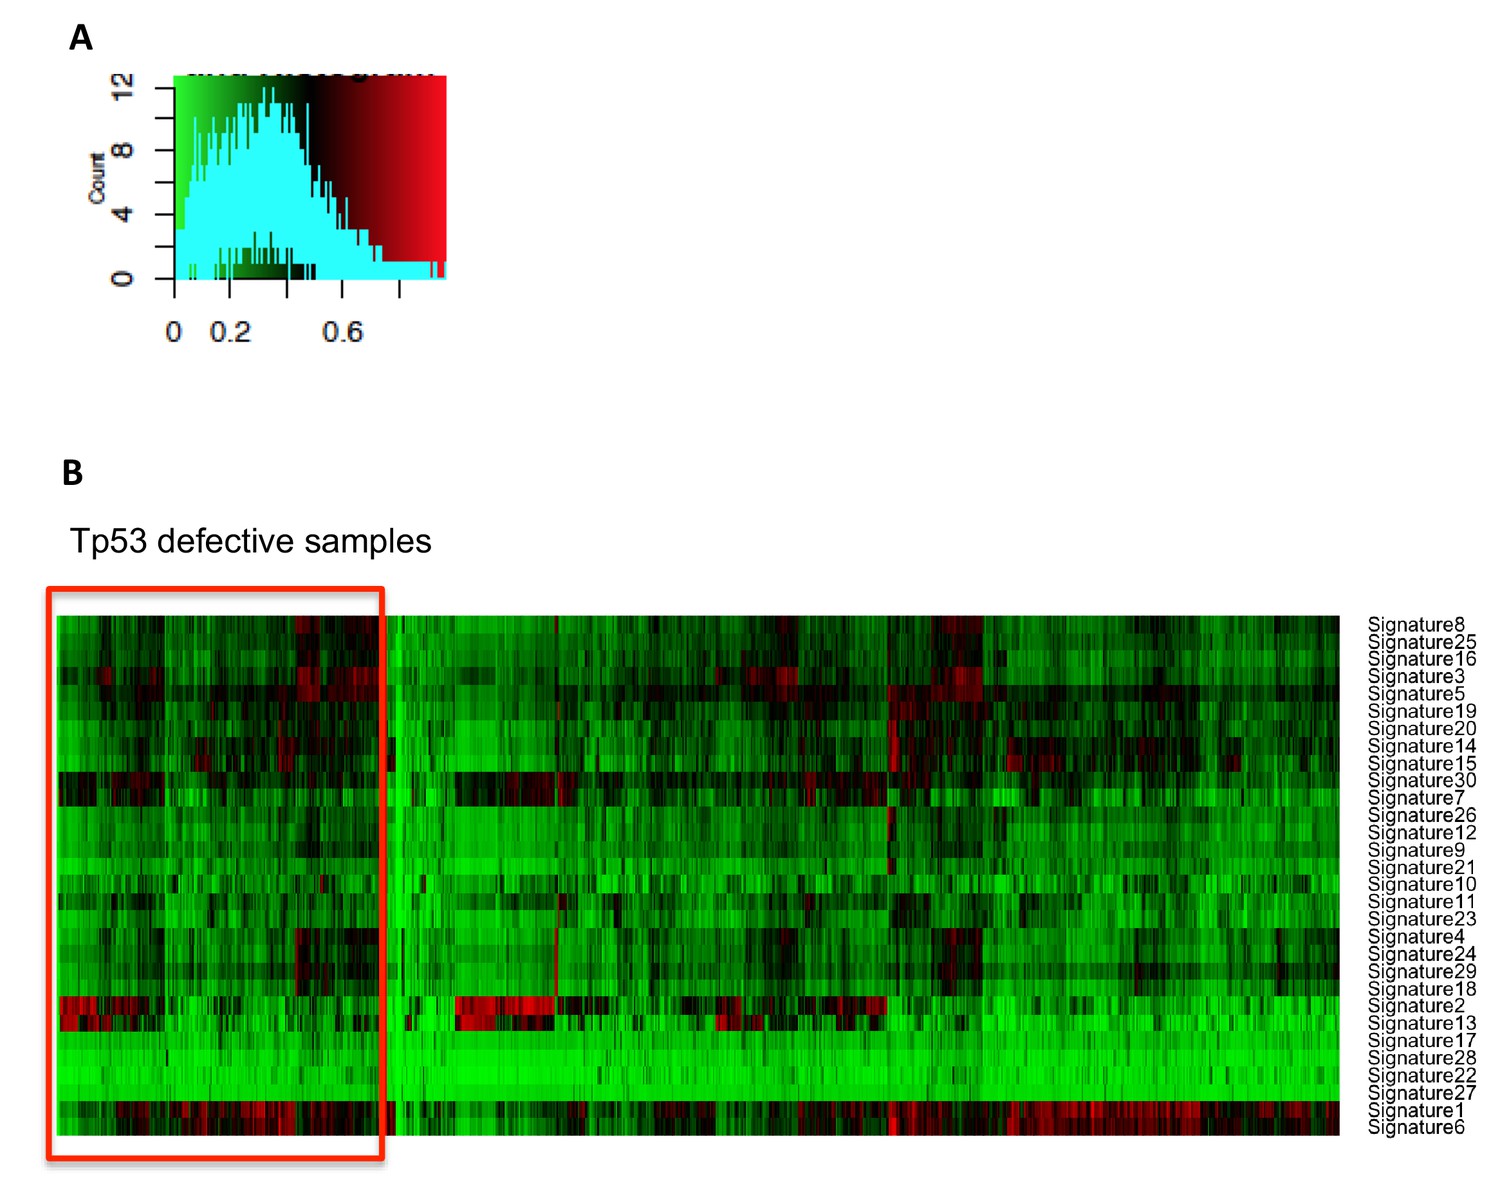
Cosmic mutational signatures of mutant p53 breast cancers.
(A) Color key histogram showing the distribution of the similarity score. (B) Hierarchical clustering of cosmic mutation signatures in p53 defective and proficient breast cancer from TCGA database.
Figure 7
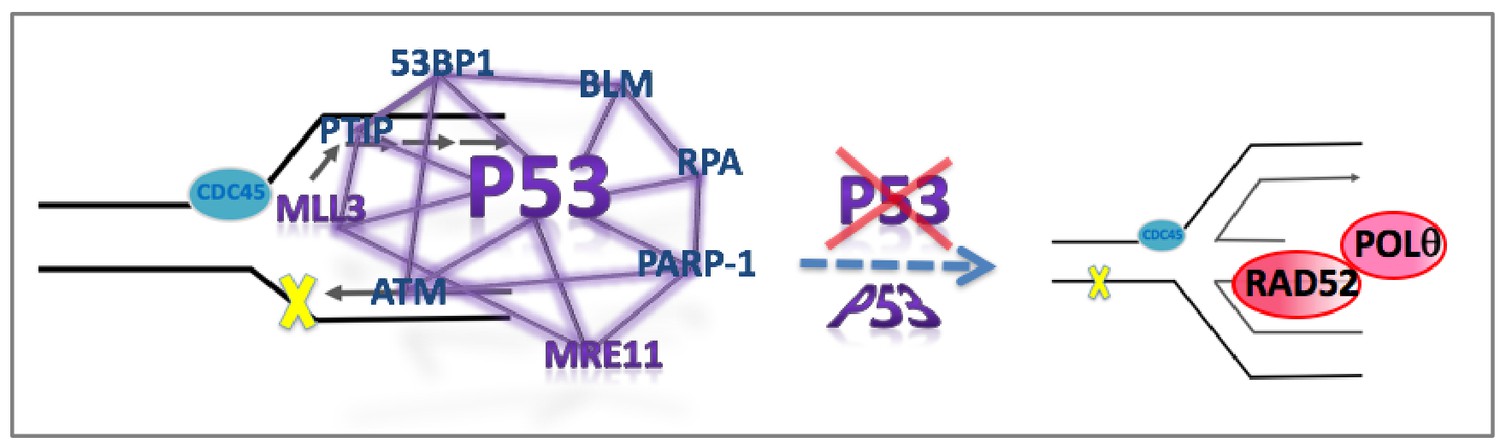
Model for p53-mediated pathway homeostasis p53 is implicated as a keystone protein that is part of a larger replication restart network. p53 mutations, defects or MRE11 defects tip the replication pathway homeostasis toward increased mutagenic RAD52/POLθpathways at unprotected stalled forks, such as reversed replication forks, and resulting in deletion and point mutations.
https://doi.org/10.7554/eLife.31723.015Tables
Key resources table
| Reagent type (species) or resource | Designation | Source or reference | Identifiers |
|---|---|---|---|
| Cell line (human) | HAP-1 parental | Horizon Discovery | RRID:CVCL_Y019 |
| Cell line (human) | HAP-1 p53 null | Horizon Discovery | HZGHC001068C007 |
| Cell line (human) | HCT116 parental | Invitrogen | HD PAR-007, RRID:CVCL_0291 |
| Cell line (human) | HCT116 R248W GOF | Invitrogen | HD 104–003 |
| Cell line (human) | H1299 p53 null | PMID: 27034505 | |
| Cell line (human) | H1299 WT | PMID: 27034505 | |
| Cell line (human) | H1299 S47 | PMID: 27034505 | |
| Cell line (human) | U2OS | ATCC | RRID:CVCL_0042 |
| Cell line (human) | SAOS-2 | PMID: 25024203 | |
| Cell line (human) | SAOS-2 R175H | PMID: 25024203 | |
| Cell line (human) | SAOS-2 R273H | PMID: 25024203 | |
| Cell line (mouse) | MEF p53 null | PMID:14702042 | |
| Cell line (mouse) | MEF WT | PMID:14702042 | |
| Cell line (mouse) | MEF R172H | PMID:15607981 | |
| Cell line (mouse) | MEF R172P | PMID:14702042 | |
| Cell line (mouse) | MEF p53 null | PMID: 27034505 | |
| Cell line (mouse) | MEF S47 | PMID: 27034505 | |
| Cell line (human) | MCF10a | Invitrogen | HD PAR-024, RRID:CVCL_0598 |
| Cell line (human) | MCF10a p53 null | Invitrogen | HD 101–005 |
| Antibody | IdU | BD Biosciences | 347580, RRID:AB_400326 |
| Antibody | CldU | Novus Biologicals | NB500-169, RRID:AB_10002608 |
| Antibody | Mouse Biotin | Sigma | B7653, RRID:AB_258625 |
| Antibody | Rabbit Biotin | Cell signaling | 5597S, RRID:AB_10828011 |
| Antibody | MLL3 | Abcam | ab32581, RRID:AB_881525 |
| Antibody | MRE11 | Abcam | ab214, RRID:AB_302859 |
| Antibody | RAD51 | Abcam | ab213, RRID:AB_302856 |
| Antibody | RAD52 | Santa Cruz | sc-365341, RRID:AB_10851346 |
| Antibody | GAPDH | Santa Cruz | sc-47724, RRID:AB_627678 |
| Antibody | Pol Theta | Abcam | ab80906, RRID:AB_1658691 |
| Antibody | PCNA | Santa Cruz | sc-56, RRID:AB_628110 |
| Antibody | ORC2 | Abcam | ab31930, RRID:AB_776911 |
| Antibody | p53 | Santa Cruz | sc-126, RRID:AB_628082 |
| Antibody | Ku70 | Cell Signaling | 4104S, RRID:AB_1904185 |
| Commercial assay or kit | Mouse plus PLA probe | Duolink Sigma | DUO92001-100RXN |
| Commercial assay or kit | Rabbit minus PLA probe | Duolink Sigma | DUO92005-100RXN |
| Commercial assay or kit | PLA detection reagent red | Duolink Sigma | DUO92008-100RXN |
| Chemical compound, drug | EdU | Invitrogen | A10044 |
| Chemical compound, drug | Hydroxyurea (HU) | Sigma | H8627 |
| Chemical compound, drug | Thymidine | Sigma | T1895 |
| Chemical compound, drug | IdU | Sigma | I7125 |
| Chemical compound, drug | CldU | Sigma | C6891 |
| Chemical compound, drug | Dynabeads MyOne streptavidin T1 | Invittrogen | 65601 |
| Chemical compound, drug | Alexa Fluor 488 Azide | Invitrogen | A10266 |
| Chemical compound, drug | Cytochalasin B | Sigma | C2743 |
| Chemical compound, drug | Formaldehyde solution | Sigma | 252549 |
| Chemical compound, drug | Paraformaldehyde 32% solution, EM grade | EMS | 15714 |
| Chemical compound, drug | Goat Serum | Sigma | G9023 |
| Chemical compound, drug | Biotin Azide | Invitrogen | B10184 |
| Chemical compound, drug | DAPI | Life Technologies | 62248 |
| Chemical compound, drug | Prolong Gold Antifade reagent | Invitrogen | P36934 |
| Chemical compound, drug | MTS | Promega | G3580 |
| Chemical compound, drug | Mitomycin C | Sigma | M0503 |
| Software, algorithm | NIS elements | Nikon | RRID:SCR_014329 |
| Software, algorithm | Duolink Analysis tool | SigmaDuolink | RRID:SCR_015574 |
| Software, algorithm | GraphPad Prism 6 | GraphPad (La Jolla, California) | RRID:SCR_002798 |
| Software, algorithm | Image J | RRID:SCR_003070 |
Additional files
-
Supplementary file 1
EdU-PLA values for normalization of SIRFs to relative EdU incorporation.
- https://doi.org/10.7554/eLife.31723.016
-
Transparent reporting form
- https://doi.org/10.7554/eLife.31723.017
Download links
A two-part list of links to download the article, or parts of the article, in various formats.
Downloads (link to download the article as PDF)
Open citations (links to open the citations from this article in various online reference manager services)
Cite this article (links to download the citations from this article in formats compatible with various reference manager tools)
p53 orchestrates DNA replication restart homeostasis by suppressing mutagenic RAD52 and POLθ pathways
eLife 7:e31723.
https://doi.org/10.7554/eLife.31723


