TGF-β uses a novel mode of receptor activation to phosphorylate SMAD1/5 and induce epithelial-to-mesenchymal transition
- The Francis Crick Institute, United Kingdom
- University of Dundee, United Kingdom
- Friedrich Miescher Laboratory of the Max Planck Society, Germany
- University of Pittsburgh School of Medicine, United States
Figures
Figure 1 with 2 supplements
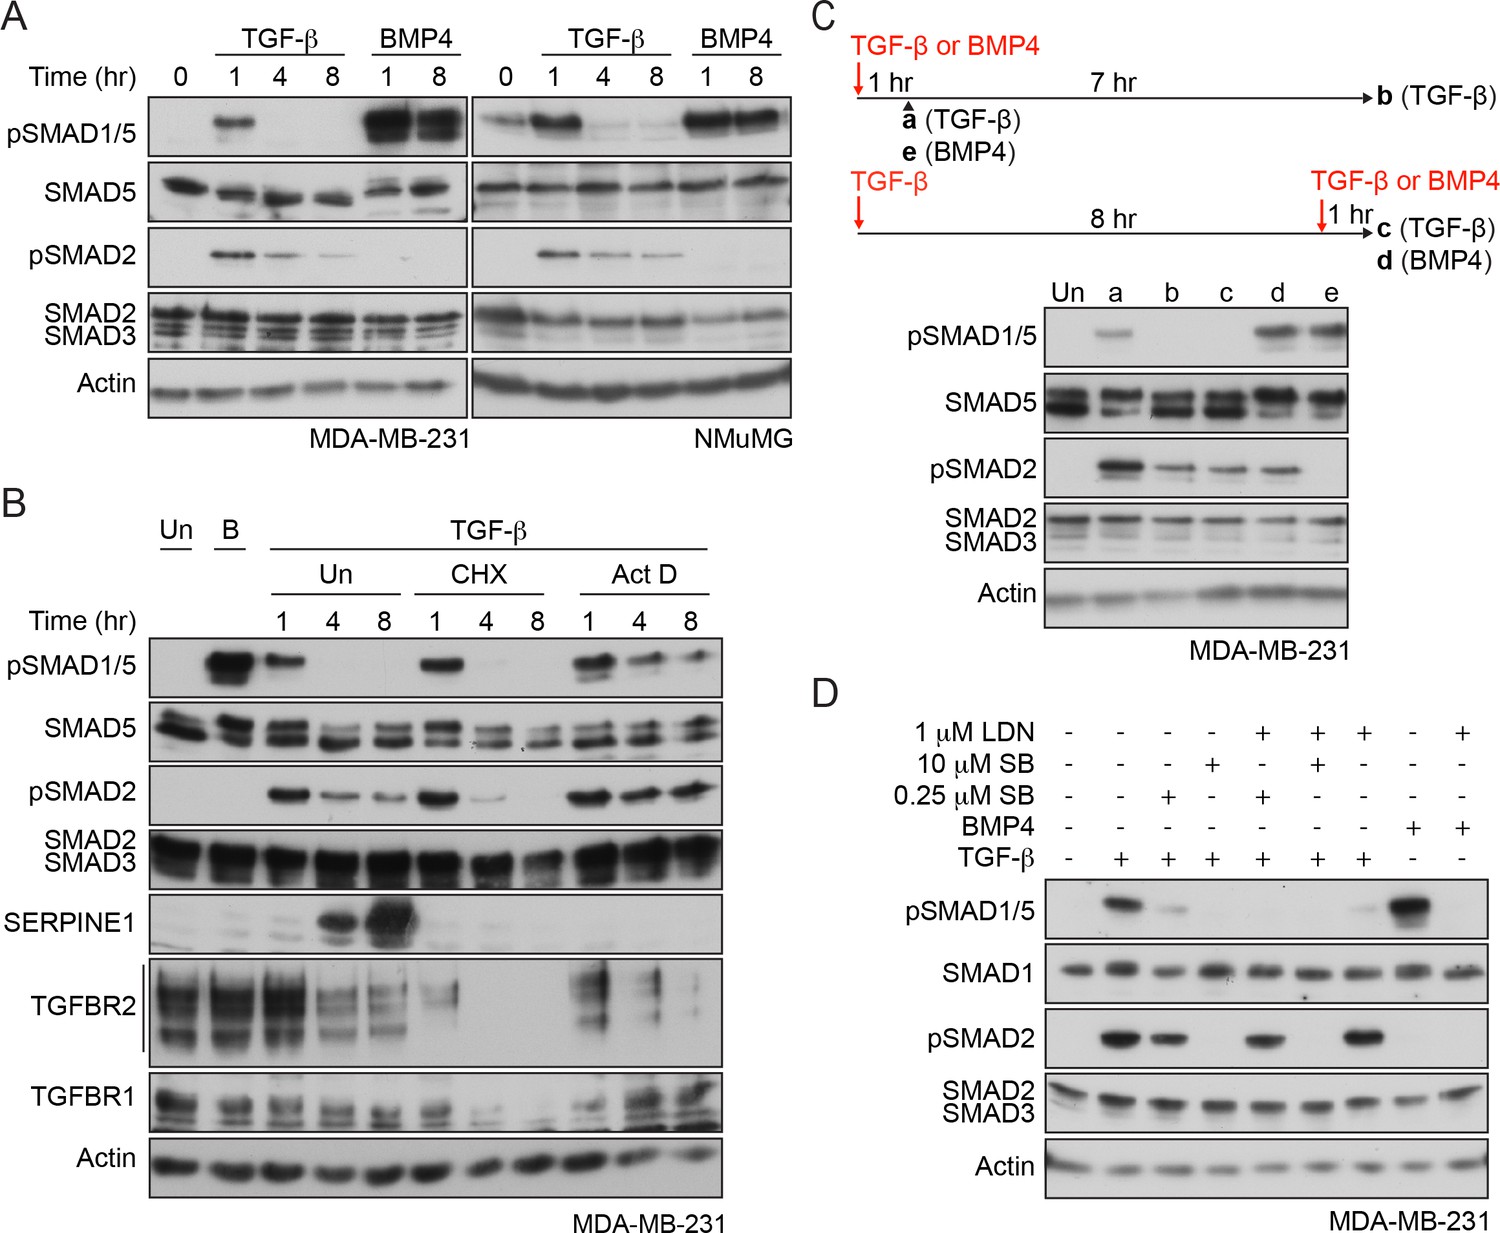
Characterization of SMAD1/5 phosphorylation by TGF-β.
(A) MDA-MB-231 and NMuMG cells were treated with TGF-β or BMP4 for the times indicated. (B) MDA-MB-231 cells were treated with TGF-β for the times shown either alone or after 5 min pre-treatment with cyclohexamide (CHX) or actinomycin D (Act D). (C) MDA-MB-231 cells were treated with TGF-β for 1 or 8 hr, and after 8 hr, cells were re-stimulated with TGF-β or BMP4 for 1 hr as shown in the scheme. For comparison, cells were stimulated for 1 hr with BMP4. (D) MDA-MB-231 cells were induced or not with TGF-β or BMP4 in the presence of either 0.25 µM or 10 µM SB-431542 (SB) or 1 µM LDN-193189 (LDN) or a combination of 0.25 µM or 10 µM SB-431542 and 1 µM LDN-193189. In all panels, western blots are shown probed with the antibodies indicated. B, BMP4, Un, unstimulated. In B, SERPINE1, whose expression is induced by TGF-β, provides a control for the efficacy of the CHX and Act D.
Figure 1—figure supplement 1
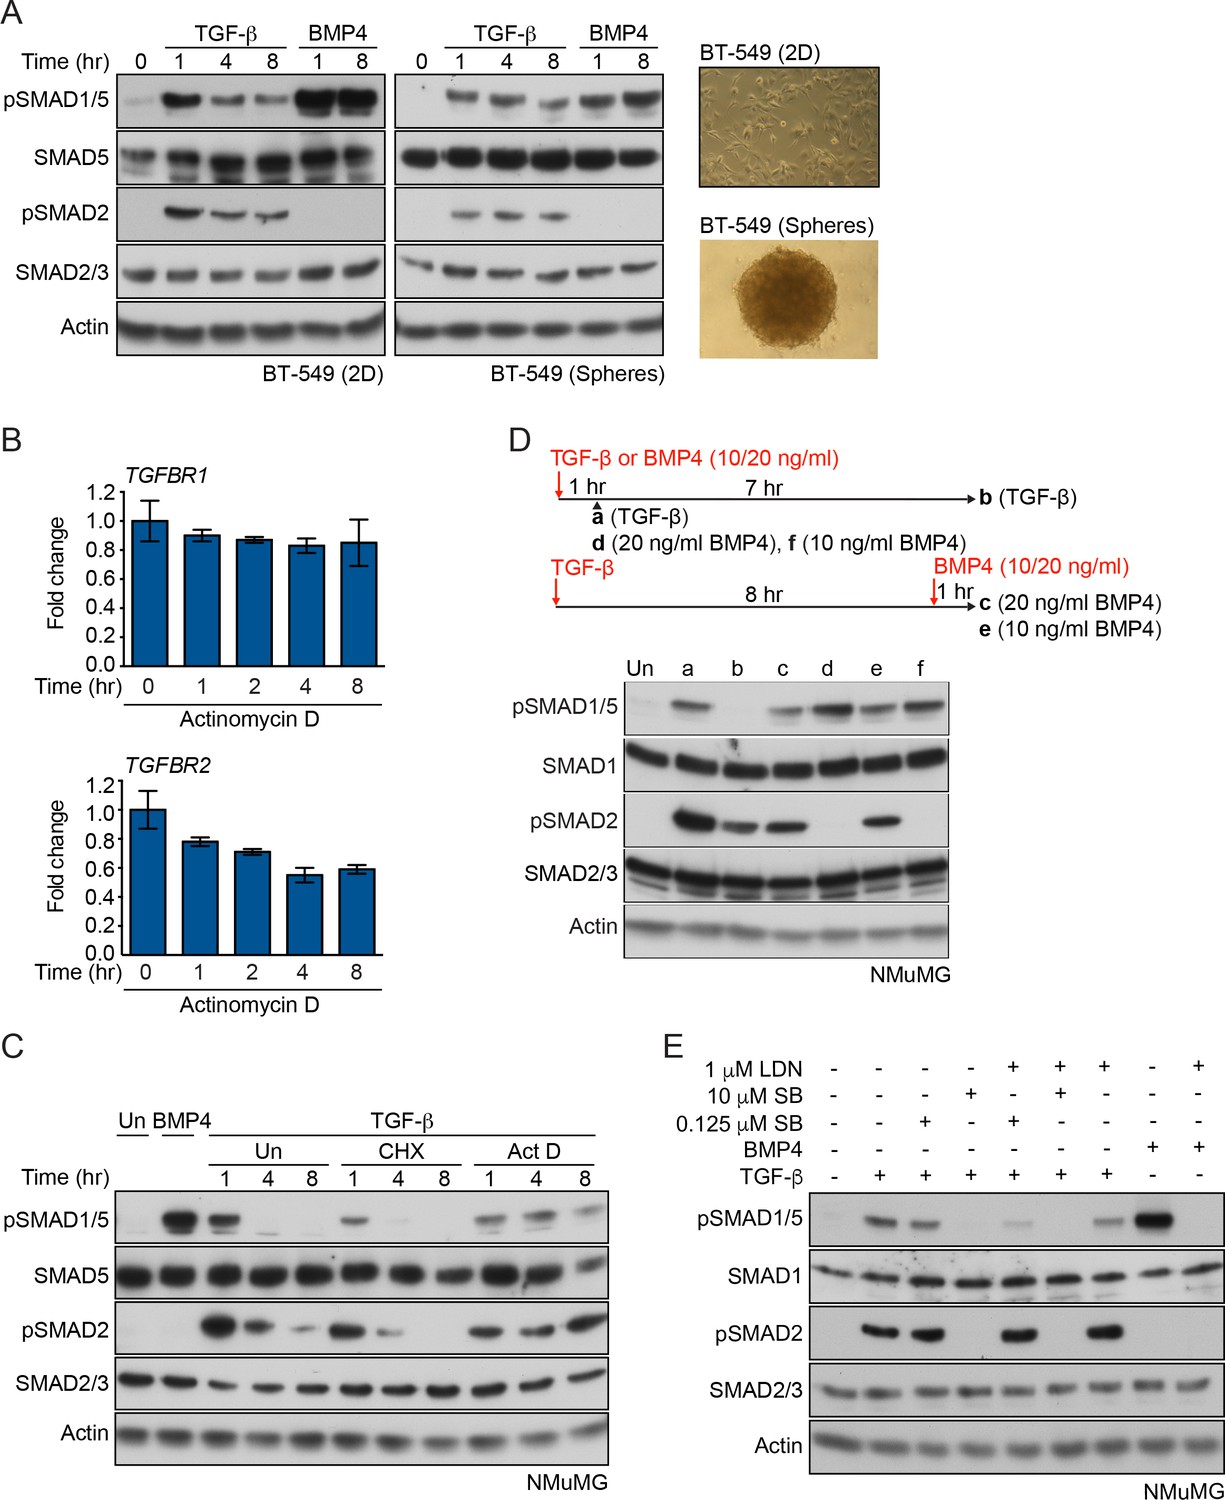
SMAD1 phosphorylation kinetics in response to TGF-β.
(A, C–E) Western blots are shown probed with the indicated antibodies. (A) BT-549 cells were grown as a monolayer on plastic (2D) or as spheres in low attachment plates (phase contrast images on the right) and treated with TGF-β or BMP4 for the times indicated. BT-549 cells show sustained SMAD1/5 phosphorylation in response to TGF-β. (B) qPCR of the indicated genes in MDA-MB-231 cells treated with actinomycin D for the times shown. Data are presented as fold change relative to 0 hr. A representative experiment performed in triplicate is shown with means ± SD. Transcripts of both TGFBRI and TGFBR2 are relatively stable. (C) NMuMG cells were treated with TGF-β for the times shown either alone or after 5 min pre-treatment with cyclohexamide (CHX) or actinomycin D (Act D). Act D prolongs, while CHX terminates both SMAD1/5 and SMAD2 phosphorylation in response to TGF-β. Un, untreated. (D) NMuMG cells were treated with TGF-β for 1 or 8 hr and after 8 hr, cells were restimulated with 10 or 20 ng/ml BMP4 as shown in the scheme. Cells were also treated for 1 hr with 10 or 20 ng/ml BMP4 as a control. Cells pre-treated with TGF-β can still be stimulated with BMP4. (E) NMuMG cells were left untreated or treated with TGF-β ± SB-431542 (SB; 0.125 µM or 10 µM) ± 1 µM LDN-193189 (LDN) or BMP4 ± 1 µM LDN-193189 for 1 hr. The kinase activity of both classes of type I receptors is required for SMAD1/5 phosphorylation by TGF-β.
-
Figure 1—figure supplements 1—Source data 1
Source data for qPCRs (panel B).
- https://doi.org/10.7554/eLife.31756.005
Figure 1—figure supplement 2
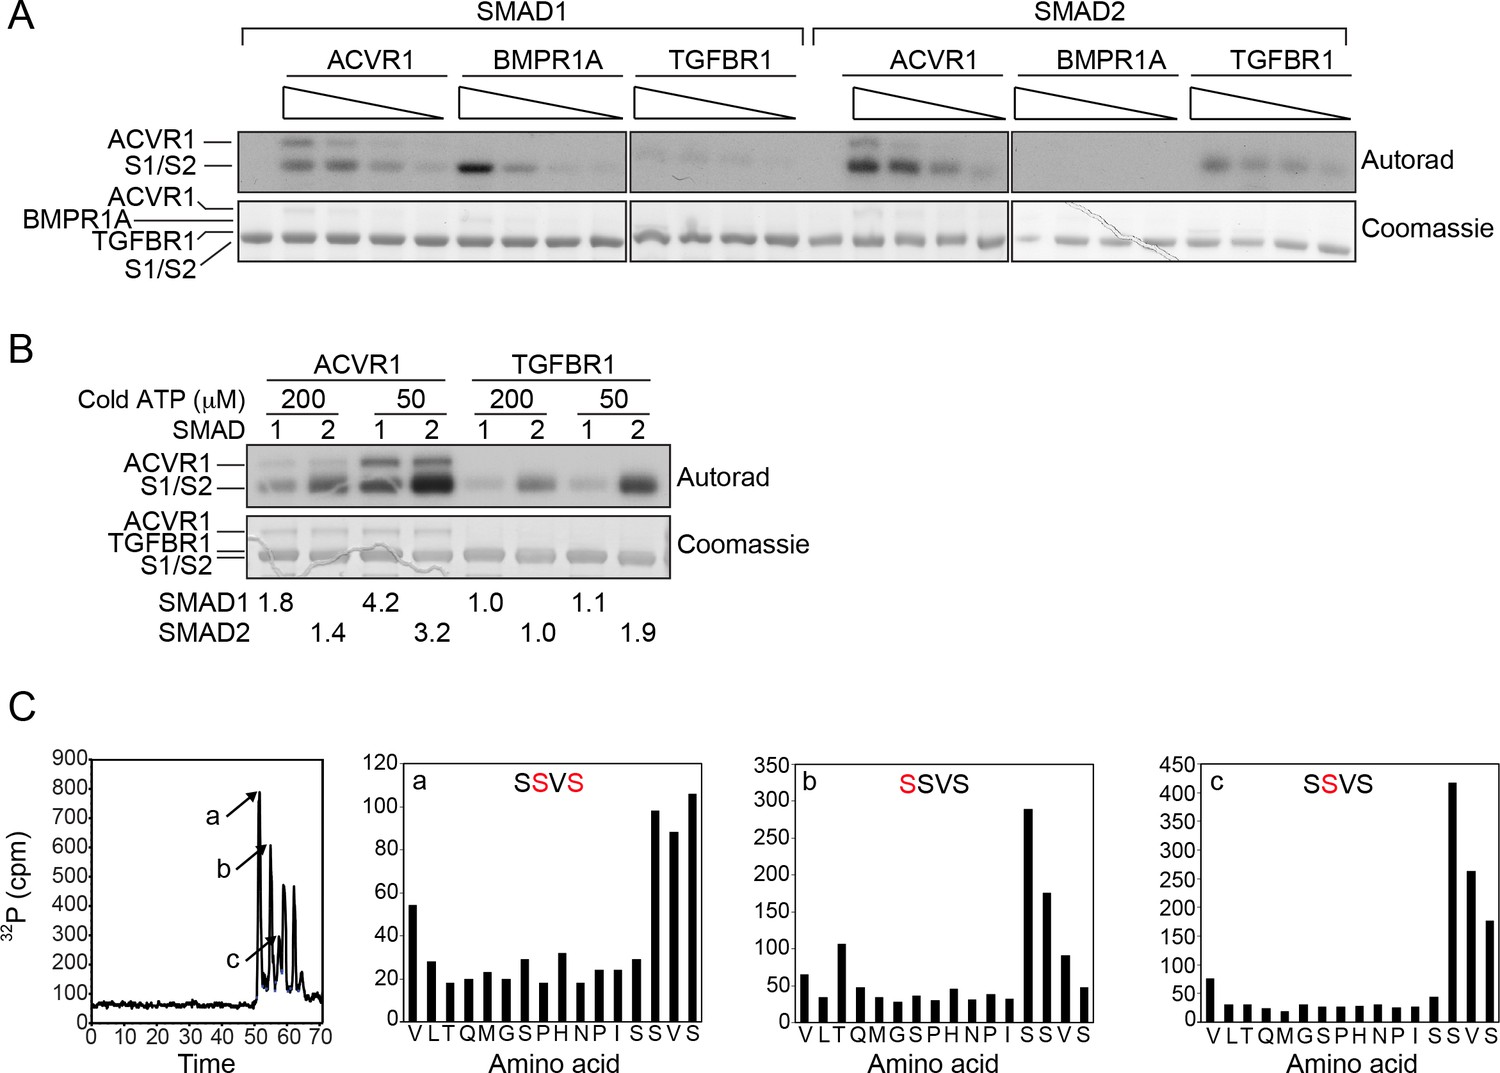
SMAD1 is efficiently phosphorylated by ACVR1 and BMPR1A, but poorly phosphorylated by TGFBR1.
(A) In vitro kinase assays using the kinase domains of ACVR1, BMPR1A, and TGFBR1 at 200, 100, 50, 25 ng with recombinant SMAD1 (S1) or SMAD2 (S2) as substrates. Top panels, autoradiograph; bottom panels, Coomassie-stained gel. (B) Incorporation of 32P into SMAD1 and SMAD2 catalyzed by ACVR1 and TGFBR1 using different specific activities of [γ−32P]-ATP. A constant amount of [γ−32P]-ATP was added into the kinase reaction with either 200 or 50 µM cold ATP. Top panels, autoradiograph; bottom panels, Coomassie-stained gel. Numbers underneath indicate the fold changes relative to the 32P incorporation in SMAD1 (upper) or SMAD2 (lower) catalyzed by TGFBR1 using 200 µM cold ATP. The phosphorylation of SMAD1 and 2 by ACVR1 and TGFBR1 was dependent on the specific activity of the [γ−32P]-ATP, whilst the apparent phosphorylation of SMAD1 by TGFBR1 is not, suggesting that it is non-specific. (C) Mapping ACVR1 phosphorylation sites on SMAD1. Full length SMAD1 phosphorylated by ACVR1 was digested with trypsin. Peptides were resolved by reverse phase HPLC (left panel). The C-terminal peptide of SMAD1 existed in three different phosphorylation states (peptides a, b, and c); the three subsequent peaks are tryptic miscleavage products. The phosphorylation sites in the peptides were mapped using solid phase Edman sequencing (panels labeled a, b and c). The deduced phosphorylation sites in the SSVS motif in the individual peptides are shown in red.
Figure 2 with 1 supplement

ACVR1 is activated by TGFBR1 in vitro and in vivo.
(A) The kinase domains of TGFBR1 and ACVR1 were analyzed alone or together in an in vitro kinase reaction. SB-505124 and LDN-193189 were included as shown to inhibit the activity of TGFBR1 and ACVR1, respectively. The autoradiograph is shown in the top panel, with the Coomassie-stained gel below as a loading control. (B) Schematic to show the domain organization of the Opto receptors. In Opto-TGFBR1* and Opto-ACVR1, the kinase domains of TGFBR1 and ACVR1 are fused to the light-sensitive LOV domain. At the N-terminus there is a myristylation domain (indicated by the red zig zag). At the C-terminus there is an HA tag. The kinase domain of TGFBR1 contains the activating mutation T204D. These Opto receptors dimerize in the presence of blue light. (C) NIH-3T3 cells were untransfected or transfected with FLAG-SMAD1 together with either Opto-TGFBR1*, Opto-ACVR1 or both receptors together. Post-transfection, cells were either kept in the dark or exposed to blue light for 1 hr. Whole cell extracts were western blotted using antibodies against pSMAD1/5 (which detects endogenous and FLAG-tagged pSMAD1/5), SMAD1 (which detects endogenous and FLAG-SMAD1), HA (to detect the Opto receptors) and Tubulin as a loading control. (D) NIH-3T3 cells were untransfected or transfected with FLAG-SMAD1 together with either Opto-TGFBR1*, Opto-ACVR1 or both receptors together. Post-transfection, cells were either kept in the dark or exposed to blue light for 1 hr. The inductions were performed in the absence or presence of 0.5 µM LDN-193189 or 50 µM SB-505124 as indicated. Whole cell extracts were blotted as in (C). (E) The experimental set up was as in (D) except that GFP-SMAD3 was used instead of FLAG-SMAD1 to assess the activity of Opto-TGFBR1*. (F) As in (C), except that an ACVR1 mutant in which all the threonines and serines of the GS domain were mutated to valine or alanine respectively, was also assayed. (G) As in (F), except that GFP-SMAD3 was used instead of FLAG-SMAD1. Note that in all cases the 1 hr induction with blue light led to reduced levels of the transfected receptors and substrates.
Figure 2—figure supplement 1
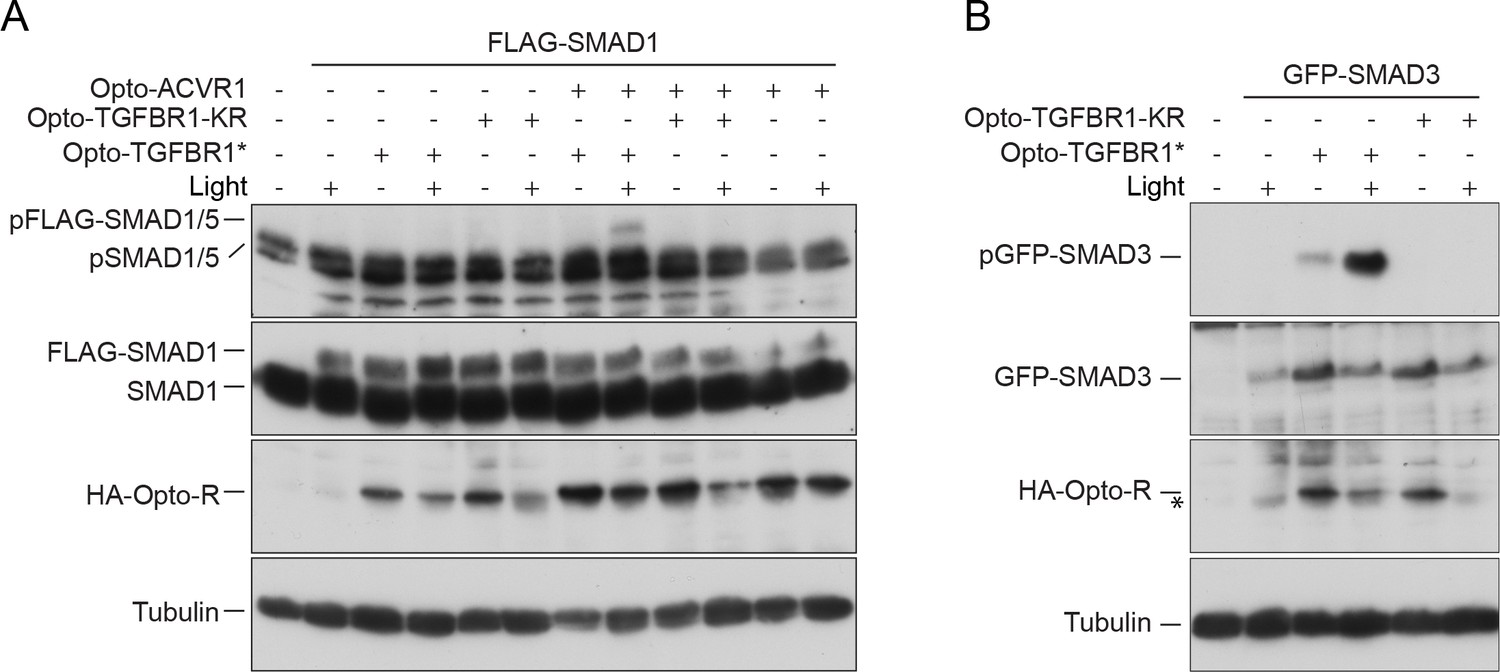
Kinase dead Opto-TGFBR1 cannot activate Opto-ACVR1.
(A) NIH-3T3 cells were untransfected or transfected with FLAG-SMAD1 together with either Opto-TGFBR1*, Opto-ACVR1 or both receptors together, or a kinase-dead version of Opto-TGFBR1 (Opto-TGFBR1-KR) alone or together with Opto-ACVR1. Post transfection, cells were either kept in the dark or exposed to blue light for 1 hr. Whole cell extracts were western blotted using antibodies against pSMAD1/5 (which detects endogenous and FLAG-tagged pSMAD1/5), SMAD1 (which detects endogenous and FLAG-SMAD1), HA (to detect the Opto receptors) and Tubulin as a loading control. (B) The experimental set up was as in (A) except that GFP-SMAD3 was used instead of FLAG-SMAD1 to assess the activity of Opto-TGFBR1* and Opto-TGFBR1-KR. The band marked with an asterisk is a background band.
Figure 3 with 1 supplement
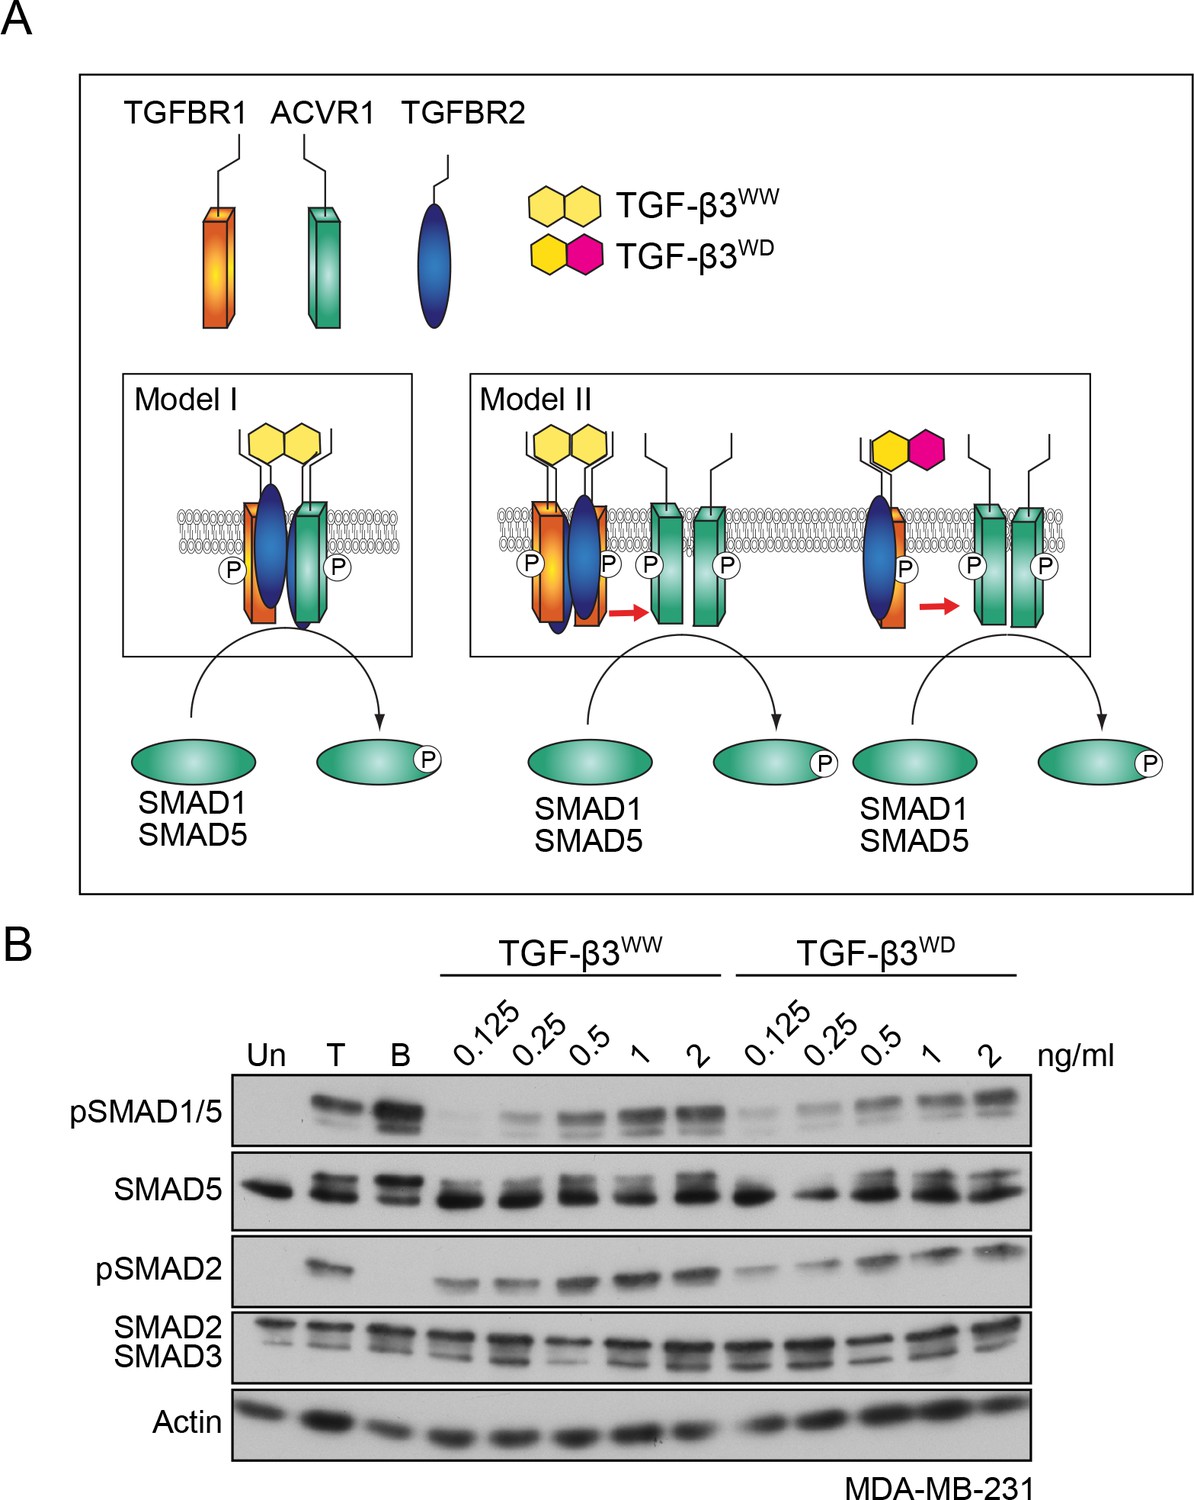
TGFBR1 and ACVR1 are present in distinct receptor complexes upon TGF-β stimulation.
(A) Alternative models of receptor clustering mediated by TGF-β3 derivatives capable of interacting with two pairs (TGF-β3WW) or one pair (TGF-β3WD) of type II:type I receptors. If an obligate heterotetramer of two type I:type II pairs is required for SMAD1/5 phosphorylation (Model I), then only TGF-β3WW would lead to SMAD1/5 phosphorylation. If TGF-β induces higher order receptor clustering at the cell surface (Model II), then both TGF-β3WW and TGF-β3WD would lead to SMAD1/5 phosphorylation. (B) MDA-MB-231 cells were treated with different concentrations of TGF-β3WW or TGF-β3WD for 1 hr as indicated. As a control, cells were either untreated (Un) or treated with TGF-β1 (T) or BMP4 (B) for 1 hr. Whole cell lysates were western blotted using the antibodies shown.
Figure 3—figure supplement 1
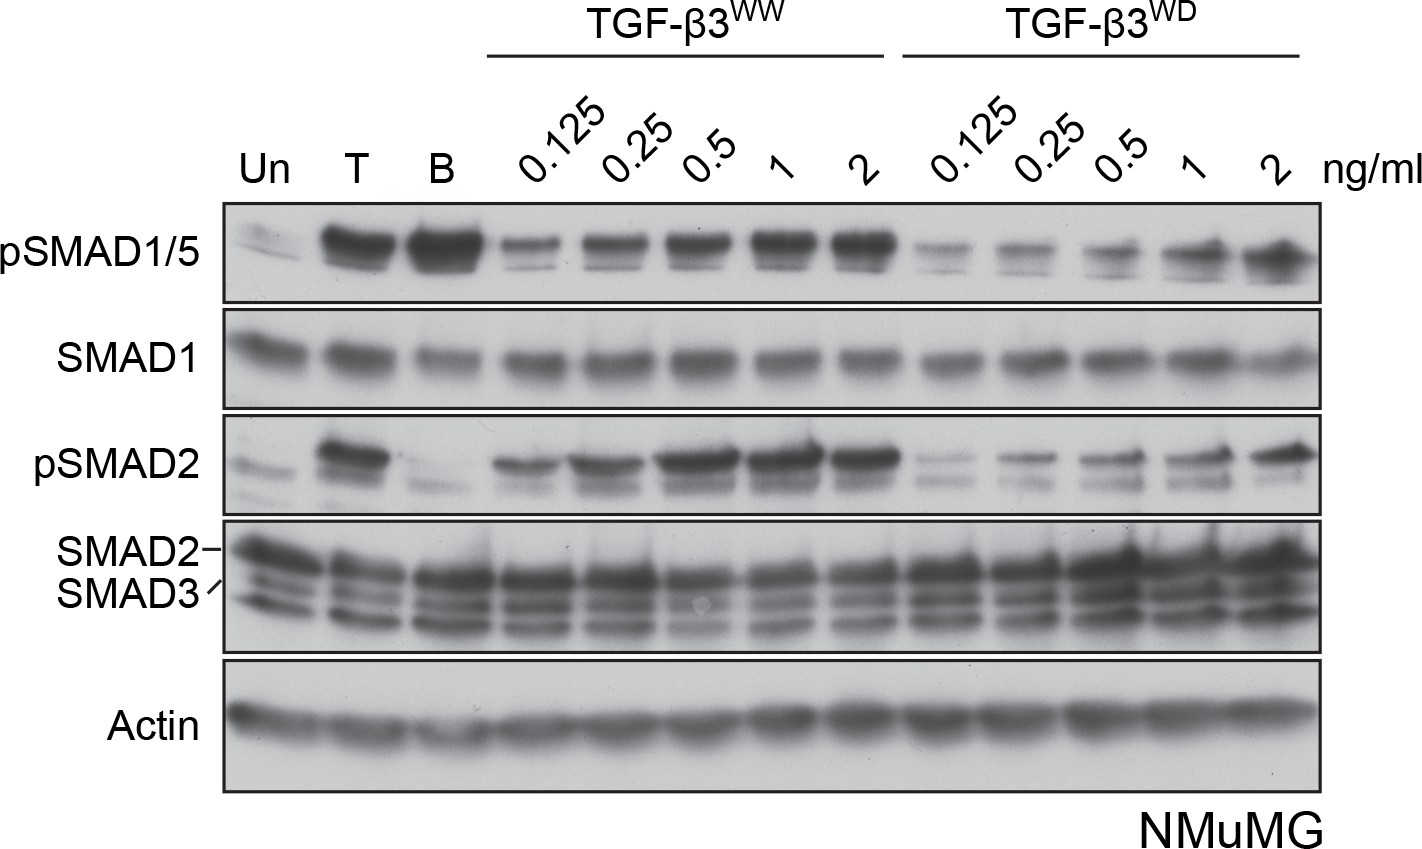
NMuMG cells respond to both TGF-β3WW and TGF-β3WD.
NMuMG cells were untreated (Un) or treated with TGF-β1 (T), BMP4 (B) or the indicated concentrations of TGF-β3WW and TGF-β3WD for 1 hr. Whole cell lysates were immunoblotted with the antibodies shown. Both TGF-β3WW and TGF-β3WD induce phosphorylation of pSMAD1/5, although the latter is less potent.
Figure 4 with 1 supplement
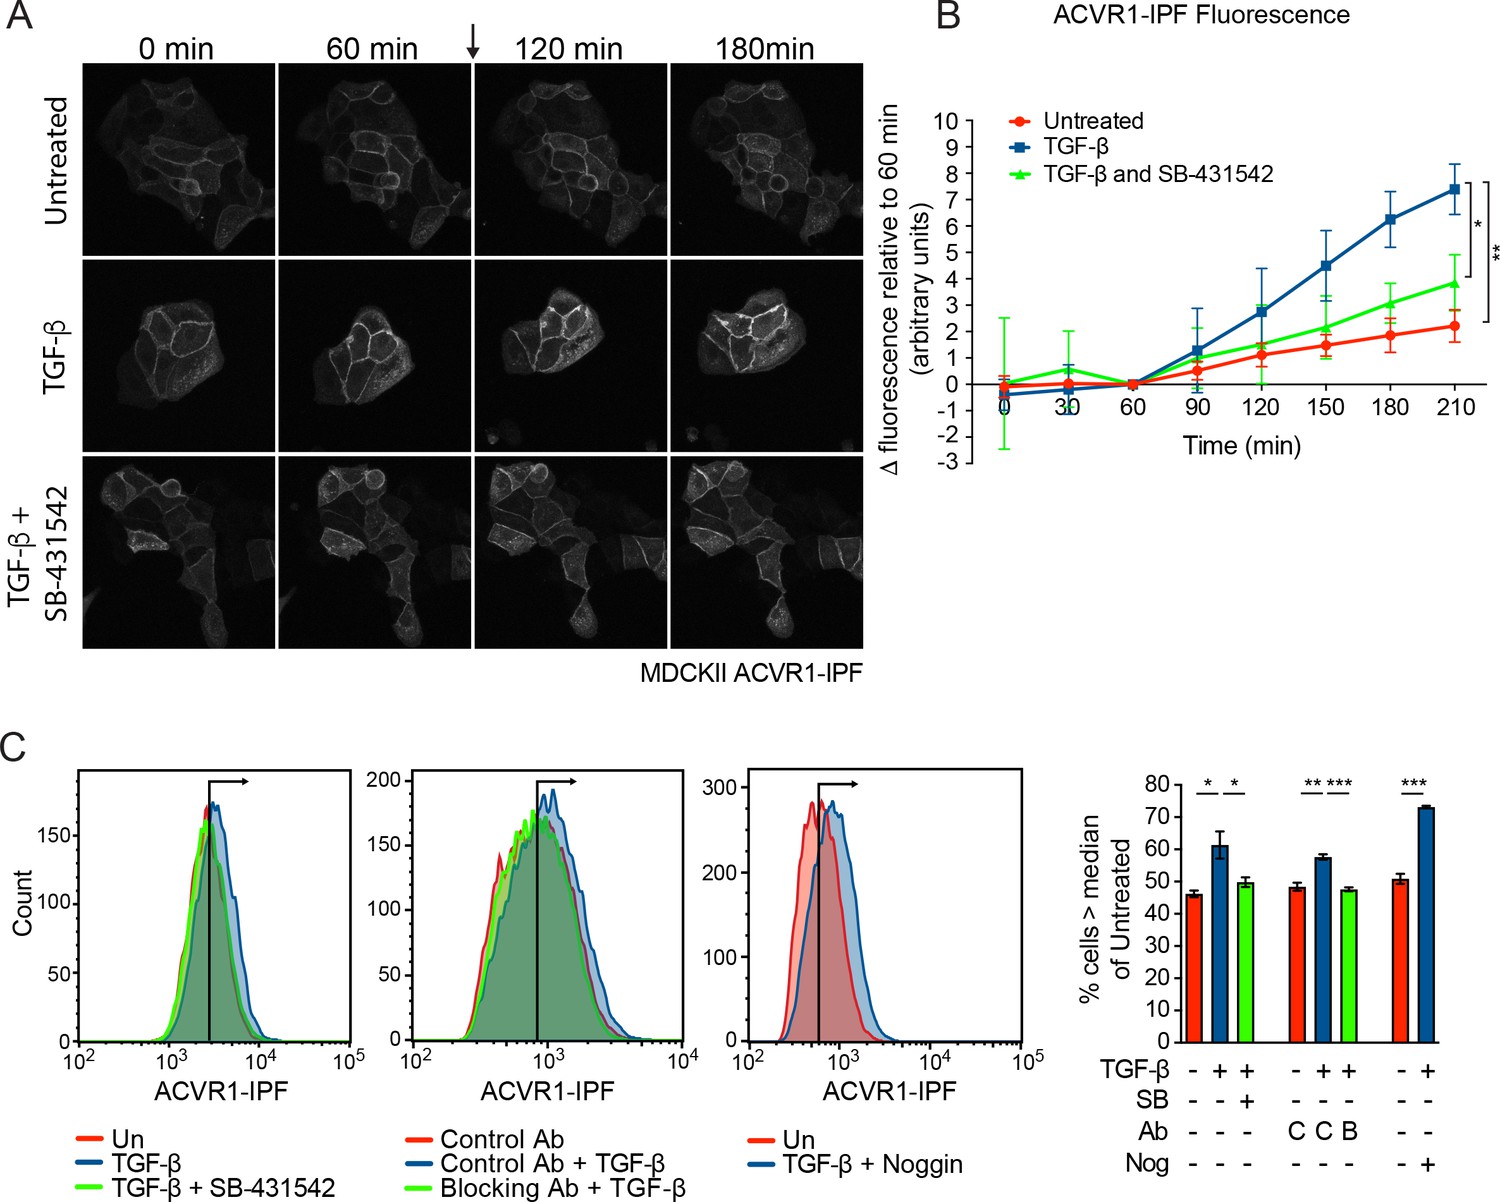
ACVR1 is activated by TGF-β in a TGFBR1-dependent manner.
(A and B) MDCKII ACVR1-IPF cells were imaged at 15 min intervals for 60 min before the addition (arrow) of either media alone or media containing TGF-β ± 10 µM SB-431542 for a further 150 min. The panels in (A) are stills of the maximum intensity projections at the times shown. The quantifications are shown in (B). The fluorescence at the 60 min time point was taken as the reference that was subtracted from all other time points. Data presented are the mean ± SD of three independent fields. Statistical significance is shown for the indicated pairs of conditions at the 210 min time point. (C) Fluorescence in MDCKII ACVR1-IPF cells assayed by flow cytometry 24 hr after treatment. Each panel shows an overlay of the indicated treatment conditions. The black line indicates the median of the untreated (Un) sample. Quantifications are shown on the right. For each group, the percentage of cells greater than the median fluorescence intensity of the untreated sample was quantified. Data are the mean ± SEM of three independent experiments. SB, SB-431542 at 10 µM; Ab, antibody; Nog, noggin; C, control antibody; B, blocking antibody.
-
Figure 4—source data 1
Source data for ACVR1-IPF fluorescence (panel B).
- https://doi.org/10.7554/eLife.31756.016
-
Figure 4—source data 2
Source data for ACVR1-IPF fluorescence by flow cytometry (panel C).
- https://doi.org/10.7554/eLife.31756.017
Figure 4—figure supplement 1
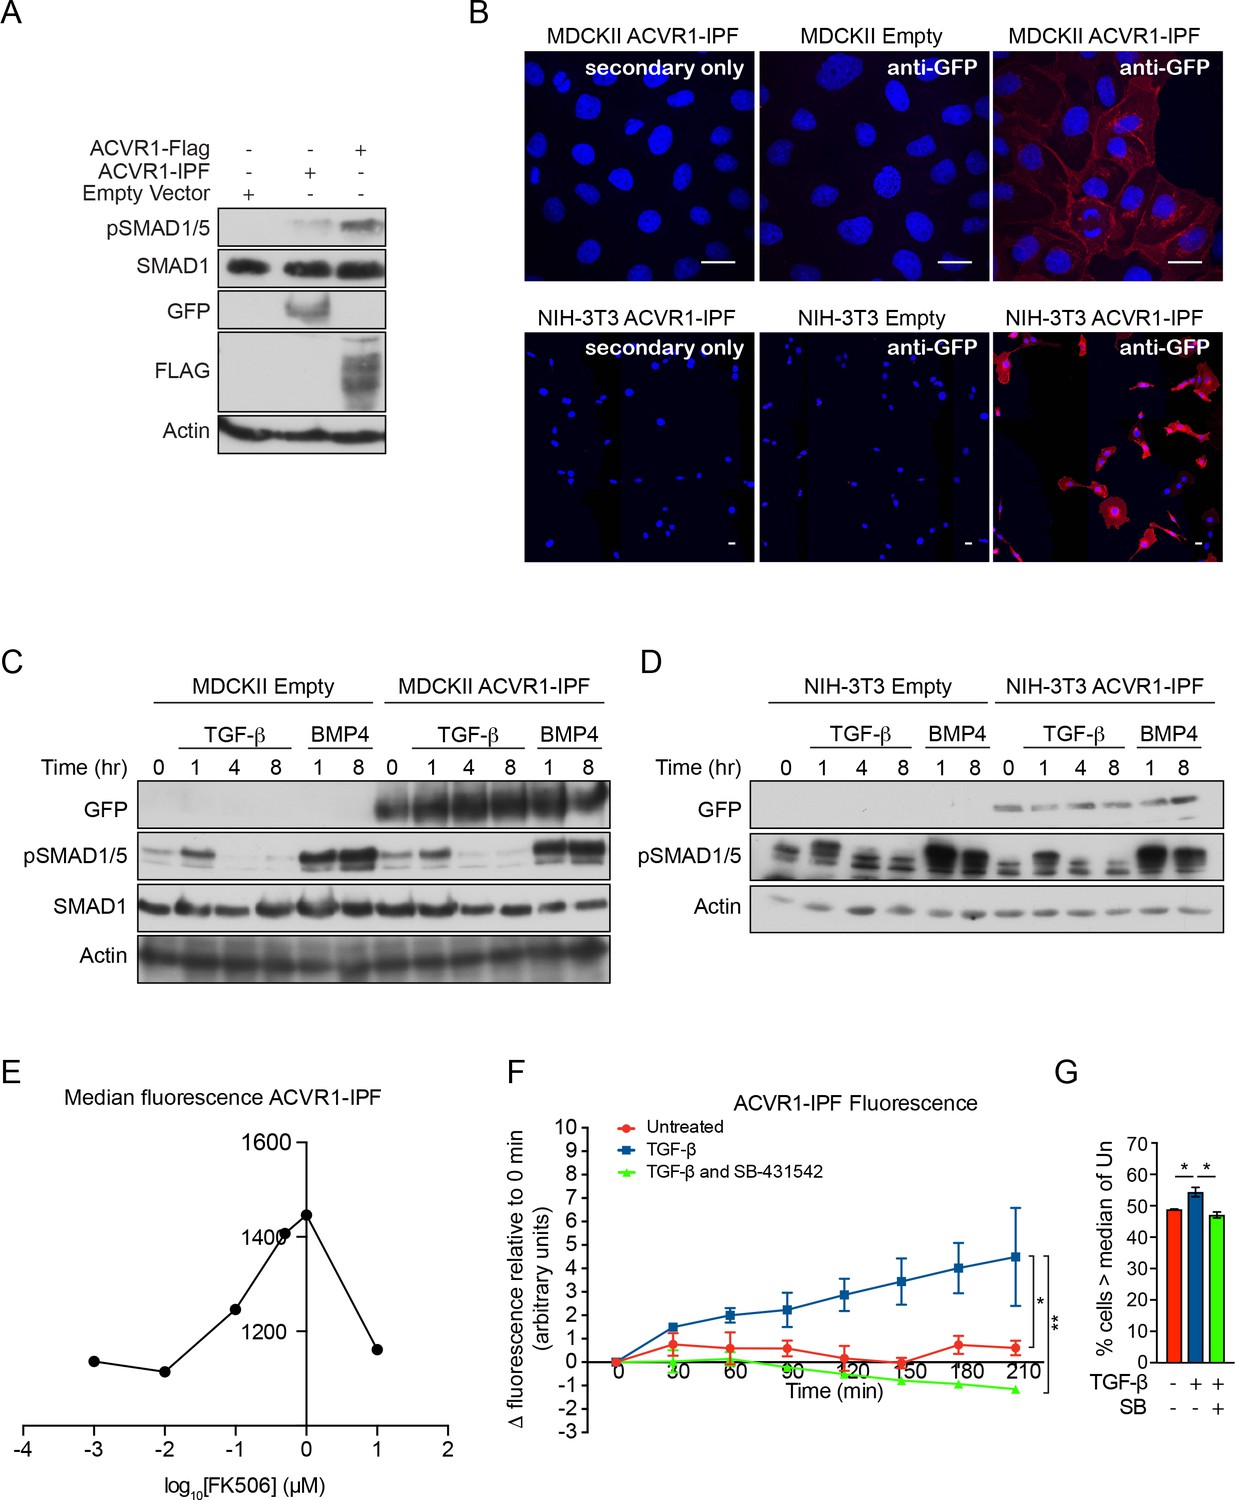
Characterization of cells stably transfected with the ACVR1-IPF.
(A) NMuMG cells knocked out for ACVR1 and BMPR1A were transfected with either empty vector (pcDNA3.1 Hygro (+)), ACVR1-IPF or ACVR1-FLAG. Whole cell extracts were western blotted for pSMAD1/5, SMAD1 and GFP and FLAG. Actin is a loading control. (B) MDCKII ACVR1-IPF or NIH-3T3 ACVR1-IPF cells imaged by indirect IF with an antibody against GFP (red) with nuclei stained with DAPI (blue). The controls were a secondary antibody only sample (left) and the matched empty vector-transfected cells stained with the GFP antibody (middle). Scale bar equates to 20 µM. ACVR1-IPF localizes to the membrane in both cell types, with basolateral localization in the MDCKII cells. (C and D) The MDCKII or NIH-3T3 cell lines shown in (B) were treated with TGF-β or BMP4 for the times indicated. Whole cell lysates were immunoblotted with the indicated antibodies. Stable transfection of ACVR1-IPF does not affect the phosphorylation kinetics of SMAD1/5 in response to TGF-β or BMP. (E) Median fluorescence intensity (y-axis) as measured by flow cytometry of MDCKII ACVR1-IPF cells treated with the indicated concentrations of FK506 for 4 hr. FK506 activates ACVR1-IPF fluorescence in a dose-dependent manner. (F) Quantification of NIH-3T3 ACVR1-IPF cells imaged at 30 min intervals for a total of 210 min after the addition of either media alone or media containing TGF-β ± 10 µM SB-431542. Data presented are the mean ± SD of three independent fields. Statistical significance is shown for the indicated pairs of conditions at the 210 min timepoint. (G) Fluorescence in NIH-3T3 ACVR1-IPF cells assayed by flow cytometry 24 hr after being treated with media alone or with TGF-β ± 10 µM SB-431542 (SB). The percentage of cells with fluorescence greater than the median fluorescence intensity of the untreated sample (-) was quantified. Data are presented as the mean ± SEM of three independent experiments.
-
Figure 4—figure supplement 1—source data 1
Source data for ACVR1-IPF fluorescence by flow cytometry (panel E).
- https://doi.org/10.7554/eLife.31756.013
-
Figure 4—figure supplement 1—source data 2
Source data for ACVR1-IPF fluorescence (panel F).
- https://doi.org/10.7554/eLife.31756.014
-
Figure 4—figure supplement 1—source data 3
Source data for ACVR1-IPF fluorescence by flow cytometry (panel G).
- https://doi.org/10.7554/eLife.31756.015
Figure 5 with 2 supplements
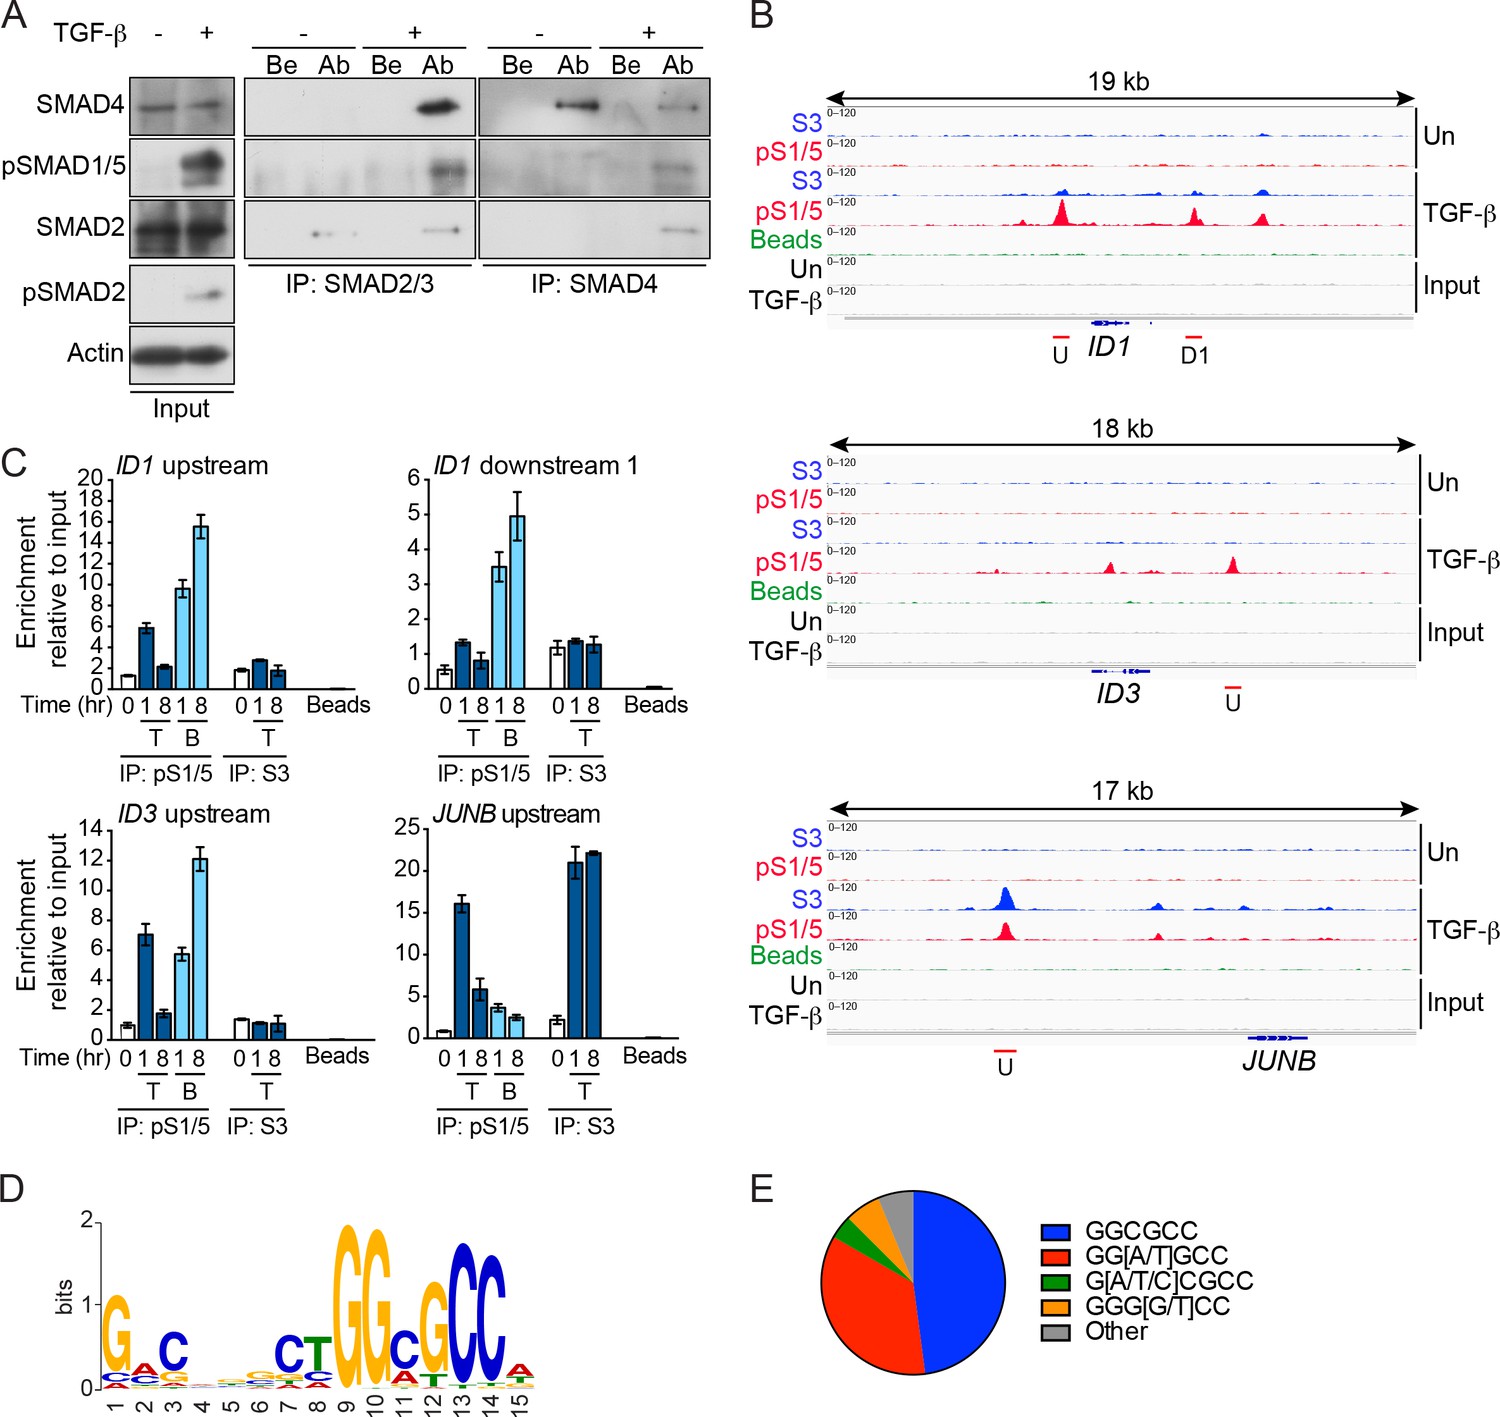
pSMAD1/5 is recruited to chromatin in response to TGF-β and is most highly enriched at GGCGCC motifs.
(A) MDA-MB-231 cells were either untreated (-) or treated with TGF-β (+) for 1 hr. Whole cell extracts were immunoprecipitated (IP) with the antibodies (Ab) indicated or beads alone (Be). The IPs were western blotted using the antibodies shown. Inputs are shown on the left. (B) IGV browser displays over the ID1, ID3 and JUNB loci after ChIP-Seq of MDA-MB-231 untreated (Un) and TGF-β-treated samples. IPs were performed with antibodies against pSMAD1/5 (pS1/5), SMAD3 (S3) or with beads alone as a negative control. Inputs are also shown. Red lines indicate regions validated in (C). U; upstream peak; D1, downstream peak 1. (C) Genomic regions were validated by ChIP-qPCR after treatment of MDA-MB-231 cells with TGF-β (T) or BMP4 (B) for the times shown. IPs were as in (B). A representative experiment of two performed in triplicate is shown with means ± SD. (D) The most enriched motif obtained from a MEME-ChIP analysis of the top 100 pSMAD1/5 peaks. (E) Proportion of variants of the GGCGCC motif identified in the top 100 pSMAD1/5 peaks.
-
Figure 5—source data 1
ChIP-seq datasets.
- https://doi.org/10.7554/eLife.31756.033
-
Figure 5—source data 2
ChIP-PCR data for graphs in panel C.
- https://doi.org/10.7554/eLife.31756.034
Figure 5—figure supplement 1
Chromatin binding of pSMAD1/5 and SMAD3.
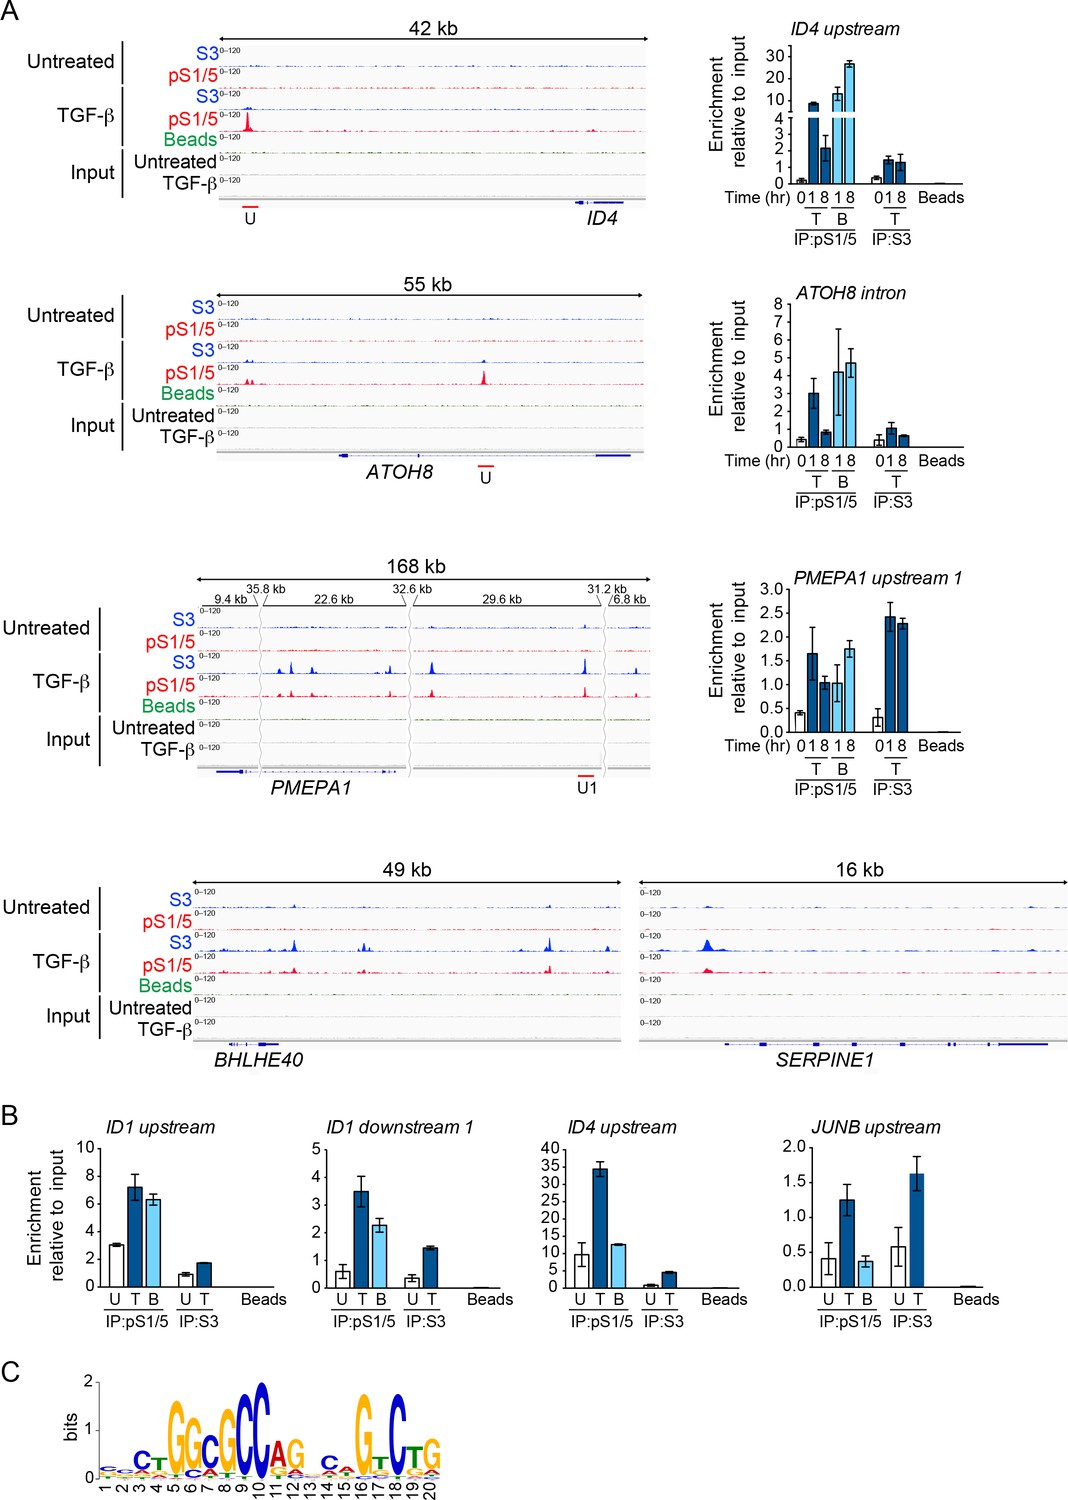
(A) IGV browser displays around the ID4, ATOH8, PMEPA1, BHLHE40 and SERPINE1 loci after ChIP-Seq for SMAD3 (S3) and pSMAD1/5 (pS1/5) in MDA-MB-231 cells. Untreated and TGF-β-treated samples and the inputs are shown. IPs were performed with beads as a negative control. Red lines indicate genomic regions validated by ChIP-qPCR after treatment of MDA-MB-231 cells with TGF-β (T) or BMP4 (B) for the times indicated (right panels). U, upstream peak; U1, upstream peak 1. In response to TGF-β, pSMAD1/5 bound transiently at the ID4 and ATOH8 loci while SMAD3 bound stably to PMEPA1 over the same time course. (B) ChIP-qPCR of the indicated loci after treatment of BT-549 cells with TGF-β (T) or BMP4 (B) for 1 hr. IPs were as in (A). In response to TGF-β, pSMAD1/5 bound strongly around the ID loci, while SMAD3 bound strongly to the JUNB upstream locus. In (A) and (B) a representative experiment of two performed in triplicate is shown with means ± SD. (C) The most enriched motif obtained from a MEME-ChIP analysis of the top 50 pSMAD1/5 peaks. The canonical SMAD1/5:SMAD4-binding element is strongly enriched in these peaks.
-
Figure 5—figure supplement 1—source data 1
ChIP-PCR data for graphs in panel A.
- https://doi.org/10.7554/eLife.31756.026
-
Figure 5—figure supplement 1—source data 2
ChIP-PCR data for graphs in panel B.
- https://doi.org/10.7554/eLife.31756.027
Figure 5—figure supplement 2
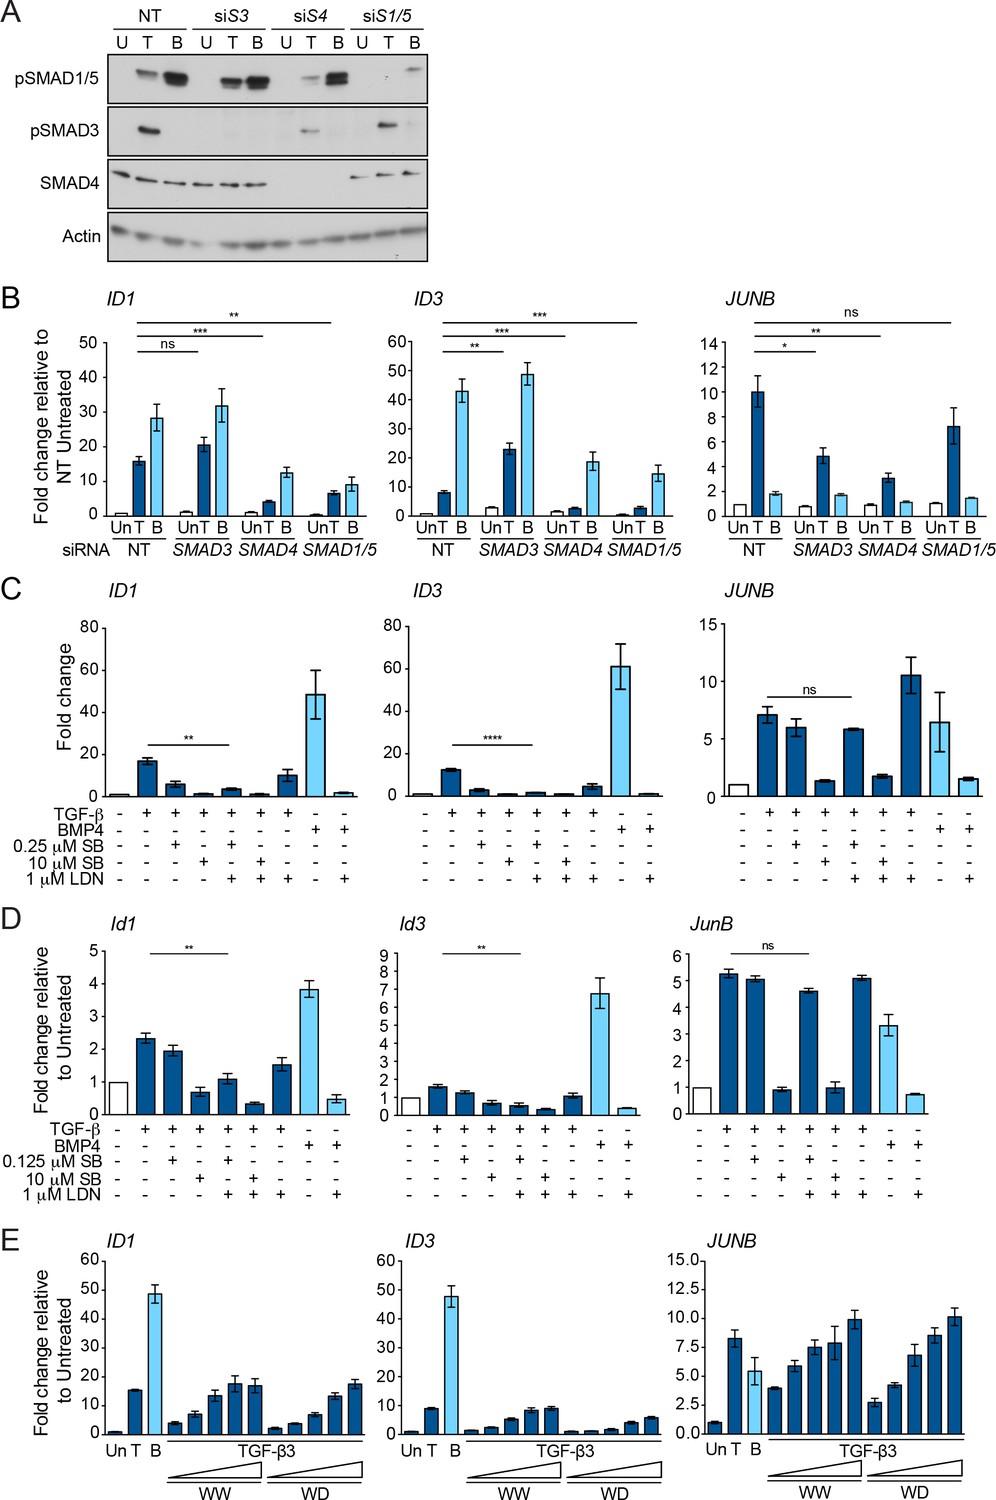
ID1 and ID3 are TGF-β-induced target genes that require the pSMAD1/5 signaling arm.
(A) Western blots showing knockdown efficiency in MDA-MB-231s of the siRNAs shown. S3, SMAD3; S4, SMAD4; S1/5, SMAD1/5; NT, non targeting. Cells were untreated (U) or treated with TGF-β (T) or BMP4 (B) for 1 hr. Lysates were immunoblotted using the antibodies shown. (B) MDA-MB-231 cells were transfected with siRNAs against the indicated SMADs or a non-targeting control (NT) and then treated with TGF-β (T) or BMP4 (B) for 1 hr. Un, untreated. (C) MDA-MB-231 cells were left untreated or treated with TGF-β ± SB-431542 (SB; 0.25 µM or 10 µM) ± 1 µM LDN-193189 (LDN) or BMP4 ± 1 µM LDN-193189 for 1 hr. In B and C, gene expression was measured by qPCR. Data are presented as fold change relative to the untreated NT sample in (B) and to the (-) sample in (C) and are the means ± SEM of three independent experiments. Statistical significance is shown for selected comparisons. (D) NMuMG cells were treated with TGF-β or BMP4 ± the inhibitors indicated. Gene expression was measured by qPCR. The combination of 0.125 µM SB-431542 (SB) and 1 µM LDN-193189 (LDN) inhibited TGF-β-induced Id1 and Id3 expression without affecting JunB expression. The data are means ± SEM of at least two independent experiments. Statistical significance is shown for selected comparisons. (E) MDA-MB-231 cells were treated with TGF-β1 (T), BMP4 (B) or different concentrations of TGF-β3WW and TGF-β3WD for 1 hr as in Figure 3B. Gene expression was measured by qPCR. Both TGF-β3WW and TGF-β3WD led to the induction of ID1, ID3 and JUNB, although the induction by TGF-β3WD was weaker. A representative experiment of two, performed in triplicate is shown with means ± SD.
-
Figure 5—figure supplement 2—source data 1
qPCR data for graphs in panel B.
- https://doi.org/10.7554/eLife.31756.029
-
Figure 5—figure supplement 2—source data 2
qPCR data for graphs in panel C.
- https://doi.org/10.7554/eLife.31756.030
-
Figure 5—figure supplement 2—source data 3
qPCR data for graphs in panel D.
- https://doi.org/10.7554/eLife.31756.031
-
Figure 5—figure supplement 2—source data 4
qPCR data for graphs in panel E.
- https://doi.org/10.7554/eLife.31756.032
Figure 6 with 3 supplements
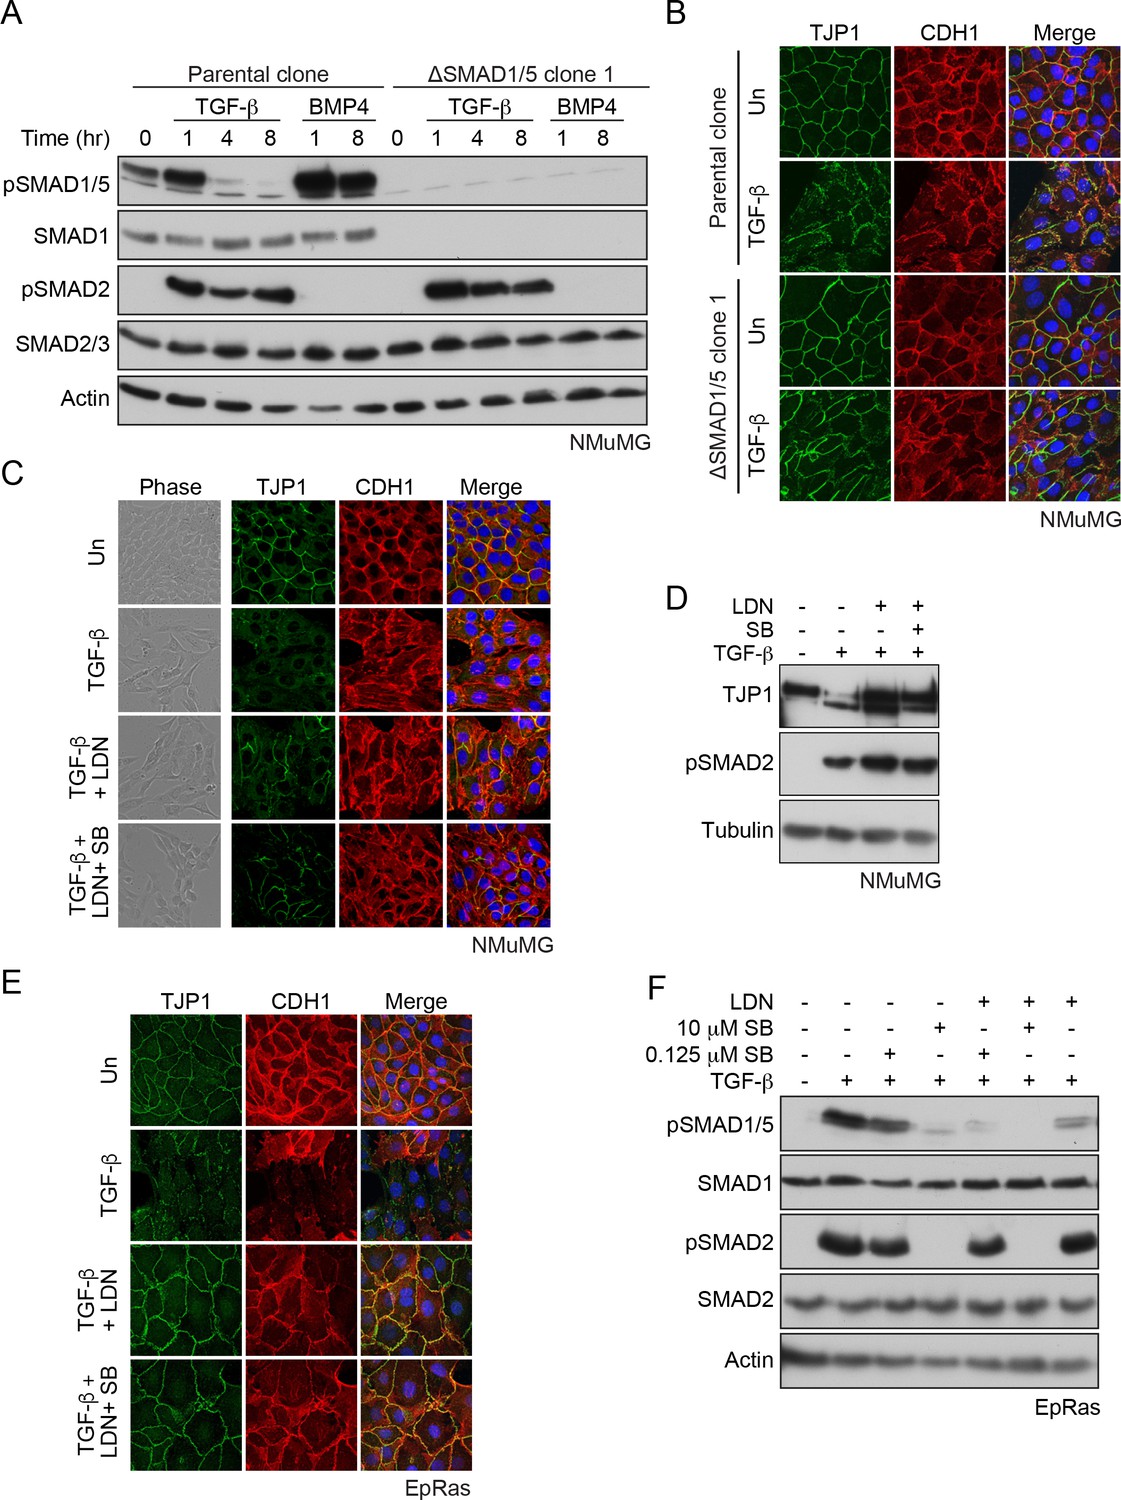
SMAD1/5 is required for TGF-β-induced EMT.
(A) The parental NMuMG clone and the ΔSMAD1/5 clone 1 were treated with TGF-β or BMP4 for the times shown. Whole cell extracts were immunoblotted with the antibodies indicated. (B) Parental NMuMG clone and the ΔSMAD1/5 clone 1 cells were left untreated or treated with TGF-β for 48 hr and imaged after indirect immunofluorescence (IF) using antibodies against TJP1 and CDH1. A merge of the two with DAPI in blue is also shown. (C) NMuMG cells were left untreated (Un) or treated with TGF-β alone or in combination with 1 µM LDN-193189 (LDN) ± 0.125 µM SB-431542 (SB) for 48 hr. Panels show cells imaged under either phase contrast (left panels) or by indirect immunofluorescence (IF) using antibodies against TJP1 and CDH1. A merge of the two with DAPI in blue is also shown. (D) NMuMG cells were left untreated or treated with TGF-β alone or in combination with either 1 µM LDN-193189 ± 0.125 µM SB-431542 for 48 hr. Whole cell lysates were immunoblotted with the indicated antibodies. (E) EpRas cells were left untreated (Un) or treated with TGF-β alone or in combination with 1 µM LDN-193189 (LDN) ± 0.125 µM SB-431542 (SB) for 9 days, then imaged after indirect immunofluorescence (IF) using antibodies against TJP1 and CDH1 or a merge of the two with DAPI in blue. (F) EpRas cells were left untreated or treated with TGF-β for 1 hr alone or with combinations of 1 µM LDN-193189, 0.125 µM SB-431542 or 10 µM SB-431542 as indicated. Whole cell lysates were immunoblotted with the indicated antibodies. In (B), (C) and (E) the indirect IF images are maximum intensity projections of a z-stack in each channel.
-
Figure 6—source data 1
RNA-seq datasets.
- https://doi.org/10.7554/eLife.31756.040
Figure 6—figure supplement 1

Characterization of the NMuMG ΔSMAD1/5 clones.
(A) Sequences of SMAD1 and SMAD5 in the regions around the guides in NMuMG ΔSMAD1/5 clone 1. From our sequencing we conclude that there are two alleles of SMAD1 and 3 alleles of SMAD5 in NMuMG cells. The protein sequence for the wild-type (WT) is shown in red above the DNA sequence. Frame shifts are evident in both SMAD1 mutant alleles, and all three SMAD5 alleles. (B) The parental NMuMG clone and the ΔSMAD1/5 clone 2 were treated with TGF-β or BMP4 for the times shown. Whole cell extracts were immunoblotted with the antibodies indicated. (C) Sequences of SMAD1 and SMAD5 in the regions around the guides in NMuMG ΔSMAD1/5 clone 2. The protein sequence for the wild-type (WT) is shown in red above the DNA sequence. This clone exhibits no pSMAD1/5 in reponse to either TGF-β or BMP4 (see panel B), despite having a single allele of SMAD1 and SMAD5 with an in-frame deletion of a single amino acid. This is readily explained by the nature of those mutations, which likely lead to unfolded proteins. Mutant SMAD1 allele 1 is deleted for the conserved amino acid Y125 in the MH1 domain, which is adjacent to H126, that is responsible for chelating a Zn ion in the zinc finger (BabuRajendran et al., 2010). Mutant SMAD5 allele 1 is deleted for the conserved amino acid V283 which is in β-sheet 2 of the MH2 domain, which is critical for folding of this domain (Wu et al., 2001, Qin et al., 2001). In SMAD1 allele 1 the insert length is 124 bp and in SMAD5 allele 3, it is 59 bp. (D) Parental NMuMG clone and the ΔSMAD1/5 clone 2 cells were treated with or without TGF-β for 48 hr, fixed and imaged following indirect immunofluorescence (IF) using antibodies against TJP1 and CDH1. A merge of the two with DAPI in blue is also shown. The indirect IF images are maximum intensity projections of a z-stack in each channel.
Figure 6—figure supplement 2
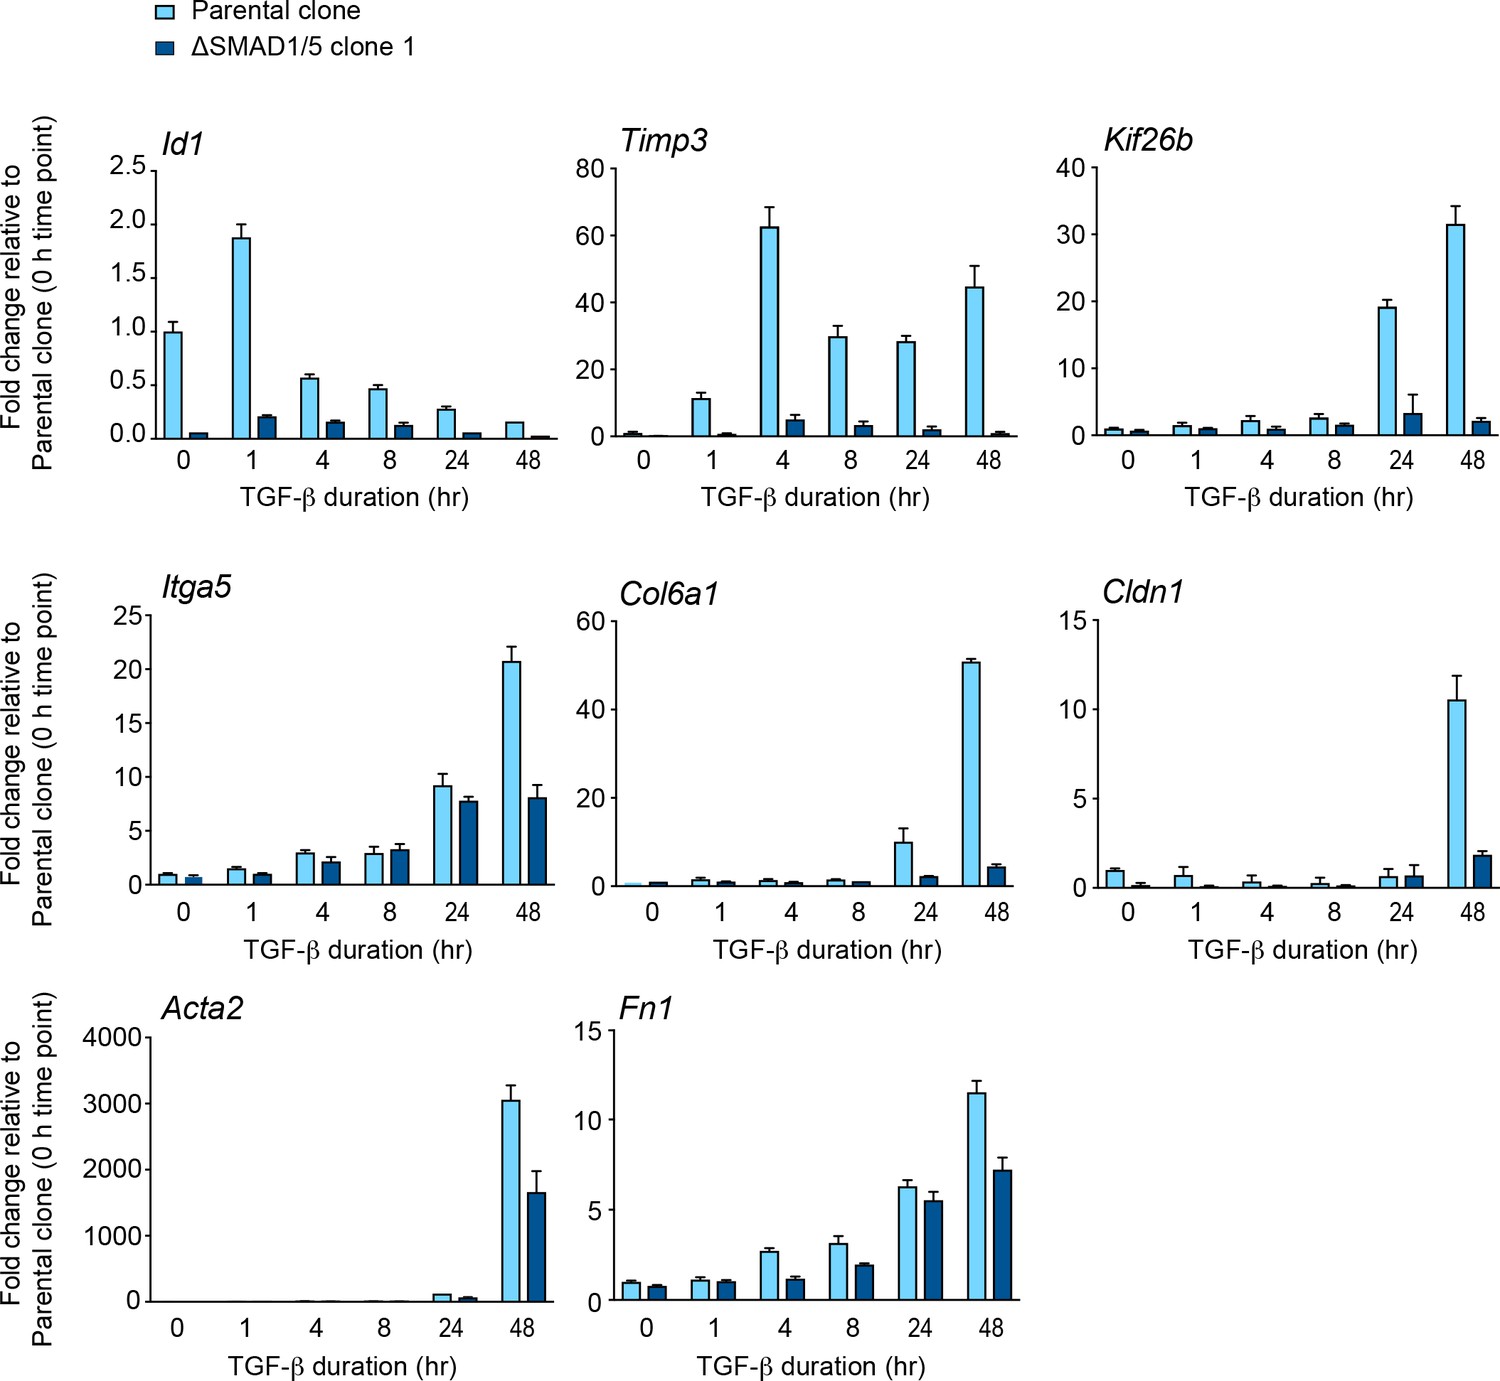
Validation of SMAD1/5-dependent TGF-β-induced genes.
NMuMG parental clone and NMuMG ΔSMAD1/5 clone 1 cells were untreated or treated with TGF-β for the times shown. Total RNA was extracted and qPCR was used to assay the levels of mRNA for the genes shown. The data shown are from a representative experiment (means ± SD).
-
Figure 6—figure supplement 2—Source data 1
qPCR data for all graphs shown.
- https://doi.org/10.7554/eLife.31756.038
Figure 6—figure supplement 3

The pSMAD1/5 signaling arm is required for TGF-β-mediated EMT.
(A) NMuMG cells were transfected with non-targeting (NT) or siRNAs against the SMADs as indicated. Cells were then left untreated or treated with TGF-β for 24 hr. Cells were imaged after indirect IF with antibodies against TJP1 and CDH1. A merge of the two with DAPI in blue is also shown. All indirect IF images are maximum intensity projections of a z-stack in each channel. SMAD1/5, SMAD3 and SMAD4 are all required for TGF-β-induced EMT. (B) Western blots to show knockdown efficiency of the siRNAs. NMuMG cells were untreated (Un) or treated with TGF-β (T) or BMP4 (B) for 1 hr. Lysates were immunoblotted using the antibodies shown. (C) NMuMG cells were treated with ligands or inhibitors as indicated. Cell lysates were immunoblotted using the antibodies shown. A combination of 0.125 µM SB-431542 and 1 µM LDN-193189 or 0.125 µM SB-431542 and 1 µM DMH1 was sufficient to abolish the TGF-β-induced phosphorylation of SMAD1/5. (D) NMuMG cells were either untreated (Un) or treated with TGF-β ± 1 µM DMH1 ± 0.125 µM SB-431542 (SB) for 48 hr. Cells were fixed and stained for TJP1 and CDH1. In the merge, DAPI (blue) marks the nuclei. DMH1 is sufficient to inhibit TGF-β-induced EMT.
Figure 7 with 1 supplement
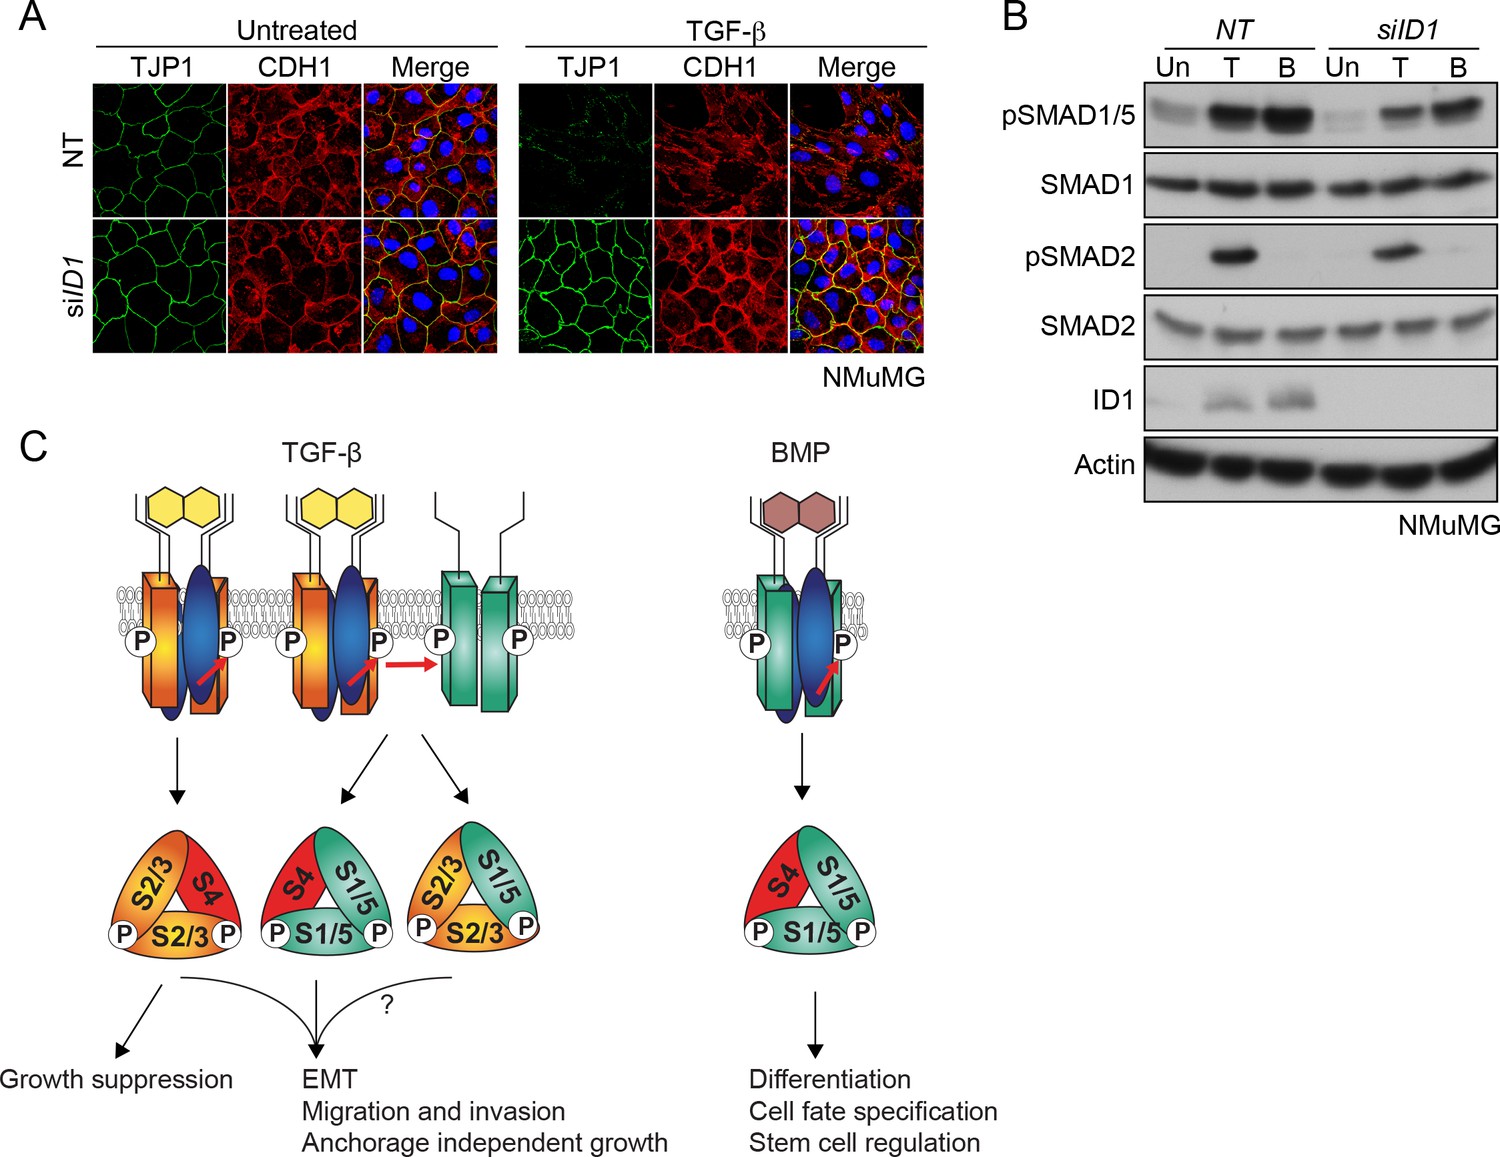
TGF-β-induced ID1 via pSMAD1/5 is required for EMT.
(A) NMuMG cells were transfected with siRNAs against ID1 or NT control, then left untreated or treated with TGF-β for 24 hr. Cells were imaged after indirect IF with antibodies against TJP1 and CDH1 or a merge of the two with DAPI in blue. All indirect IF images are maximum intensity projections of a z-stack in each channel. (B) Western blots to show knockdown efficiency of the ID1 siRNA. NMuMG cells were treated with TGF-β (T) or BMP4 (B) for 1 hr. (C) The model shows combinatorial signaling by TGF-β utilizing complexes containing two different type I receptors. Type II receptors are shown in blue, TGFBR1 in orange and ACVR1 in green as in Figure 3A. P denotes phosphorylation. S1/5, SMAD1/5; S2/3, SMAD2/3; S4, SMAD4. The question mark indicates that we do not yet know the function of the mixed R-SMAD complexes in the physiological responses. For discussion, see text.
Figure 7—figure supplement 1
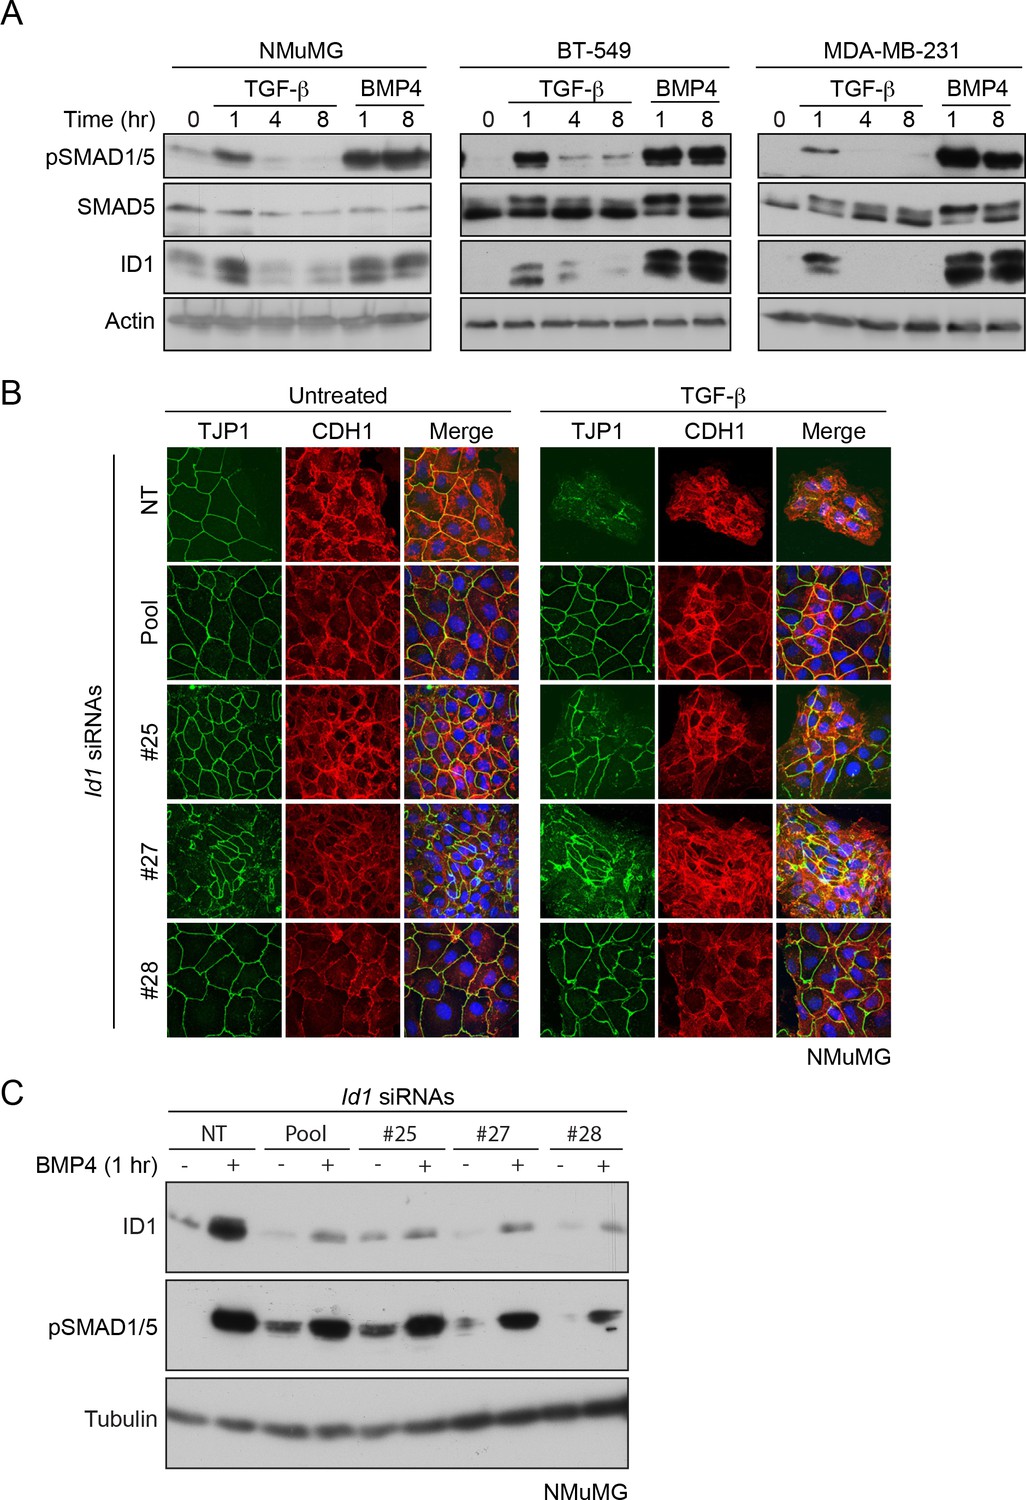
TGF-β-induced ID1 is required for EMT.
(A) NMuMG, BT-549 and MDA-MB-231s were treated with ligands as shown and lysates were immunoblotted using the antibodies indicated. The induction of ID1 correlates with pSMAD1/5 phosphorylation. (B) NMuMG cells were transfected with non-targeting (NT) or individual siRNAs against Id1 as indicated. Cells were then left untreated or treated with TGF-β for 48 hr. Cells were imaged after indirect IF with antibodies against TJP1 and CDH1. A merge of the two with DAPI in blue is also shown. All indirect IF images are maximum intensity projections of a z-stack in each channel. Knockdown of ID1 by any of the siRNAs inhibits TGF-β-induced EMT. (C) NMuMG cells were transfected with siRNAs as in (B). They were uninduced or induced with BMP4 for 1 hr to induce expression of ID1. Whole cell extracts were immunoblotted for the proteins indicated. The siRNAs efficiently knock down ID1 protein levels.
Videos
Video 1
Fluorescence in MDCKII ACVR1-IPF cells treated with media alone.
MDCKII ACVR1-IPF cells were imaged for 1 hr prior to the addition of media alone followed by imaging for a further 2.5 hr. Very little increase in fluorescence was observed over the time course.
Video 2
Fluorescence in MDCKII ACVR1-IPF cells treated with TGF-β.
MDCKII ACVR1-IPF cells were imaged for 1 hr prior to the addition of 2 ng/ml TGF-β followed by imaging for a further 2.5 hr. Significant increase in fluorescence was observed over the time course with intracellular puncta of fluorescence becoming more evident over time.
Video 3
Fluorescence in MDCKII ACVR1-IPF cells treated with TGF-β and SB-431542.
MDCKII ACVR1-IPF cells were imaged for 1 hr prior to the addition of 2 ng/ml TGF-β + 10 μM SB-431542 to the cells followed by imaging for a further 2.5 hr. Very little increase in fluorescence was observed over the time course.
Video 4
Fluorescence in NIH-3T3 ACVR1-IPF cells treated with media alone.
NIH-3T3 ACVR1-IPF cells were imaged for 3.5 hr after the addition of media alone. A modest and gradual increase in fluorescence was observed over the time course.
Video 5
Fluorescence in NIH-3T3 ACVR1-IPF cells treated with TGF-β.
NIH-3T3 ACVR1-IPF cells were imaged for 3.5 hr after the addition of 2 ng/ml TGF-β. A significant increase in fluorescence was observed over the time course with fluorescence becoming more evident on membrane projections and intracellular vesicles over time.
Video 6
Fluorescence in NIH-3T3 ACVR1-IPF cells treated with TGF-β and SB-431542.
NIH-3T3 ACVR1-IPF cells were imaged for 3.5 hr after the addition of 2 ng/ml TGF-β + 10 μM SB-431542. A modest and gradual increase in fluorescence was observed over the time course.
Additional files
-
Supplementary file 1
Sequence of Opto-TGFBR1*.
- https://doi.org/10.7554/eLife.31756.043
-
Supplementary file 2
Sequence of Opto-ACVR1.
- https://doi.org/10.7554/eLife.31756.044
-
Supplementary file 3
List of oligonucleotides and siRNAs.
- https://doi.org/10.7554/eLife.31756.045
-
Supplementary file 4
Key resources table.
- https://doi.org/10.7554/eLife.31756.046
-
Transparent reporting form
- https://doi.org/10.7554/eLife.31756.047
Download links
A two-part list of links to download the article, or parts of the article, in various formats.
Downloads (link to download the article as PDF)
Open citations (links to open the citations from this article in various online reference manager services)
Cite this article (links to download the citations from this article in formats compatible with various reference manager tools)
TGF-β uses a novel mode of receptor activation to phosphorylate SMAD1/5 and induce epithelial-to-mesenchymal transition
eLife 7:e31756.
https://doi.org/10.7554/eLife.31756


