Cross-species functional diversity within the PIN auxin efflux protein family
- University of Cambridge, United Kingdom
- Western Regional Research Center, USDA-ARS, United States
- United States Department of Energy Joint Genome Institute, United States
- University of California, Berkeley, United States
Figures
Figure 1 with 2 supplements
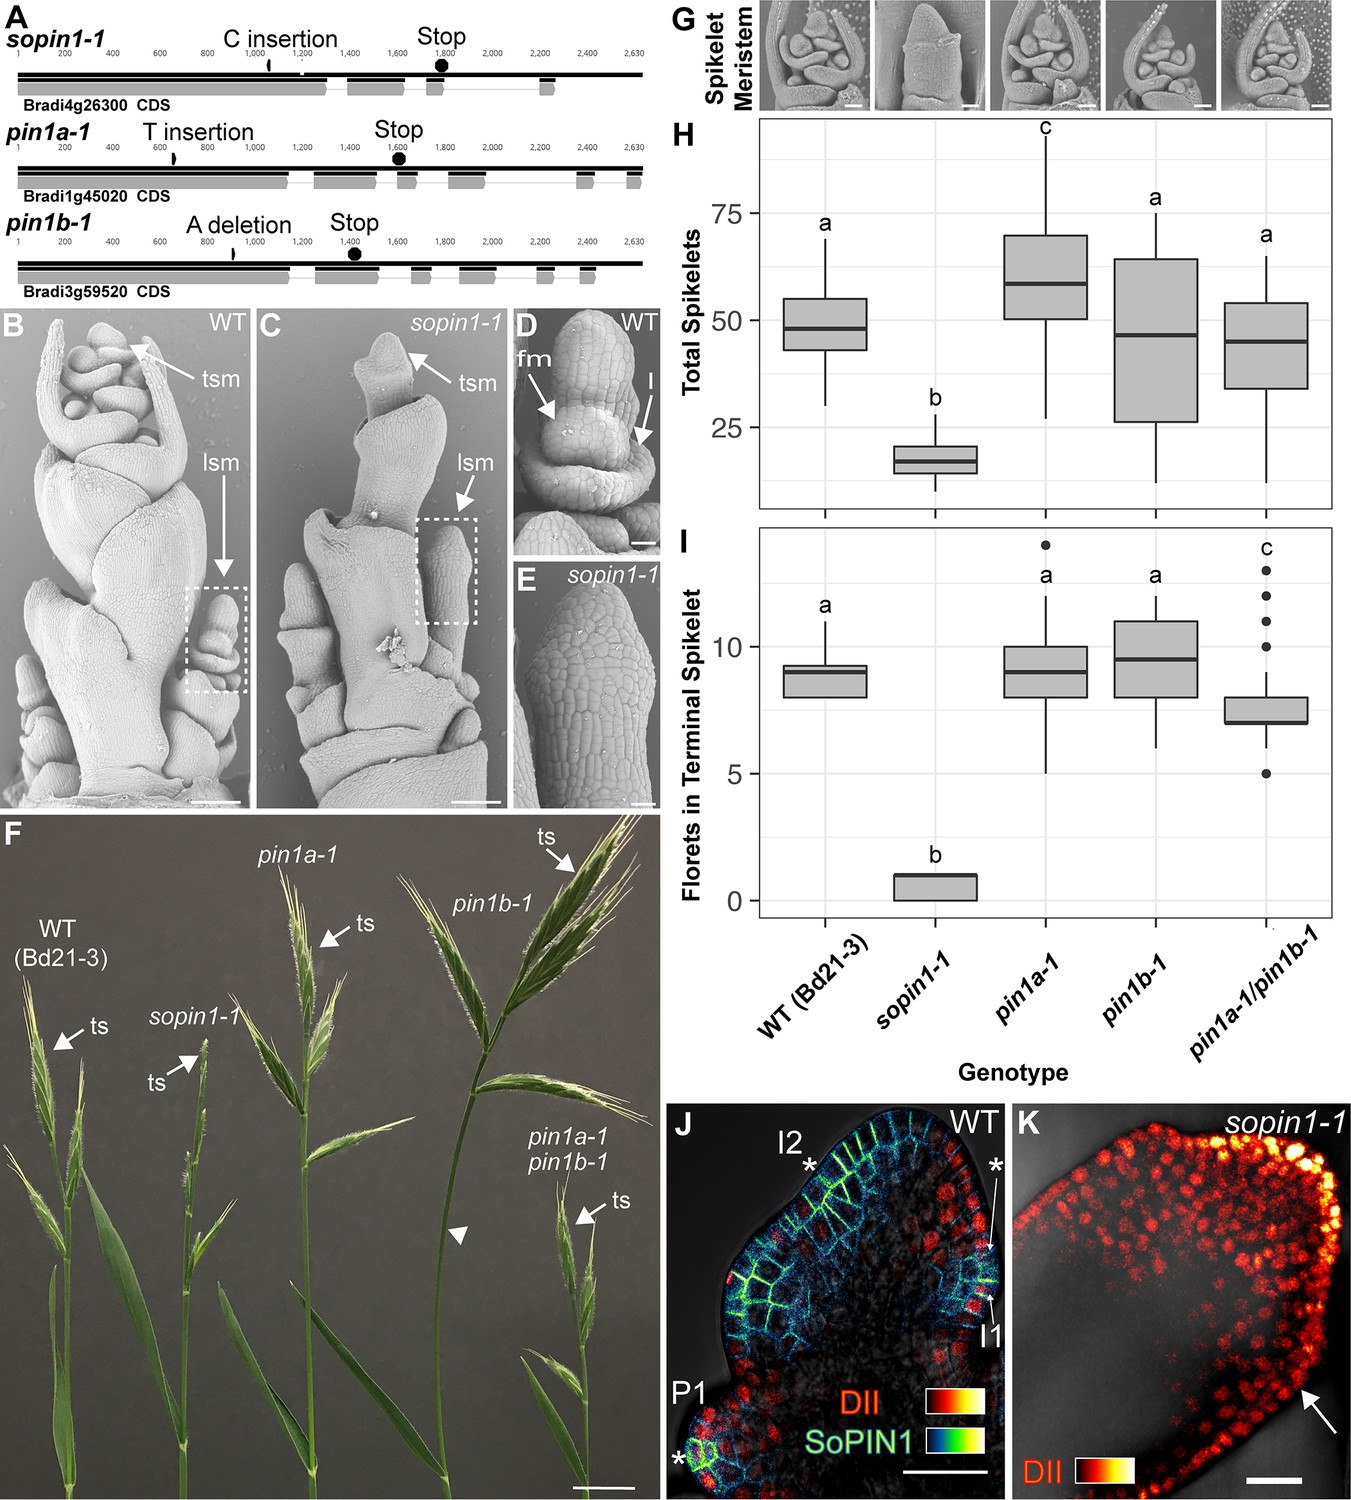
Mutation of SoPIN1 but not PIN1a and PIN1b severely effects organ initiation in Brachypodium.
(A) SoPIN1, PIN1a, and PIN1b CRISPR-derived mutant alleles (see Materials and methods). Coding sequences are indicated by grey boxes. Arrowheads indicate CRISPR target sites and are labeled with the type of DNA lesion (C insertion, T insertion, or A deletion). All mutant alleles have frame shifts that result in premature stop codons at the positions indicated. (B–G) Inflorescence phenotypes of CRISPR-derived sopin1-1, pin1a-1, and pin1b-1 mutants. See Figure 2 for whole-plant phenotypes. (B–E) and (G) are scanning electron microscopy (SEM). (B) Immature wild-type (WT) (inbred line Bd21-3) Brachypodium inflorescence with several lateral spikelet meristems (lsm), and a terminal spikelet meristem (tsm). (C) sopin1-1 plants have severe organ initiation defects in the inflorescence. (D) Detail of a wild-type lateral spikelet meristem outlined by a box in (B) showing an immature lemma (l), which is the leaf-like organ that subtends the floral meristem (fm). (E) Detail of barren lateral spikelet meristem outlined by box in (C). (F) Mature inflorescence phenotypes of WT (Inbred Bd21-3), sopin1-1, pin1a-1, pin1b-1, and double pin1a-1/pin1b-1 mutants. The terminal spikelet (ts) of each inflorescence is indicated for comparison. Arrowhead indicates bent internode tissue in pin1b-1. Genotypes for (G–I) are indicated at the bottom of (I). (G) SEM details of representative spikelet meristems. (H) Box-plot of total whole-plant spikelet number at seed-set. (n = 22–53 plants each genotype). Samples with different letters are significantly different from each other (ANOVA, Tukey HSD, p<0.05). See ‘Figure 1H–I Source Data 1’ for source data. (I) Box-plot of the number of florets in each terminal spikelet of the central branch at seed set. (n = 22–53 plants each genotype). Samples with different letters are significantly different from each other (ANOVA, Tukey HSD, p<0.05). See ‘Figure 1H–I Source Data 1’ for source data. (J) Medial confocal Z-section of pZmUbi::DII-Venus (DII) expression in a WT spikelet co-expressing SoPIN1 tagged with Cerulean (a CFP variant) under the native SoPIN1 promoter. Organ primordia are numbered I2, I1, P1 from youngest to oldest. DII is normally degraded at SoPIN1 convergence points in I2 and I1 primordia (asterisks), and in response to auxin treatment (See Figure 1—figure supplement 2). Inset shows color look-up-table for all subsequent PIN images and color look-up-table for DII. (K) Medial confocal Z-section of pZmUbi::DII-Venus expression in a sopin1-1 spikelet meristem. DII degradation does not occur in the periphery of sopin1-1 meristems, and organs fail to initiate (arrow). Scale bars: 100 µm in (B) and (C), 20 µm in (D) and (E), 1 cm in (F), 50 µm each in (G), and 25 µm in (J) and (K).
-
Figure 1—source data 1
Source data for spikelet and floret counts in Figure 1H–I.
- https://doi.org/10.7554/eLife.31804.005
-
Figure 1—source data 2
Source data for DII quantification in Figure 1—figure supplement 2 panel C.
- https://doi.org/10.7554/eLife.31804.006
Figure 1—figure supplement 1
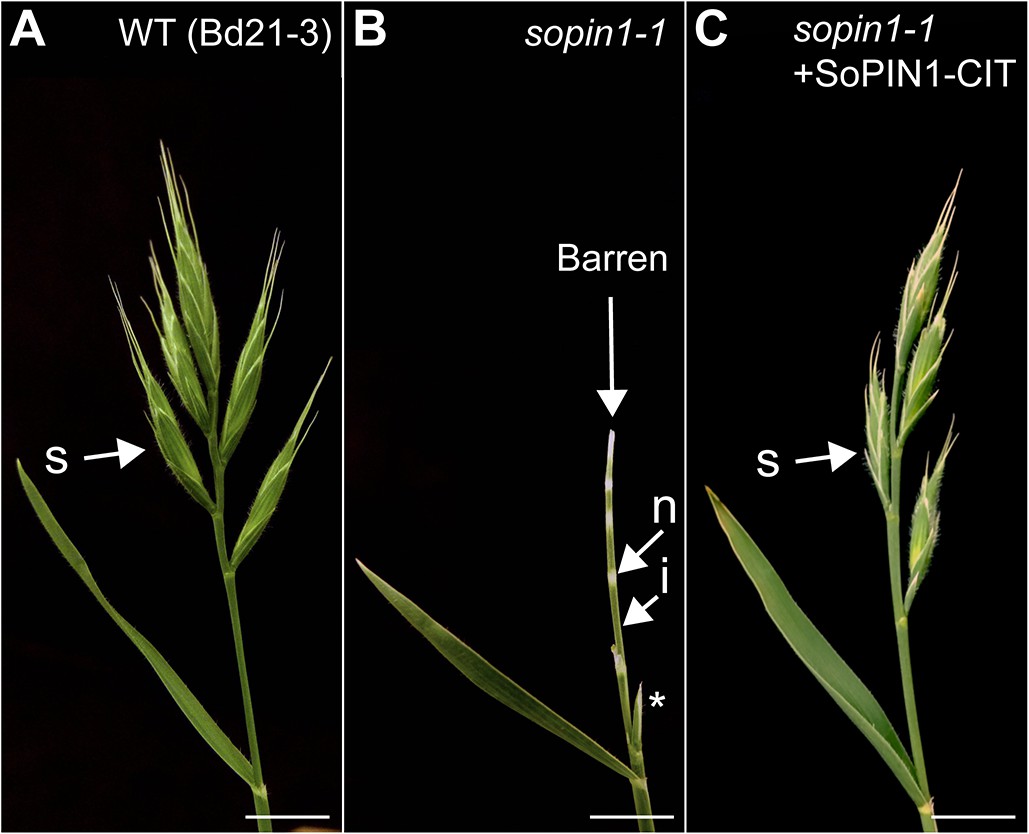
sopin1-1 is complemented by the SoPIN1-CIT reporter.
(A) Wild-type inflorescence (Bd21-3 background) with wild-type mature spikelets (s). (B) sopin1-1 inflorescence with an aborted spikelet (asterisk) and several barren white spikelet nodes (n). Green internode (i) tissue is also labeled. (C) Inflorescence of a sopin1-1 mutant plant complemented by previously published full-length SoPIN1 internal Citrine fluorescent protein fusion under the native SoPIN1 promoter (+SoPIN1 CIT) (O'Connor et al., 2014). (N = 34: 6 sopin1-1 phenotype, 28 wt phenotype) Scale bars: 1 cm.
Figure 1—figure supplement 2
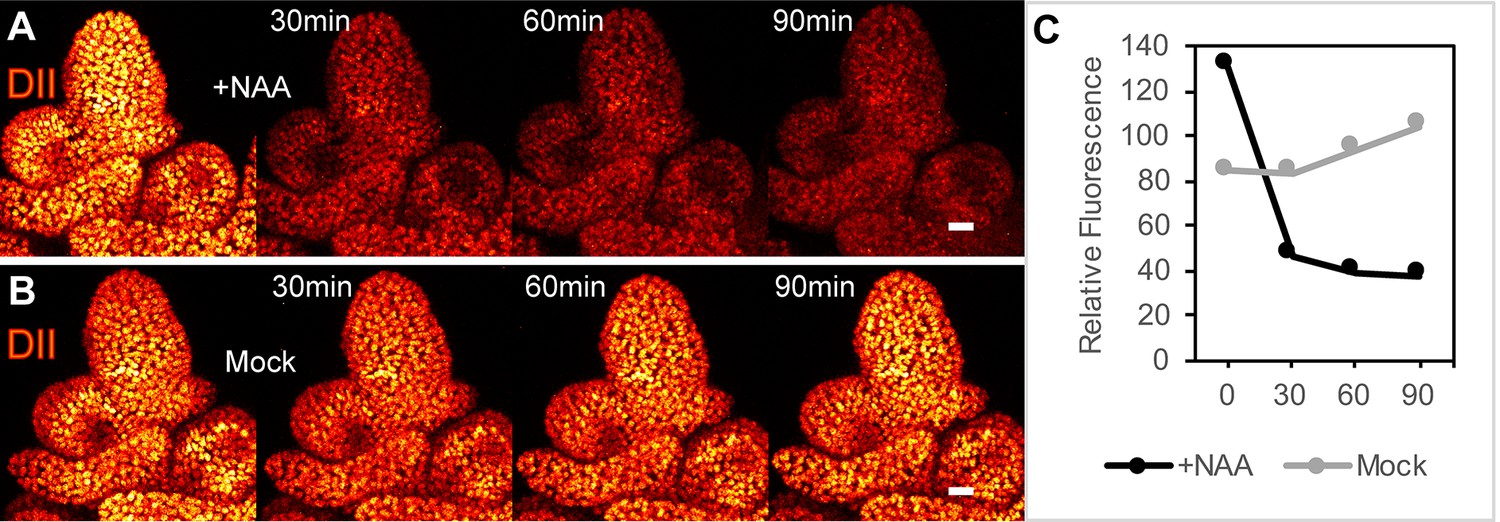
DII-Venus is degraded in the presence of auxin in Brachypodium spikelet meristems.
(A) 1 µM NAA-treated, and (B) mock-treated spikelet meristems expressing pZmUbi::DII-Venus imaged every 30 min after treatment. Images from left to right, pre-treatment expression, 30 min, 60 min and 90 min time-points. (C) Relative mean fluorescence in a radius at the spikelet meristem tip in NAA-treated and Mock samples at 0, 30, 60 and 90 min time points. Scale bars: 25 µm.
Figure 2 with 1 supplement
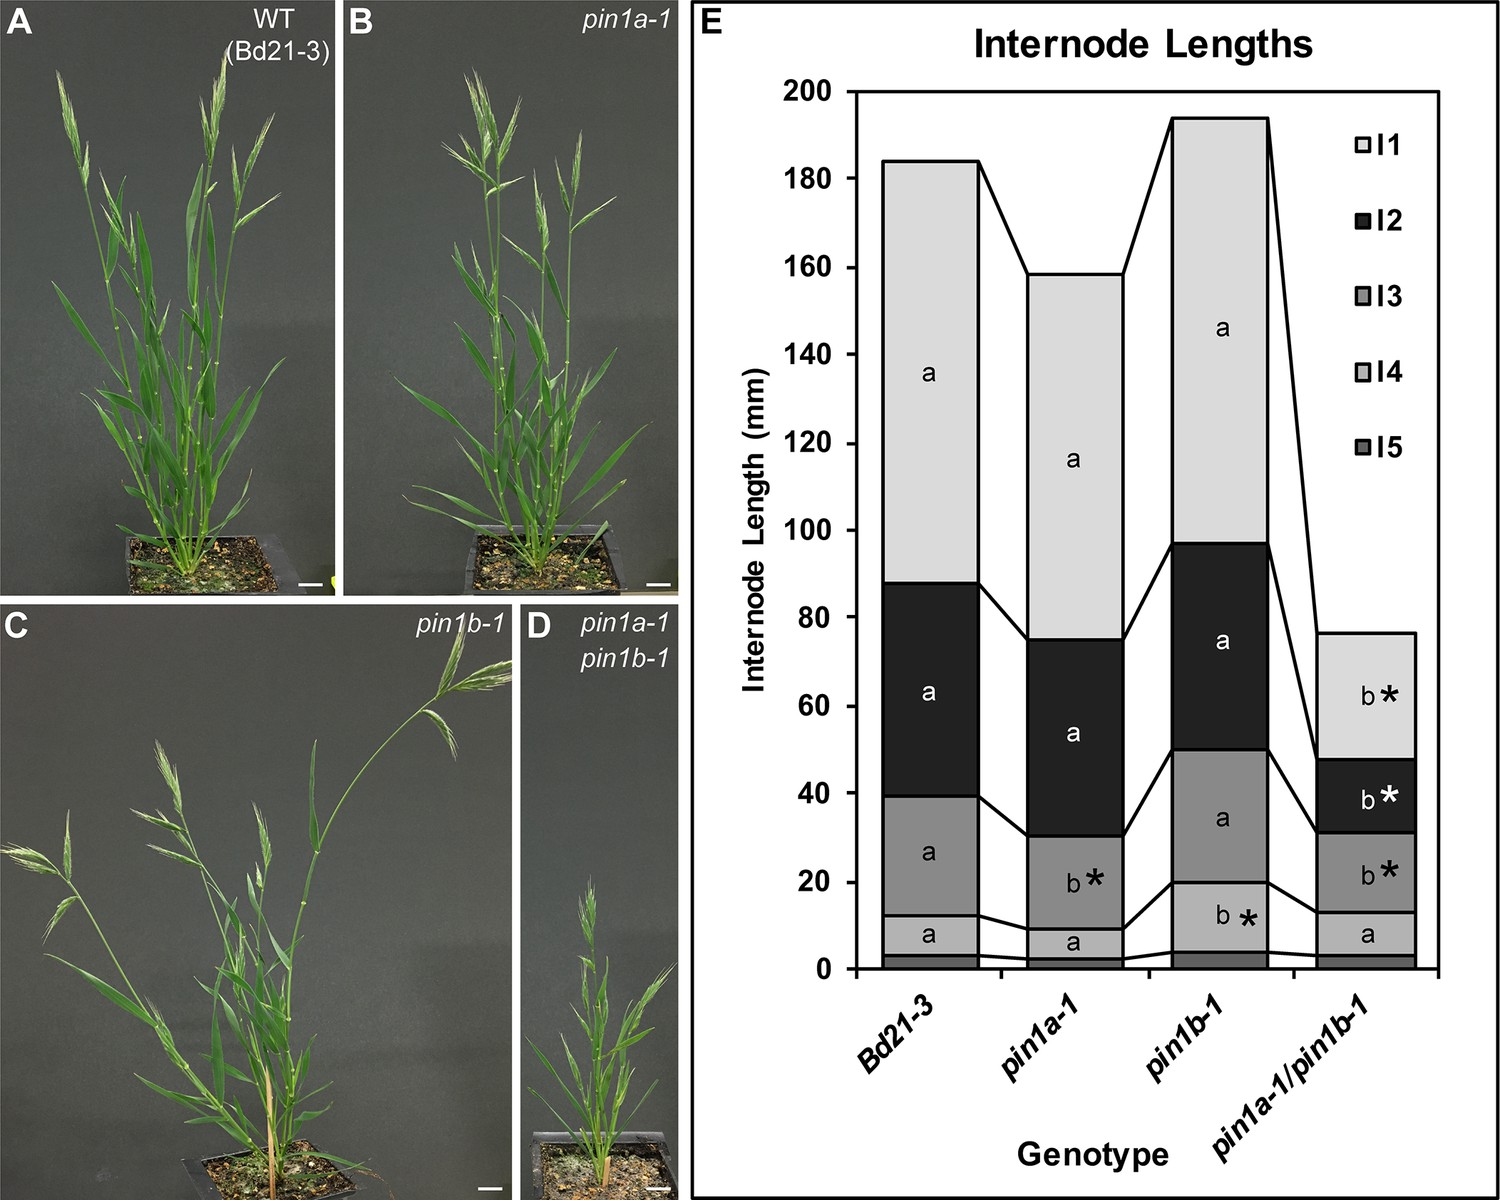
PIN1a and PIN1b redundantly control internode growth in Brachypodium.
(A–D) Whole-plant phenotypes for WT (Bd21-3), pin1a-1, pin1b-1, and double pin1a-1/pin1b-1 mutants. (E) Stacked bar graph of the length of the first 5 internodes below the inflorescence of the main branch, labeled I1-I5 from top to bottom. Lines connect analogous internodes between genotypes. Analogous internodes with different letters are significantly different from each other (ANOVA, Tukey HSD, p<0.05). I5 internodes were not significantly different between genotypes and are unlabeled. Internode lengths significantly different from WT are indicated by asterisks. (n = 18–51 individuals each genotype) See ‘Figure 2—source data 1' for source data. Scale bars: 1 cm in (A–D).
-
Figure 2—source data 1
Source data for internode length measurements in Figure 2E.
- https://doi.org/10.7554/eLife.31804.009
-
Figure 2—source data 2
Source data for PIN1b-CIT-mediated complementation of pin1b-1 internode lengths in Figure 2—figure supplement 1.
- https://doi.org/10.7554/eLife.31804.010
Figure 2—figure supplement 1

PIN1b-CIT-mediated complementation of pin1b-1 internode length defects.
Stacked bar graph of the length of the first 5 internodes below the inflorescence of the main branch, labeled I1-I5 from top to bottom, for pin1b-1 and pin1b-1 containing the previously published full-length PIN1b internal Citrine fluorescent protein fusion under the native PIN1b promoter (+PIN1b-CIT) (O'Connor et al., 2014) (n = 10 each genotype). Lines connect analogous internodes between genotypes. Internodes that are significantly different between genotypes are marked with asterisks. The I4 and I5 internodes are significantly shorter in the complemented line than in pin1b-1 (ANOVA, Tukey HSD, p<0.05). See ‘Figure 2—source data 2” for source data.
Figure 3 with 1 supplement
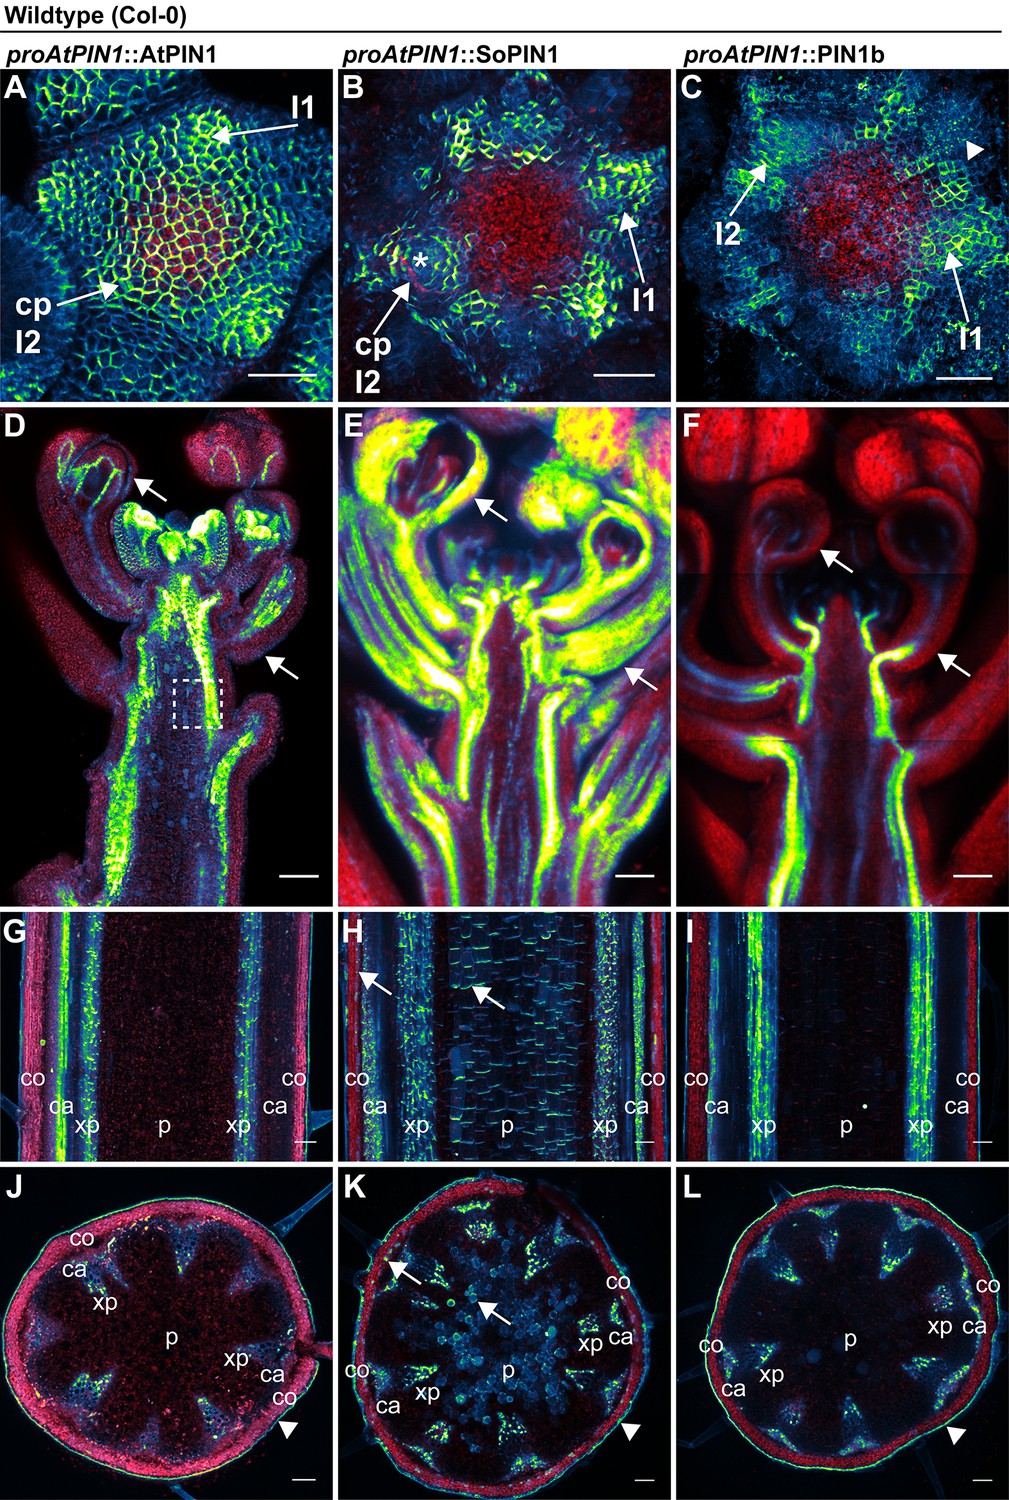
AtPIN1, SoPIN1, and PIN1b show different behaviors when expressed in wild-type Arabidopsis.
Arabidopsis AtPIN1 promoter (proAtPIN1) driven expression of GFP-tagged AtPIN1 and Citrine-tagged (a YFP derivative) SoPIN1 and PIN1b in wild-type Columbia (Col-0) Arabidopsis. (A,D,G,J) AtPIN1, (B,E,H,K) SoPIN1, (C,F,I,L) PIN1b. (A–C) Maximum projections of inflorescence meristem apexes. Arrows in (A) and (B) indicate convergence points (cp) in I2 primordium. Arrowhead in (C) indicates internalized PIN1b in punctate membrane bodies. The I2 and I1 primordia are labeled. (D–F) Tiled confocal maximum projections of longitudinal hand-sections through inflorescence apexes. Arrows indicate SoPIN1 epidermal accumulation in sepal primordia and flower pedicels in (E) and the lack of AtPIN1 and PIN1b epidermal accumulation in the same tissues in (D) and (F). Box in (D) shows detail area in Figure 3—figure supplement 1 panel D. (G–I) Tiled confocal maximum projections of longitudinal hand-sections through mature basal inflorescence stem internodes 1 cm above the rosette. (J–L) Tiled confocal maximum projections of hand cross-sections through basal internodes 1 cm above the rosette. Signal at the edge of each section (arrowheads) is cuticle auto-fluorescence. The cortex (co), cambium (ca), xylem parenchyma (xp), and pith (p) tissues are indicated in (G–L). Arrows in (H) and (K) indicate cortex and pith ectopic accumulation of SoPIN1. Red signal in all panels is chlorophyll auto-florescence. Scale bars: 25 µm in (A–C), and 100 µm in (D–L).
Figure 3—figure supplement 1
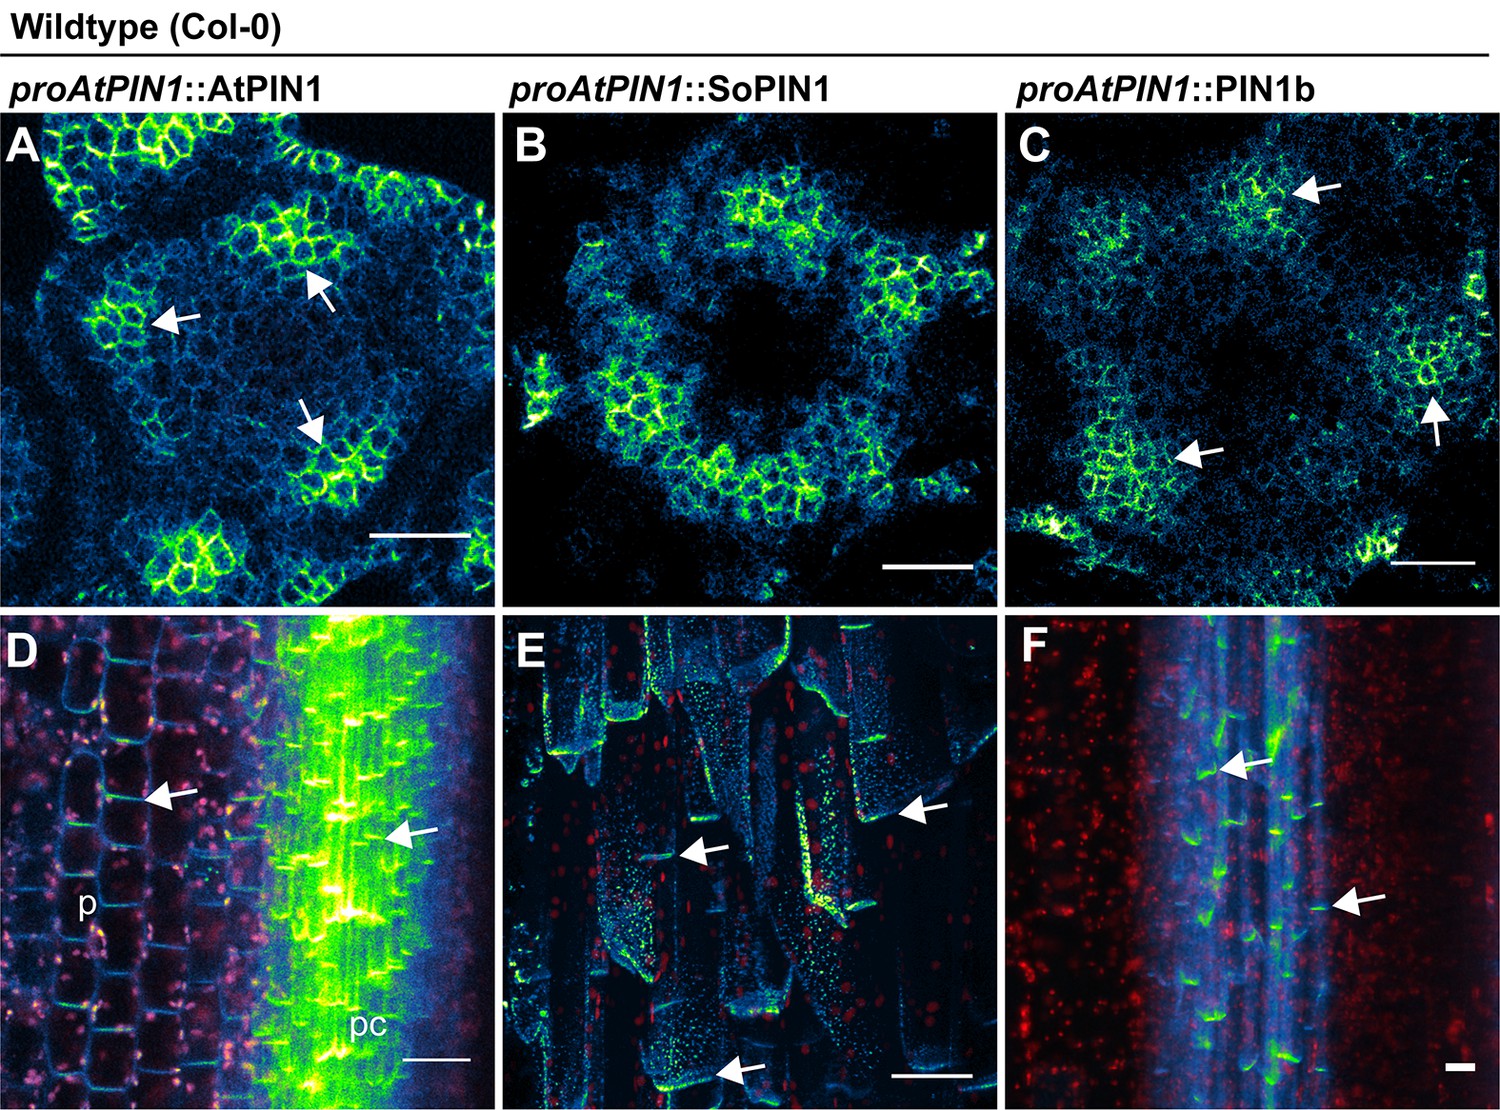
proAtPIN1 AtPIN1, SoPIN1, and PIN1b expression details.
(A) Confocal z-section of AtPIN1 accumulation in vascular-associated domains just below the apex of the meristem shown in Figure 3A. (B) Confocal z-section of SoPIN1 accumulation in a ring-shaped domain just below the apex of the meristem shown in Figure 3B. (C) Confocal z-section of PIN1b accumulation in vascular-associated domains just below the apex of the meristem shown in Figure 3C. (D) Maximum projection detail of AtPIN1 accumulation in both pith (p) and procambium (pc) tissues in the immature inflorescence stem outlined with a box in Figure 3D. (E) Maximum projection detail of rootward polarized SoPIN1 (arrows) in a longitudinal hand-section of the basal internode pith tissue. (F) Maximum projection detail of rootward polarized PIN1b (arrows) in a longitudinal hand-section of the basal internode xylem parenchyma tissue. Red signal in (D–F) is chlorophyll auto-florescence. Scale bars: 25 µm.
Figure 4 with 2 supplements
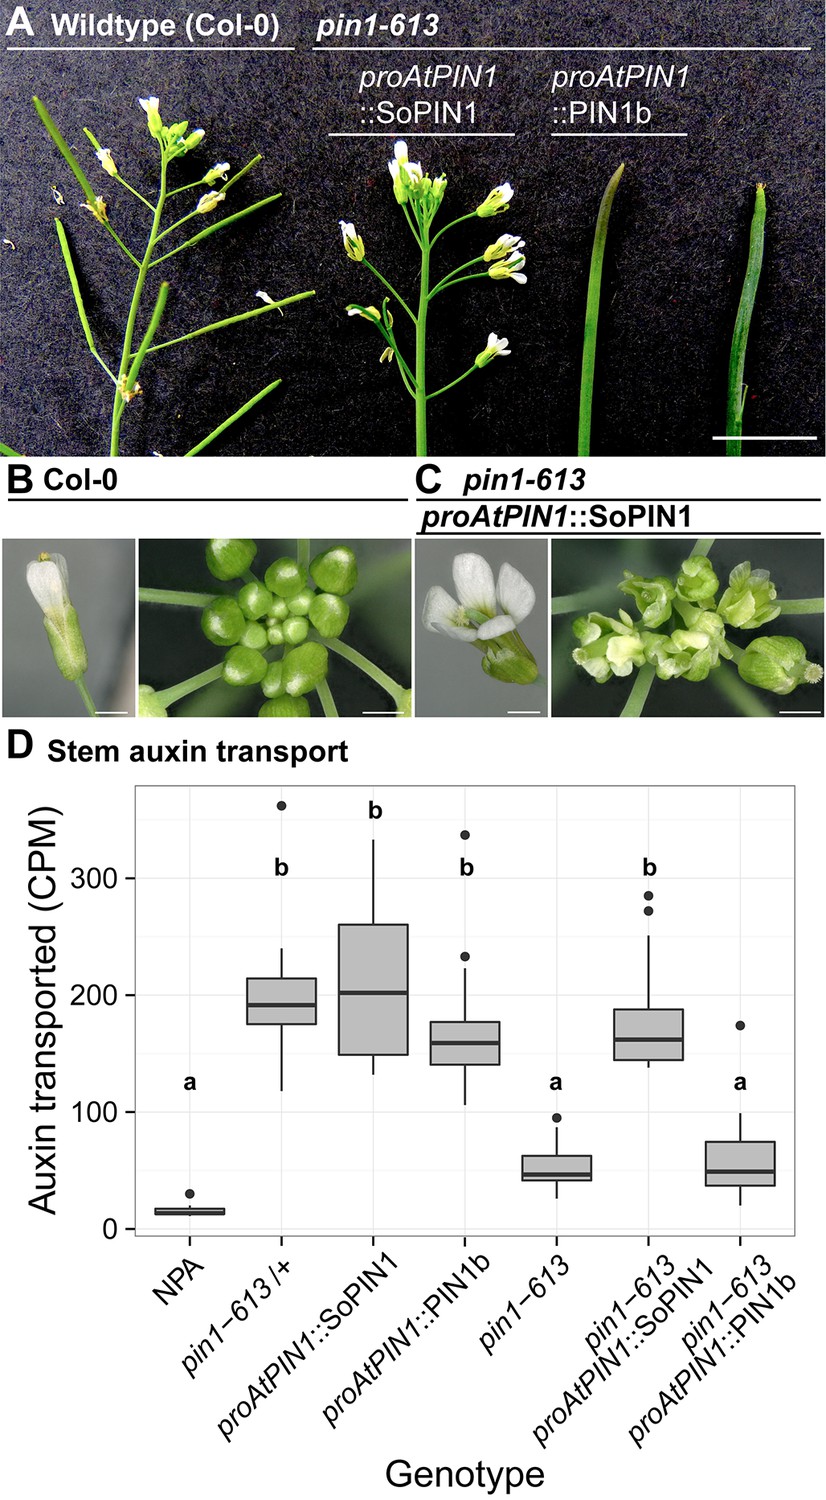
SoPIN1 but not PIN1b can partially complement the Arabidopsis pin1-613 mutant organ initiation and bulk transport defects.
(A) From left to right, inflorescence phenotypes of WT (Col-0), proAtPIN1::SoPIN1 in pin1-613, proAtPIN1::PIN1b in pin1-613, and pin1-613 alone. Note that PIN1b-expressing pin1-613 plants are indistinguishable from pin1-613 alone. See Figure 4—figure supplement 1 for whole-plant phenotypes. (B) Flower (left), and inflorescence apex (right) of WT (Col-0). (C) Flower (left), and inflorescence apex (right) of proAtPIN1::SoPIN1 complemented pin1-613 mutants. Note the increase in petal number and lack of stamens in the flower, see Figure 4—figure supplement 2 for organ counts. (D) Box-plot of bulk auxin transport (counts per minute, CPM) through basal internodes 1 cm above the rosette of 40-day-old Arabidopsis inflorescence stems. (n = 16 each genotype). Samples with different letters are significantly different from each other (ANOVA, Tukey HSD, p<0.05). See Figure 4—source data 1 for source data. Scale bars: 1 cm in (A), 1 mm in (B–C).
-
Figure 4—source data 1
Source data for Figure 4D auxin transport assays.
- https://doi.org/10.7554/eLife.31804.016
-
Figure 4—source data 2
Source data for Figure 4—figure supplement 2 floral organ numbers.
- https://doi.org/10.7554/eLife.31804.017
Figure 4—figure supplement 1

Whole-plant phenotypes of proAtPIN1-driven complementation of pin1-613.
From left to right, Col-0 (WT), proAtPIN1::SoPIN1 complemented pin1-613, proAtPIN1::PIN1b expressing pin1-613, and pin1-613 alone. Scale bar: 1 cm.
Figure 4—figure supplement 2

Floral organ number in proAtPIN1::SoPIN1 complemented flowers.
Mean and standard-error of sepal, petal, stamen and carpel organ numbers in heterozygous pin1-613 or wild-type (white bars) and proAtPIN1::SoPIN1-complemented pin1-613 flowers (grey bars) (n = 30). See Figure 4—source data 2 for source data.
Figure 5 with 2 supplements

SoPIN1 and PIN1b localization in null pin1-613 mutants.
Arabidopsis PIN1 promoter (proAtPIN1) driven expression of Citrine-tagged (YFP derivative) SoPIN1 and PIN1b in null pin1-613 mutant tissue. (A,C,E,G,I) SoPIN1, (B,D,F,H,J,K,L,M) PIN1b. (A–B) Maximum projections of inflorescence meristem apexes. Arrow in (B) indicates PIN1b ring shaped epidermal domain. See Figure 5—figure supplement 1 for SoPIN1 expression in a pin1-613 segregating family. See Figure 5—figure supplement 2 for more examples of PIN1b expression in pin1-613 apexes. (C–D) Tiled confocal maximum projections of longitudinal hand-sections through inflorescence apexes. Arrow in (D) indicates increased PIN1b in the epidermis in the pin1-613 background. (E–F) Tiled maximum projections of longitudinal hand-sections through mature basal inflorescence stem internodes 1 cm above the rosette. (G–H) Tiled maximum projections of hand cross-sections through mature basal internodes 1 cm above the rosette. Signal at the edge of each section (arrowheads) is cuticle auto-florescence. The cortex (co), cambium (ca), xylem parenchyma (xp), and pith (p) tissues are indicated in (E–H). Arrows in (E) and (G) indicate cortex and pith accumulation of SoPIN1. (I) Confocal z-section of SoPIN1 accumulation in a ring-shaped domain just below the apex of a complemented pin1-613 meristem. (J) Longitudinal hand-section of PIN1b just below a pin1-613 meristem apex. Arrow shows rootward polarized PIN1b. (K) Detail of polarized PIN1b in the meristem epidermis of a pin1-613 meristem apex. (L) Cross-section of PIN1b (arrow) in distinct bundles 2 mm below a pin1-613 meristem apex. (M) Rootward polarization of PIN1b (arrow) 3–4 mm below the apex of a pin1-613 meristem. Red signal in all panels is chlorophyll auto-florescence. Scale bars: 25 µm in (A–B), 100 µm in (C–H), and 25 µm in (I–M).
Figure 5—figure supplement 1
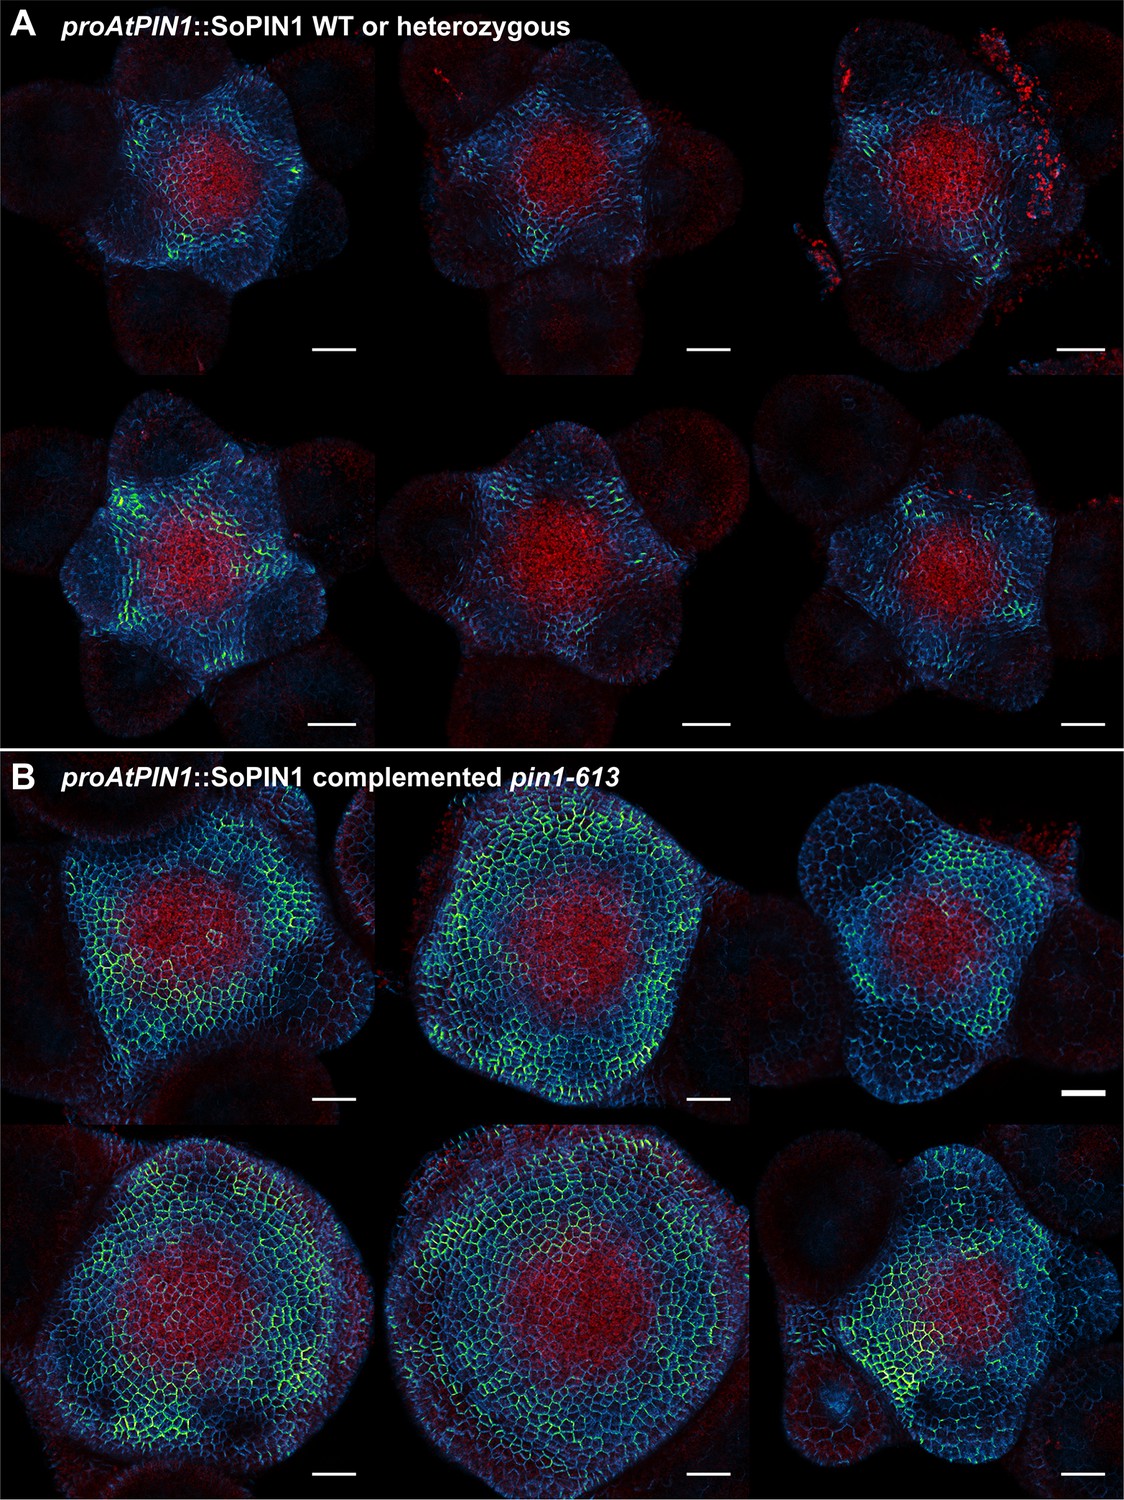
proAtPIN1::SoPIN1 expression in pin1-613 segregating family.
(A) proAtPIN1::SoPIN1 expression in 6 different WT or heterozygous pin1-613 meristem samples. (B) proAtPIN1::SoPIN1 expression in 6 different complemented pin1-613 meristems. All samples were imaged with identical settings to show the increase in SoPIN1 accumulation in the pin1-613 mutant background. Red signal is chlorophyll auto-florescence. Scale bars: 25 µm.
Figure 5—figure supplement 2
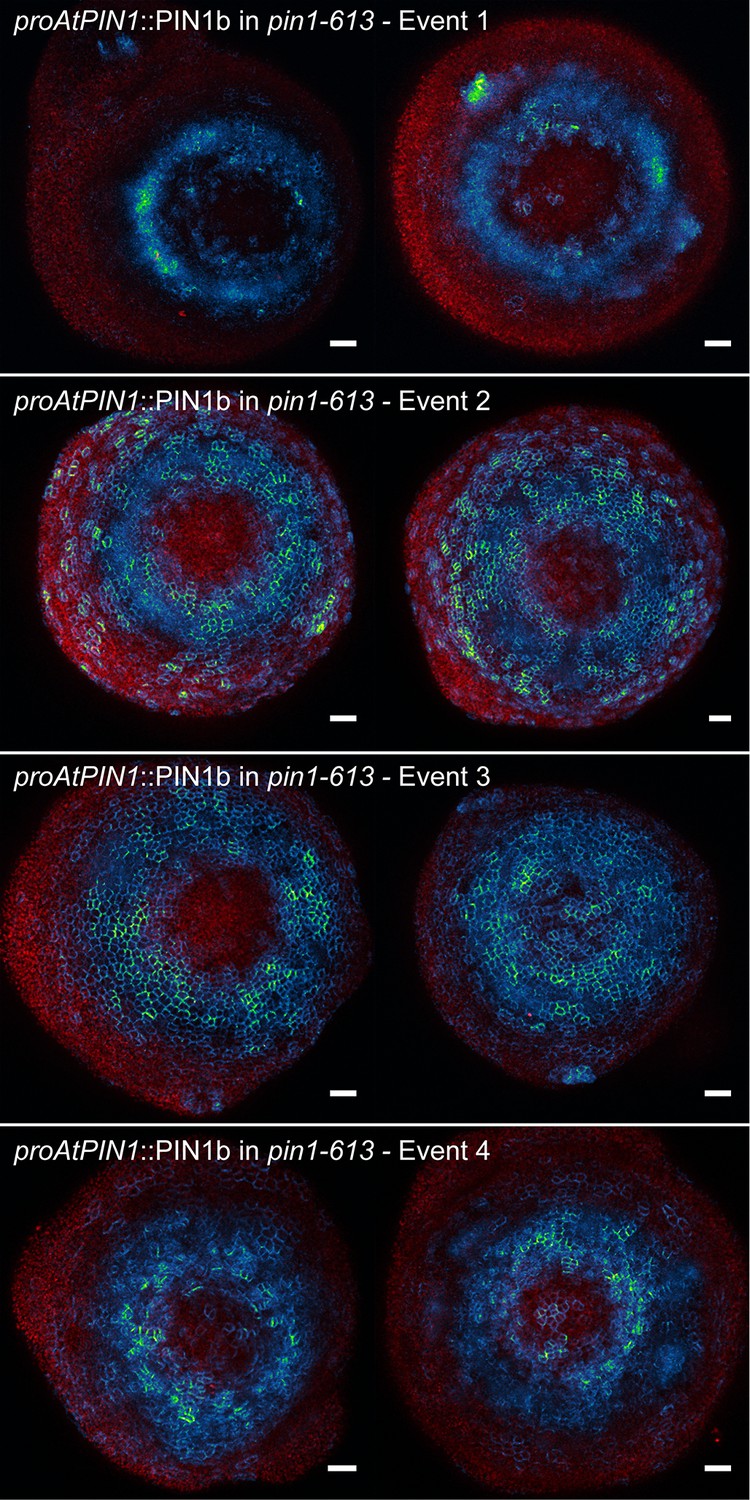
proAtPIN1::PIN1b expression in pin1-613 apexes.
Two representative meristems each from four different transgenic events. All samples were imaged with identical settings. Scale bars: 25 µm.
Figure 6 with 3 supplements
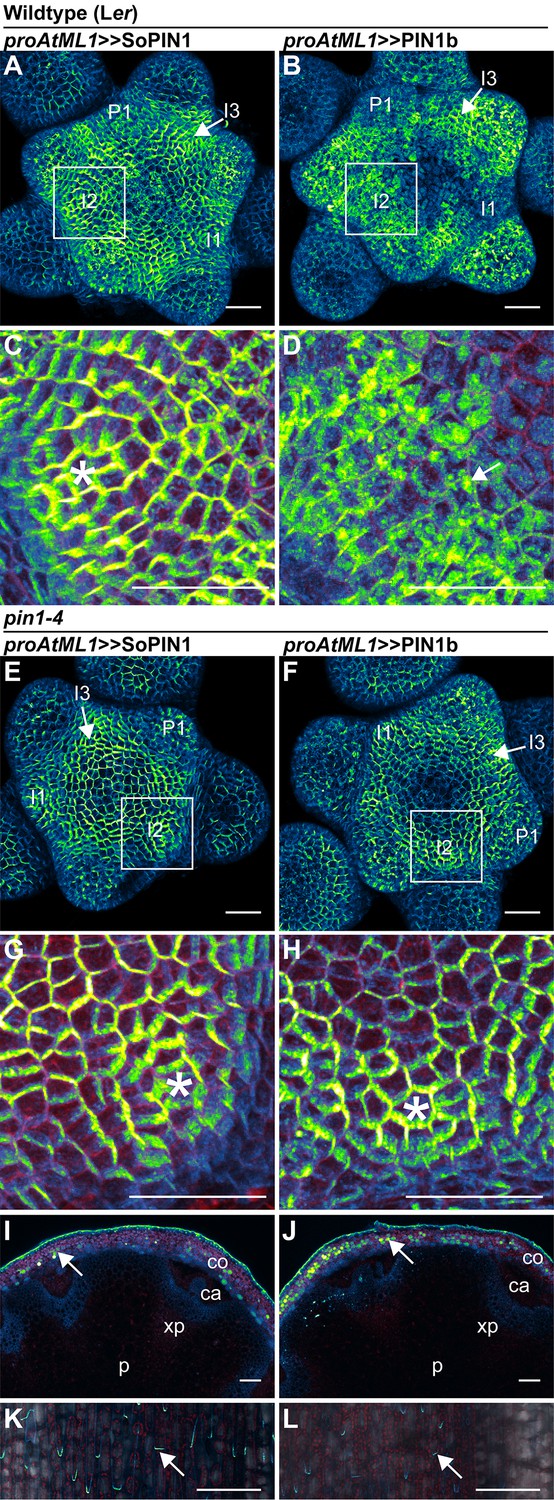
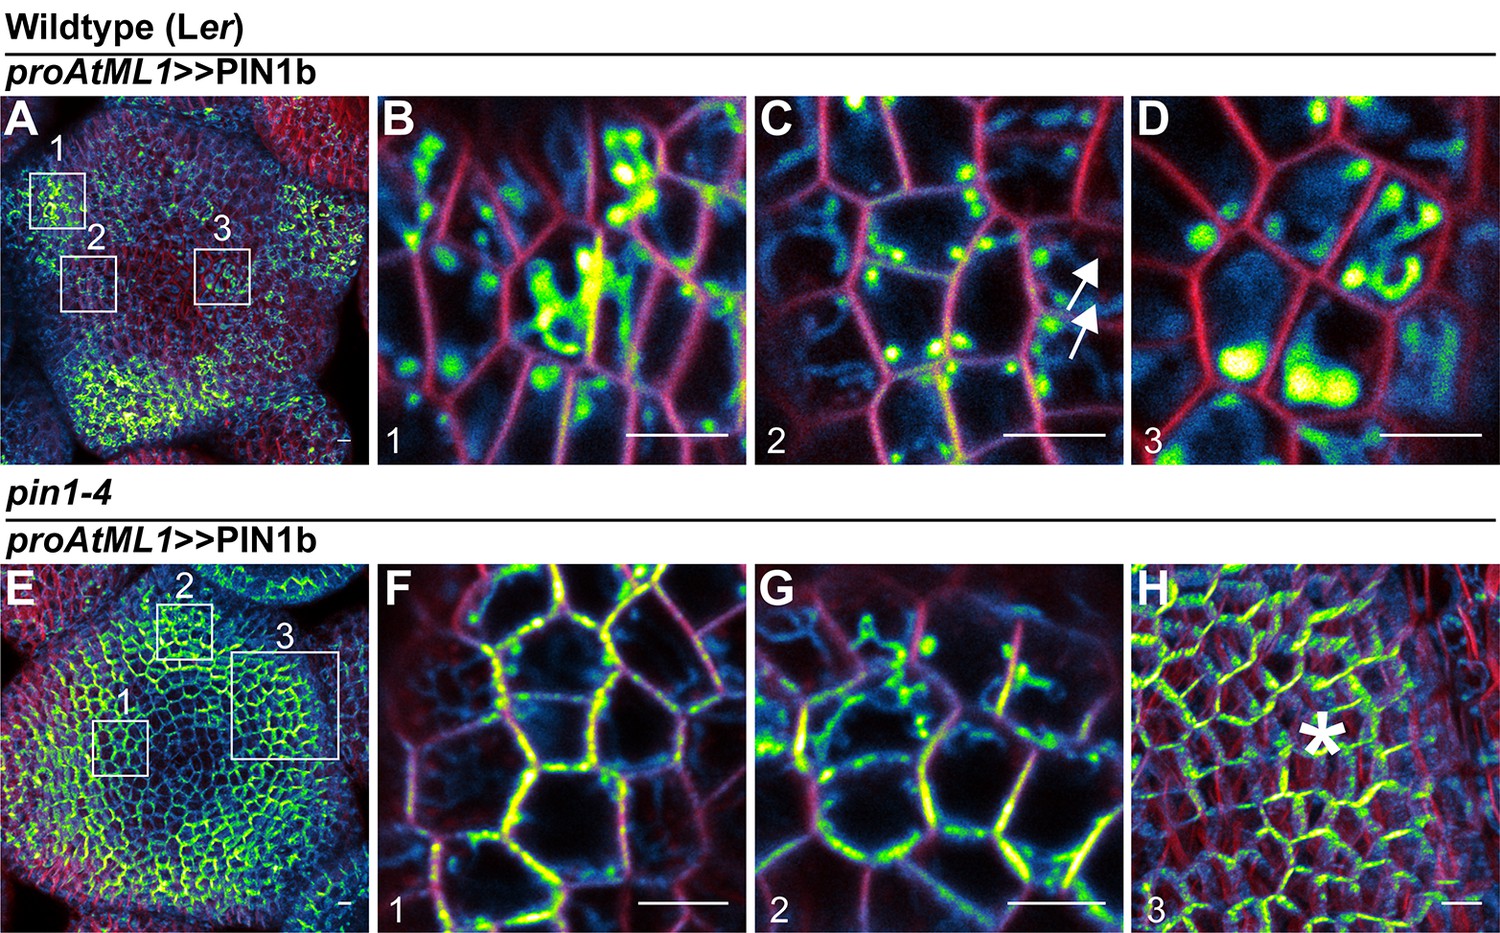
SoPIN1 and PIN1b show different behaviors under proAtML1-driven expression.
Maximum projections of proAtML1::LhG4 driving pOP::SoPIN1 or pOP::PIN1b (proAtML1 >>SoPIN1 and proAtML1 >>PIN1b) in wild-type Landsberg erecta (Ler) (A–D), and pin1-4 (E–L) inflorescence meristems and mature basal internodes. (A) SoPIN1 and (B) PIN1b maximum projections of wild-type Ler inflorescence meristems. I3, I2, I1, and P1 primordia are indicated. White boxes around each I2 primordium indicate the regions detailed in (C–D). Asterisk in (C) indicates convergence point. Arrow in (D) indicates punctate PIN1b. (E) SoPIN1 and (F) PIN1b maximum projections of complemented pin1-4 inflorescence meristems. I3, I2, I1, and P1 primordia are indicated. White boxes around each I2 primordia indicate the regions detailed in (G–H). Asterisks mark convergence points in (G) and (H). Red signal in (C,D,G,H) is cell wall propidium iodide staining. See Figure 6—figure supplement 1 for additional samples of proAtML1 >>SoPIN1 and Figure 6—figure supplement 2 for additional samples of proAtML1 >>PIN1b in both WT and pin1-4 meristems. See Figure 6—figure supplement 3 for details of PIN1b epidermal intracellular localization in WT and pin1-4 meristem apexes. (I–J) Tiled maximum projections of cross hand-sections of mature basal internodes of SoPIN1 (I) and PIN1b (J) -complemented pin1-4 plants showing PIN signal in the outer cortex layers (arrows). The cortex (co), cambium (ca), xylem parenchyma (xp), and pith (p) tissues are indicated. Red signal in (I–J) is chlorophyll auto-florescence. (K–L) Epidermal maximum projections showing rootward polarized PIN localization (arrows) in the basal internode of SoPIN1 (K), and PIN1b (L) -complemented pin1-4 plants. Scale bars: 25 µm in (A–H). 100 µm in (I–L).
Figure 6—figure supplement 1
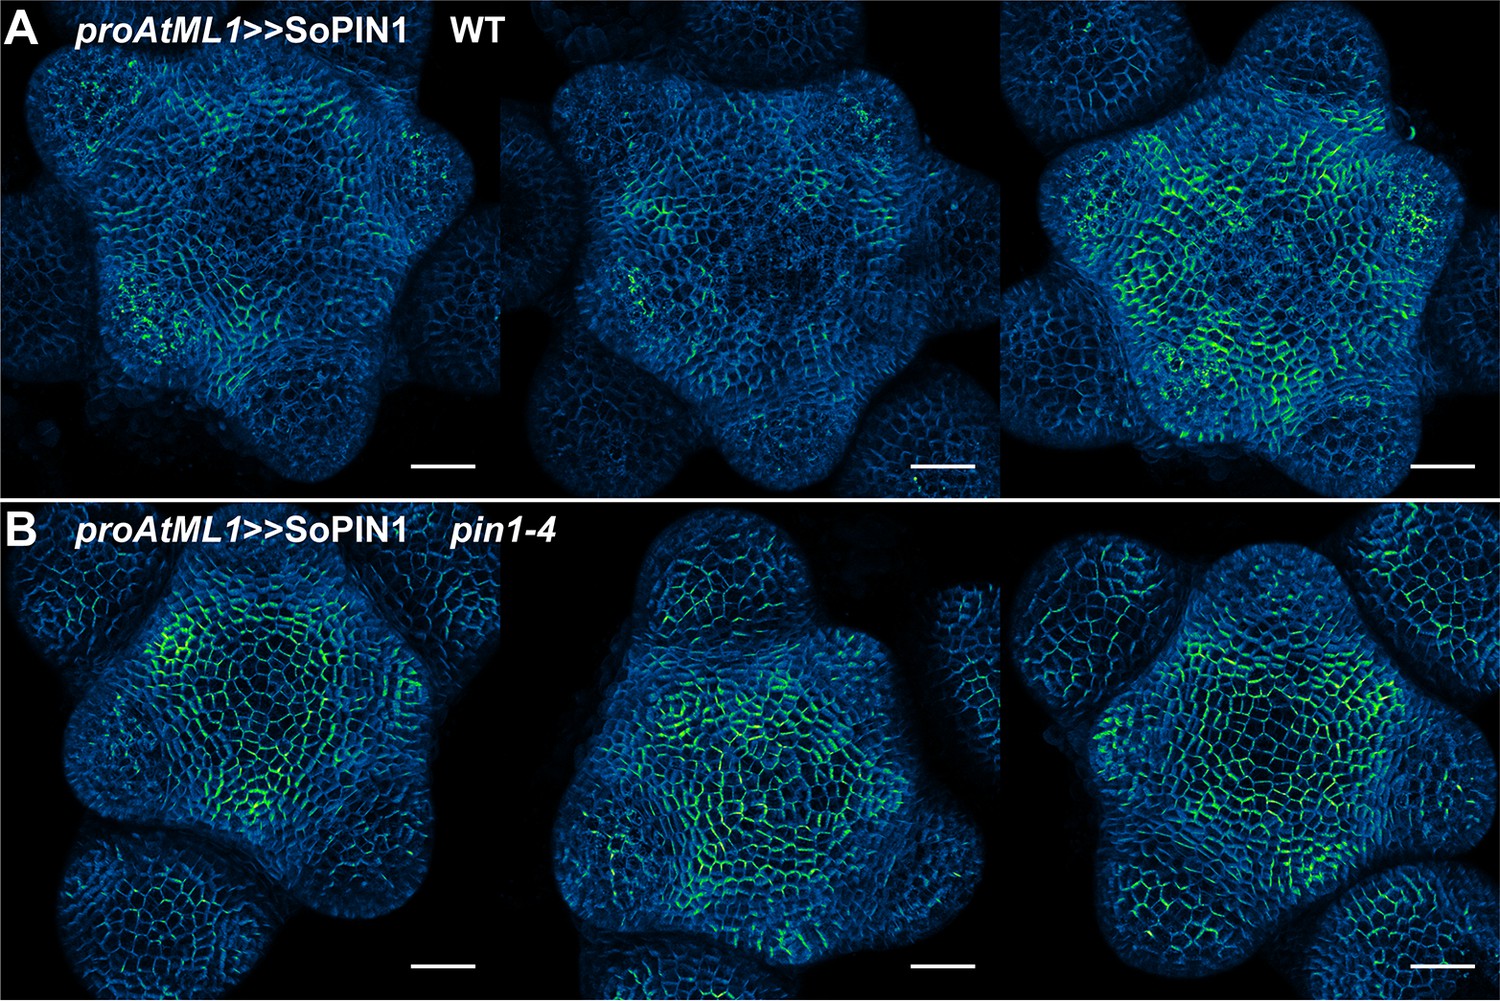
proAtML1 >>SoPIN1 representative meristem maximum projections.
(A) proAtML1 >>SoPIN1 expression in three different wild-type Ler meristems. (B) proAtML1 >>SoPIN1 expression in three different complemented pin1-4 meristems. Capture settings are identical in all samples. Scale bars: 25 µm.
Figure 6—figure supplement 2
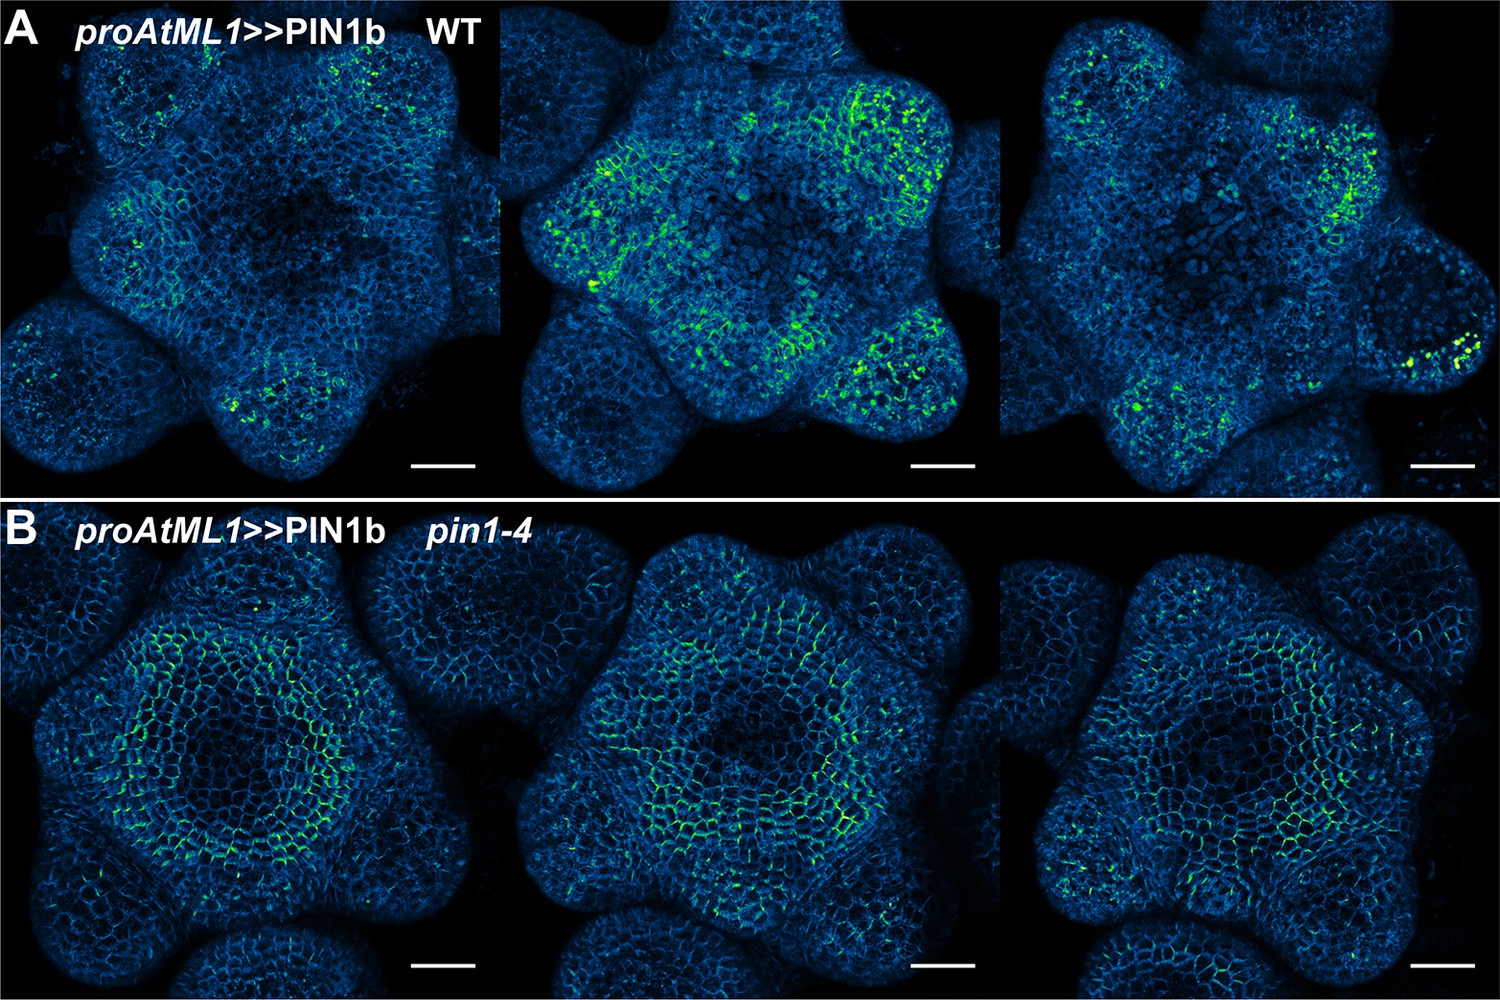
proAtML1 >>PIN1b representative meristem maximum projections.
(A) proAtML1 >>PIN1b expression in three different wild-type Ler meristems. (B) proAtML1 >>PIN1b expression in three different complemented pin1-4 meristems. Capture settings are identical in all samples. Scale bars: 25 µm.
Figure 6—figure supplement 3
Subcellular localization of PIN1b in wild-type (Ler) and pin1-4 meristems.
(A) Wild-type (Ler) meristem expressing proAtML1 >>PIN1b. Boxes numbered 1–3 indicate the positions of detail images in (B–D). (B) Organ boundary. (C) Incipient organ. (D) Meristem apex. (E) pin1-4 meristem complemented by proAtML1 >>PIN1b. Boxes numbered 1–3 indicate the positions of detail images in (F–H). (F) Meristem apex. (G) Organ boundary. (H) Convergence point, indicated by asterisk. Red signal is FM4-64 vital stain. Scale bars: 5 µm.
Figure 7
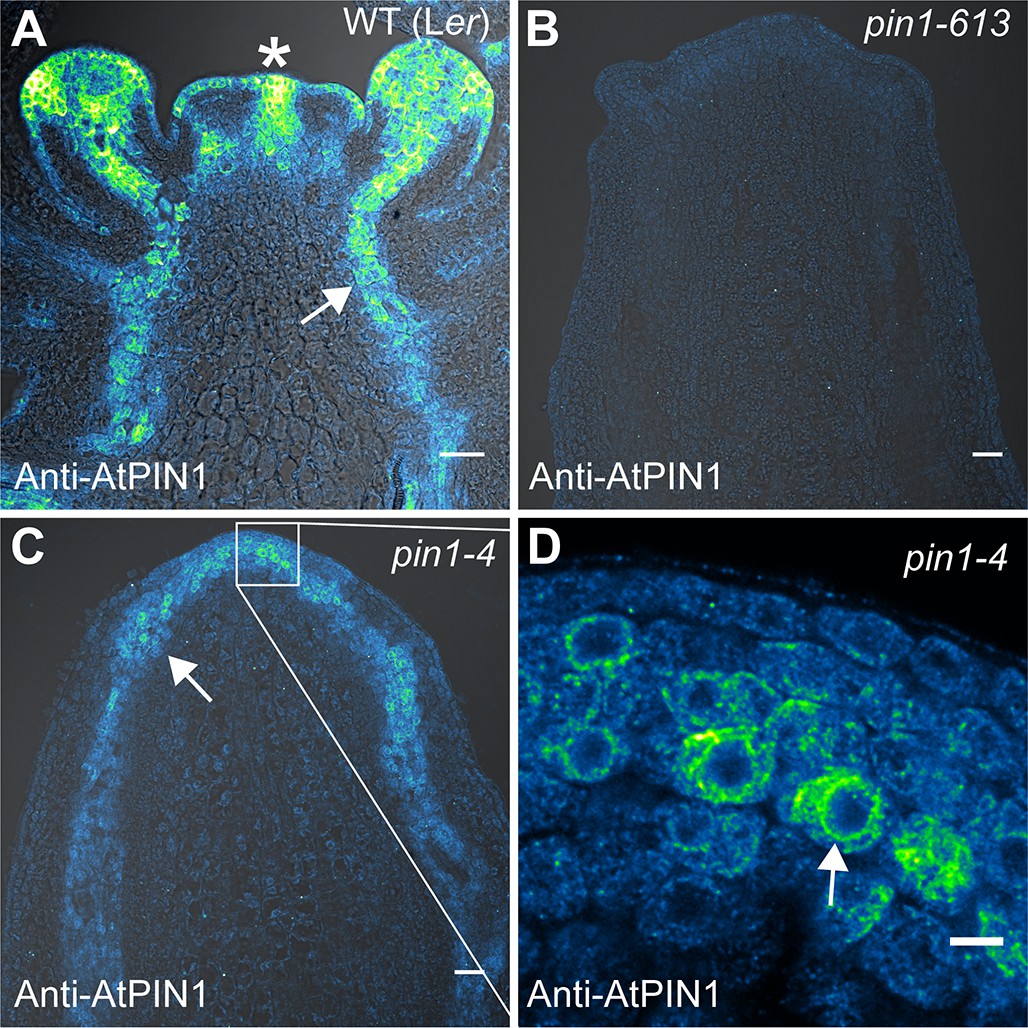
AtPIN1 protein immuno-localization in wild-type, pin1-613, and pin1-4 meristems.
(A) AtPIN1 protein accumulation in wild-type Ler inflorescence apex shows polar PIN protein at the sites of initiating organs (asterisk), and during vein patterning below the apex (arrow). (B) No AtPIN1 protein is detected in pin1-613 null mutant pin-formed apexes. (C) Abundant AtPIN1 protein is detected in pin1-4 pin-formed apexes, primarily in provascular tissues below the meristem apex (arrow). Box shows region of detail in (D). (D) Detail of boxed area shown in (C). AtPIN1 protein in pin1-4 accumulates in a perinuclear domain (arrow). All samples are 9 µm longitudinal sections. Scale bars: 25 µm in A-C, and 5 µm in D.
Figure 8 with 1 supplement
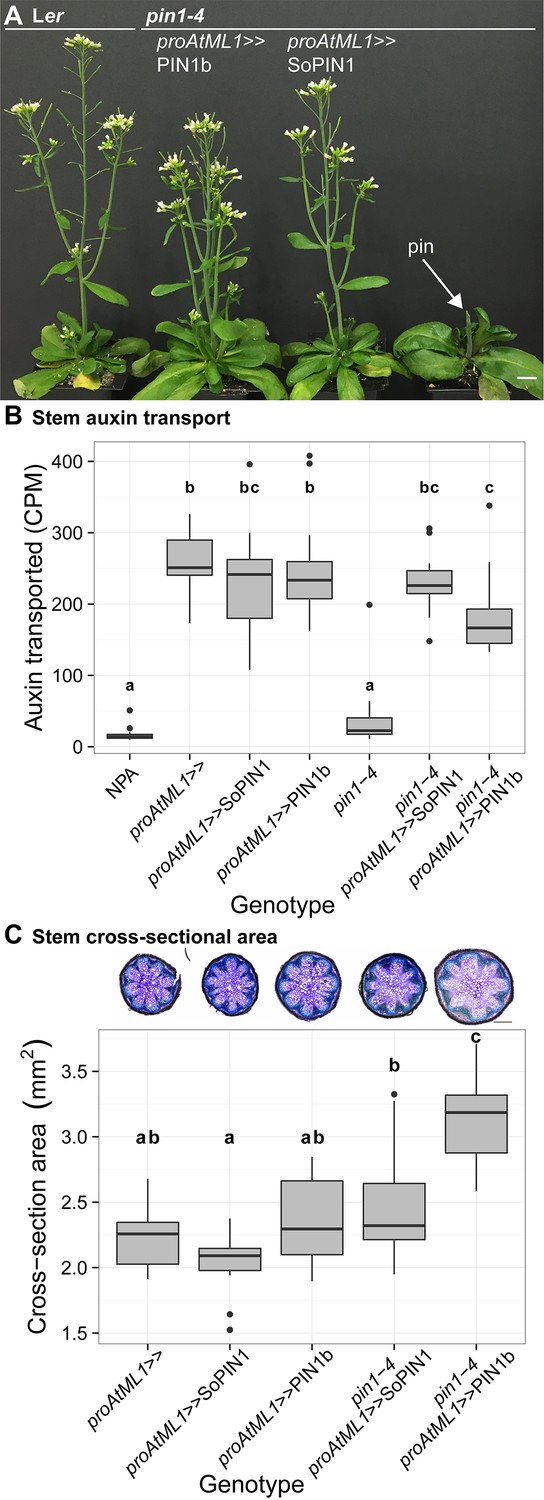
Both SoPIN1 and PIN1b can complement Arabidopsis pin1-4 under proAtML1-driven expression.
(A) From left to right, wild-type Ler, proAtML1 >>PIN1b complemented pin1-4, proAtML1 >>SoPIN1 complemented pin1-4, and pin1-4 alone. Arrow indicates barren pin inflorescence in pin1-4. See Figure 8—figure supplement 1 for inflorescence phenotypes. (B) Box-plot of bulk auxin transport (counts per minute, CPM) through basal internodes 1 cm above the rosette of 40-day-old Arabidopsis inflorescence stems (n = 16 each genotype). Samples with different letters are significantly different from each other (ANOVA, Tukey HSD, p<0.05). See Figure 8—source data 1 for source data. (C) Box-plot of stem cross-sectional area (square mm) of the mature basal internode 1 cm above the rosette (n = 12 each genotype). Samples with different letters are significantly different from each other. (ANOVA, Tukey HSD, p<0.05). See Figure 8—source data 2 for source data. Representative Toluidine Blue O stained hand cross-sections are shown above each box for each genotype. Scale bars: 1 cm in (A). 500 µm in (C).
-
Figure 8—source data 1
Source data for Figure 8B auxin transport assays.
- https://doi.org/10.7554/eLife.31804.028
-
Figure 8—source data 2
Source data for Figure 8C stem cross-sectional area measurements.
- https://doi.org/10.7554/eLife.31804.029
Figure 8—figure supplement 1
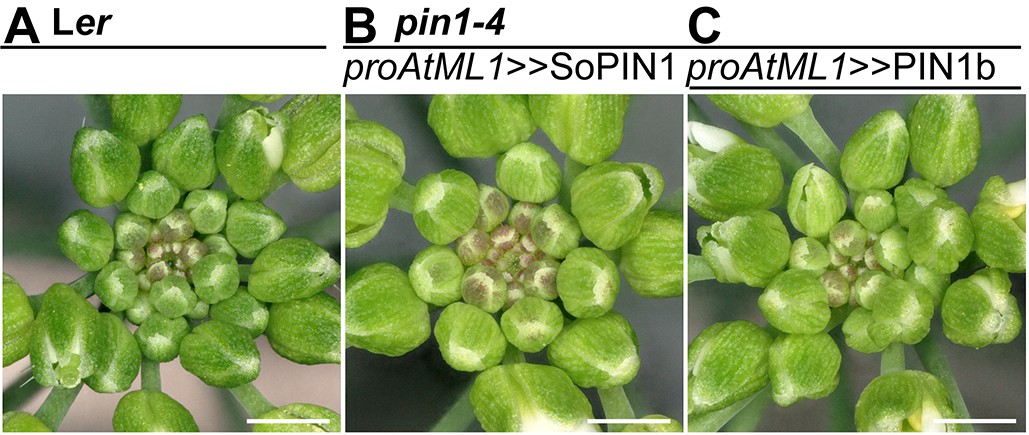
proAtML1 >>SoPIN1 and proAtML1 >>PIN1b complemented pin1-4 inflorescence phenotypes.
(A) Wild-type Ler, (B) proAtML1 >>SoPIN1 complemented pin1-4, and (C) proAtML1 >>PIN1b complemented pin1-4 inflorescence apexes. Scale bars: 1 mm.
Figure 9 with 1 supplement
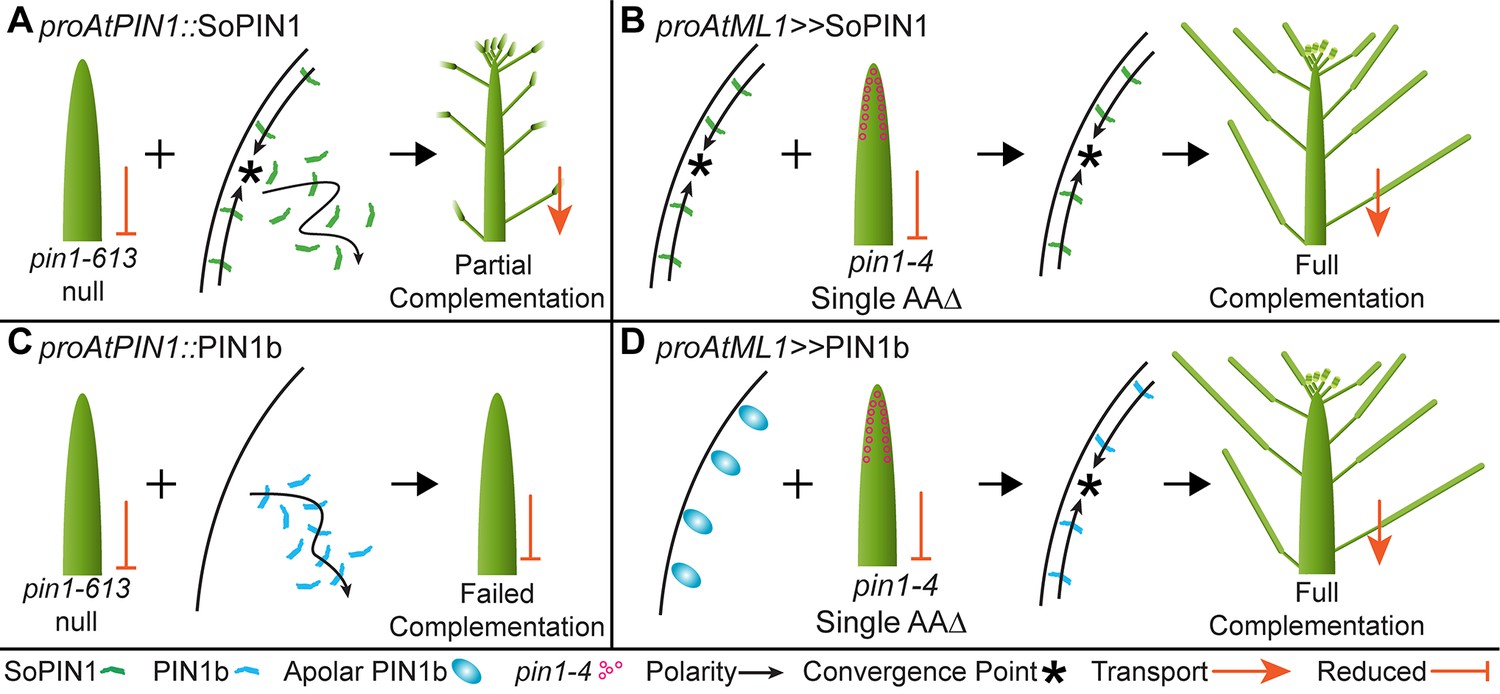
Heterologous expression visual summary: Functional distinction between PIN auxin efflux proteins during development.
Polarized SoPIN1 is represented by green lines, polarized PIN1b by blue lines, un-polarized PIN1b by blue ovals, and the putative partially functional pin1-4 protein is indicated by magenta circles. Red arrows indicate measured auxin transport in the mature basal internode, while red bar-headed lines indicated reduced transport. Black arrows represent polarized PIN patterns. Convergence points are marked with asterisks. (A) When expressed in both the epidermis and internal tissues with proAtPIN1 in wild-type Col-0, SoPIN1 forms convergent polarization patterns in the epidermis and is partially able to rescue the organ initiation phenotypes and bulk transport in null pin1-613 mutants. (B) When SoPIN1 is expressed in the epidermis from the proAtML1 promoter, it forms convergence points in the wild-type Ler background and is able to rescue more fully the organ initiation phenotypes of the pin1-4 single amino acid change mutation. (C) In contrast, when PIN1b is expressed in both the epidermis and internal tissues from the proAtPIN1 promoter in wild-type Col-0, it accumulates mostly in the internal tissues, and is unable to complement the pin1-613 organ initiation phenotype. It is also unable to transport auxin through mature stem segments, despite apparently AtPIN1-like accumulation and polarization in the stem. (D) When PIN1b is expressed in the epidermis from the proAtML1 promoter it does not form convergent polarization patterns and is often un-polarized in the wild-type Ler background (blue ovals), but it does in the pin1-4 background, where it is able to rescue the defective organ initiation phenotype and mediate bulk transport. See Figure 9—figure supplement 1 for a protein alignment comparing AtPIN1 to other PIN1-clade protein sequences from diverse angiosperms.
-
Figure 9—source data 1
FASTA alignment source data for Figure 9—figure supplement 1.
- https://doi.org/10.7554/eLife.31804.032
Figure 9—figure supplement 1
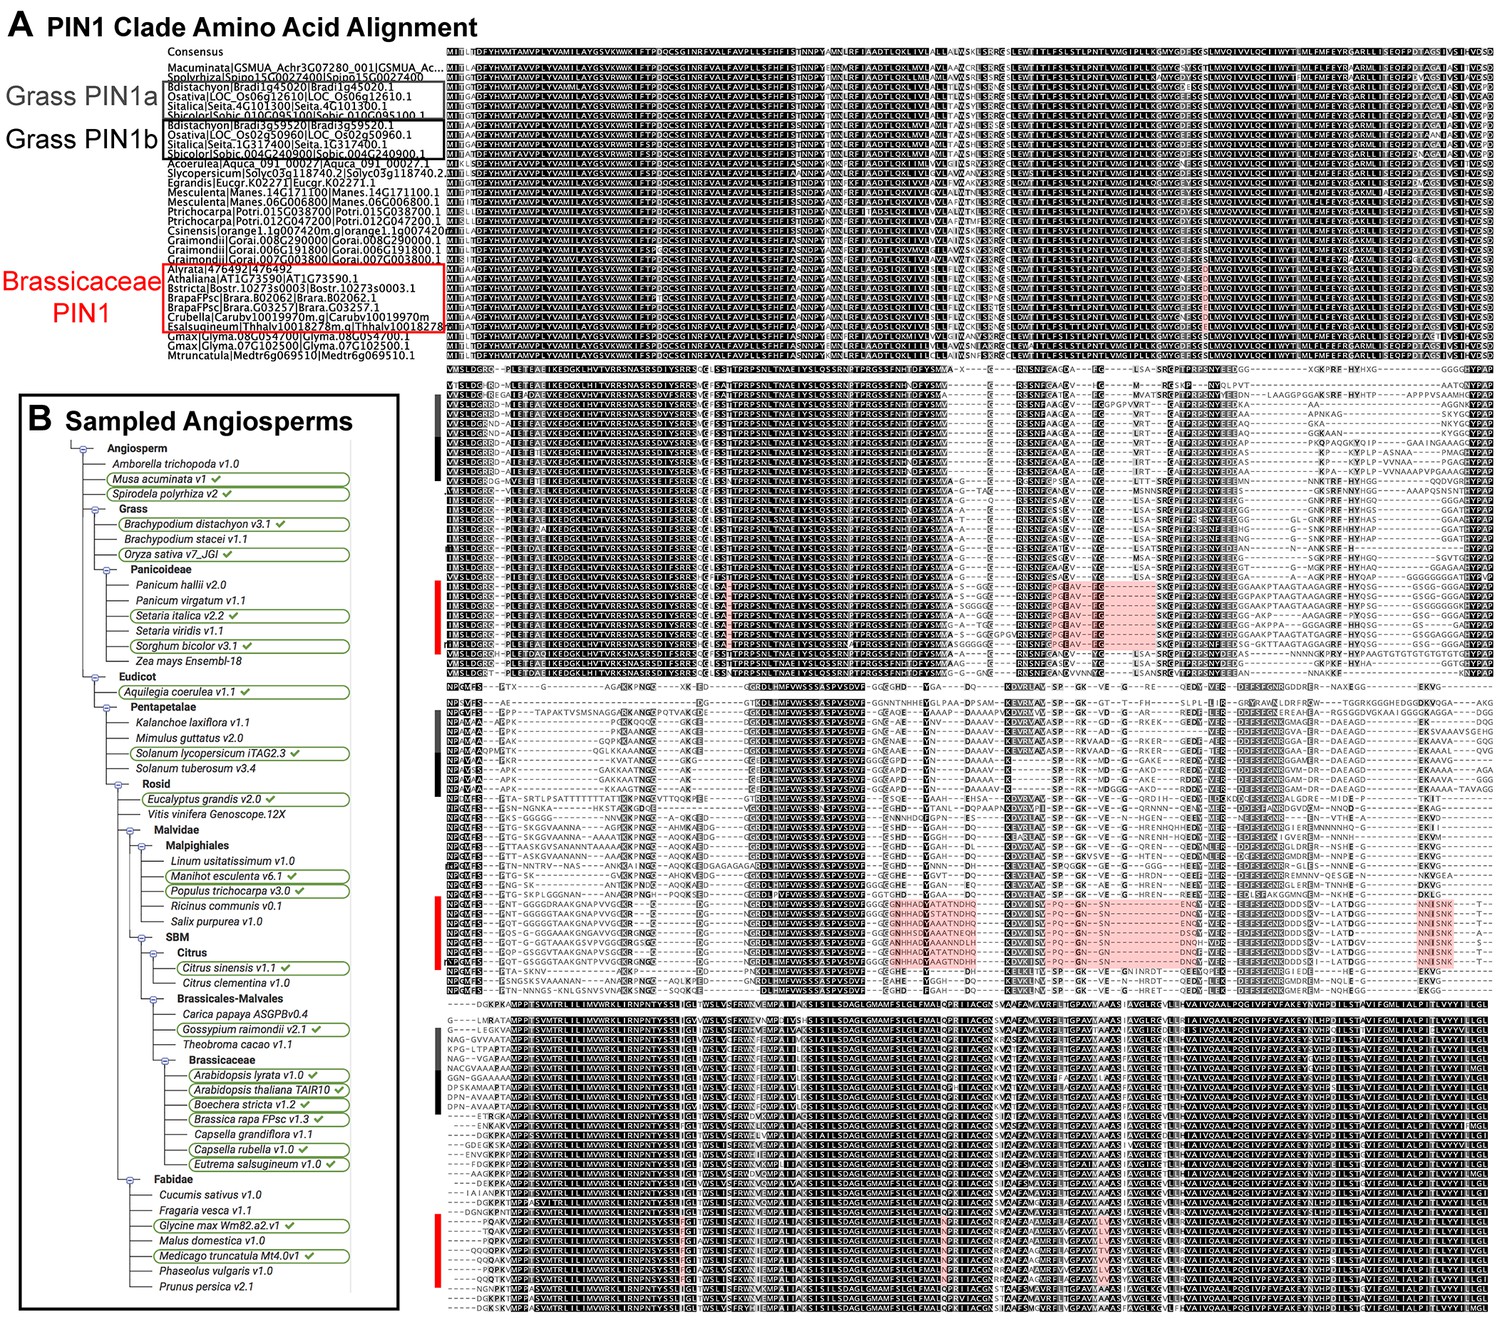
Brassicaceae-specific PIN1 domains.
(A) Wrapped protein alignment showing PIN1 clade members from across the angiosperms. Grass PIN1a proteins are indicated with grey rectangle, grass PIN1b proteins are indicated with black rectangle, and Brassicaceae PIN1 proteins are indicated with red rectangle. Domains that are unique to the Brassicaceae family proteins are indicated by transparent red boxes over the alignment. (B) Sequenced angiosperm species and version numbers, from https://phytozome.jgi.doe.gov. Species used in the alignment in (A) are indicated with green ovals. See Figure 9—source data 1 for source data.
Tables
Table 1
Primers
See methods for usage.
| ID# | Name | Sequence | Purpose |
|---|---|---|---|
| 1 | 524_Bradi4g26300_4230_F | CGTTCCGTGTTGATTCCGATG | sopin1-1 genotyping with HgaI digestion |
| 2 | 525_Bradi4g26300_4923_R | CTGGAGTAGGTGTTGGGGTTC | sopin1-1 genotyping with HgaI digestion |
| 3 | 526_Cas9_8622_F | TCCCAGAGAAGTACAAGGAGATCT | Cas9 Genotyping |
| 4 | 527_Cas9_9159_R | TTGTACACGGTGAAGTACTCGTAG | Cas9 Genotyping |
| 5 | 104_BdPIN_11_QPCR_F | ACAACCCTTACGCCATGAAC | pin1a-1 genotyping with NcoI digestion |
| 6 | 473_PIN1a_dom1_shortR | CACACGAACATGTGCAGGTC | pin1a-1 genotyping with NcoI digestion |
| 7 | 541_Bradi3g59520_PIN1b_5084_F | TGATGCTCTTCATGTTCGAGTACC | pin1b-1 genotyping with mboI digestion |
| 8 | 542_Bradi3g59520_PIN1b_5838_R | GGAGTAAACTACGTTGTGACAAGG | pin1b-1 genotyping with mboI digestion |
| 9 | 019 - Ubi-1 Prom attB4 F | GGGGACAACTTTGTATAGAAAAGTTGCTGCAGTGCAGCGTGACCCGG | pZmUbi amplification for cloning |
| 10 | 020 - Ubi-1 Prom attB1 R | GGGGACTGCTTTTTTGTACAAACTTGCTGCAGAAGTAACACCAAACA | pZmUbi amplification for cloning |
| 11 | PIN1pro-GW-F | GGGGACAACTTTGTATAGAAAAGTTGTTACCCTCATCCATCATTAACTT | proAtPIN1 amplification |
| 12 | PIN1pro-GW-R | GGGGACTGCTTTTTTGTACAAACTTGTCTTTTGTTCGCCGGAGAAGAGA | proAtPIN1 amplification |
| 13 | 455 BdSoPIN1 cacc mRNA | TCACATCTGCTGCCGCTGCC | SoPIN1-Citrine coding region amplification |
| 14 | 302 - PIN_7 qPCR UTR R2 | AATCCCAAAAGCCGACATTG | SoPIN1-Citrine coding region amplification |
| 15 | 466 BdPIN1b cacc mRNA-2 | CACCTGTACACACTGCGGCGCT | PIN1b-Citrine coding region amplification |
| 16 | 308 - PIN_5 qPCR UTR R1 | ACTCGCTAACCAACCCCTTAATT | PIN1b-Citrine coding region amplification |
| 17 | MVR087 - pin1-613 RP (SALK_047613) | AATCATCACAGCCACTGATCC | pin1-613 genotyping |
| 18 | MVR086 - pin1-613 LP (SALK_047613) | CAAAAACACCCCCAAAATTTC | pin1-613 genotyping |
| 19 | MVR036 - LBb1.3 | ATTTTGCCGATTTCGGAAC | pin1-613 genotyping |
| 20 | 344 - Citrine Seq R | GAAGCACATCAGGCCGTAG | PIN1b-Citrine and SoPIN1-Citrine genotyping |
| 21 | 524_Bradi4g26300_4230_F | CGTTCCGTGTTGATTCCGATG | SoPIN1-Citrine genotyping |
| 22 | 541_Bradi3g59520_PIN1b_5084_F | TGATGCTCTTCATGTTCGAGTACC | PIN1b-Citrine genotyping |
| 23 | 543_pin1-4_Aci_F | GCTTTTGCGGCGGCTATGAGATTTGT | pin1-4 genotyping with AciI digestion |
| 24 | 544_pin1-4_Aci_R | GCTTCTGATTTAATTTGTGGGTTTTCA | pin1-4 genotyping with AciI digestion |
| 25 | 076 - BASTA_F2 | CTTCAGCAGGTGGGTGTAGAG | ML1::LhG4 genotyping |
| 26 | 077 - BASTA_R2 | GAGACAAGCACGGTCAACTTC | ML1::LhG4 genotyping |
Additional files
-
Transparent reporting form
- https://doi.org/10.7554/eLife.31804.034
Download links
A two-part list of links to download the article, or parts of the article, in various formats.
Downloads (link to download the article as PDF)
Open citations (links to open the citations from this article in various online reference manager services)
Cite this article (links to download the citations from this article in formats compatible with various reference manager tools)
Cross-species functional diversity within the PIN auxin efflux protein family
eLife 6:e31804.
https://doi.org/10.7554/eLife.31804


