Landscape genomic prediction for restoration of a Eucalyptus foundation species under climate change
- The Australian National University, Australia
- University of California, Santa Cruz, United States
- The Royal Botanic Gardens and Domain Trust, Australia
- Commonwealth Scientific and Industrial Research Organisation (CSIRO), National Research Collections and Facilities, Australia
- Conservation and Attractions Western Australia, Australia
- University of New England, Australia
Figures
Figure 1 with 4 supplements
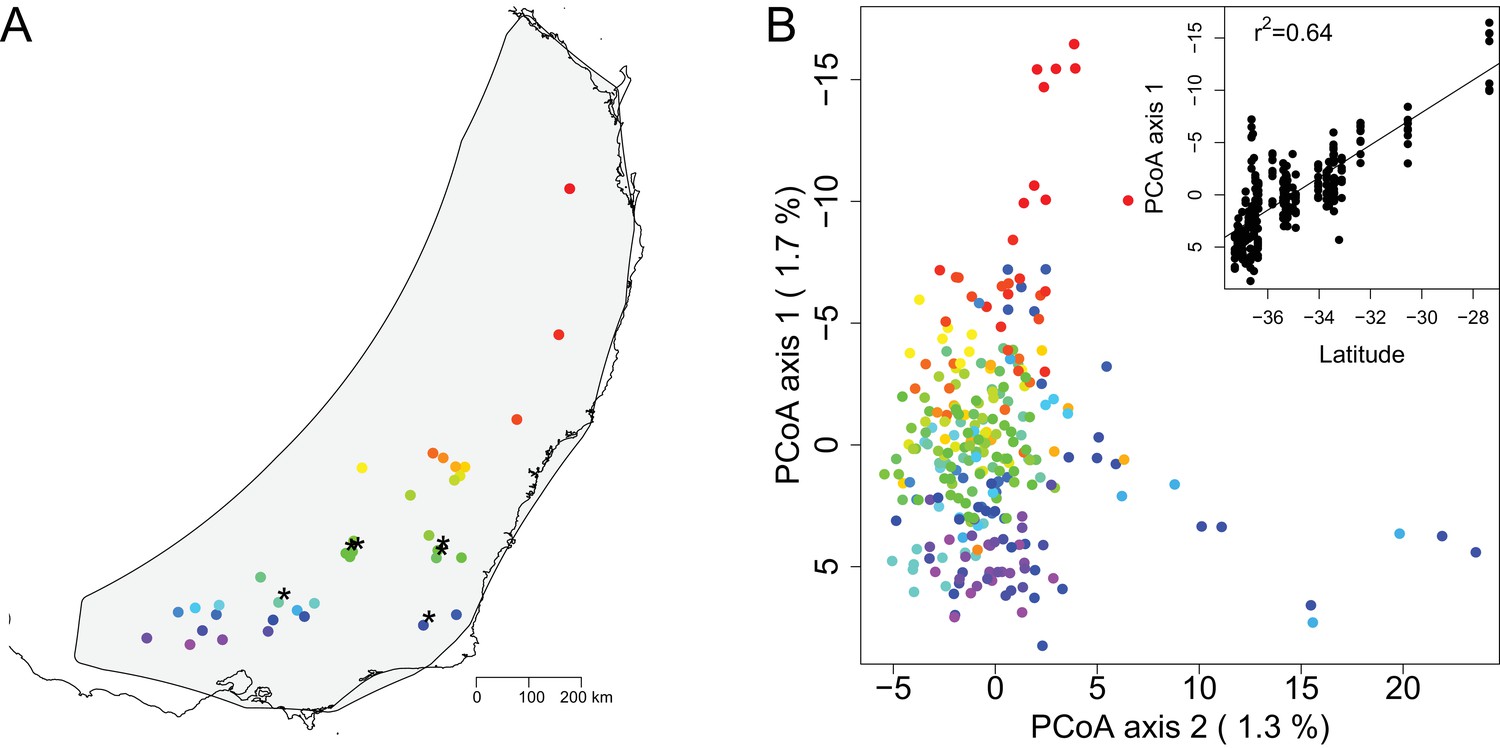
Map of sampling sites and PCoA of genomic distance between samples.
(A) A map of the geographic locations of the 36 sampling sites in southeastern Australia. Sampling locations are indicated with dots color coded in a rainbow gradient based on latitude. Black asterisks indicate the six sites also used for growth chamber experiments. The gray background shading indicates the species distribution polygon. (B) Principal coordinate analysis of the genomic distance between individual samples. Samples are color coded by site to match the map. The percentage on each axis indicates how much of the genomic variation between individuals was explained by the axis. Note that PCoA axes 1 and 2 are switched from standard for easier visualization of the latitudinal gradient. The inset shows the regression of PCoA axis 1 against latitude.
Figure 1—figure supplement 1

Technical replicate dendrogram.
Dendrogram based on genomic distance between samples showing the strong clustering of technical replicates (denoted with an ‘R’ after the sample name and highlighted in yellow). Note that three of the technical replicates failed to pass quality control and are not included in the dendrogram. Additional sample pairs show strong clustering. In each of these cases, the individuals of the pair are from the same sampling site, indicating samples that are closely related.
Figure 1—figure supplement 2
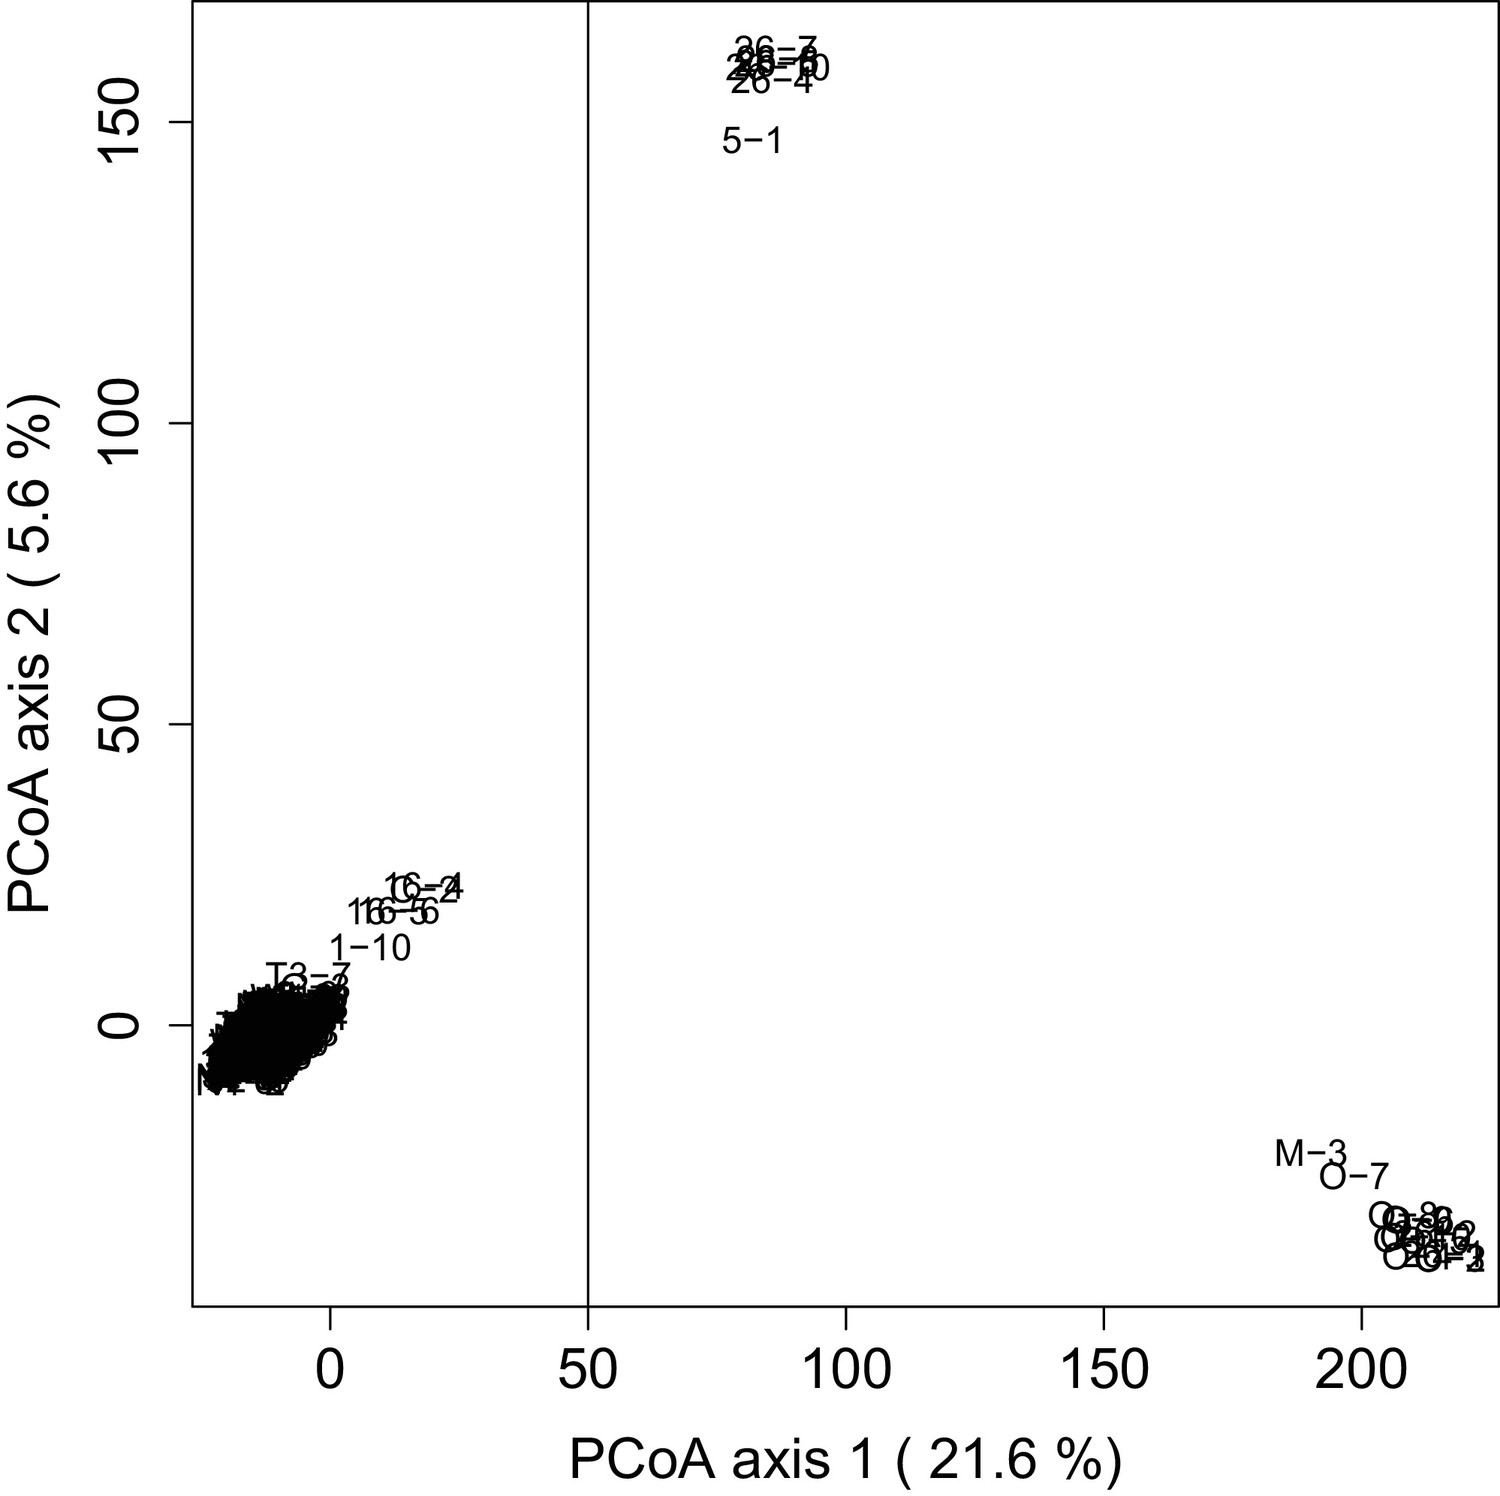
Species identification PCoA.
PCoA of genomic distance between samples showing strong outliers that are likely misidentified samples or hybrids. The vertical line at 50 on PCoA axis 1 indicates the cutoff, with all samples to the right removed from further analyses.
Figure 1—figure supplement 3
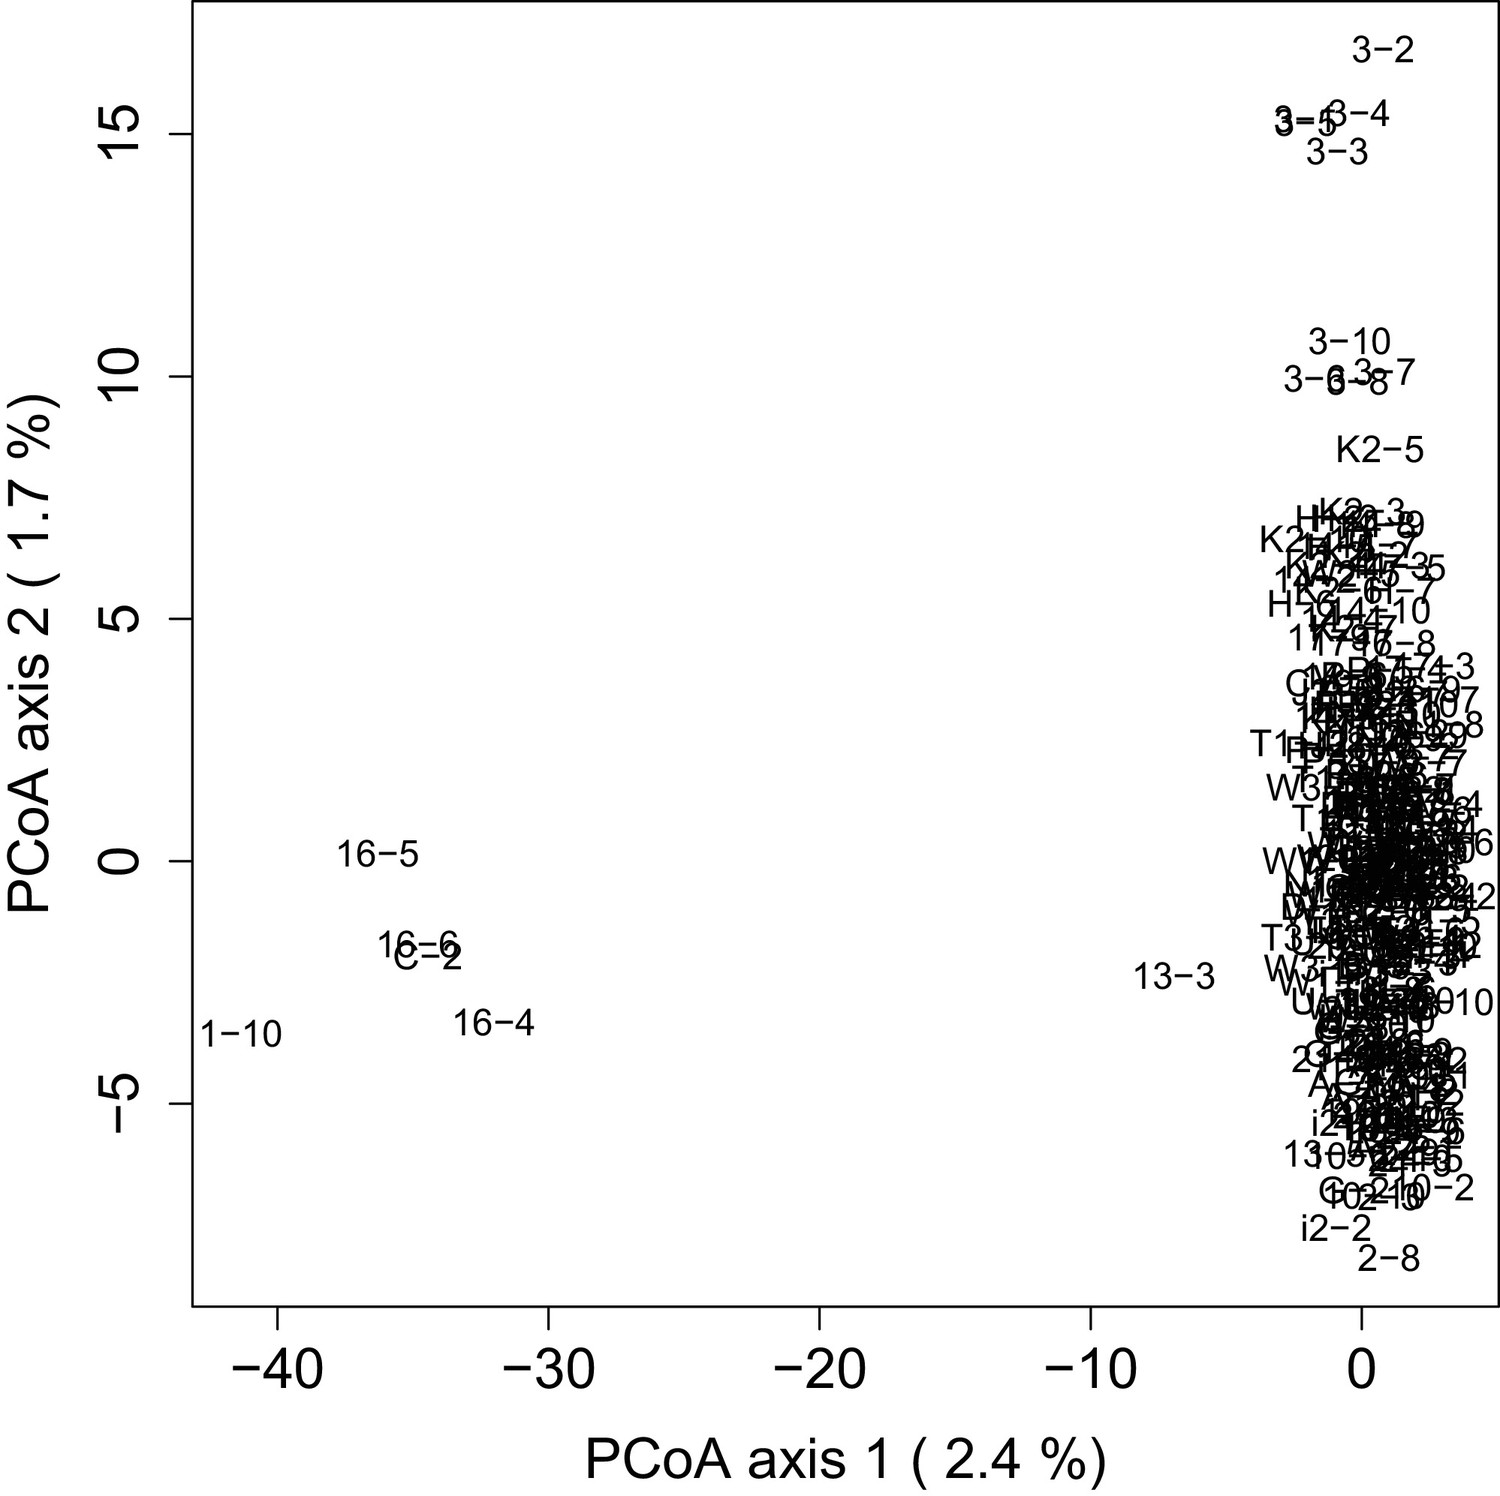
Outlier PCoA.
PCoA of genomic distance between samples for the confirmed E. melliodora samples. The five samples on the left were deemed outliers and removed from further analyses.
Figure 1—figure supplement 4
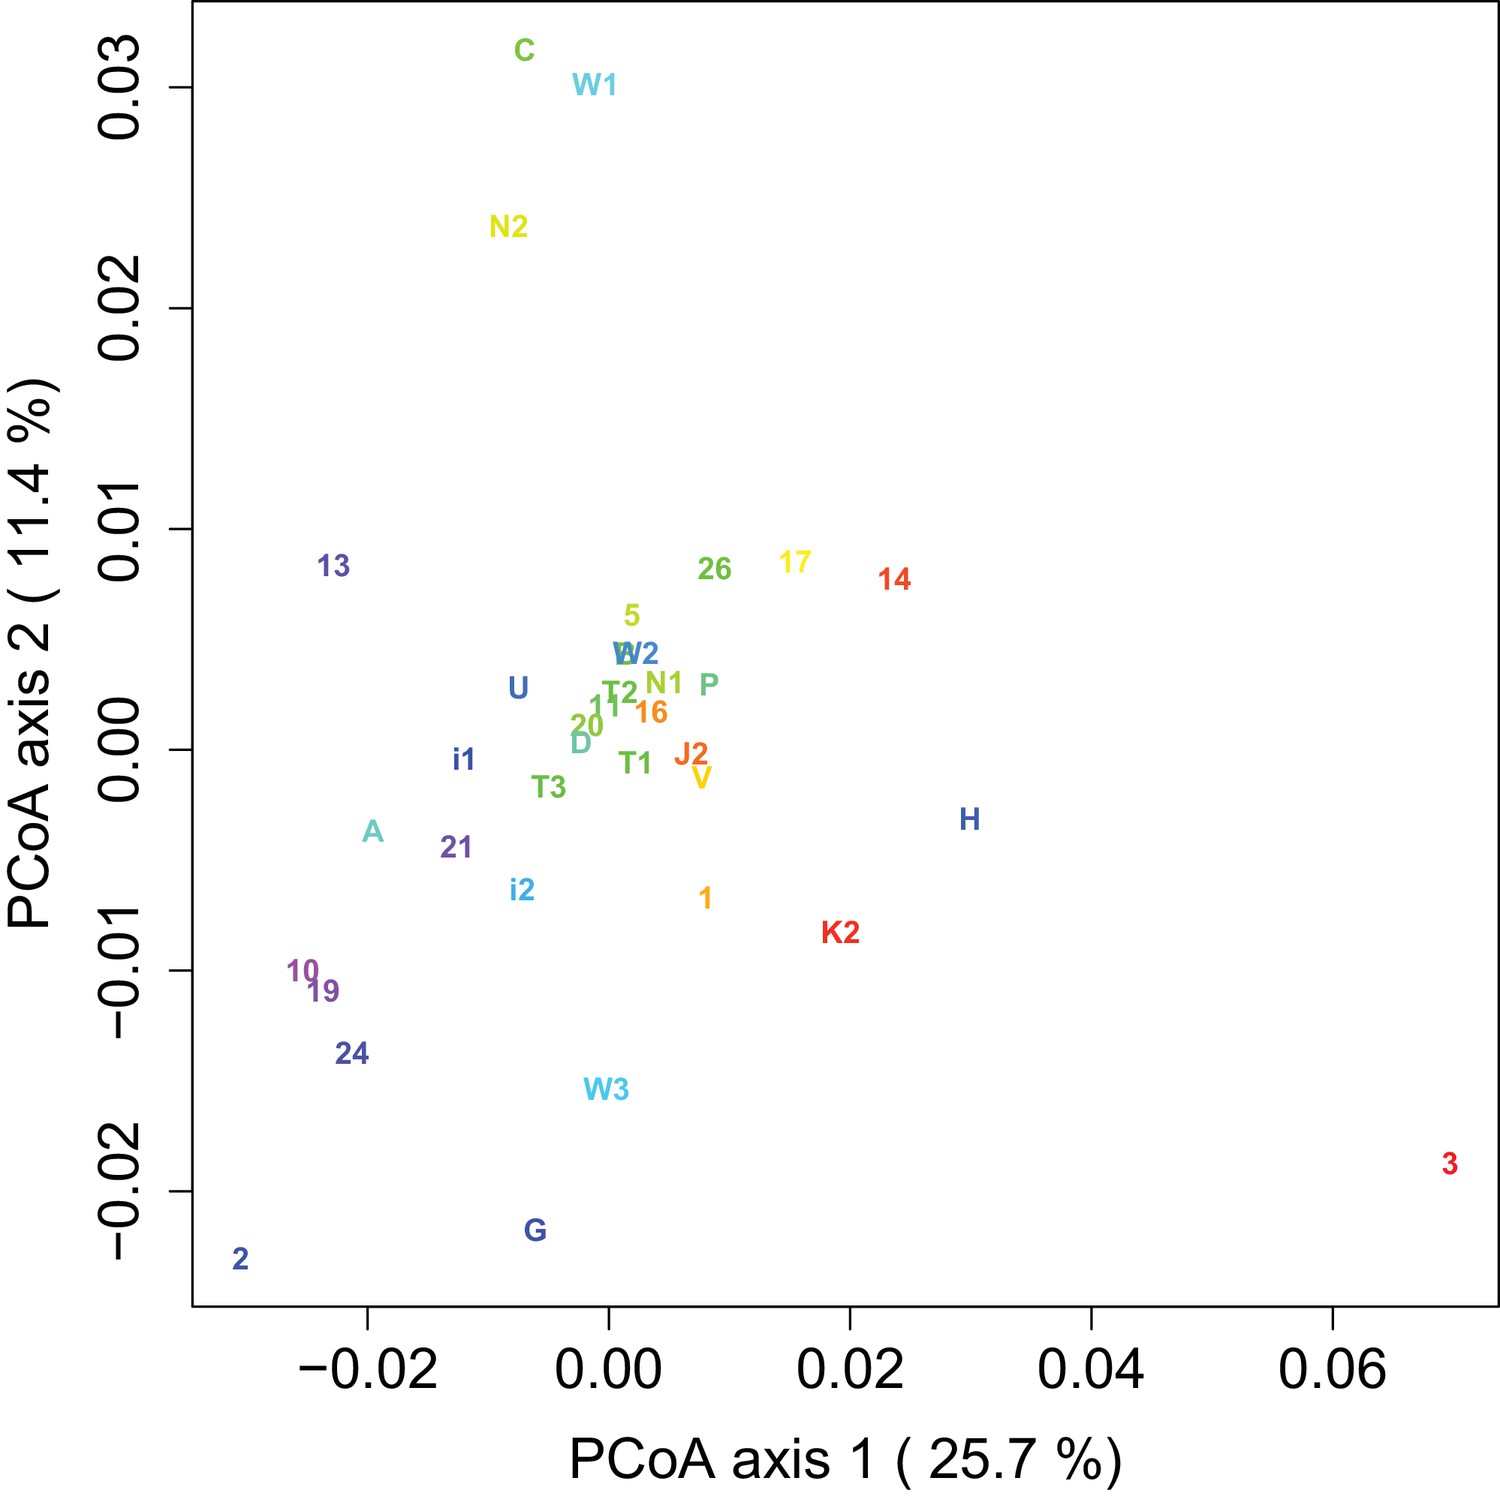
Site-level PCoA.
PCoA of Fst between sampling sites. Sampling sites are labeled by name and color coded to match the map in Figure 1A. The percentage on each axis indicates how much of the variation in Fst between sampling sites was explained by the axis.
Figure 2
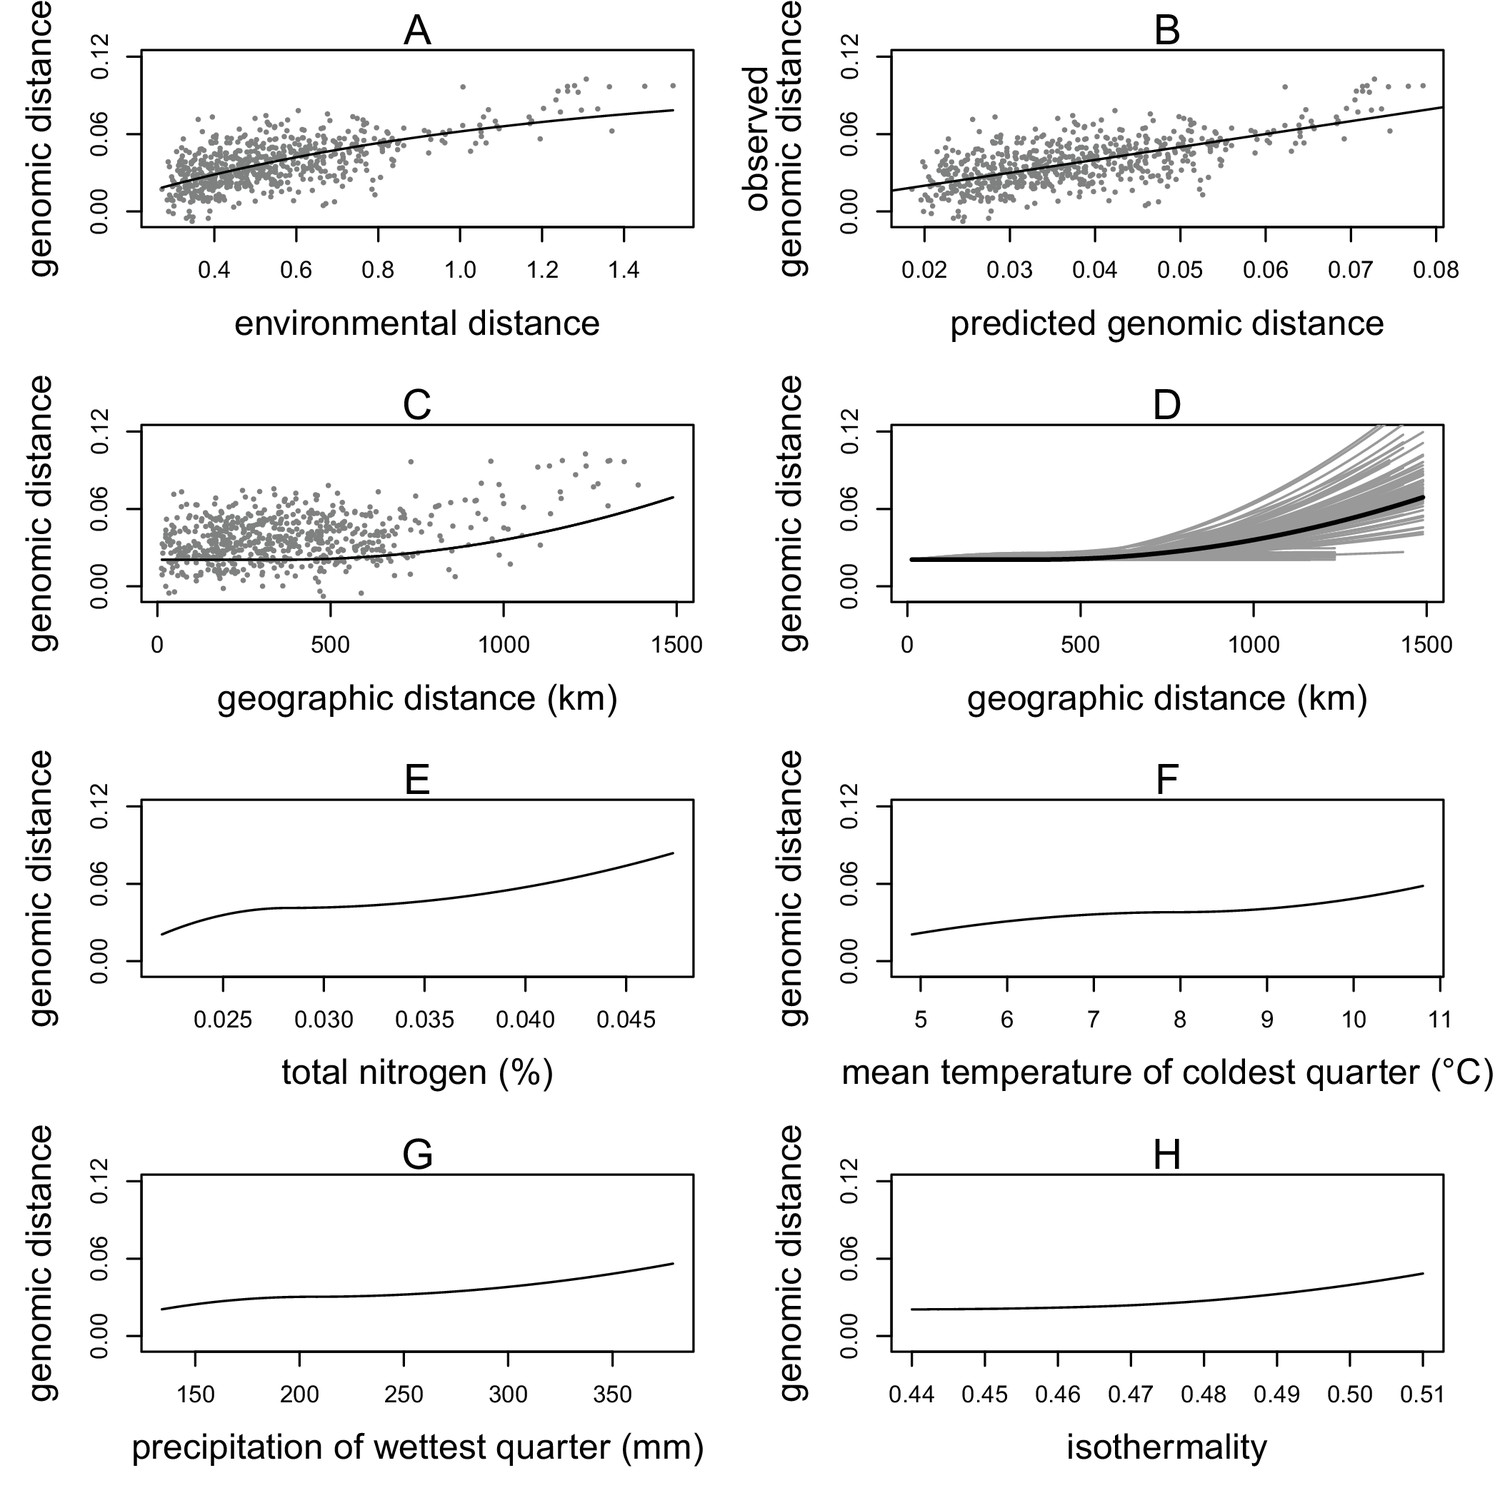
Generalized dissimilarity modelling (GDM) results.
(A) Non-linear relationship between environmental distance and genomic distance. Points are site pairs; the line is the predicted relationship. (B) Relationship between predicted genomic distance and observed genomic distance. Points are site pairs; the line indicates where observation and prediction match. (C) The geographic spline showing little predicted genomic change between sites less than 500 km apart and increasing genomic variation as geographic distance increases beyond 500 km. Points are site pairs. (D) Geographic splines from 100 iterations of sampling 70% of sites. Each grey line is an iteration; the black line is the full model prediction. (E–H) Predicted splines showing the estimated relationship between genomic distance and the environmental variable: (E) total nitrogen content at 100–200 cm of soil depth, (F) mean temperature of the coldest quarter, (G) precipitation of the wettest quarter, and (H) isothermality.
Figure 3
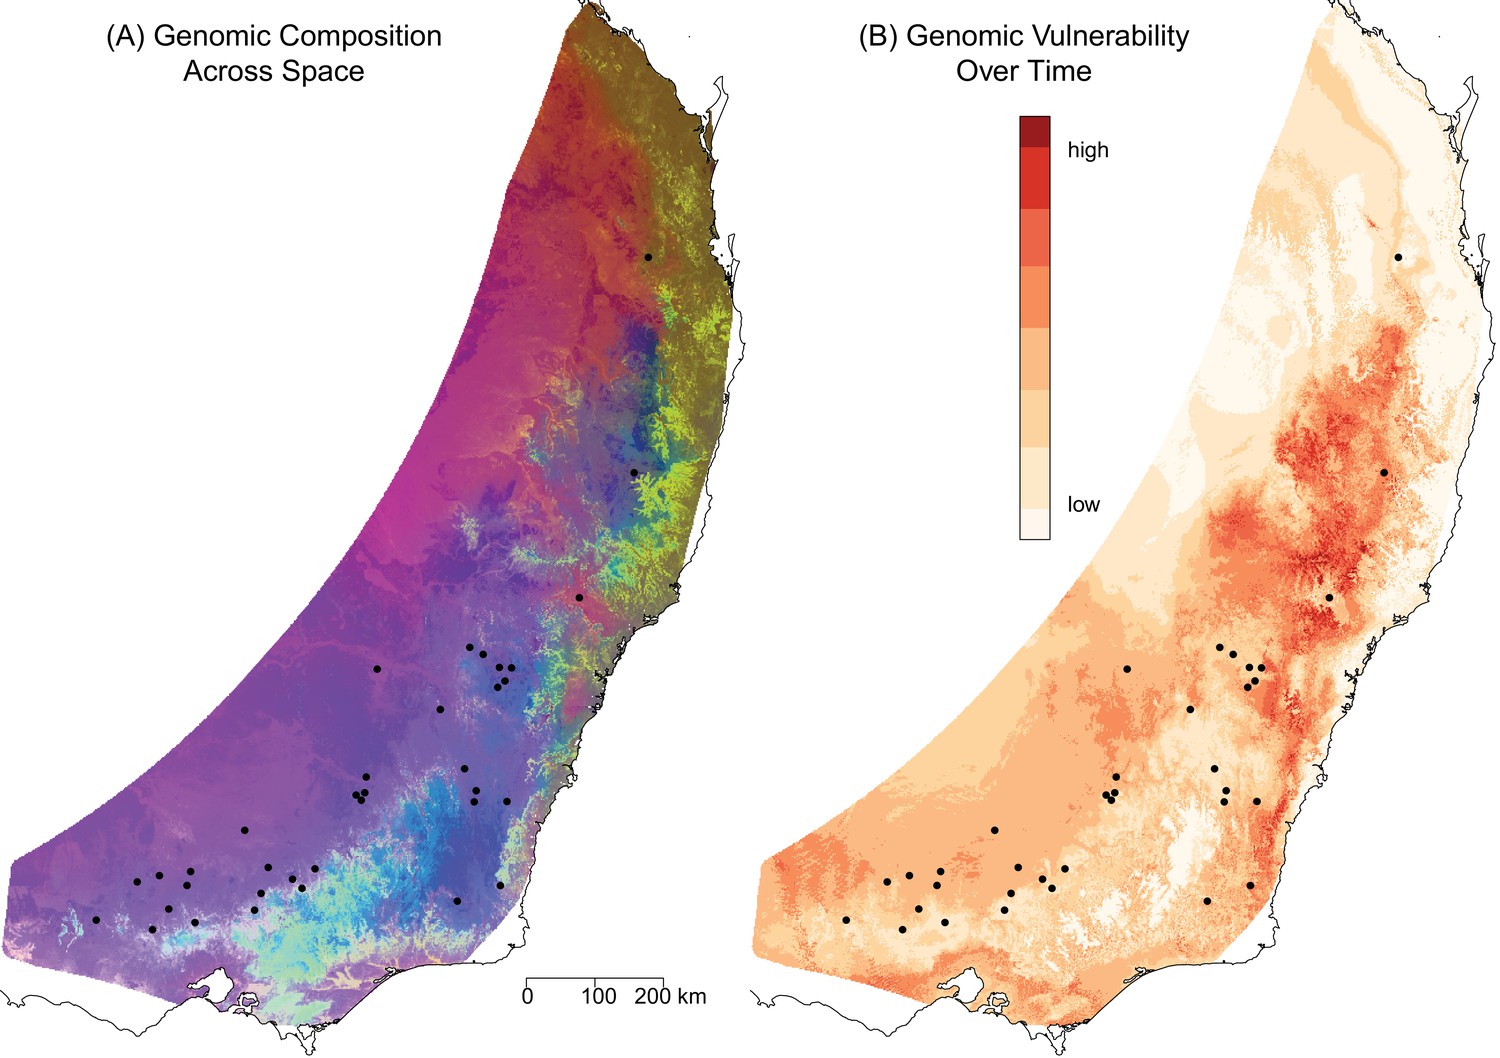
Predicted spatial and temporal variation in genomic composition.
(A) The spatial distribution of predicted genomic variation based on projecting the GDM model onto geography and current environmental conditions. Regions with similar colors are predicted to have similar genomic compositions. (B) The predicted genomic vulnerability based on comparing the GDM model projected onto current environmental conditions with the GDM model projected onto predicted environmental conditions for 2070. The higher the difference (darker red), the more genomic change required to track climate between current and future conditions. Black points are sampling sites.
Figure 4
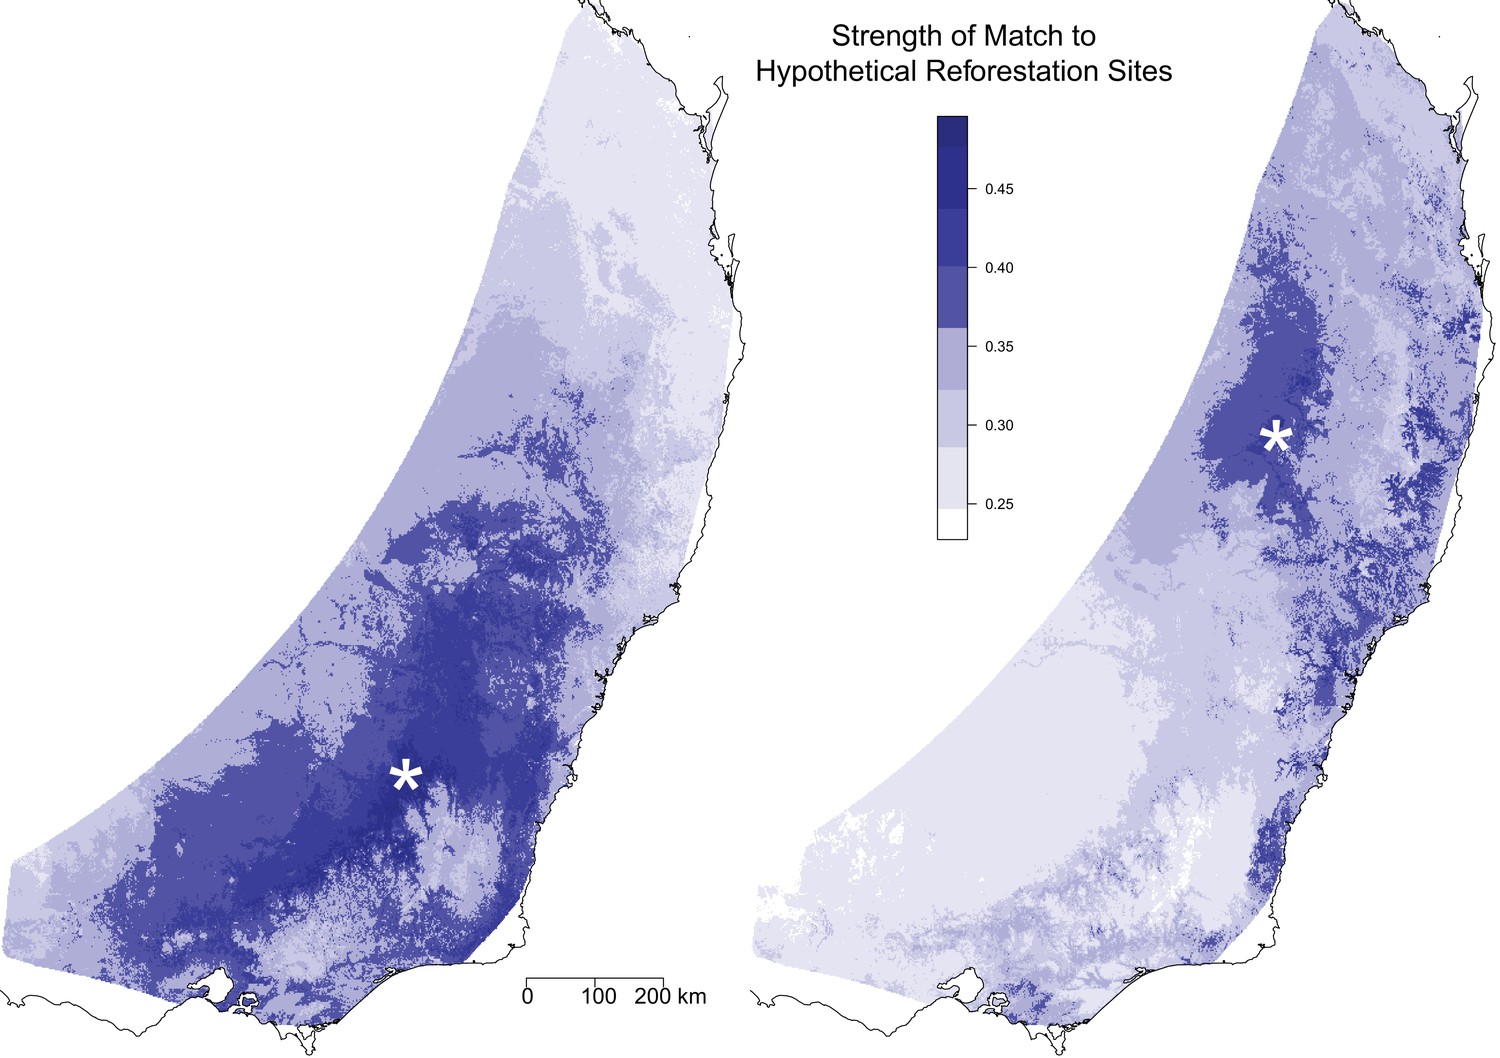
Optimal seed sourcing locations for hypothetical reforestation sites.
The predicted genomic similarity of hypothetical reforestation sites (indicated by white asterisks) to potential seed sourcing locations under a climate change scenario for 2070. Dark blue areas indicate seed sourcing areas predicted to best match future conditions at the hypothetical reforestation sites; white and light blue areas indicate areas of potential genomic mismatch.
Figure 5
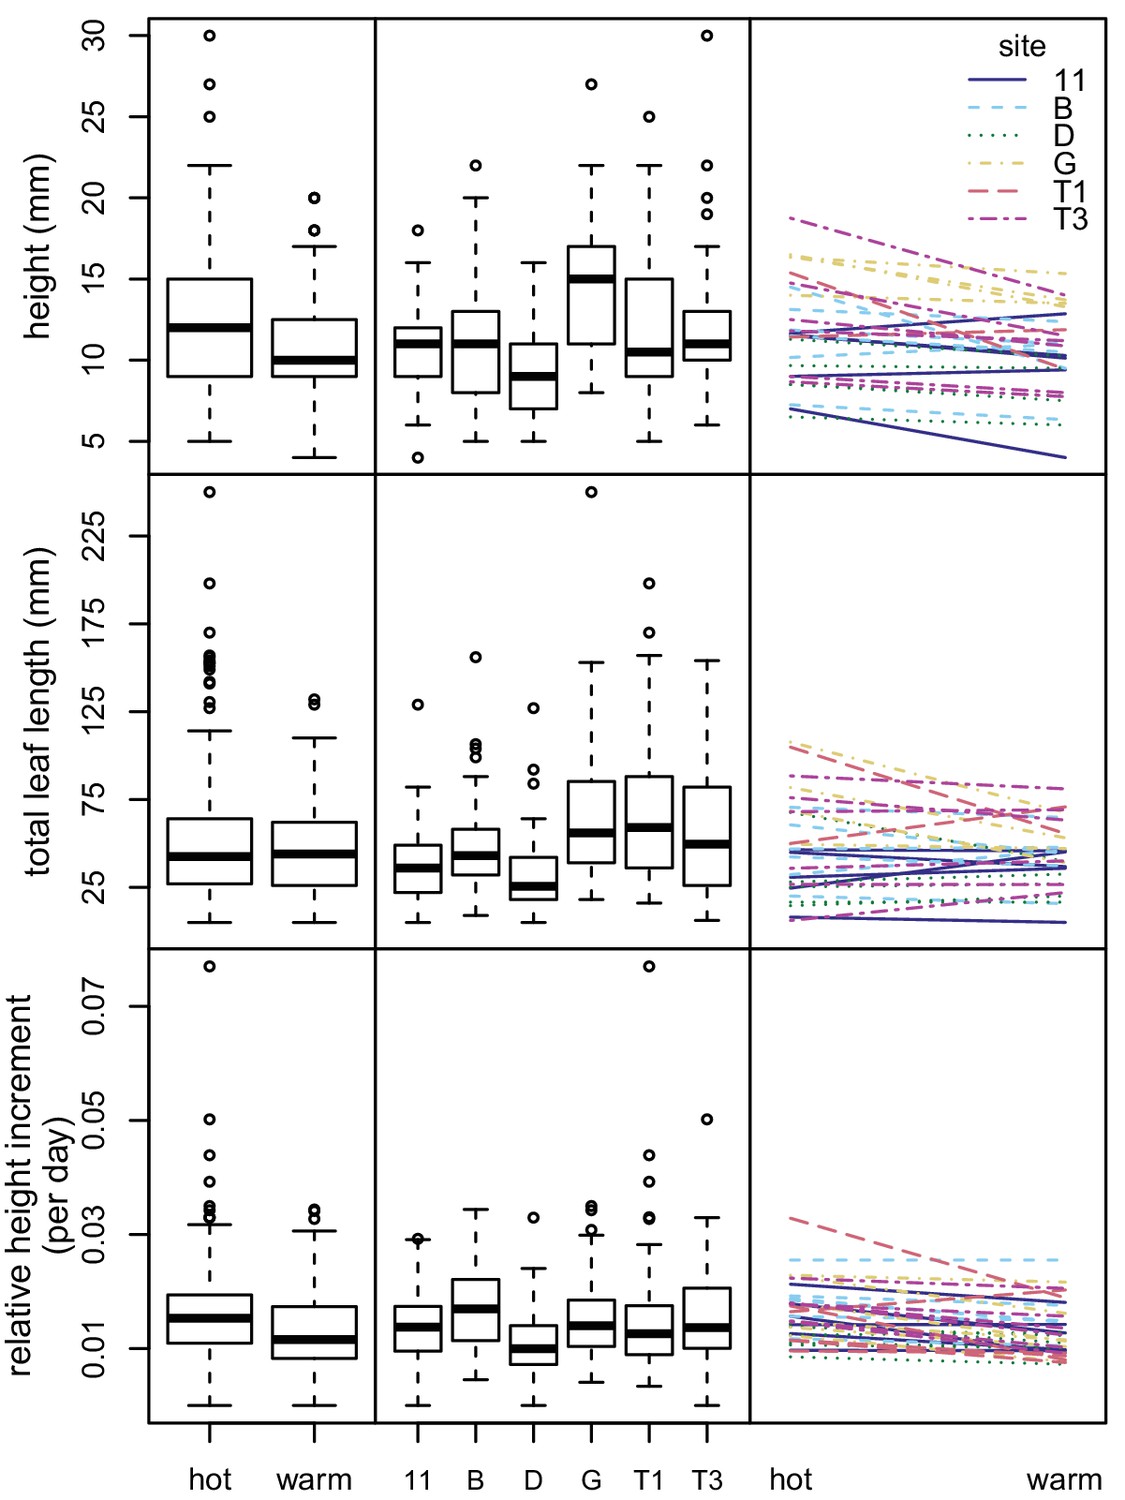
Variation in seedling growth in chamber experiment.
Box plots showing variation between experimental conditions (left) and sampling sites (center) for three seedling growth traits. Plots showing interactions between seedling growth traits and experimental conditions (right). Each line represents a maternal line, with color and line type indicating the sampling site.
Figure 6
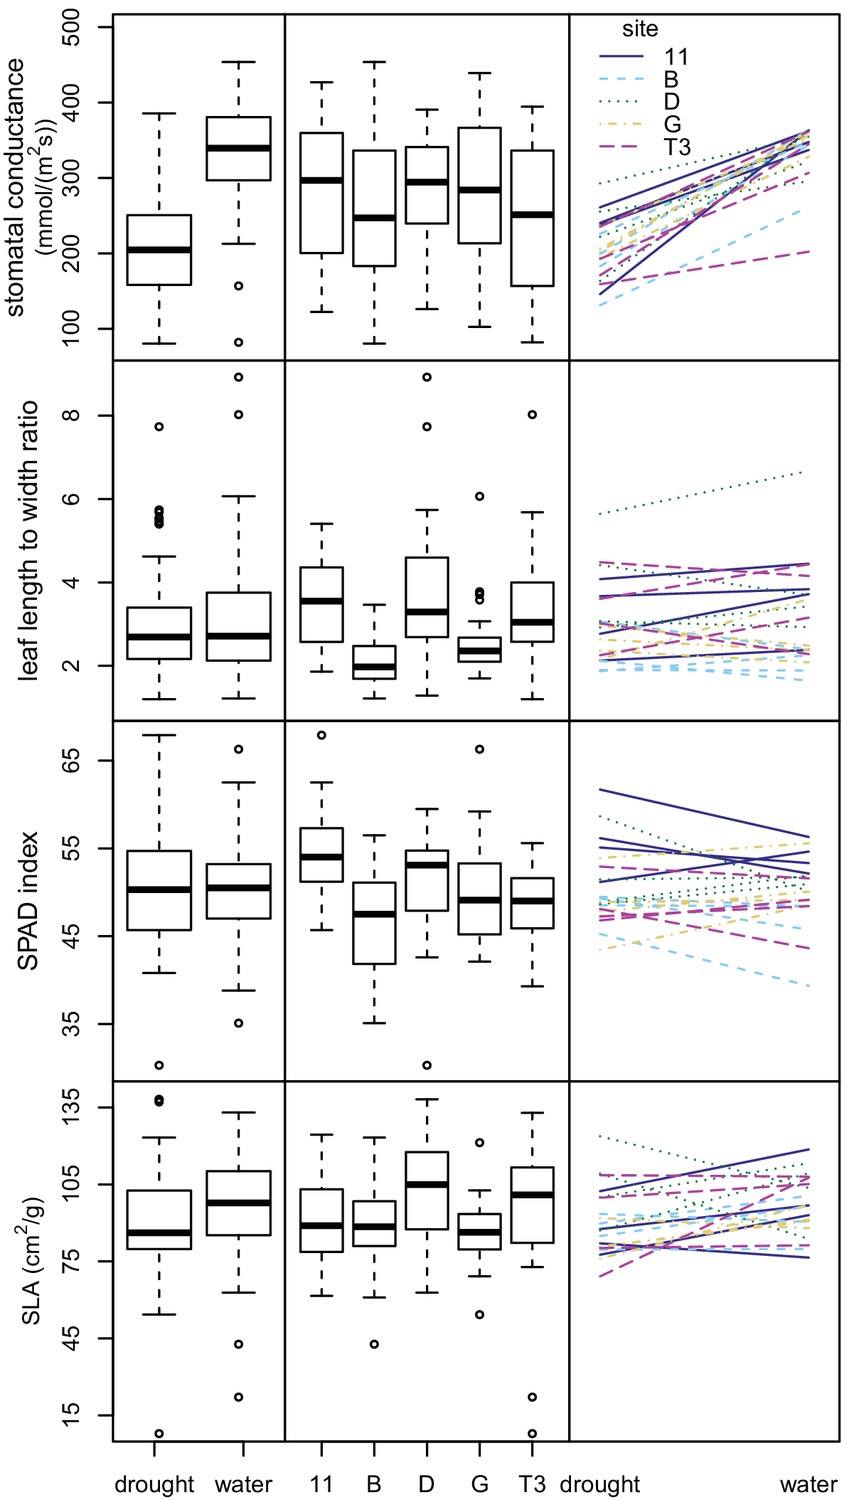
Variation in leaf traits in drought experiment.
Box plots showing variation between water treatments (left) and sampling sites (center) for four leaf traits. Plots showing interactions between leaf traits and water treatments (right). Each line represents a maternal line, with color and line type indicating the sampling site.
Figure 7
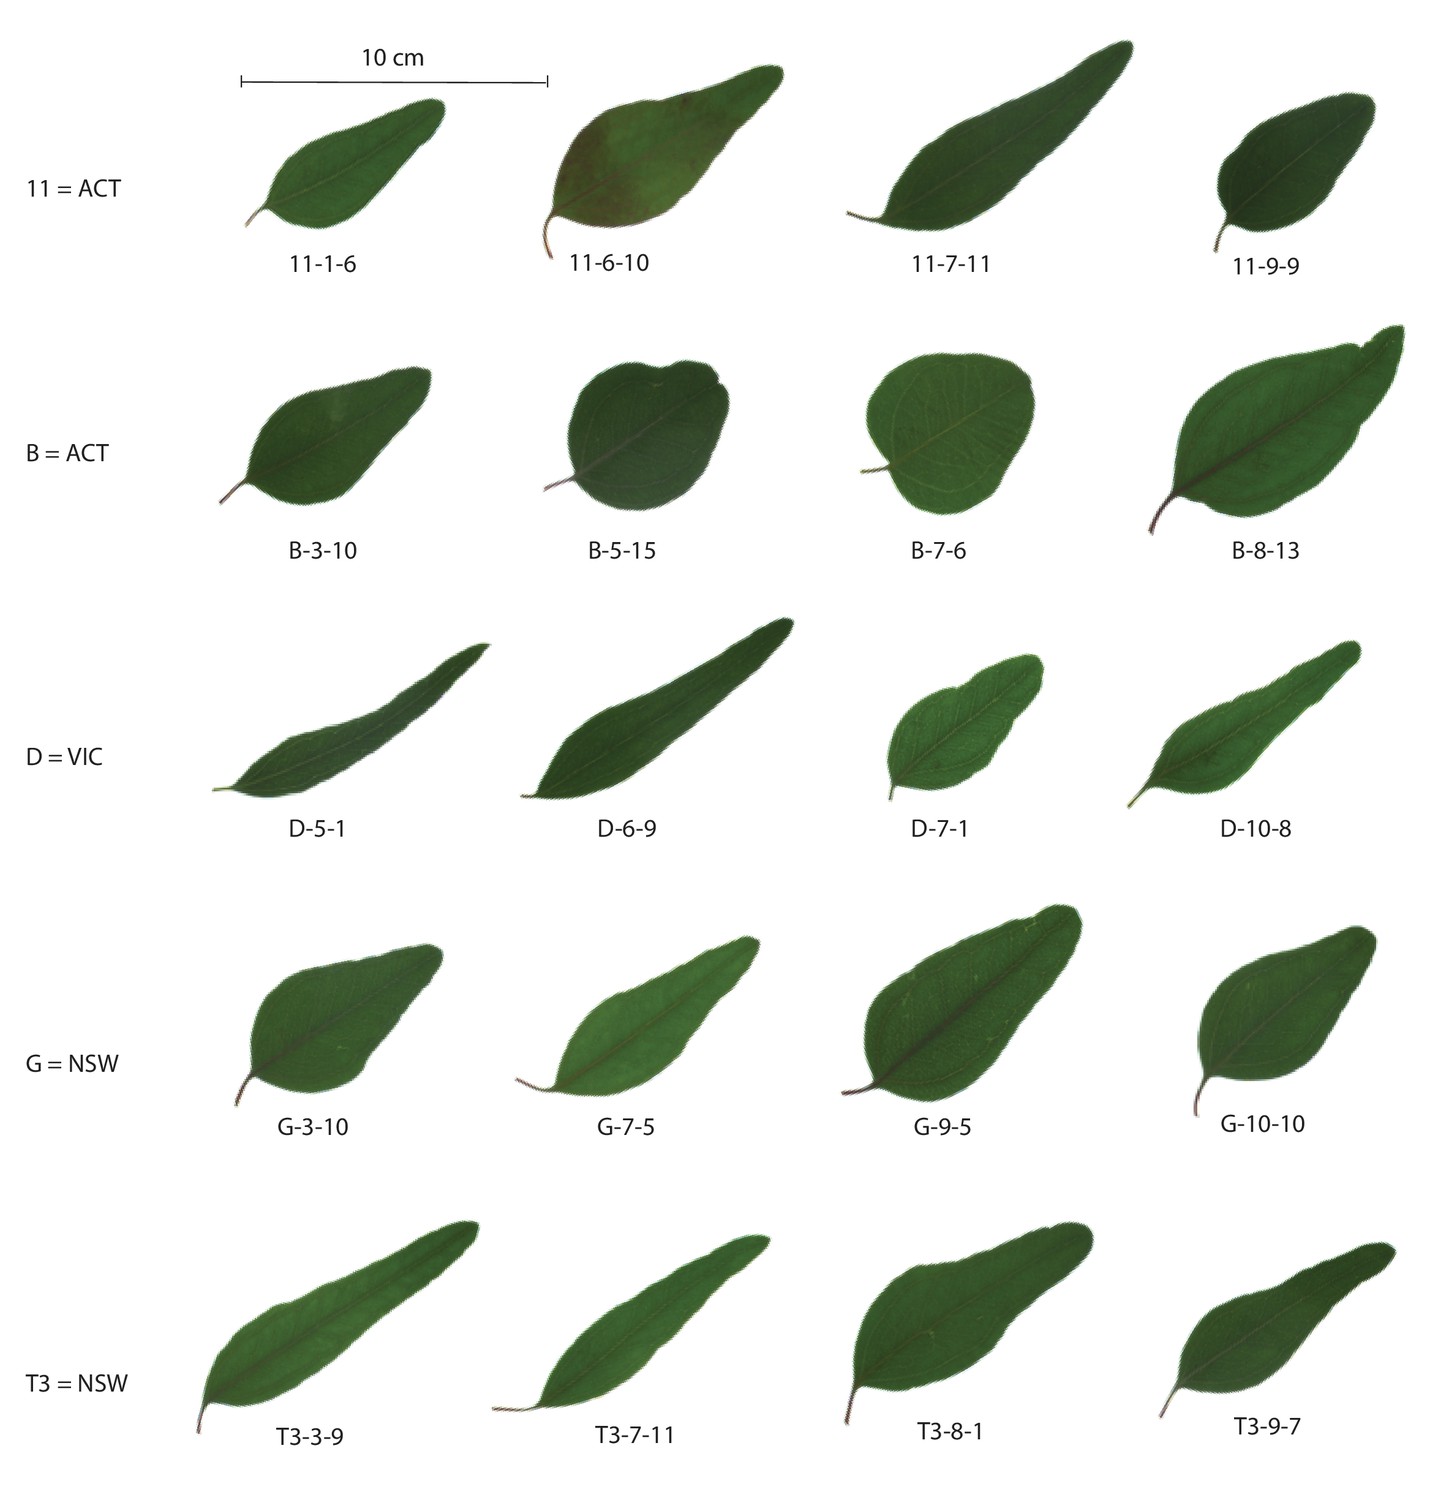
Variation in leaf shape.
One representative leaf from each maternal line in the drought experiment. Each row shows a single sampling site, identified by site ID and state location (ACT = Australian Capital Territory, VIC = Victoria, NSW = New South Wales). Each leaf is identified by its sampling site, maternal line, and replicate number).
Additional files
-
Supplementary file 1
Table of E. melliodora sampling information.
- https://doi.org/10.7554/eLife.31835.014
-
Supplementary file 2
Table of Pairwise Fst.
- https://doi.org/10.7554/eLife.31835.015
-
Supplementary file 3
Table of Pearson's correlation between environmental variables across sampling sites.
- https://doi.org/10.7554/eLife.31835.016
-
Supplementary file 4
Table of Percent of variation explained and p-values for non-interaction linear models for chamber experiment.
- https://doi.org/10.7554/eLife.31835.017
-
Supplementary file 5
Table of P-values of interaction term in linear model for chamber experiment.
- https://doi.org/10.7554/eLife.31835.018
-
Supplementary file 6
Table of Percent of variation explained and p-values for non-interaction linear models for drought experiment.
- https://doi.org/10.7554/eLife.31835.019
-
Supplementary file 7
Table of P-values of interaction term in linear model for drought experiment.
- https://doi.org/10.7554/eLife.31835.020
-
Supplementary file 8
Table of Qst-Fst results.
- https://doi.org/10.7554/eLife.31835.021
-
Transparent reporting form
- https://doi.org/10.7554/eLife.31835.022
Download links
A two-part list of links to download the article, or parts of the article, in various formats.
Downloads (link to download the article as PDF)
Open citations (links to open the citations from this article in various online reference manager services)
Cite this article (links to download the citations from this article in formats compatible with various reference manager tools)
Landscape genomic prediction for restoration of a Eucalyptus foundation species under climate change
eLife 7:e31835.
https://doi.org/10.7554/eLife.31835


