Tumor initiating cells induce Cxcr4-mediated infiltration of pro-tumoral macrophages into the brain
- University of Edinburgh, United Kingdom
- University of Trento, Italy
Figures
Figure 1 with 1 supplement
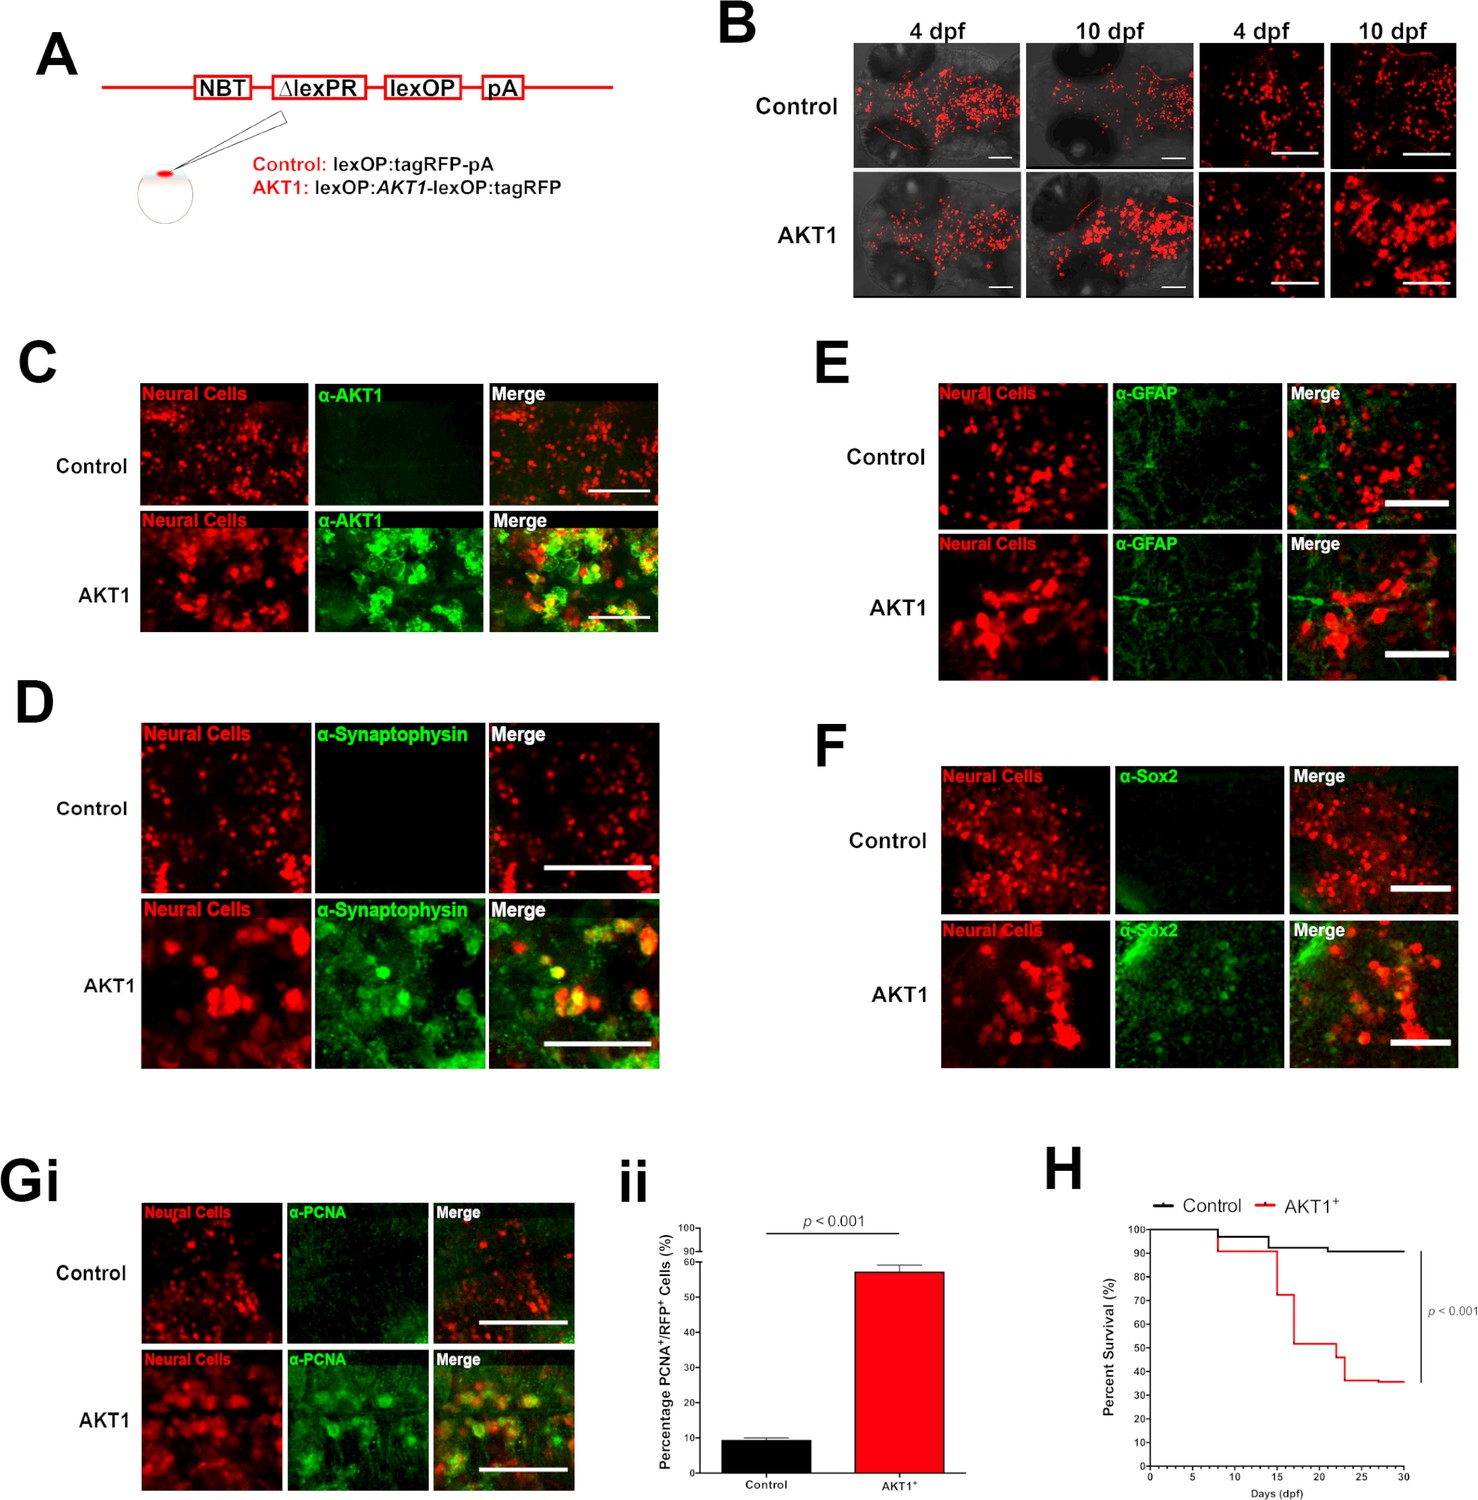
Human AKT1 induces transformation in the larval zebrafish brain.
(A) To achieve expression in neural cells under the NBT promoter, the NBT:∆LexPR-lexOP-pA zebrafish line was used. AKT1 expression was achieved through the injection of a lexOP:AKT1-lexOP:tagRFP into embryos at the one-cell stage. Control-RFP cells were obtained through the injection of a lexOP:tagRFP-pA. (B) In vivo imaging revealed early transformations and abnormal cellular morphology of AKT1-expressing cells in the brains of larval zebrafish from 4 dpf to 10 dpf. Representative confocal images of the larval zebrafish brain are shown. Upper panel: RFP control cells, lower panel: AKT1-expressing cells. (C) Immunohistochemistry revealed expression of the human AKT1 protein in AKT1-expressing cells, but not in control cells. Representative confocal images of the larval zebrafish brain at 8 dpf are shown. Upper panel: RFP control cells, lower panel: AKT1-expressing cells. (D) Immunohistochemistry revealed expression of the differentiation marker Synaptophysin in AKT1-expressing cells but not in control cells. Representative confocal images of the larval zebrafish brain at 8 dpf are shown. Upper panel: RFP control cells, lower panel: AKT1-expressing cells (E) Immunohistochemistry showed that neither AKT1-expressing cells nor control neural cells were positive for GFAP at 8 dpf. Representative confocal images of the larval zebrafish brain at 8 dpf are shown. Upper panel: RFP control cells, lower panel: AKT1-expressing cells. (F) Immunohistochemistry revealed that a subset of AKT1-expressing cells was positive for the stem cell marker Sox2 while neural control cells were negative. Representative confocal images of the larval zebrafish brain at 8 dpf are shown. Upper panel: RFP control cells, lower panel: AKT1-expressing cells. (Gi) Immunohistochemistry using the proliferation marker PCNA (proliferating cell nuclear antigen) revealed increased expression in AKT1-expressing cells compared to control cells. Representative confocal images of the larval zebrafish brain at 8 dpf are shown. Upper panel: RFP control cells, lower panel: AKT1 cells. (Gii) Quantification of the level of proliferation rates in RFP-positive neural cells in control and AKT1-positive fish, (Control: 9.2 ± 0.75%, n = 13 larvae; Akt1: 57.1 ± 2.03%, n = 17 larvae, p<0.001, N = 3) (H) Kaplan-Meier survival plot of control and AKT1 injected larvae over 30 days, n = 118/130, and 62/174 respectively. Error bars represent mean ± SEM. All images represent maximum intensity projections of confocal stacks. Images were captured using a Zeiss LSM710 confocal microscope with a 20X/NA 0.8 objective. Scale bars represent 100 µm.
Figure 1—figure supplement 1
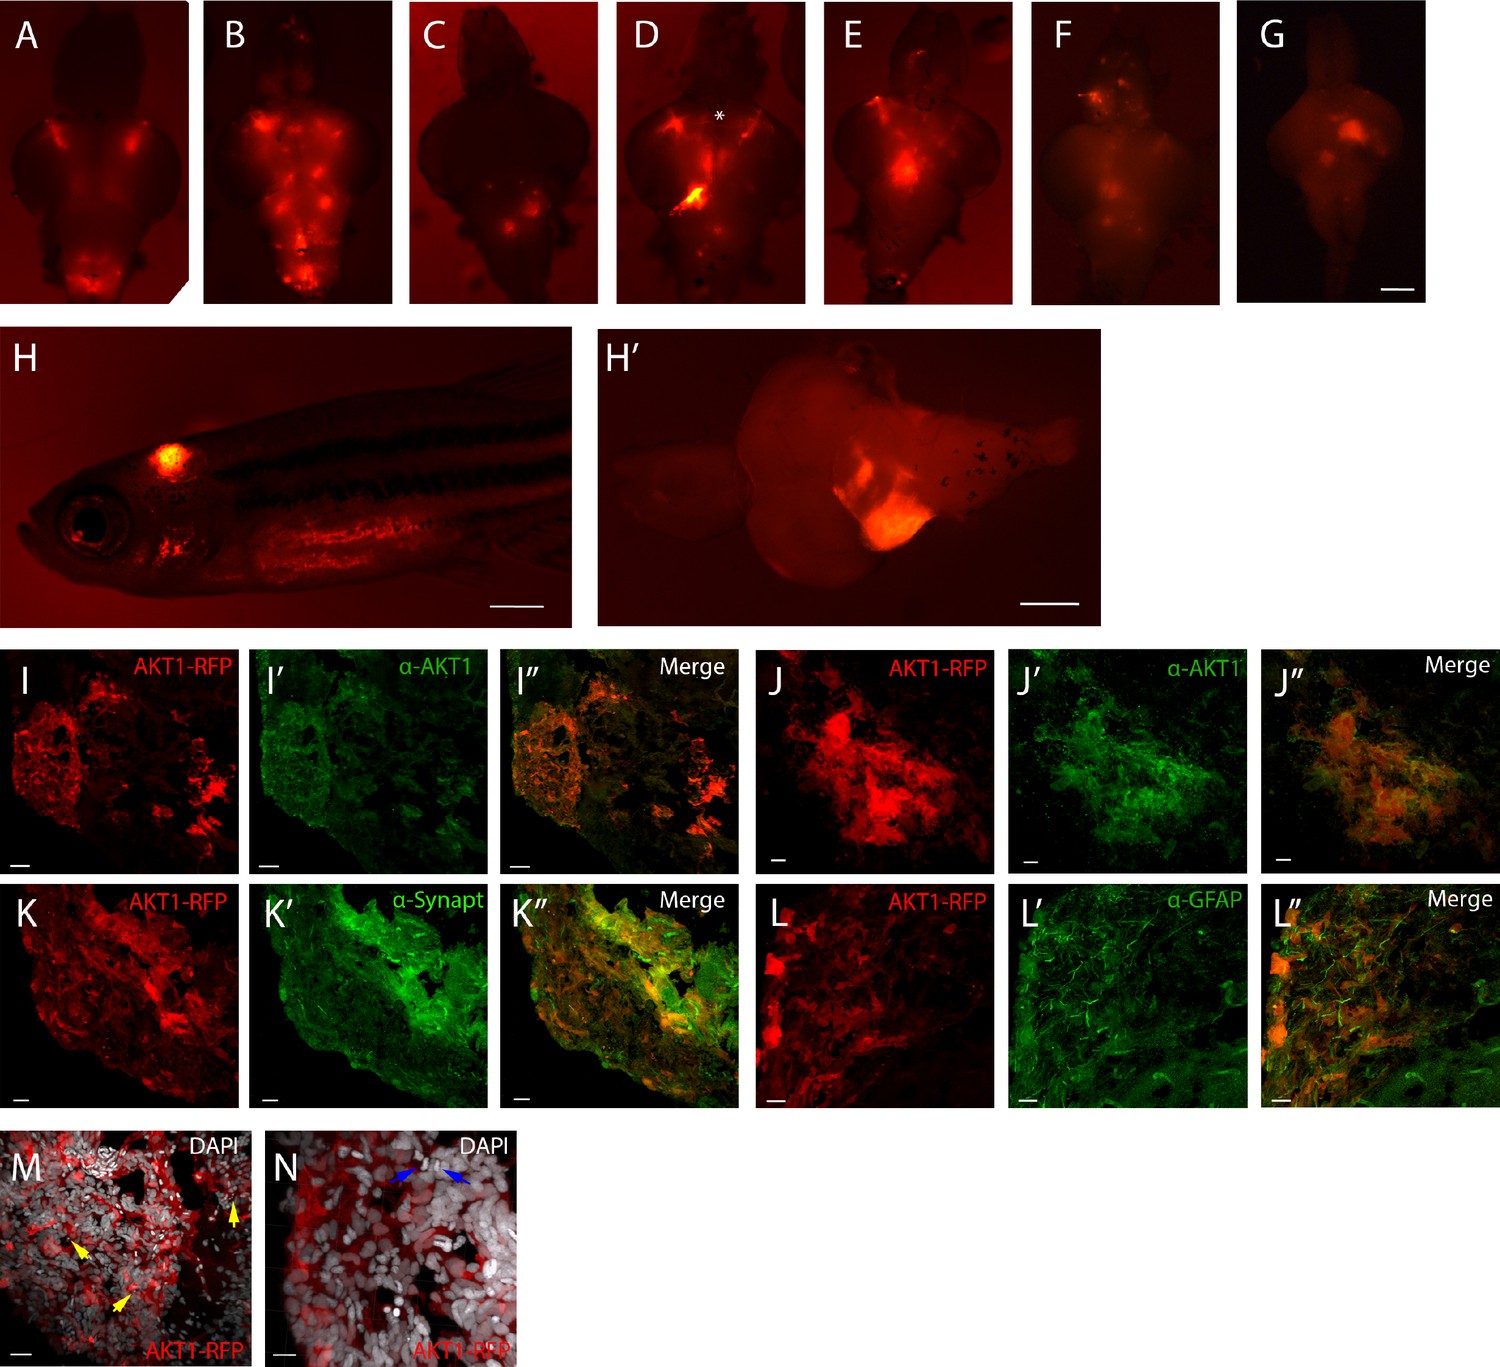
Neural AKT1 expression induces brain tumors with mixed neuronal and glial components.
(A)-(G) Representative brain samples from 1-month-old zebrafish injected with driver plasmid containing the NBT promoter (NBT:∆lexPR-lexOP-pA) together with a lexOP:AKT1-lexOP:tagRFP, showing clones of cells expressing the oncogene (red fluorescence). Some clones showed neuronal differentiation (axons, asterisk in D). (H), (H’) Example of a 1-month-old fish showing a large cerebellar clone of oncogene expressing cells. (I)-(N) Sections through the cerebellar tumor shown in (H’), showing red fluorescence from the transgene (I), (J), (K), (L), (M)-(N) and green fluorescence for immunohistochemistry for AKT1 (I’), (J’), Synaptophysin (K’) and GFAP (L’) or white nuclear staining (DAPI) (M), (N). Yellow arrows in (M) point to apoptotic bodies. Blue arrows in (N) point to mitotic figures. Scale bars represent: 100 µm for (A)-(G) and. (H’); 1 mm for (H); 50 µm for (I), (I’); 20 µm for (J)-(K’) and (M), (M’); 10 µm for (L), (L’) and (N).
Figure 2
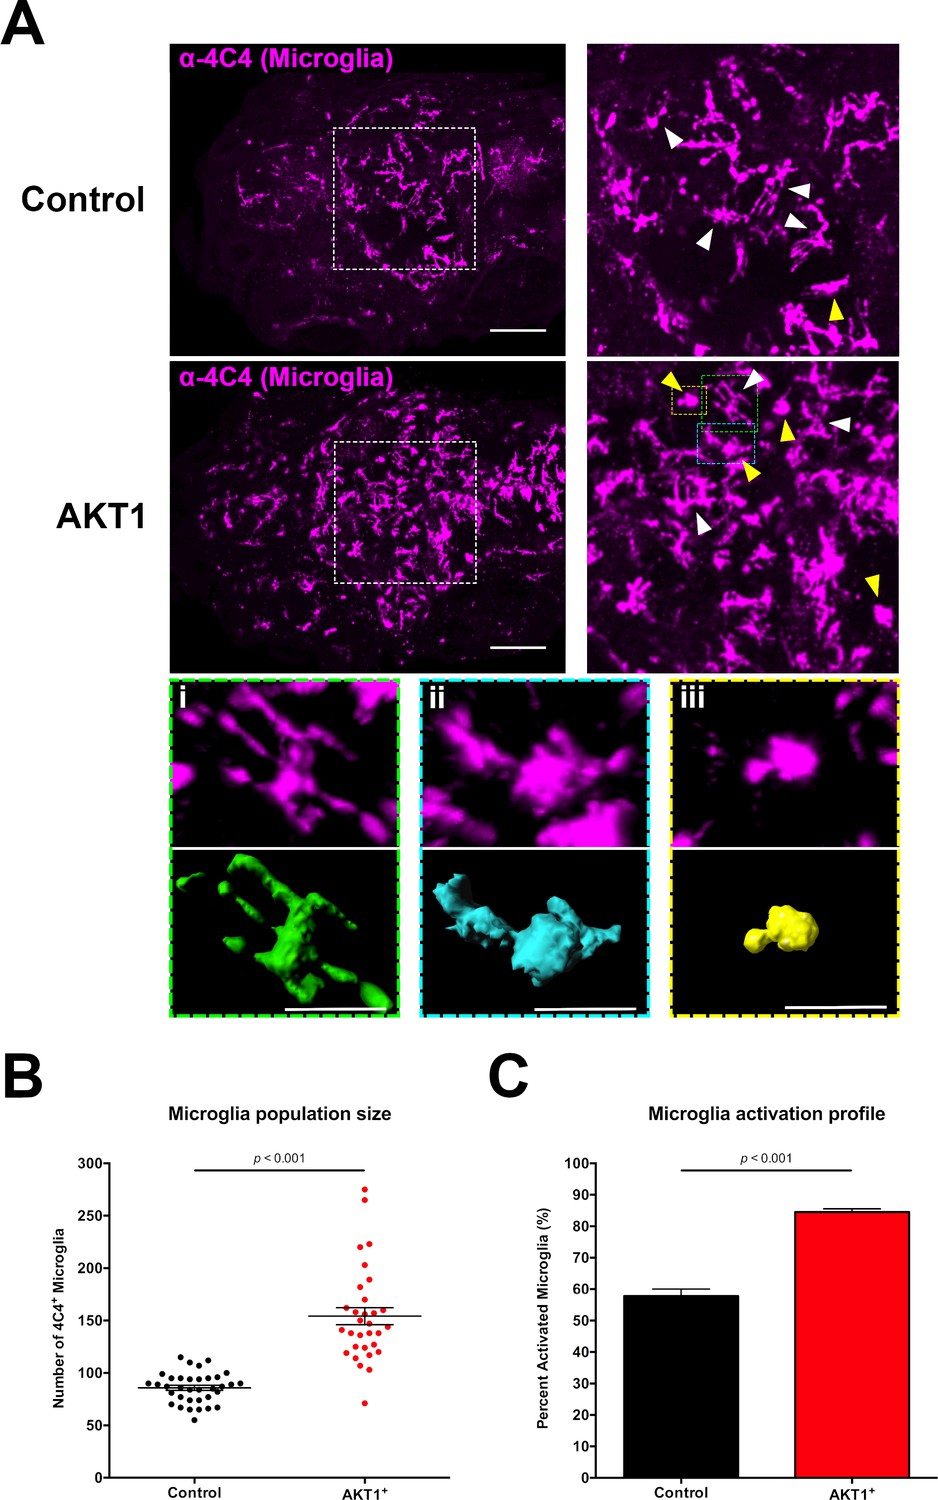
Induced transformation in AKT1-expressing cells leads to increased microglia numbers and microglial activation.
(A) Immunohistochemistry using the microglia-specific antibody (α−4C4) showed increased microglia numbers and increased microglial activation upon overexpression of AKT1. Representative confocal images of the larval zebrafish brain are shown. Upper panels: upon control RFP expression, lower panels: upon AKT1 overexpression. White arrows indicate ramified microglia; Yellow arrows indicate amoeboid microglia. (Ai)-(Aiii) Higher magnifications of cells in the green (i), blue (ii) and yellow (iii) outlined areas. Upper panel shows 4C4 immunohistochemistry, lower panel shows segmented images using the surface tool in Imaris. (i) Represents a ramified cell (surface/volume ratio ~1), (ii) shows an activated cell (surface/volume ratio ~0.8) and (iii) shows a fully activated (amoeboid) cell (surface/volume ratio ~0.6) (B) Quantification of the numbers of microglia in the brain in control and following AKT1 overexpression (Control: 85.8 ± 2.45, n = 35 larvae; Akt1: 154.2 ± 8.15, n = 31 larvae, p<0.001, N = 3). (C) Quantification of the percentage activation within the microglial population in control and AKT1-positive fish (Control: 57.8 ± 2.26%, n = 10 larvae; AKT1: 84.5 ± 1.07%, n = 14 larvae, p<0.001, N = 2). Error bars represent mean ±SEM. Images were captured using a Zeiss LSM710 confocal microscope with a 20X/NA 0.8 objective. Scale bars represent 100 µm.
Figure 3
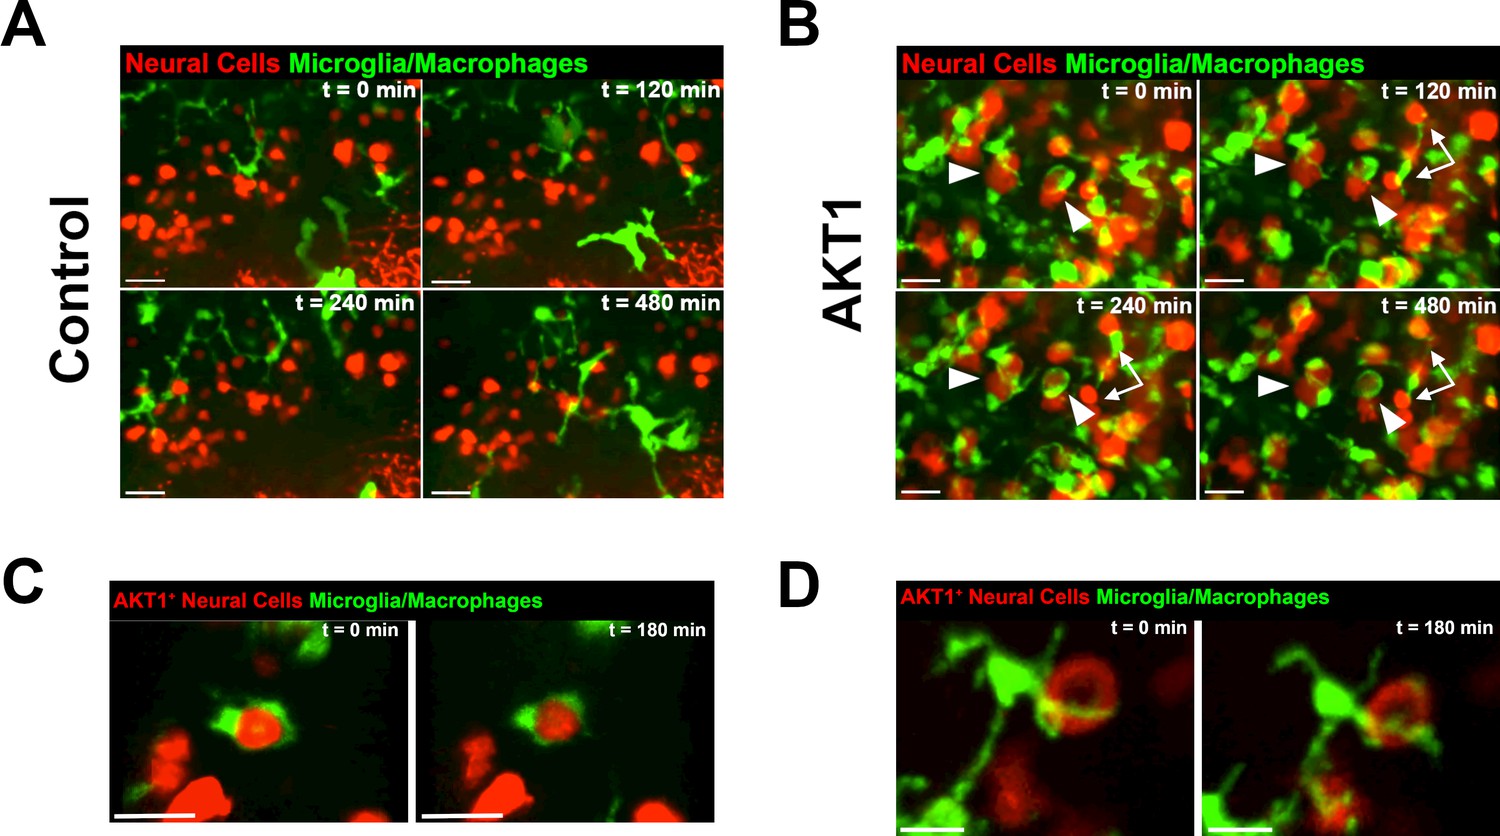
Microglia and macrophages show direct interactions with AKT1-expressing cells.
The Tg(mpeg1:EGFP) line was outcrossed with the Tg(NBT:∆LexPR-lexOP-pA) fish to create Tg(NBT:∆LexPR-lexOP-pA; mpeg1:EGFP) double transgenic fish, in which macrophages/microglia express EGFP under the mpeg1 promoter. In vivo time-lapse imaging was carried out over a period of 8 hr (480 min) at 8 dpf to observe microglia/macrophage behavior within the brain parenchyma. (A) Microglia/macrophages were observed to behave physiologically in the presence of RFP-expressing control cells. Representative confocal images are shown, recording times indicated. See also Video 1. (B) Following AKT1 overexpression, microglia/macrophages were observed to interact directly with the AKT1-expressing cells over long periods of time. Importantly, phagocytosis was not observed. Representative confocal images are shown, recording times indicated. See also Video 2. White arrows and arrowheads point at macrophages/microglia directly interacting with AKT1-expressing cells. (C), (D) Microglia interactions with AKT1-positive cells were targeted and also observed with isolated AKT1-positive cells. Representative confocal images are shown, recording times indicated. See also Videos 3 and 4. Images were captured using an Andor spinning disk confocal microscope with a 20X/NA 0.75 objective. Scale bars represent 30 µm.
Figure 4 with 1 supplement
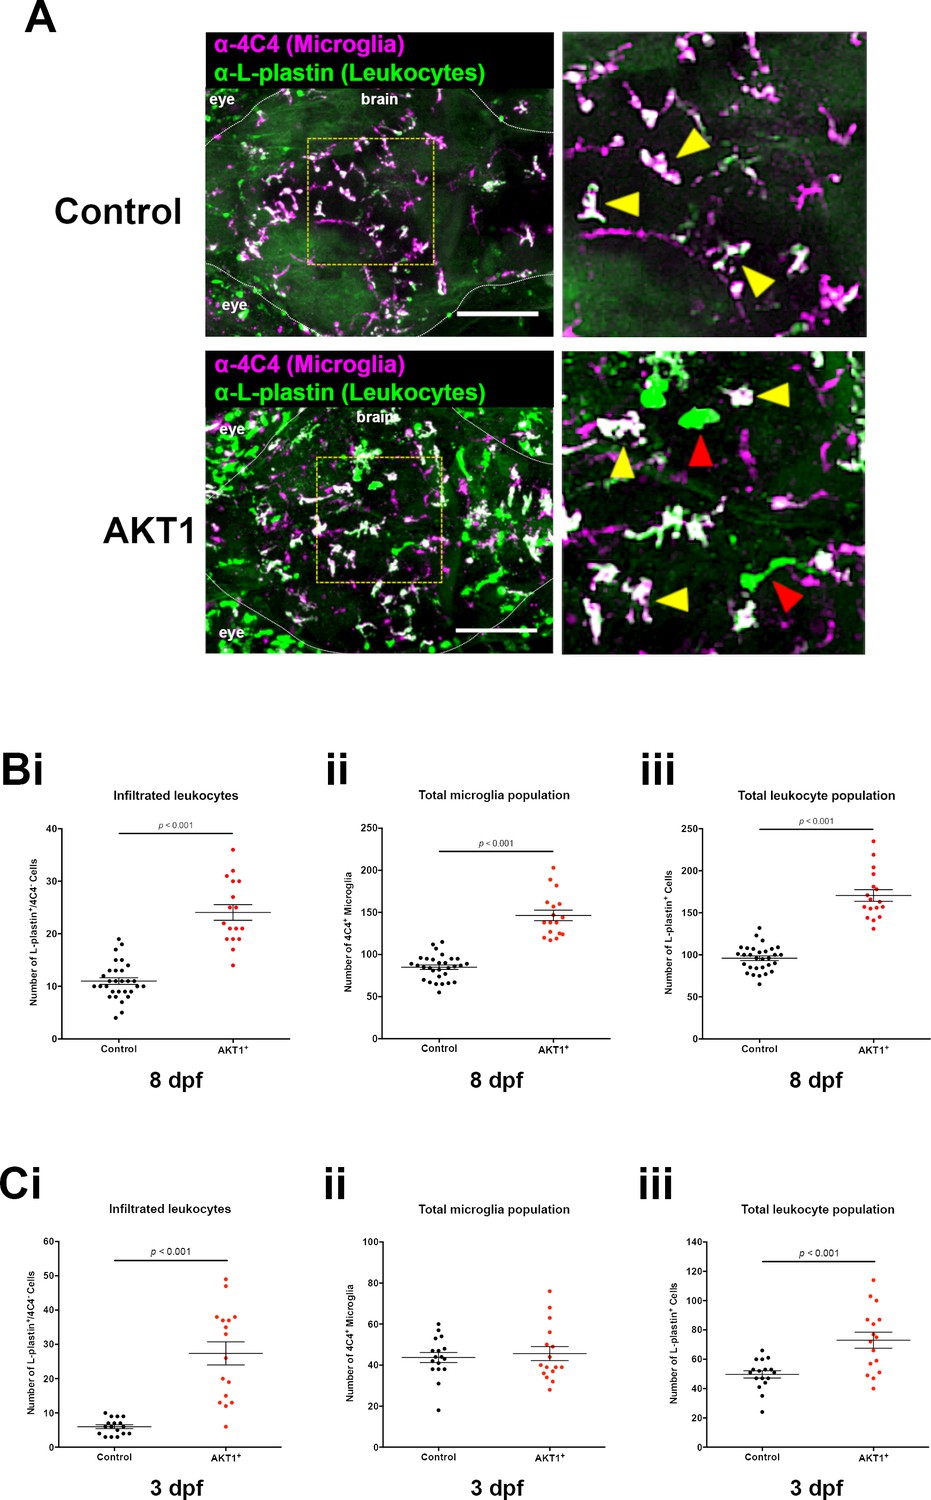
Infiltration of peripheral leukocytes into the brain parenchyma accounts for increased microglia numbers following AKT1 overexpression.
(A) Immunohistochemistry carried out using the α−4C4 antibody for microglia and α-L-plastin antibody for leukocytes to distinguish microglial cells (L-plastin+/4C4+; indicated by yellow arrows) from newly infiltrating leukocytes (L-plastin+/4C4-; indicated by red arrows). This analysis revealed increased infiltration of leukocytes into the brains of AKT1-positive fish. Representative confocal images of the larval zebrafish brain are shown. Upper panels: upon control RFP expression, lower panels: upon AKT1 overexpression. The dotted white line demarcates the brain parenchyma (Bi) Quantification of the number of infiltrated leukocytes (L-plastin+/4C4-) into the brain parenchyma in control and AKT1-positive larvae at 8 dpf (AKT1: 24.1 ± 1.48, n = 17 larvae, and 11.0 ± 0.64, n = 30 larvae in age-matched controls, p<0.001, N = 3). (Bii) Quantification of the total 4C4+ microglia population in control larvae and larvae following AKT1 overexpression at 8 dpf (Control: 85.0 ± 2.64, n = 30 larvae; AKT1: 146.5 ± 6.27, n = 17 larvae, N = 3). (Biii) Quantification of the total L-plastin+ leukocyte population in control larvae and larvae following AKT1 overexpression at 8 dpf (Control: 96.0 ± 2.77, n = 30 larvae; AKT1: 170.5 ± 6.95, n = 17 larvae, p<0.001, N = 3). (Ci) Quantification of the number of infiltrated leukocytes (L-plastin+/4C4-) into the brain parenchyma in control and AKT1-positive larvae at 3 dpf (Control: 6.0 ± 0.56, n = 17 larvae; AKT1: 27.4 ± 3.38, n = 16 larvae, p<0.001, N = 2). (Cii) Quantification of the total 4C4+ microglia population in control larvae and larvae following AKT1 overexpression at 3 dpf (Control: 43.7 ± 2.43, n = 17 larvae; AKT1: 45.6 ± 3.43, n = 16 larvae, p=1, N = 2). (Ciii) Quantification of the total L-plastin+ leukocyte population in control larvae and larvae following AKT1 overexpression at 3 dpf, (Control: 49.7 ± 2.47, n = 17 larvae; AKT1: 73.0 ± 5.47, n = 16 larvae, p<0.001, N = 2). Error bars represent mean ±SEM. Images were captured using a Zeiss LSM710 confocal microscope with a 20X/NA 0.8 objective. Scale bars represent 100 µm.
Figure 4—figure supplement 1
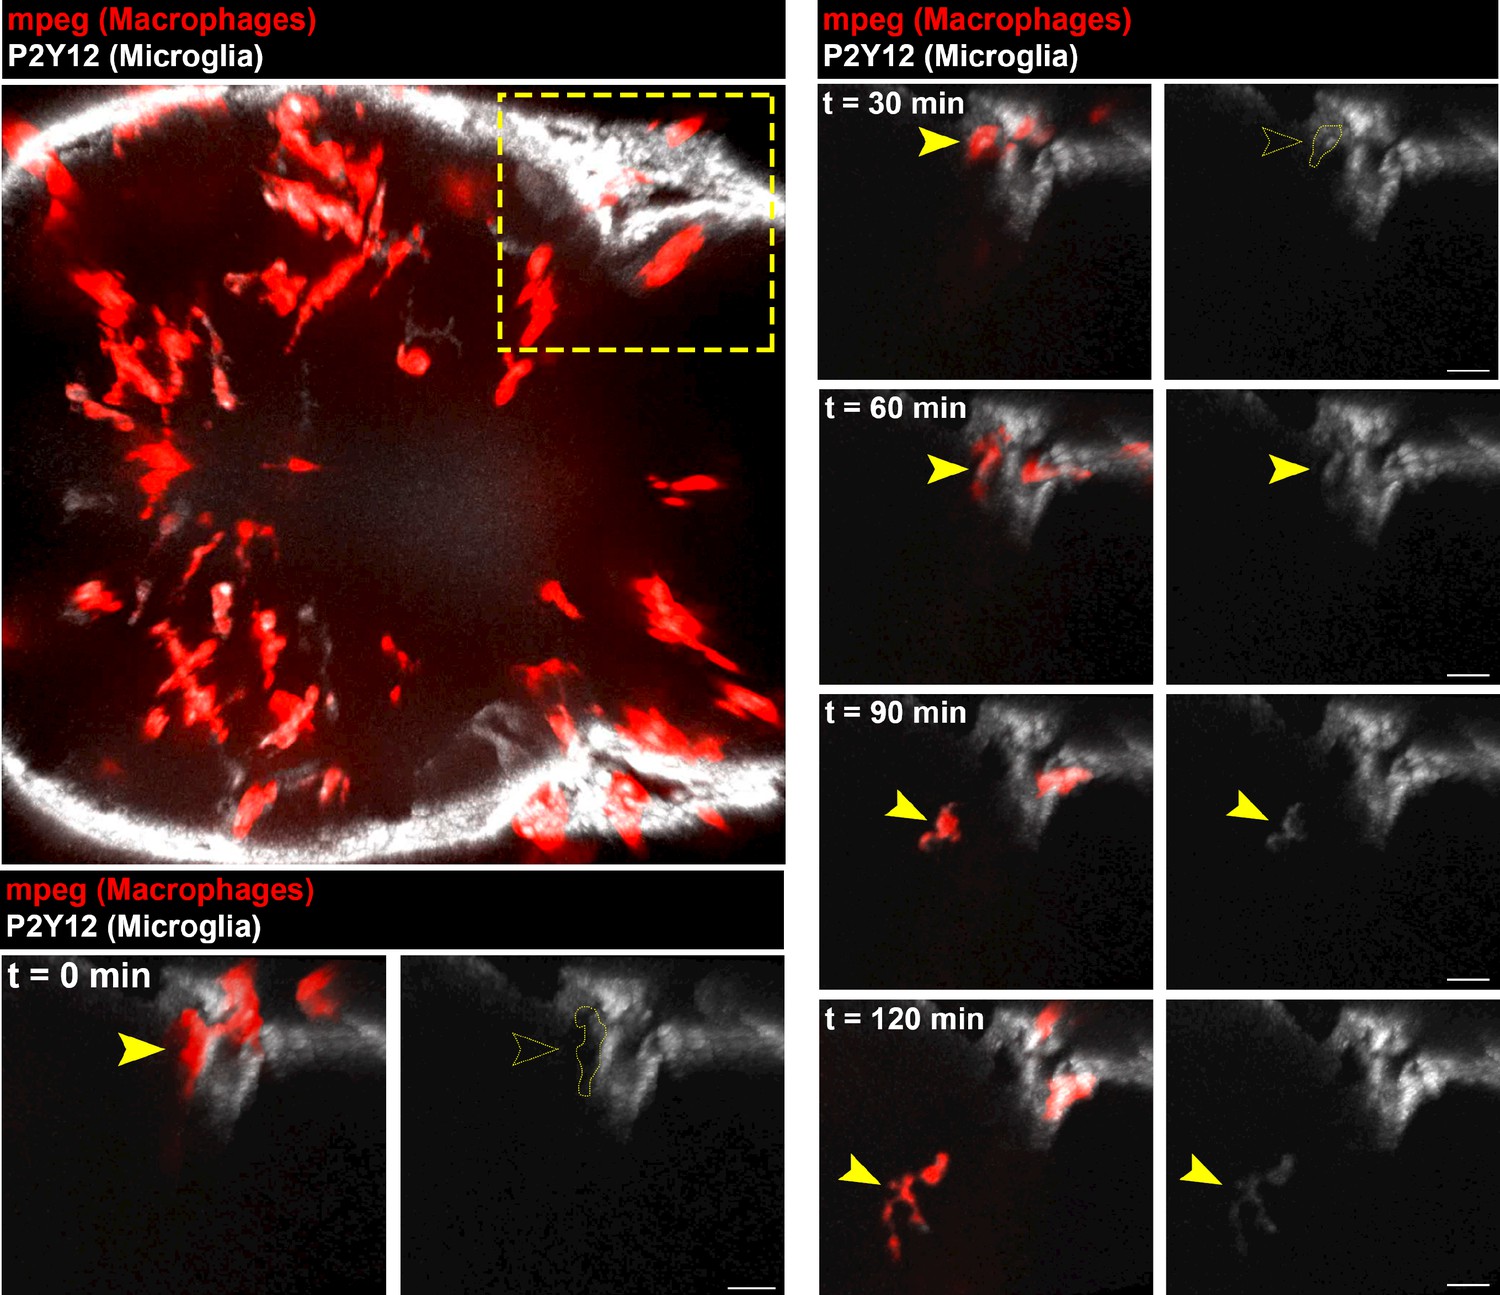
Macrophages infiltrate AKT1-positive brains and start expressing p2ry12.
The Tg(mpeg1:mCherry) line was outcrossed with the Tg(p2ry12:p2ry12-GFP) fish to create Tg(mpeg1:mCherry; p2ry12:p2ry12-GFP) double transgenic fish, in which all macrophages (including microglia) express mCherry under the mpeg1 promoter and microglia express in addition p2ry12-GFP under control of the p2ry12 promoter. Upon AKT1 overexpression, macrophages (red) were observed to infiltrate the brain and start to express p2ry12:p2ry12-GFP (white). In vivo time-lapse imaging was carried out over a period of 2 hr (126 min) at 5.5 dpf to observe macrophage infiltration into the brain parenchyma. Upper left image shows a dorsal view on the larval tectum and cerebellum, dashed yellow line highlights the area of infiltration, which is shown at different time points in higher magnification (recording times indicated). Dotted yellow line at t = 0 min and t = 30 min demarcates position of the mCherry-positive macrophage that is negative for P2ry12-GFP at these time points. Yellow arrowheads highlight the position of the infiltrating macrophage at all time points. See also Video 5. Images were captured using an Andor spinning disk confocal microscope with a 20X/NA 0.75 objective. Scale bars represent 10 µm.
Figure 5 with 1 supplement
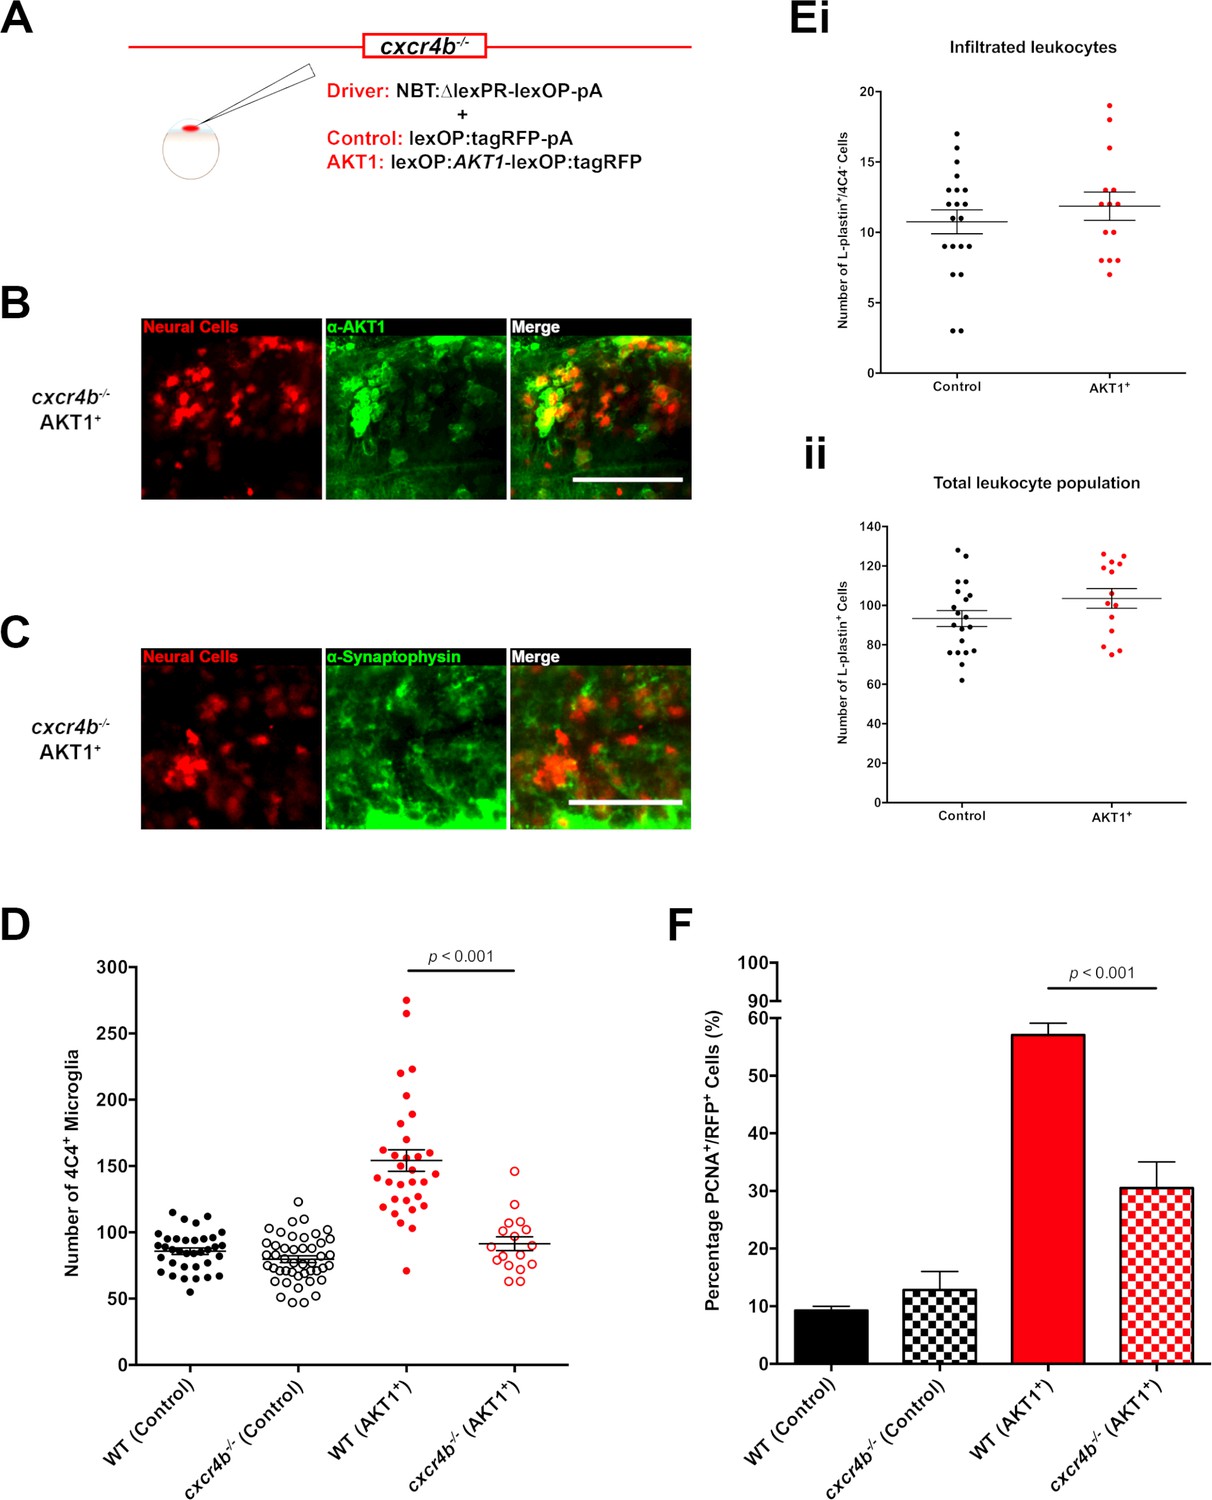
Cxcr4b signaling is required for the increase in microglia numbers following AKT1 overexpression.
(A) To achieve expression in neural cells in the cxcr4b-/- mutant zebrafish line, a driver plasmid containing the NBT promoter (NBT:∆lexPR-lexOP-pA) was co-injected together with either a lexOP:AKT1-lexOP:tagRFP plasmid to induce AKT1 expression or together with a lexOP:tagRFP-pA plasmid to achieve control RFP expression. Immunohistochemistry expression of (B) the human AKT1 protein and (C) Synaptophysin in the AKT1-expressing cells in the cxcr4b-/- mutant fish at 8 dpf. (D) Quantification of the number of microglia in wild-type (WT)(cxcr4b+/+) controls, cxcr4b-/- controls, and following AKT1 overexpression in WT larvae and cxcr4b-/- fish at 8 dpf (WT AKT1: 154.2 ± 8.15, n = 31 larvae; cxcr4b-/- AKT1: 91.4 ± 5.22, n = 17 larvae, p<0.001, N = 3). (Ei) Quantification of the number of infiltrated leukocytes (L-plastin+/4C4-) into the brain parenchyma in control and AKT1-positive cxcr4b-/- fish at 8 dpf (cxcr4b-/- Control: 10.8 ± 0.85, n = 20 larvae; cxcr4b-/- AKT1: 11.9 ± 1.00, n = 14 larvae, p=0.408 (n.s.), N = 3). (Eii) Quantification of the total L-plastin+ leukocyte population in control cxcr4b-/- larvae and following AKT1 overexpression at 8 dpf (cxcr4b-/- Control: 93.4 ± 4.05, n = 20 larvae; cxcr4b-/- AKT1: 103.5 ± 5.00, n = 14 larvae, p=0.122 (n.s.), N = 3). (F) Quantification of the level of proliferation rates in control-RFP and AKT1-expressing cells in WT and cxcr4b-/- fish at 8 dpf (WT AKT1: 57.1 ± 2.03%, n = 17 larvae, cxcr4b-/- AKT1: 30.5 ± 4.53%, n = 5 larvae, p<0.001, N = 2). Error bars represent mean ±SEM. Images were captured using a Zeiss LSM710 confocal microscope with a 20X/NA 0.8 objective. Scale bars represent 100 µm.
Figure 5—figure supplement 1
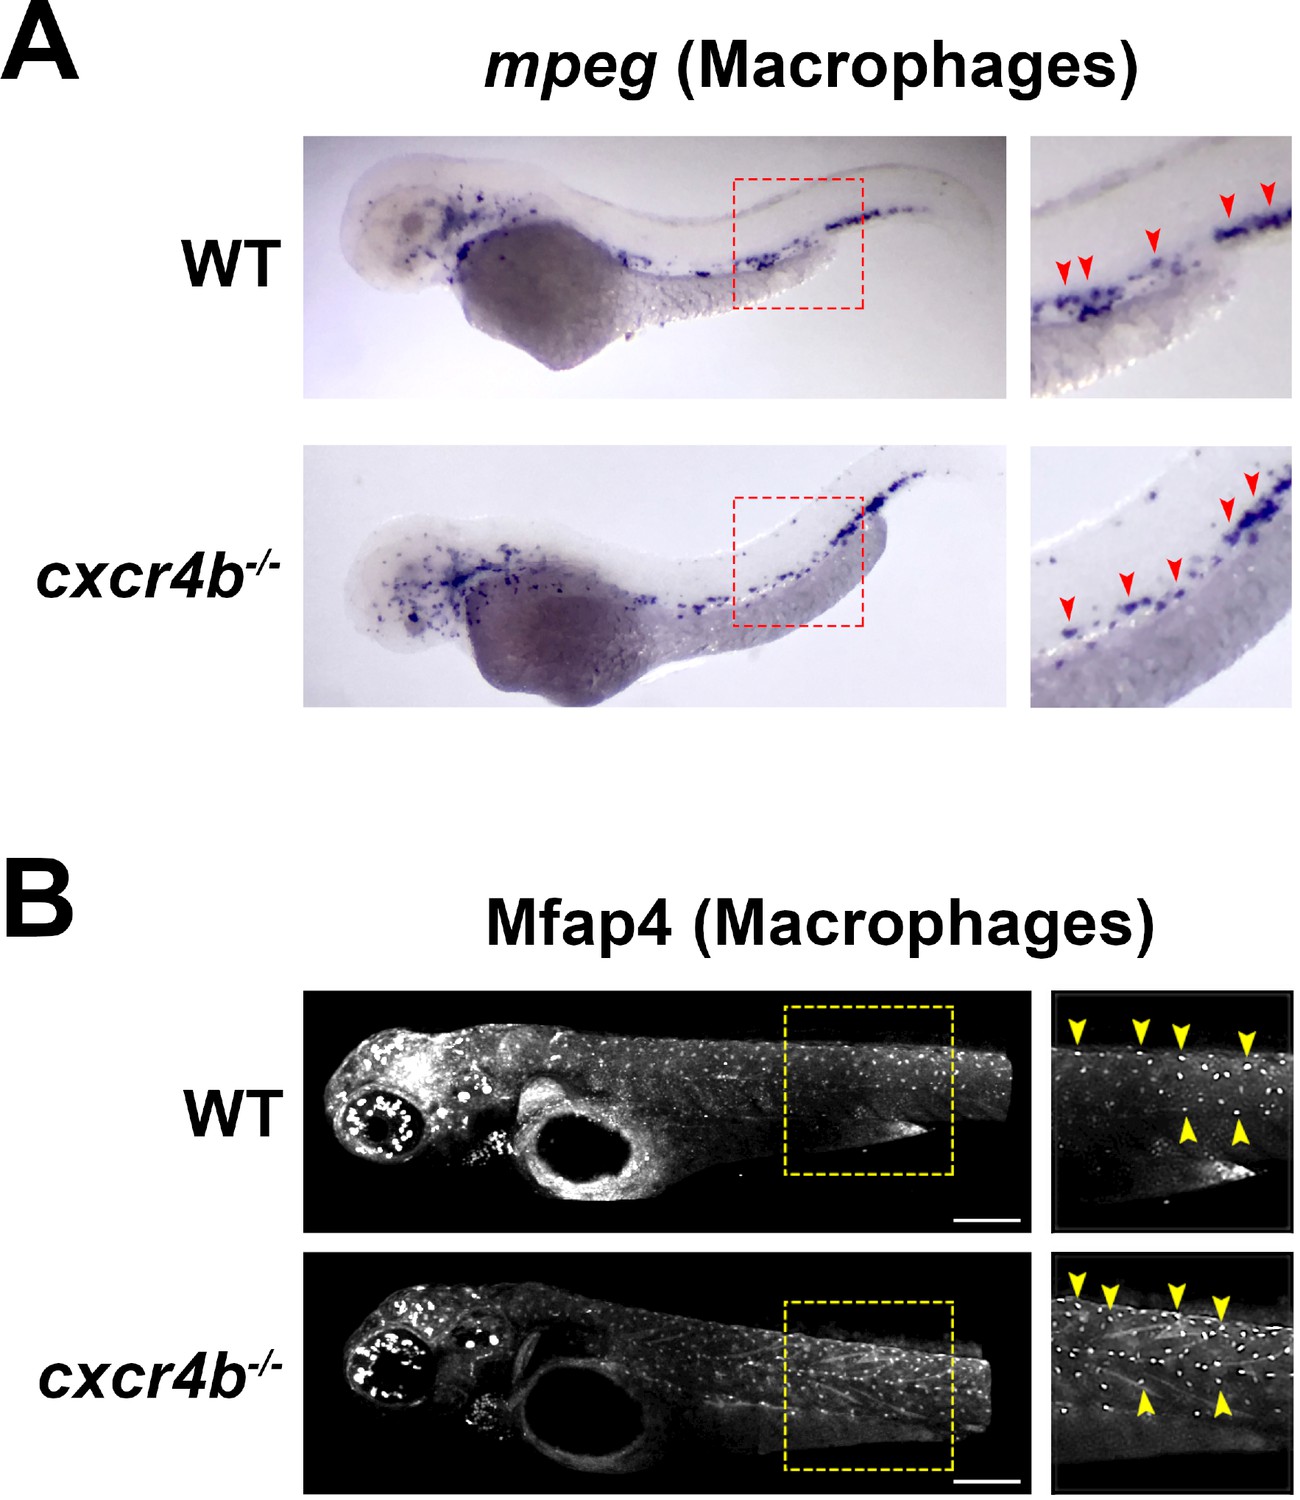
Cxcr4b-/- zebrafish larvae show a normal distribution of macrophages.
(A) In situ hybridization for mpeg1 at 3 dpf. cxcr4b-/- larvae (lower panel) show a normal distribution of macrophages compared to wild-type larvae (upper panel). (B) Mfap4 immunohistochemistry confirms the normal distribution of macrophages in cxcr4b-/- larvae (lower panel) compared to wild-type larvae (upper panel).
Figure 6

Cxcr4b signaling in macrophages is required for the increase in microglia numbers upon AKT1 transformation in the brain.
(A) To rescue Cxcr4b expression in macrophages or neural cells in the cxcr4b-/- mutant fish, a cell-specific rescue construct was injected in addition to the NBT driver and lexOP:tagRFP-pA/lexOP:AKT1-lexOP:RFP constructs. Cxcr4b expression was recovered in macrophages through the mpeg1 promoter (‘macrophage’ rescue) via a mpeg1:cxcr4b-pA construct. The expression of cxcr4b in neural cells (‘Neural’ rescue) was rescued through the lexOP:cxcr4b-pA construct. (B) Immunohistochemistry using a Cxcr4b antibody showed that Cxcr4b expression is completely absent in microglia and neural cells in the cxcr4b-/- fish (upper panels). Cxcr4b expression is partially recovered following the respective rescue conditions (lower panels). (C) Quantification of the number of microglia in cxcr4b-/- mutants overexpressing AKT1 before, and after Cxcr4b rescue in macrophages (‘Macrophage’ rescue: 119.5 ± 4.59, n = 28 vs cxcr4b-/- Akt1: 91.4 ± 5.22, n = 17; p<0.001, N = 39) and in neural cells (‘Neural’ rescue: 92.2 ± 4.40, n = 27, p=1 (n.s.), N = 3). (D) Quantification of the level of proliferation of AKT1-expressing cells in cxcr4b-/- mutants overexpressing AKT1 before, and after Cxcr4b rescue in macrophages (‘Macrophage’ rescue: 37.8 ± 1.45%, n = 45 larvae, vs cxcr4b-/- AKT1: 22.1 ± 1.73%, n = 27 larvae p<0.001, N = 3) and in neural cells (‘Neural’ rescue: 23.8 ± 2.08%, n = 22 larvae, vs cxcr4b-/- AKT1: 22.1 ± 1.73%, n = 27 larvae, p=1.00 (n.s.), N = 3). Error bars represent mean ±SEM. Images were captured using a Zeiss LSM710 confocal microscope with a 20X/NA 0.8 objective. Scale bars represent 100 µm.
Figure 7
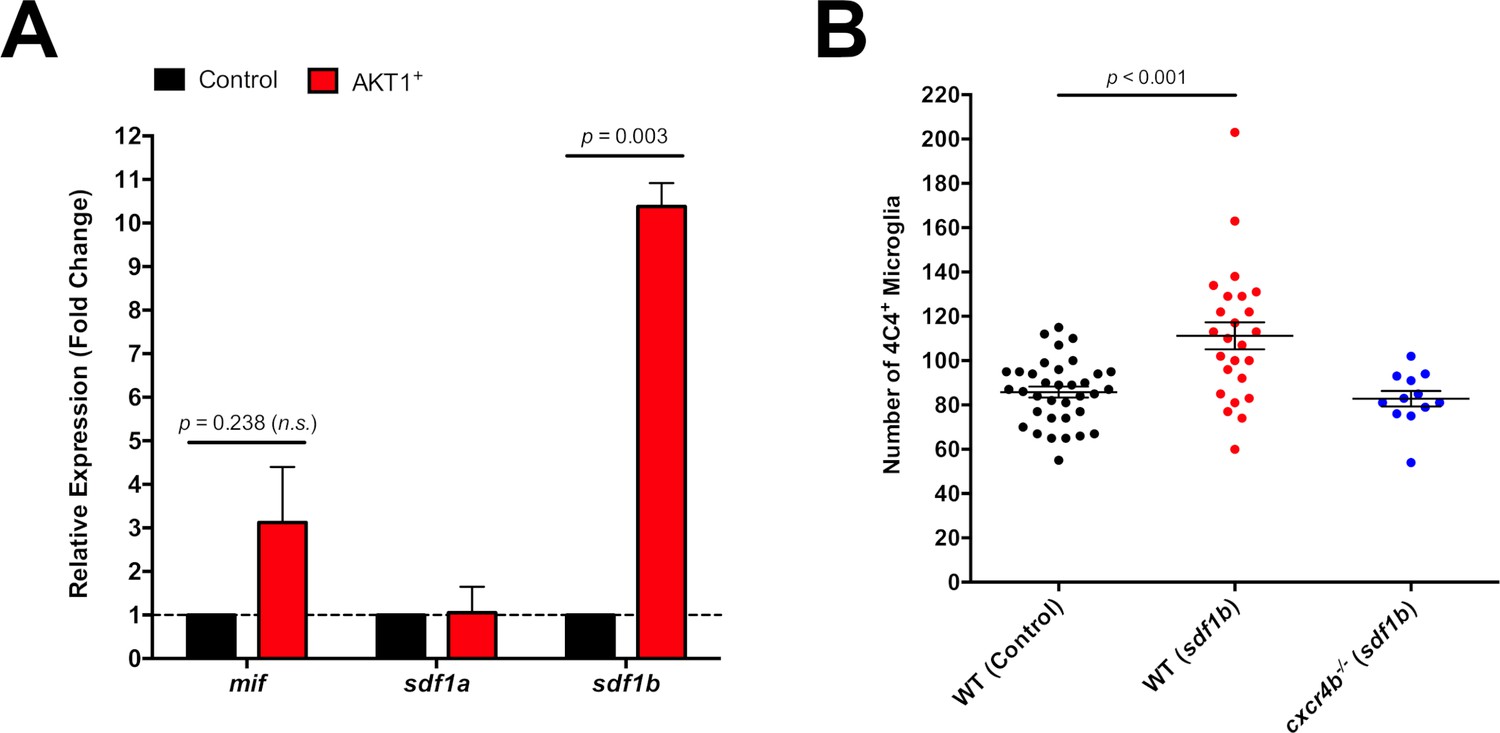
High levels of Sdf1b produced by AKT1-expressing cells lead to increased microglia numbers.
(A) mRNA expression levels of mif, sdf1a, and sdf1b in AKT1-RFP+ cells determined by qPCR (N = 3 for each gene). Fold change was measured in relation to control-RFP+ cells using the comparative (∆∆CT) method. (B) Quantification of the number of microglia in control WT larvae, and following Sdf1b overexpression in both WT fish (WT Control: 85.8 ± 2.45, n = 35 larvae; WT Sdf1b: 111.0 ± 6.08, n = 25 larvae, p<0.001, N = 3) and cxcr4b-/- mutants (cxcr4b-/- Sdf1b: 82.8 ± 3.51, n = 12, p=0.225 (n.s.), N = 3). Error bars represent mean ±SEM.
Figure 8
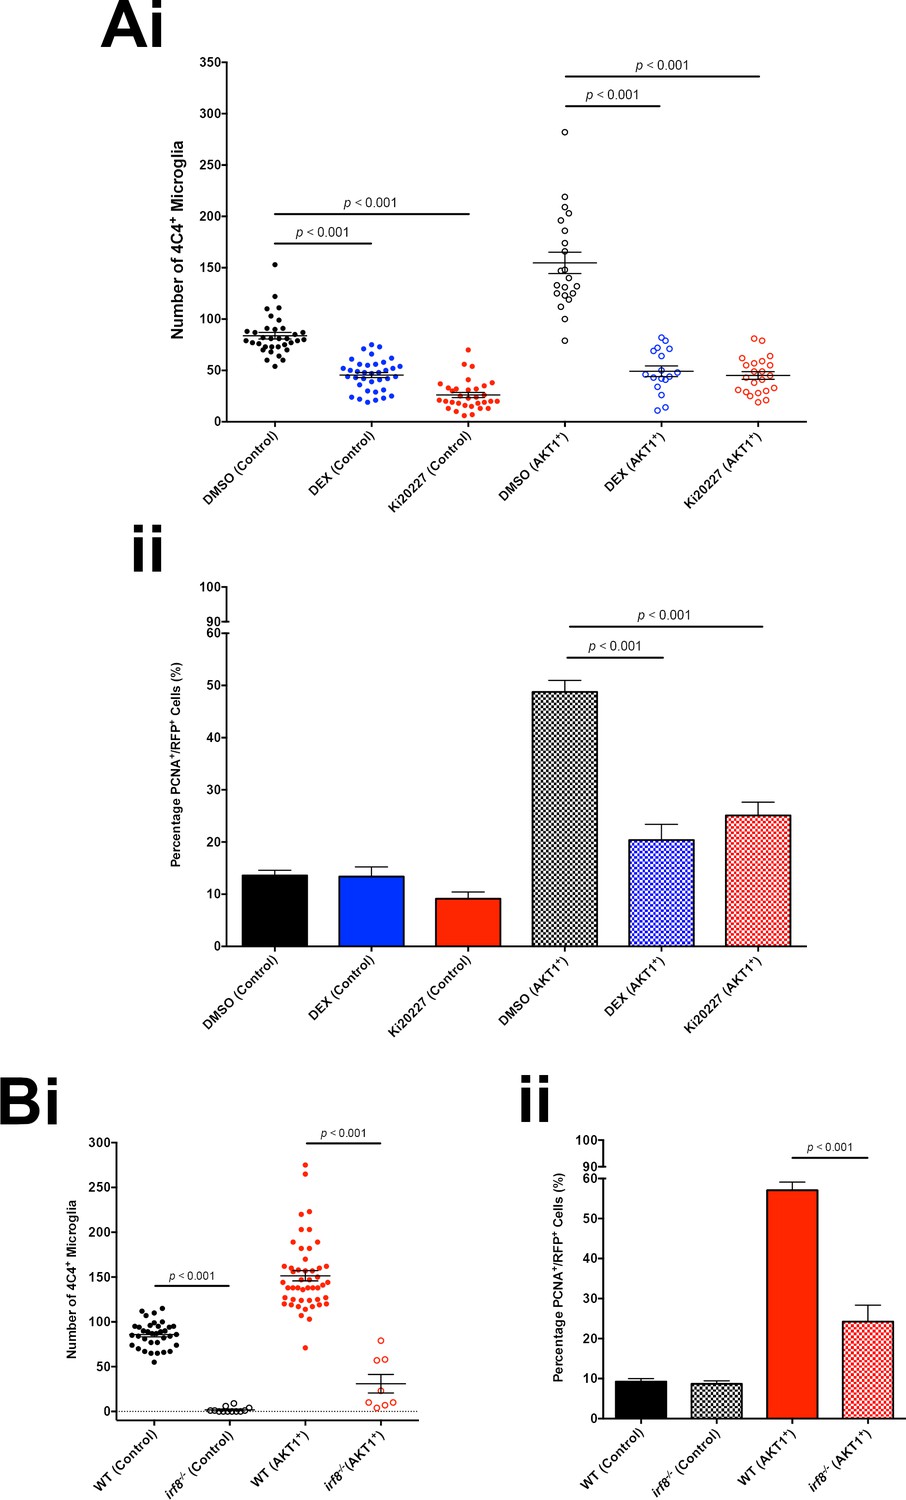
Microglia promote proliferation of AKT1-expressing cells.
(A) Treatment with the immunosuppressant Dexamethasone (DEX) and the CSF-1R inhibitor Ki20227 led to reduced microglia numbers and proliferation rates of AKT1-expressing cells in the zebrafish larvae. (i) Quantification of the number of microglia in control and upon AKT1 overexpression in DMSO controls and fish treated with DEX (DMSO Control: 83.8 ± 3.29, n = 34 larvae; DEX Control: 45.5 ± 2.53, n = 36 larvae, p<0.001, N = 3; DMSO AKT1: 154.7 ± 10.38, n = 21 larvae; DEX AKT1: 49.2 ± 5.16, n = 17 larvae, p<0.001, N = 3) and fish treated and Ki20227 (DMSO Control: 83.8 ± 3.29, n = 34 larvae; Ki20227 Control: 26.1 ± 2.55, n = 32 larvae, p<0.001, N = 3; DMSO AKT1: 154.7 ± 10.38, n = 21 larvae; Ki20227 AKT1: 45.1 ± 3.75, n = 22 larvae, p<0.001, N = 3) (ii) Quantification of the level of proliferation of RFP-expressing cells in control and AKT1 overexpression in DMSO controls and fish treated with DEX (DMSO Control: 13.6 ± 1.01%, n = 20; DEX Control: 13.4 ± 1.85%, n = 15 larvae, p=1.00 (n.s.), N = 3; DMSO AKT1: 48.8 ± 2.23%, n = 20 larvae; DEX AKT1: 20.4 ± 3.02%, n = 11 larvae, p<0.001, N = 3) and fish treated with Ki20227 (DMSO Control: 13.6 ± 1.01%, n = 20 larvae; Ki20227 Control: 9.14 ± 1.30%, n = 17 larvae, p=1.00 (n.s.), N = 3; DMSO AKT1: 48.8 ± 2.23%, n = 20 larvae; Ki20227 AKT1: 25.1 ± 2.54%, n = 20 larvae, p<0.001, N = 3) Error bars represent mean ±SEM. (B) irf8-/- zebrafish larvae showed reduced microglia numbers and proliferation rates of AKT1-expressing cells. (i) Quantification of the number of microglia in control and AKT1-positive brains in wt and irf8-/- mutant zebrafish larvae (Control WT: 85.8 ± 2.45, n = 35 larvae; Control irf8-/-: 6.25 ± 2.76, n = 20 larvae, N = 3, p<0.001) (AKT1 WT: 151.4 ± 5.70, n = 48 larvae; AKT1 irf8-/-: 31.0 ± 10.32, n = 8 larvae, p<0.001, N = 3). (ii) Quantification of the level of proliferation of RFP-expressing cells in control and AKT1-positive brains in wt and irf8-/- mutant zebrafish larvae (Control WT: 9.25 ± 0.75%, n = 13; Control irf8-/-: 8.69 ± 0.76%, n = 12, p<1.00 (n.s.), N = 3) (AKT1 WT: 57.1 ± 2.03%, n = 17; AKT1 irf8-/-: 24.3 ± 4.11%, n = 8, p<0.001, N = 3).
Videos
Video 1
Microglia/macrophage responses to control-RFP cells (REF to Figure 2).
In vivo time-lapse movie showing representative microglia/macrophage (green) behavior in the presence of control cells (red). Images were acquired every 6 min over the duration of 8 hr (480 min) using an Andor spinning disk confocal microscope with a 20x/0.75 objective, n = 7 larvae analyzed. Scale bar represents 30 µm.
Video 2
Microglia/macrophages display close interactions with AKT1+ cells (REF to Figure 2).
In vivo time-lapse movie showing representative microglia/macrophage (green) behavior in the presence of AKT1+ cells (red). Compared to controls (REF Video 1), microglia/macrophages were observed to interact closely with AKT1+ cells over long periods of time. Images were acquired every 6 min over the duration of 8 hr (480 min) using an Andor spinning disk confocal microscope with a 20x/0.75 objective, n = 9 larvae analyzed. Scale bar represents 30 µm.
Video 3
Microglia/macrophages display close interactions with isolated AKT1+ cells (REF to Figure 2).
In vivo time-lapse movie showing representative microglia/macrophage (green) behavior in the presence of isolated AKT1+ cells (red). Microglia/macrophages were observed to flatten their surfaces around the cellular surfaces of AKT1+ cells over long periods of time. Images were acquired every 5 min over the duration of 3 hr (182 min) using an Andor spinning disk confocal microscope with a 20x/0.75 objective. Scale bar represents 20 µm.
Video 4
Microglia/macrophages display constant interactions with isolated AKT1+ cells (REF to Figure 2).
In vivo time-lapse movie showing representative microglia/macrophage (green) behavior in the presence of isolated AKT1+ cells (red). Microglia/macrophages were observed to constantly extend and retract processes toward cellular surfaces of AKT1+ cells over long periods of time. Images were acquired every 6 min over the duration of 3 hr (180 min) using an Andor spinning disk confocal microscope with a 20x/0.75 objective. Scale bar represents 20 µm.
Video 5
Macrophages start expressing p2ry12 upon infiltration into AKT1-positive brains.
In vivo time-lapse movie showing macrophage (red) infiltration and activation of p2ry12 expression (white) in AKT1-positive brains. Macrophages (red) were observed at the dorsal periphery infiltrating into the brain parenchyma. Immediately upon infiltration macrophages started expressing p2ry12 (white). Images were acquired every 6 min over the duration of 2 hr (126 min) using an Andor spinning disk confocal microscope with a 20x/0.75 objective. Scale bar represents 10 µm.
Tables
Key resources table
| Reagent type (species) or resource | Designation | Source or reference | Identifiers | Additional information |
|---|---|---|---|---|
| Antibody | Anti-4C4 (mouse monoclonal) | Becker Laboratory, University of Edinburgh | (1:50) | |
| Antibody | Anti-AKT1 (rabbit polyclonal) | Fisher Scientific | Fisher Scientific: PA5-29169, RRID:AB_557535 | (1:100) |
| Antibody | Anti-Cxcr4b (rabbit polyclonal) | Abcam | abcam: ab111053, RRID:AB_10860813 | (1:100) |
| Antibody | Anti-GFAP (rabbit polyclonal) | Becker Laboratory, University of Edinburgh | (1:500) | |
| Antibody | Anti-L-plastin (rabbit polyclonal) | Feng Laboratory, University of Edinburgh | (1:500) | |
| Antibody | Anti-Mfap4 (rabbit polyclonal) | Becker Laboratory, University of Edinburgh | (1:500) | |
| Antibody | Anti-PCNA (rabbit polyclonal) | Abcam | abcam: ab18197, RRID:AB_2160346 | (1:300) |
| Antibody | Anti-Sox2 | Abcam | abcam: ab97959, RRID:AB_2341193 | (1:200) |
| Antibody | Anti-Synaptophysin (rabbit polyclonal) | Abcam | abcam: ab32594, RRID:AB_765072 | (1:100) |
| Antibody | Alexa 488- or 647 secondaries | Life Technologies | Life Technologies: A11001 (RRID:AB_138404), A21235 (RRID:AB_141693), A11008 (RRID:AB_143165), A21244 (RRID:AB_141663) | (1:200) |
| Chemical compound, drug | Dexamethasone (DEX) | Sigma-Aldrich | Sigma-Aldrich: D1756 | 100 µM, 1% DMSO |
| Chemical compound, drug | Ki20227 | Tocris | Tocris: 4481 | 25 µM, 1% DMSO |
| commercial assay or kit | Quant-iT RiboGreen RNA Assay Kit | Invitrogen | Invitrogen: R11490 | |
| Commercial assay or kit | RNeasy Plus Micro Kit | QIAGEN | QIAGEN: 74034 | |
| Commercial assay or kit | SsoAdvanced Universal SYBR Green Supermix | Bio-Rad | Bio-Rad: 1725271 | |
| Commercial assay or kit | SuperScript III First-Strand Synthesis System | Invitrogen | Invitrogen: 18080–051 | |
| Gene (Homo sapiens) | AKT1 | NA | ENSG00000142208 | |
| Gene (Danio rerio) | cxcr4b | NA | ZDB-GENE-010614–1 | |
| Gene (D. rerio) | sdf1b (cxcl12b) | NA | ZDB-GENE-030721–1 | |
| Gene (D. rerio) | mpeg1 | NA | ZDB-GENE-030131–7347 | |
| Recombinant DNA reagent | pDEST (Gateway vector) | Invitrogen | ||
| Recombinant DNA reagent | lexOP-AKT1-RFP (plasmid) | this paper | lexOP:AKT1-lexOP:tagRFP | Gateway vector: pDEST |
| Recombinant DNA reagent | lexOP-AKT1-BFP (plasmid) | this paper | lexOP:AKT1-lexOP:tagBFP | Gateway vector: pDEST |
| Recombinant DNA reagent | lexOP-cxcr4b (plasmid) | this paper | lexOP:cxcr4b-pA | Gateway vector: pDEST |
| Recombinant DNA reagent | lexOP-sdf1b (plasmid) | this paper | lexOP:sdf1b-lexOP:tagRFP | Gateway vector: pDEST |
| Recombinant DNA reagent | lexOP-tagRFP (plasmid) | this paper | lexOP:tagRFP-pA | Gateway vector: pDEST |
| Recombinant DNA reagent | lexOP-tagBFP (plasmid) | this paper | lexOP:tagBFP-pA | Gateway vector: pDEST |
| Recombinant DNA reagent | mpeg1-cxcr4b (plasmid) | this paper | Mpeg1:cxcr4b-pA | Gateway vector: pDEST |
| Strain, strain background (D. rerio) | cxcr4b-/- | PMID: 16678780 | cxcr4bt26035/t26035, RRID:ZFIN_ZDB-GENO-100427-6 | |
| Strain, strain background (D. rerio) | irf8-/- | PMID: 25615614 | irf8st95/st95, RRID:ZFIN_ZDB-GENO-150504-12 | |
| Strain, strain background (D. rerio) | mpeg1:EGFP | PMID: 21084707 | Tg(mpeg1:EGFP)gl22, RRID:ZIRC_ZL9940 | |
| Strain, strain background (D. rerio) | mpeg1:mCherry | PMID: 21084707 | Tg(mpeg1:mCherry)gl23, RRID:ZIRC_ZL9939 | |
| Strain, strain background (D. rerio) | NBT:∆lexPR-lexOP-pA | this paper | Tg(XIa.Tubb:LEXPR)Ed7, ZDB-ALT-180108–4 | |
| Strain, strain background (D. rerio) | p2ry12:p2ry12-GFP | PMID: 22632801 | TgBAC(p2ry12:p2ry12-GFP)hdb3, RRID:ZFIN_ZDB-ALT-121109-2 | |
| Software, algorithm | Imaris 8.0.2 | Bitplane | RRID:SCR_007370 | |
| Software, algorithm | LightCycler 96 Software | Roche | RRID:SCR_012155 |
Additional files
-
Transparent reporting form
- https://doi.org/10.7554/eLife.31918.019
Download links
A two-part list of links to download the article, or parts of the article, in various formats.
Downloads (link to download the article as PDF)
Open citations (links to open the citations from this article in various online reference manager services)
Cite this article (links to download the citations from this article in formats compatible with various reference manager tools)
Tumor initiating cells induce Cxcr4-mediated infiltration of pro-tumoral macrophages into the brain
eLife 7:e31918.
https://doi.org/10.7554/eLife.31918


