Serotonin enhances excitability and gamma frequency temporal integration in mouse prefrontal fast-spiking interneurons
- University of California, San Francisco, United States
Figures
Figure 1 with 3 supplements
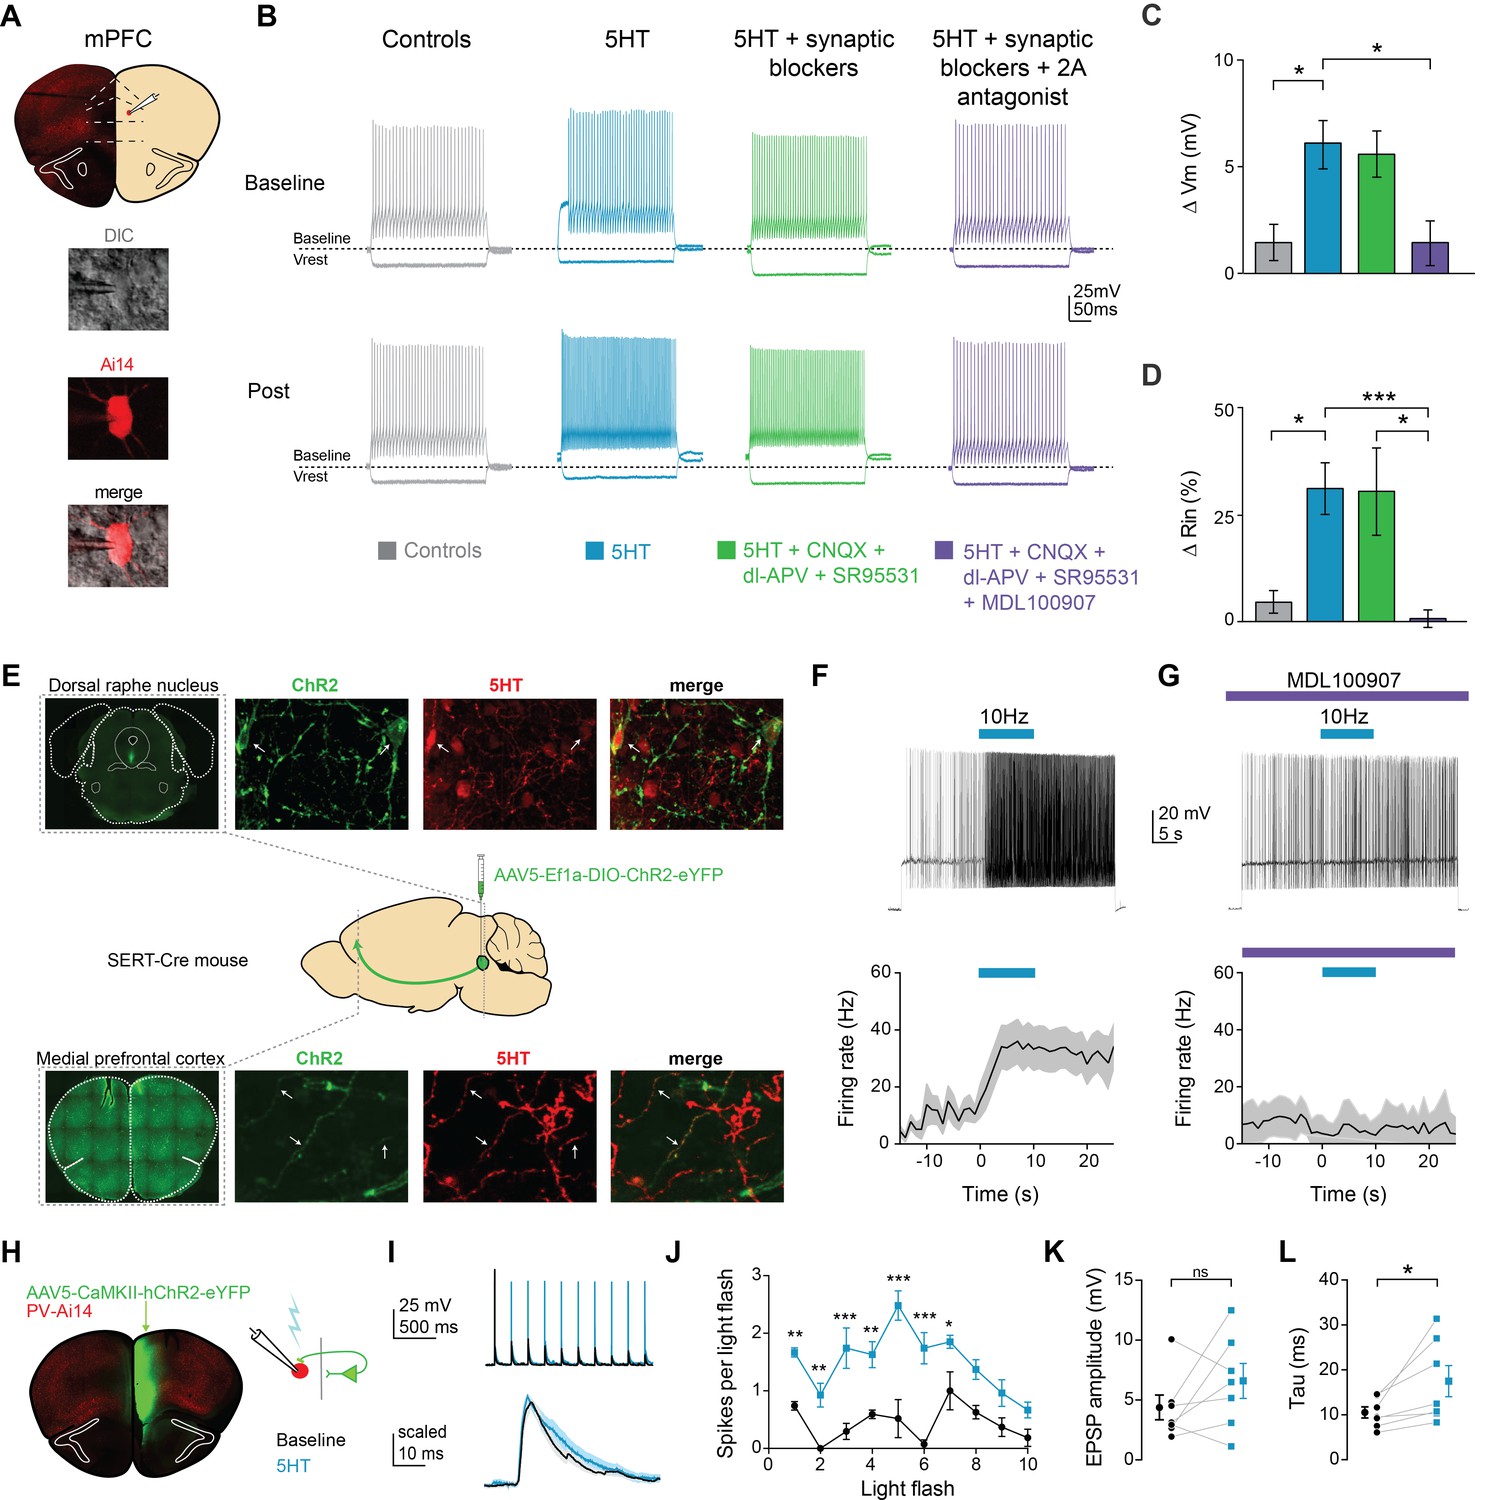
Serotonin alters intrinsic properties to increase FSI excitability.
(A) Experimental design: we recorded from fast-spiking interneurons labeled in a PV-Cre:: Ai14 in mPFC (top). Images of a recorded neuron in DIC and showing tdTomato expression (bottom). (B) Example FSI responses to hyperpolarizing (−200 pA) and depolarizing (50 pA above rheobase) current steps at baseline and after application (Post, 10 min after drug wash in) of 5HT (30 µM, blue), 5HT + synaptic blockers (10 uM CNQX, 100 uM DL-AP5, 10 uM gabazine, green), 5HT + synaptic blockers+5HT2A antagonist (1 uM MDL-100907, purple), or time-locked control aCSF (gray). (C–D) Subtracted change in membrane potential (C) and percent change in input resistance (D) after pharmacological manipulations listed above. (E) Experimental design: Cre-dependent ChR2 was injected into the dorsal raphe of SERT-Cre mice. Top and bottom rows: Images of ChR2 expression and 5HT immunohistochemistry in dorsal raphe injection side (top) and mPFC recording site (bottom). Confocal images of ChR2 (green), 5HT immunohistochemistry (red), and merged. Yellow sections indicate overlap. Arrows point to examples of overlap. (F) Top: FSIs in mPFC were injected with light depolarizing current to elicit spiking and ChR2 expressing terminals were activated with blue light (10 Hz, 10 s) to release endogenous 5HT (top). Bottom: Peristimulus time histograms of FSI firing rate during current step with ChR2-activated release of 5HT (G) These experiments were repeated after washing in a 5HT2A antagonist (1 uM MDL100907). (H) Experimental design: ChR2 was injected into one hemisphere of mPFC and FSIs were patched on the opposite hemisphere. (I) Example traces of FSI responses at baseline (black) and after 5HT (blue) in response to activation of synaptic inputs from ChR2-expressing terminals with either a train of blue light pulses (5 Hz, 2 mW, top) or single light flashes (0.5–1 mW, bottom). (J) Number of spikes fired in response to each light flash in the stimulus train depicted before and after application of 5HT. (K–L) Change in amplitude (K) and decay time constant (tau, (L) of synaptic responses before (black) and after 5HT (blue). *p<0.05, **p<0.01.
Figure 1—figure supplement 1
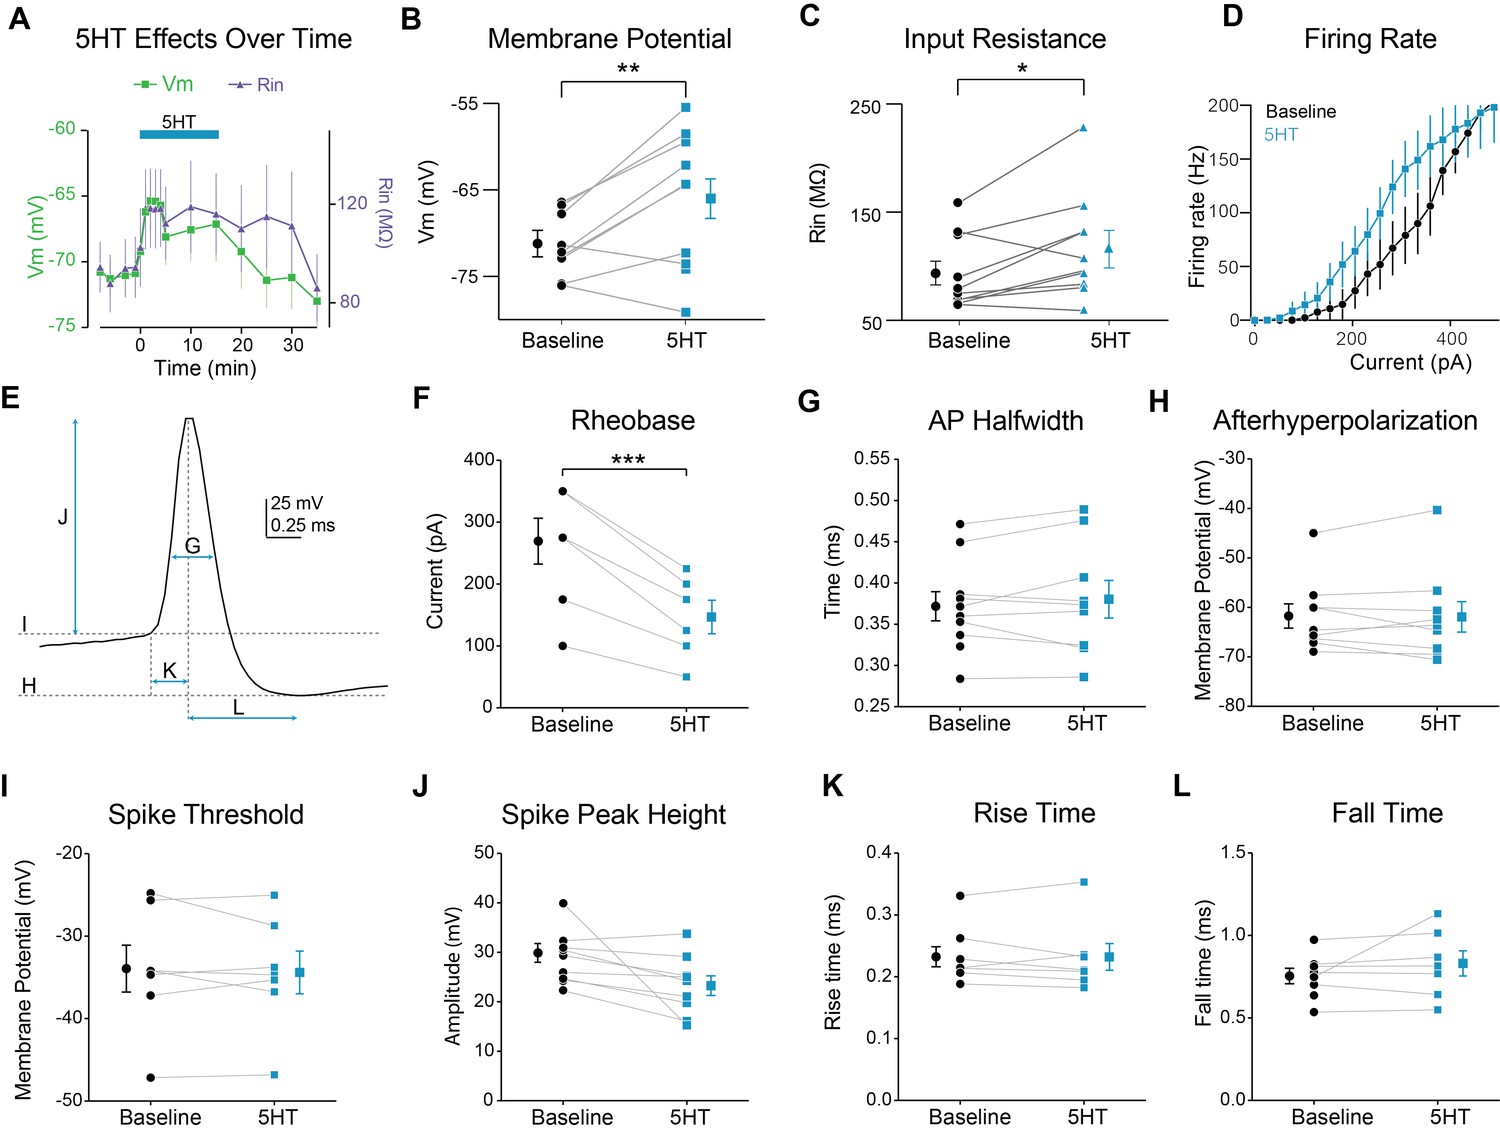
Modulation of FSI intrinsic properties by 5HT.
(A) Membrane potential (left axis) and input resistance (right axis) over time during application of 5HT. (B–C) Membrane potential (B) and input resistance (C before (averaged −5 min to 0 min) and after (averaged 2 to 7 min) application of 5HT. (D) FSI firing rate in response to depolarizing current steps. (E) Single action potential (AP) of a recorded FSI. Arrows and dotted lines indicate how measurements were made for the rest of the figure panels. (F) Rheobase (minimal current needed to elicit spiking) before (black) and after 5HT (blue). (G) AP halfwidth (time for Vm to rise from point halfway between peak and trough to the peak and back to the halfway point) before (black) and after 5HT (blue). (H) After hyperpolarization (membrane potential of AP trough) before (black) and after 5HT (blue). (I) Spike threshold (determined by max of third derivative of membrane potential) before (black) and after 5HT (blue). (J) Spike height (difference between peak and threshold) before (black) and after 5HT (blue). (K) AP rise time (time from threshold to peak) before (black) and after 5HT (blue). (L) AP fall time (time from peak to trough) before (black) and after 5HT (blue). ***p<0.005.
Figure 1—figure supplement 2
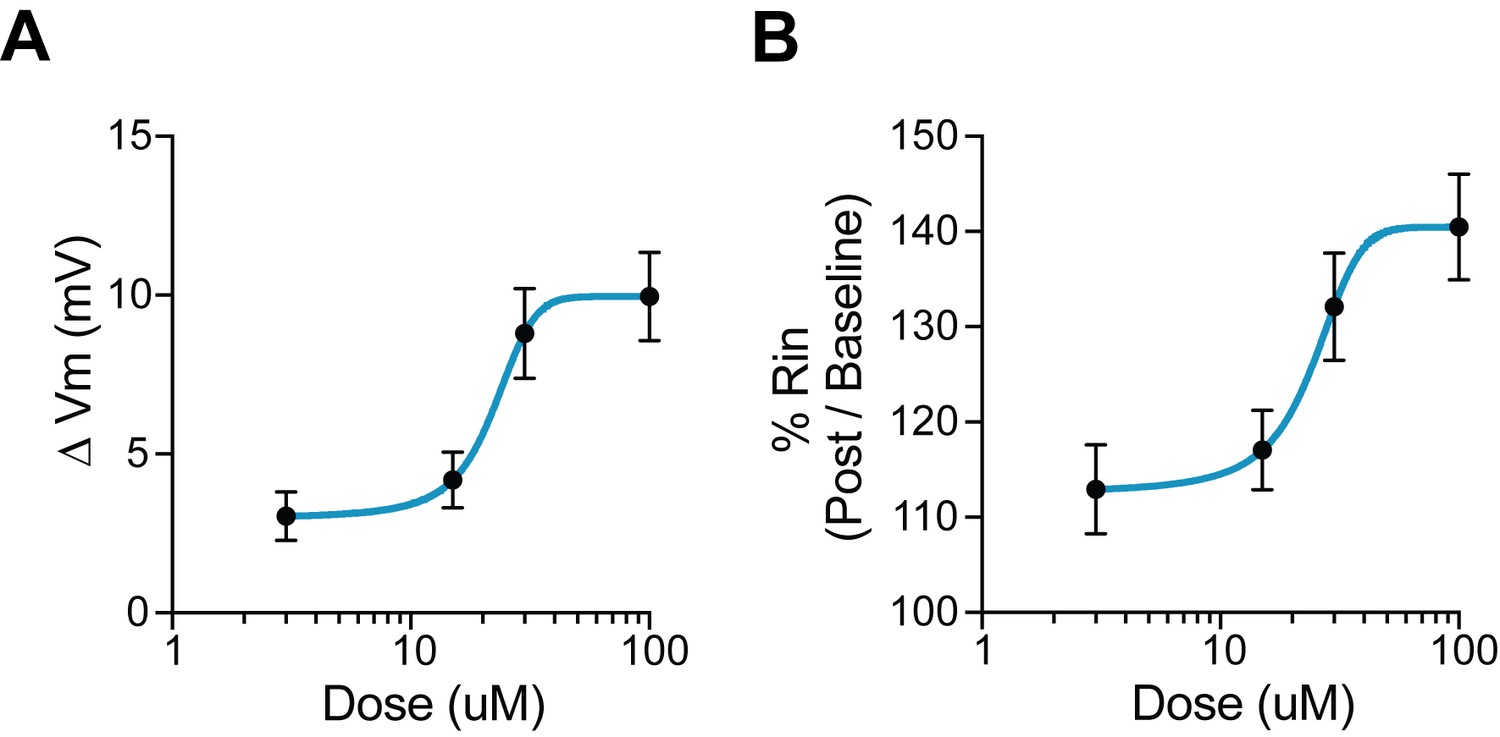
Dose response for 5HT.
(A) Change in membrane potential with various doses of 5HT. 0 mV indicates no change. (B) Percentage change in input resistance with various doses of 5HT. 100% indicates no change.
Figure 1—figure supplement 3
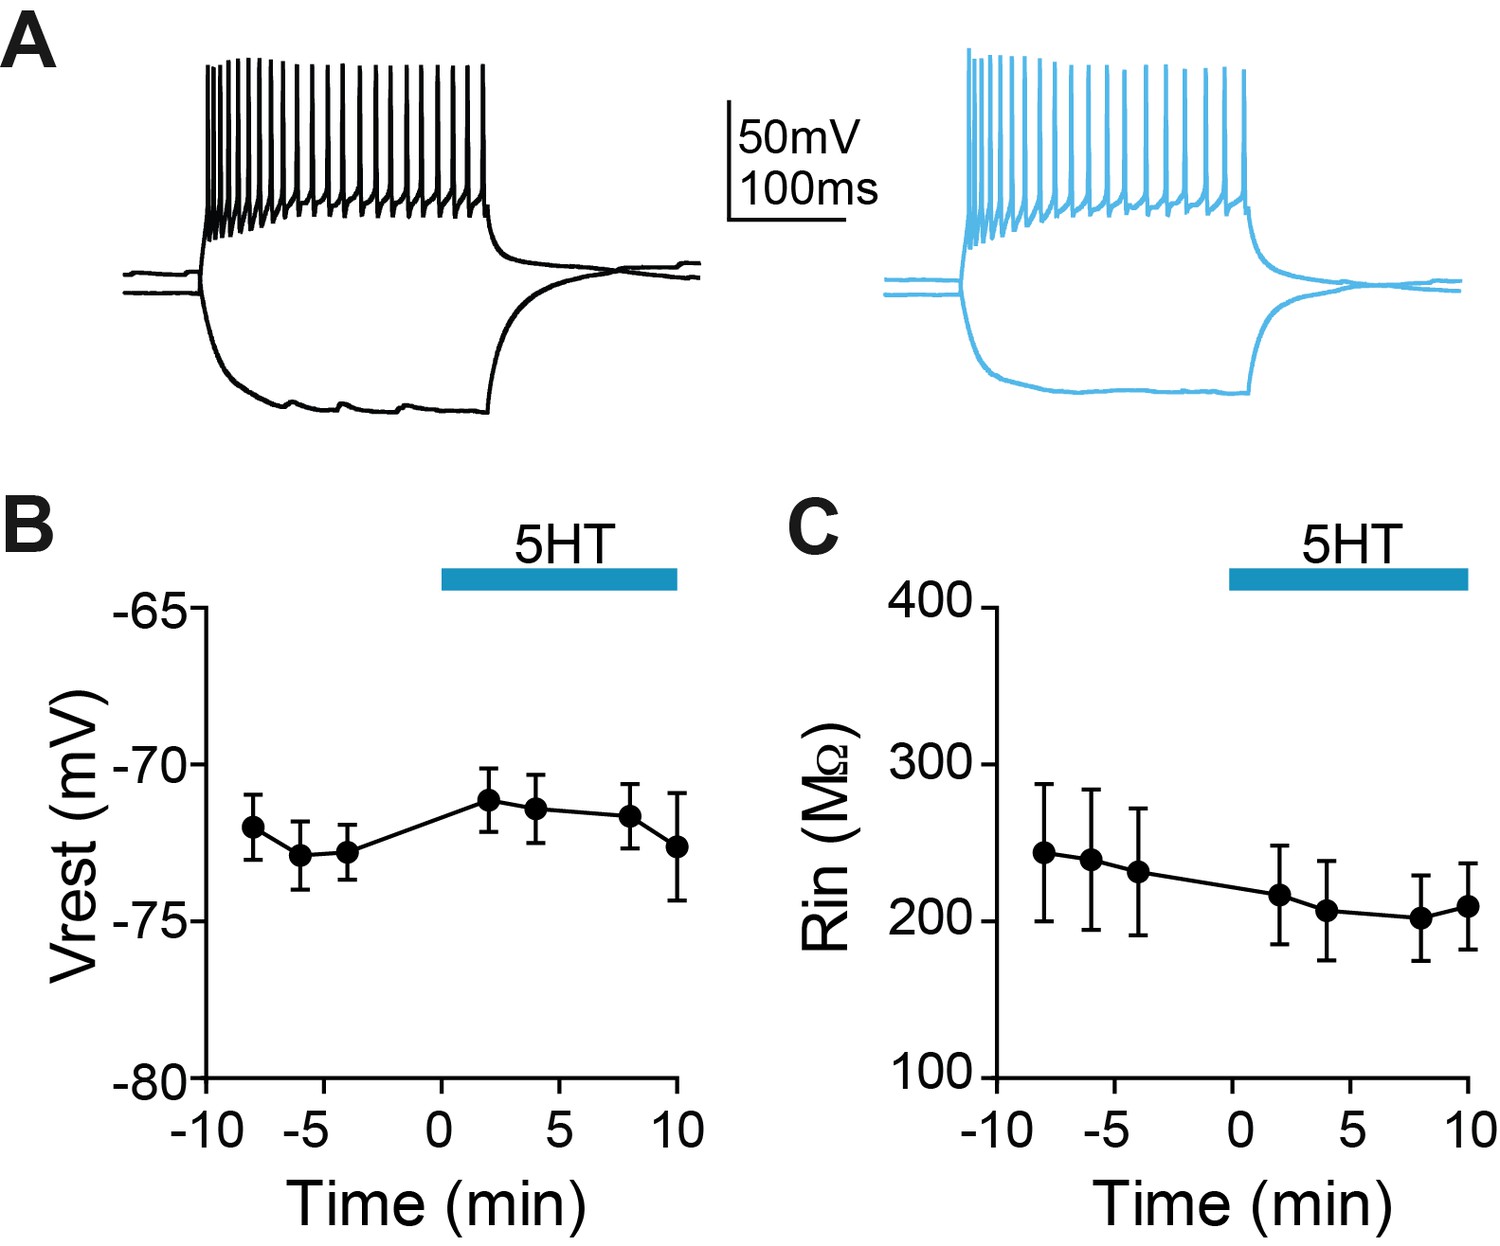
5HT does not change membrane potential or input resistance of SOM interneurons.
(A) Experimental design: We recorded from somatostatin (SOM)-expressing interneurons labeled in a SOM-Cre:: Ai14 in mPFC. Example somatostatin (SOM)-expressing interneuron responses to hyperpolarizing and depolarizing current steps at baseline (black) and after application of 5HT (blue). (B–C) Membrane potential B) and input resistance (C) over time during application of 5HT.
Figure 2
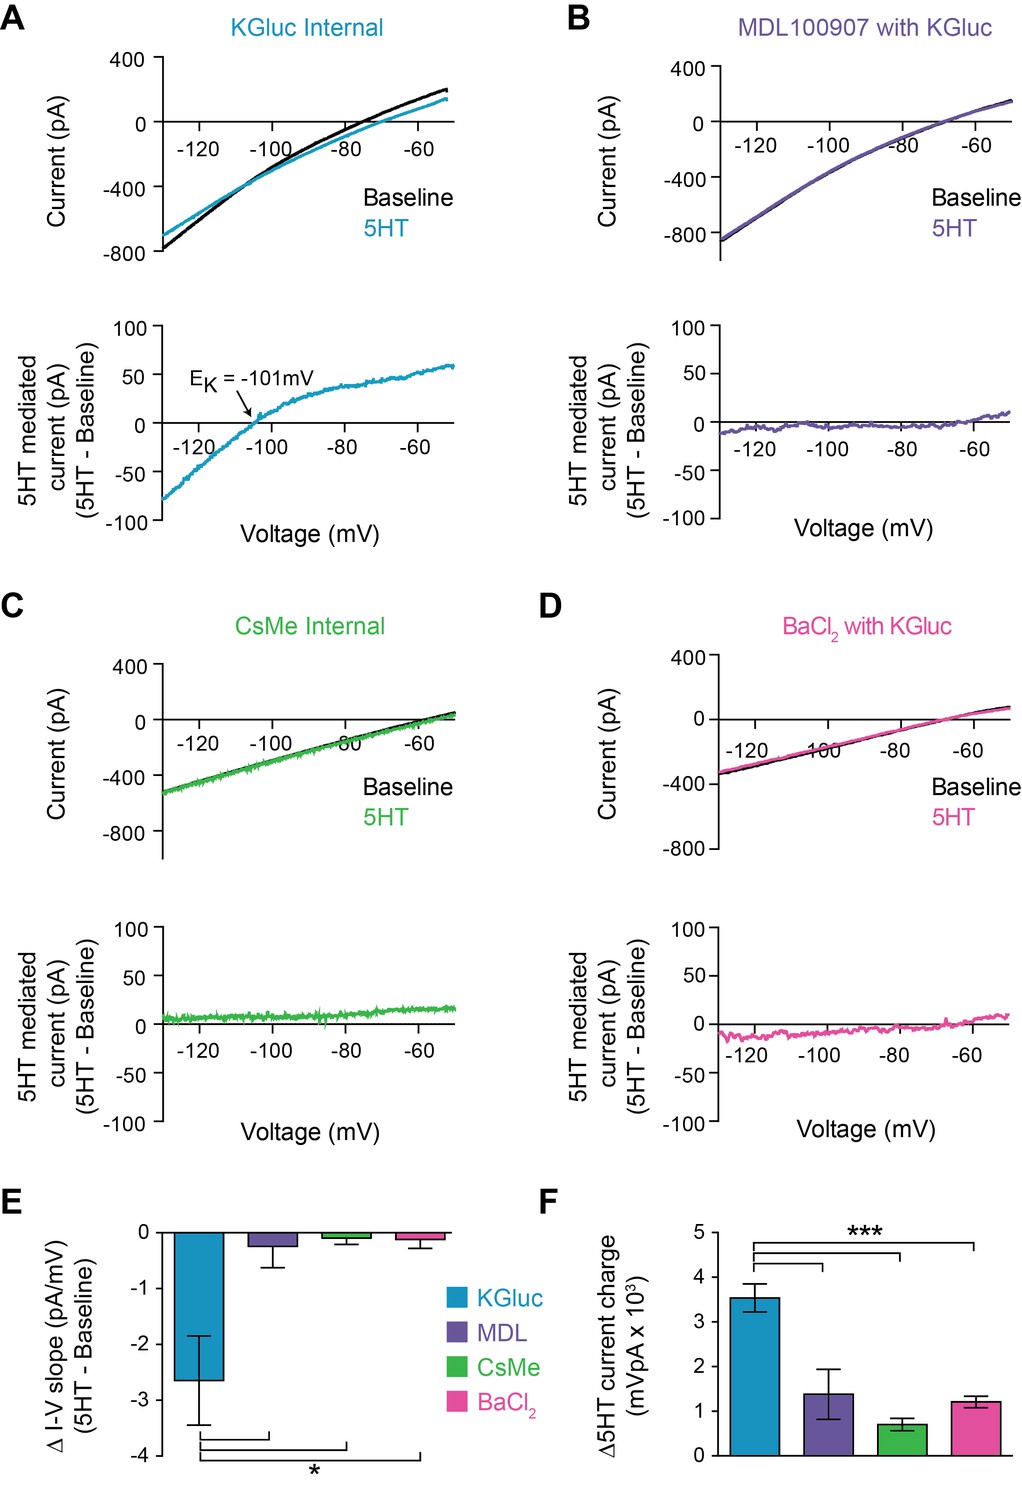
5HT reduces conductance through inward rectifying potassium channels.
(A–B) Top: Current recorded during a voltage ramp (3 s) from −150 mV to −50 mV before (black) and after 5HT (blue) using KGluconate in the internal solution (A) and with pre-application of the 5HT2A antagonist MDL100907 (1 µM). Bottom: The raw currents from the I-V curves subtracted from each other to show the current modulated by 5HT. (C) Top: Current in response to voltage ramp using CsMe internal solution to block K+ channels. Bottom: 5HT-mediated current. (D) Top: Current in response to same voltage ramp with barium chloride (400 µM) in the bath solution to block inward-rectifying K+ channels. Bottom: 5HT-mediated current. (E) The change in slope of the I-V curves (change in conductance) from A-D. (F) Quantification of charge transfer by 5HT in above conditions, calculated by taking the integral of bottom traces in A-D. *p<0.05, ***p<0.005.
Figure 3 with 1 supplement

Decreasing dendritic K + conductance elicits change in tau of synaptic responses in a compartmental model.
(A) Morphology of FSI model. Black circle represents location of synapse. (B) Change in membrane potential (left axis) and input resistance (right axis) in response to reducing conductance of K + channels in both the soma and dendrites of model. Dashed black line indicates average effect from experimental data on Vm and Rin in response to 5HT application. (C–E) Synaptic responses recorded at the model soma after reducing K + conductance by varying amounts (30–80%) only at the soma (C), only at the dendrites (D), or at both the soma and dendrites (E). (F–G) EPSP amplitude (F) and synaptic time constant (G) after reducing K + conductance in soma (green), dendrites (purple), or both (blue).
Figure 3—figure supplement 1
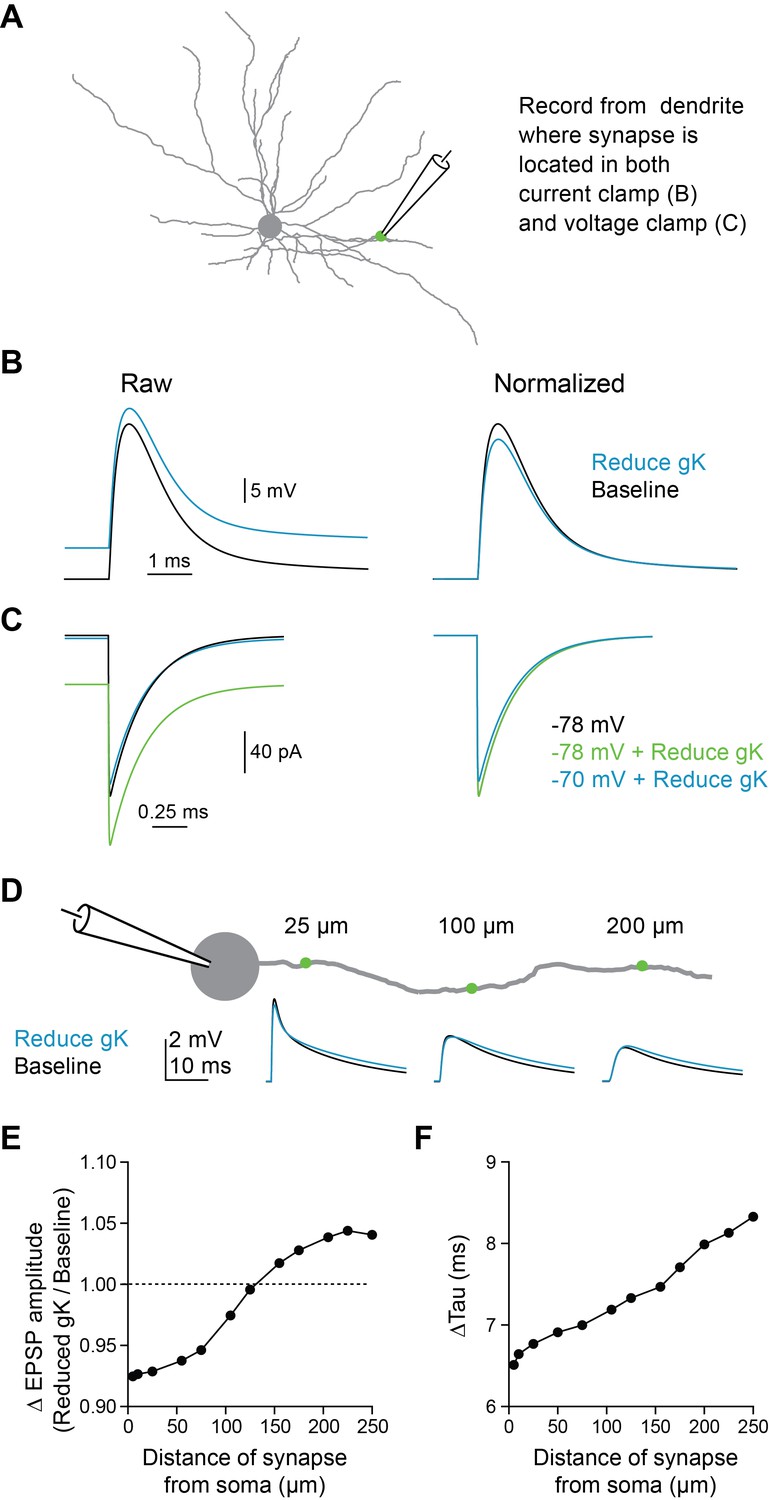
5HT-induced dendritic depolarization reduces synaptic driving force in compartmental model.
(A) Experimental design: Synapse was stimulated on dendrite and response was recorded at site of synapse in either voltage clamp or current clamp. (B) EPSP traces recorded in current clamp at dendrite at baseline and after reducing gK to mimic 5HT. (C) EPSC traces recorded in voltage clamp at dendrite with varying holding potentials and reducing gK. (D) Experimental design: Synapse was placed at varying distances from soma (5–200 µm) on a single dendrite and EPSP was recorded at the soma at baseline and after reducing gK. (E–F) Change in EPSP amplitude (D) and tau (D) due to gK reduction as a function of distance from soma are shown.
Figure 4 with 1 supplement

Local 5HT iontophoresis at FSI dendrites increases FSI firing.
(A,C) Experimental design: Neurons were patched and filled with Alexa-488. 5HT was applied locally to the dendrite using iontophoresis (50 ms), while FSIs were injected with a small amount of depolarizing current to elicit spiking. DIC and overlaid fluorescent images with iontophoretic pipette adjacent to (A) or withdrawn from (C) dendrite. (B,D) Firing rate in response to current injection with local 5HT iontophoresis adjacent to dendrite (B) or withdrawn from dendrite (D). (E) Change in firing rate with iontophoresis (FR 1 s before ionto pulse subtracted from FR after ionto pulse) at different distances from the dendrite. Solid black line in exponential fit to data. Space constant is 3.13 µm. (F) Distances of iontophoretic sites from the soma.
Figure 4—figure supplement 1
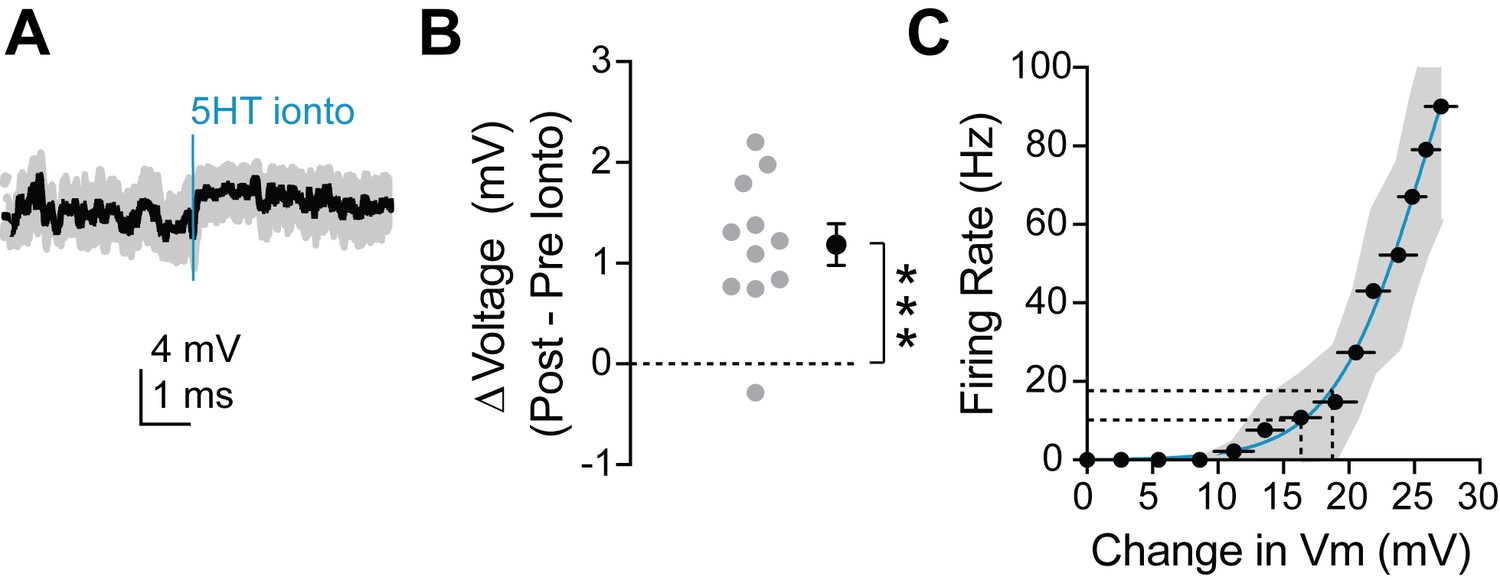
Dendritic 5HT iontophoresis depolarizes neuron sufficiently to induce observed change in firing rate.
(A) Average membrane potential recorded at the soma during dendritic iontophoresis with spikes removed via median filtering. Blue line indicates time of iontophoresis. (B) Change in membrane potential in the 2 s preceding and following iontophoresis. (C) Number of spikes fired in response to somatic square current injections versus change in membrane potential (computed by removing spikes from traces). Dotted lines on the y-axis indicate the firing rates pre (~10 Hz) and post (~18 Hz) iontophoresis. Dotted lines on the x-axis display the change in membrane potential required to elicit those firing rates. A depolarization of 2–3 mV is sufficient to change an FSI’s firing rate from 10 to 18 Hz.
Figure 5 with 1 supplement

5HT promotes integration of synaptic inputs in a frequency-specific manner.
(A) Experimental design: Slices were bathed in a caged glutamate compound (MNI-Glutamate 2.5 mM) that is only biochemically active with photolysis. Glutamate was uncaged at five locations (1 µm apart) on a dendrite individually and then at all five together with varying interstimulus intervals (0.12, 5, 10, 20, 50 ms). (B) Amplitude-normalized EPSP in response to single uncaging events before (black) and after application of 5HT (blue). (C) Ratio of EPSP amplitudes (5HT/baseline) for single uncaging events (averaged per dendrite). Dotted line indicates no change. (D) Change in synaptic decay time constant (tau) of single uncaging events (averaged per dendrite) before and after 5HT. Dotted line indicates no change. (E) Difference of 5HT and baseline EPSP traces in B. (F) Example compound EPSPs in response to uncaging at all five dendritic locations at varying interstimulus intervals (0.12, 20, 50 ms). (G–H) Ratio of fifth EPSP amplitude (G, 5HT/Baseline) and charge transfer (H, 5HT/Baseline integral) for different interstimulus intervals. *p<0.05, **p<0.01.
Figure 5—figure supplement 1
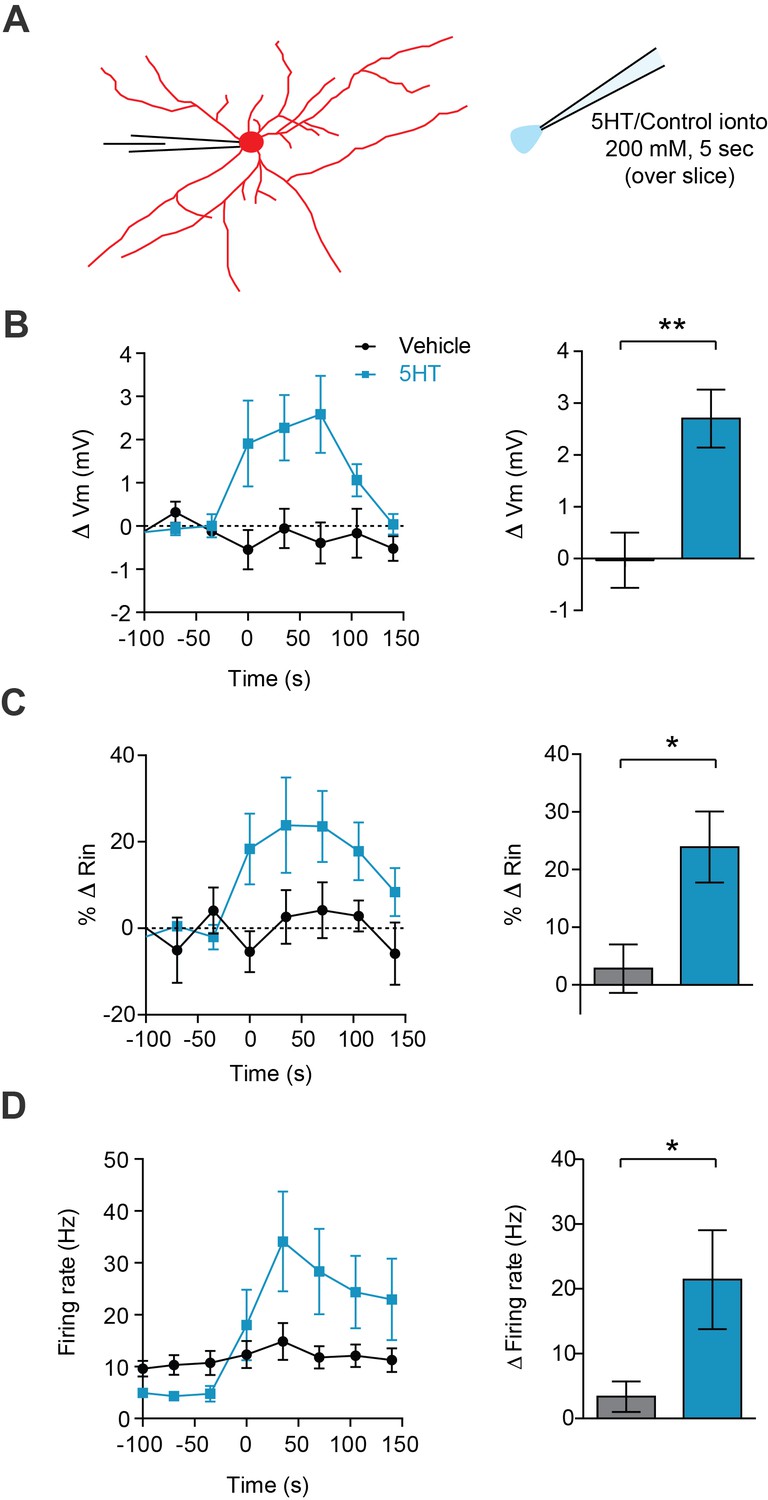
Broad 5HT iontophoresis over the slice produces typical 5HT effects.
(A) Experimental design: FSIs were patch clamped and an iontophoretic pipette containing 5HT (200 mM, pH = 4.5) or vehicle control solution (aCSF, pH = 4.5) was hovered just above the slice. (B–D) Left panels: change in membrane potential (B), input resistance (C), and firing rate (D) in response to iontophoresis (5 s) of either 5HT (blue) or vehicle control (black) over time. Right panels: Quantification change in parameters before (−100 to 0 s) or after (0 to 150 s) iontophoresis. *p<0.05, **p<0.01.
Figure 6 with 2 supplements
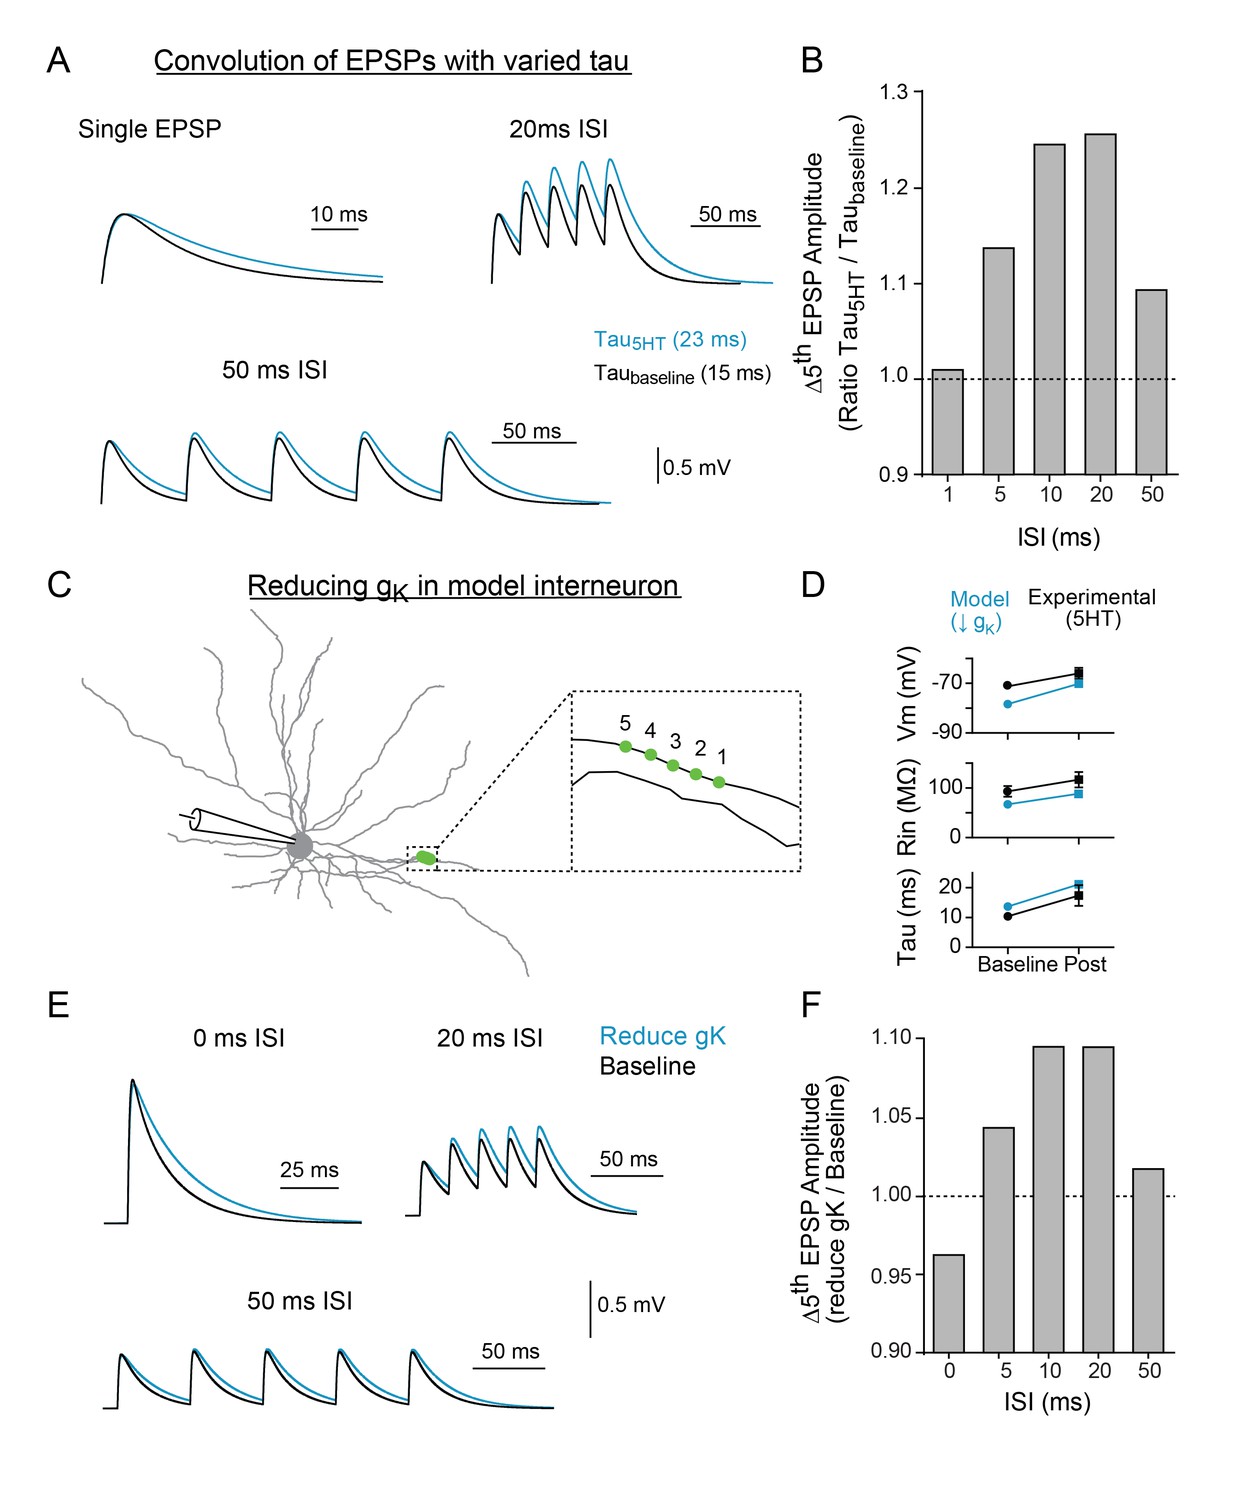
Modeling indicates that changing tau and reducing K + conductance can modulate temporal summation.
(A) Experimental design: Single EPSPs were modeled using a double exponential with two different decay constants (taubaseline = 15 ms, tau5HT = 23 ms) to match the change in tau observed with 5HT application. These template EPSPs were convolved five times with varying intervals (ISI). Example traces shown here of single EPSP, 20 ms ISI, and 50 ms ISI with baseline tau (black) and 5HT tau (blue). (B) The ratio of amplitude of the fifth EPSP (slow tau/fast tau) as a function of interval. (C) Morphology of FSI model. Purple circles represent location of synapses. (D) Comparisons of model (blue) and experimental (black) intrinsic properties at baseline (circles) and after manipulations (blue = model: reducing gK by 70%, black = experimental: application of 5HT). (E) Synapses in model were stimulated at variable interstimulus intervals (ISI). Example traces for compound EPSPs with 0 ms, 20 ms, and 50 ms ISIs at baseline (black) and after reducing gK by 70% (blue). (F) The ratio of amplitude of the fifth EPSP (reduced gK/baseline) as a function of ISI.
Figure 6—figure supplement 1
Model is robust to changes in synaptic parameters.
(A) Experimental design: Five synapses were placed either on the same dendrite (1 µm apart, arrowhead, black), separate dendrites (blue), or soma (green). The synapses were stimulated at varying interstimulus intervals (0, 5, 10, 20, 50 ms) and voltage responses at the soma were recorded. (B) The ratio of amplitude of the fifth EPSP (Reduced gK/Baseline) as a function of interval for different synapse locations. (C) Example traces for compound EPSPs with 0 ms, 20 ms, and 50 ms ISIs at baseline (black) and after reducing gK by 70% (blue) with synapses placed either on the soma (green) or separate dendrites (blue). (D) The ratio of amplitude of the fifth EPSP (Reduced gK/Baseline) as a function of interval for different numbers of synapses (on same dendrite) activated. (E) The ratio of amplitude of the fifth EPSP (Reduced gK/Baseline) as a function of internal for varying synapse weights.
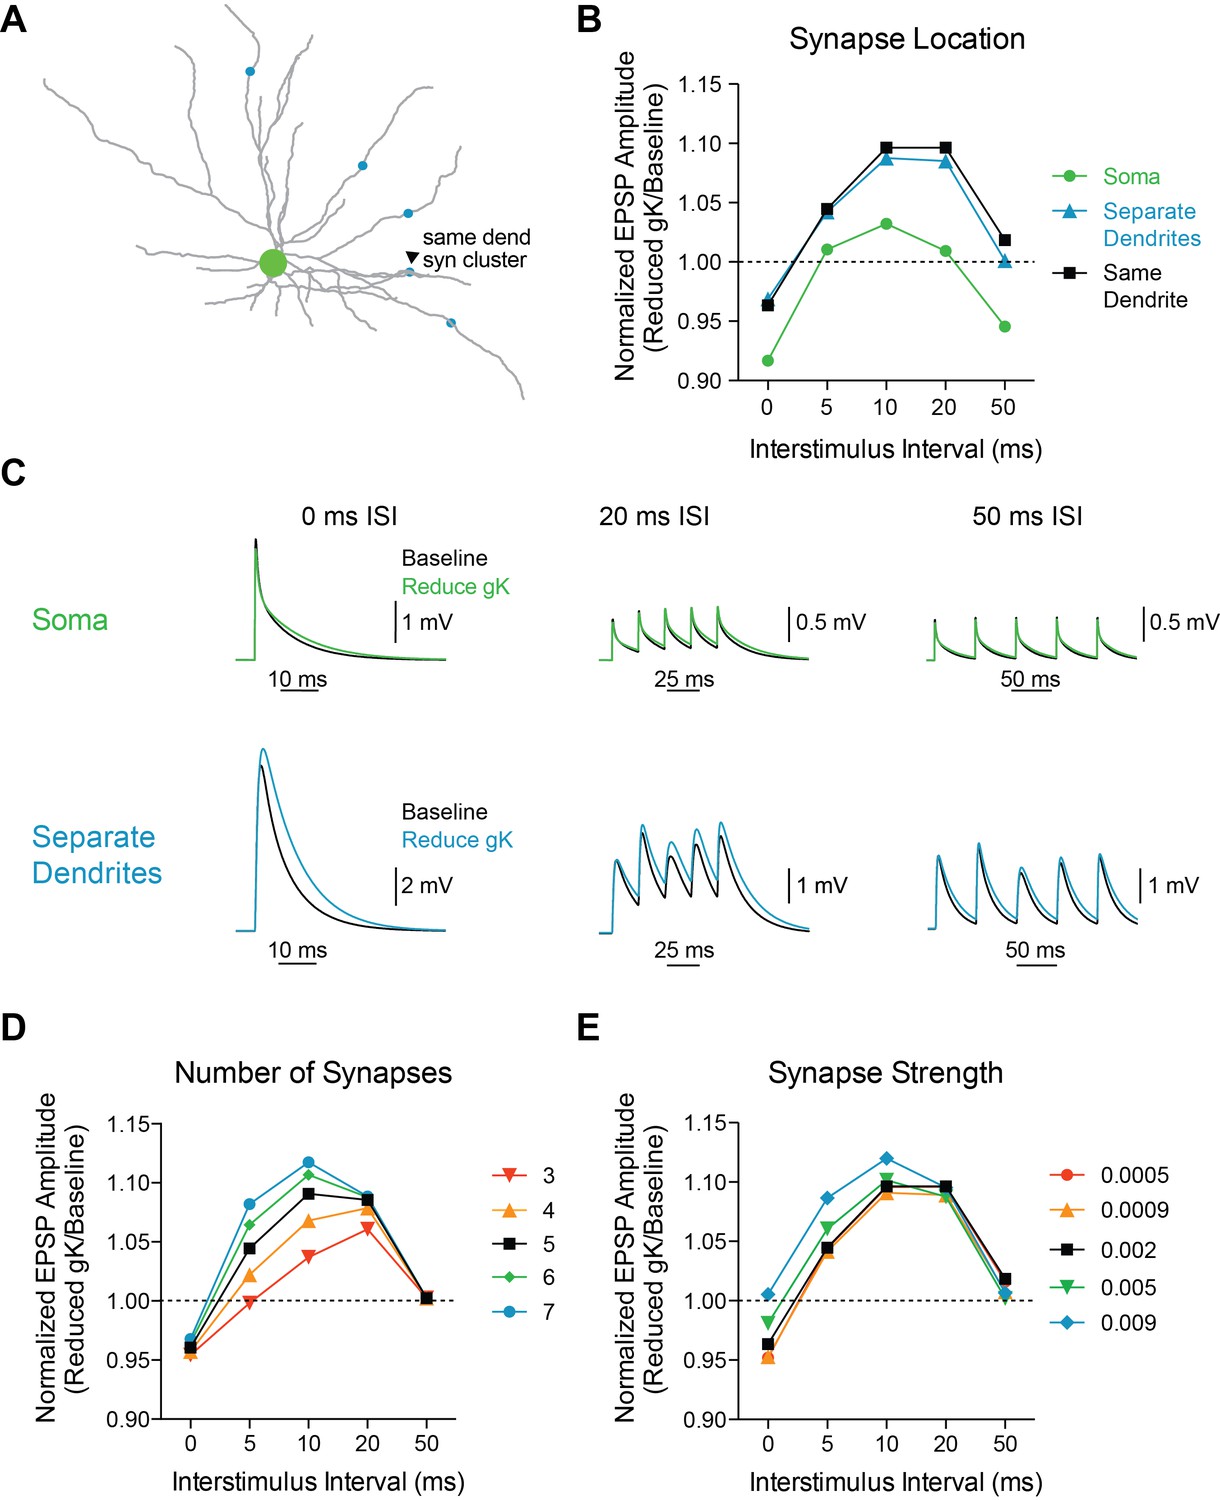
Figure 6—figure supplement 2
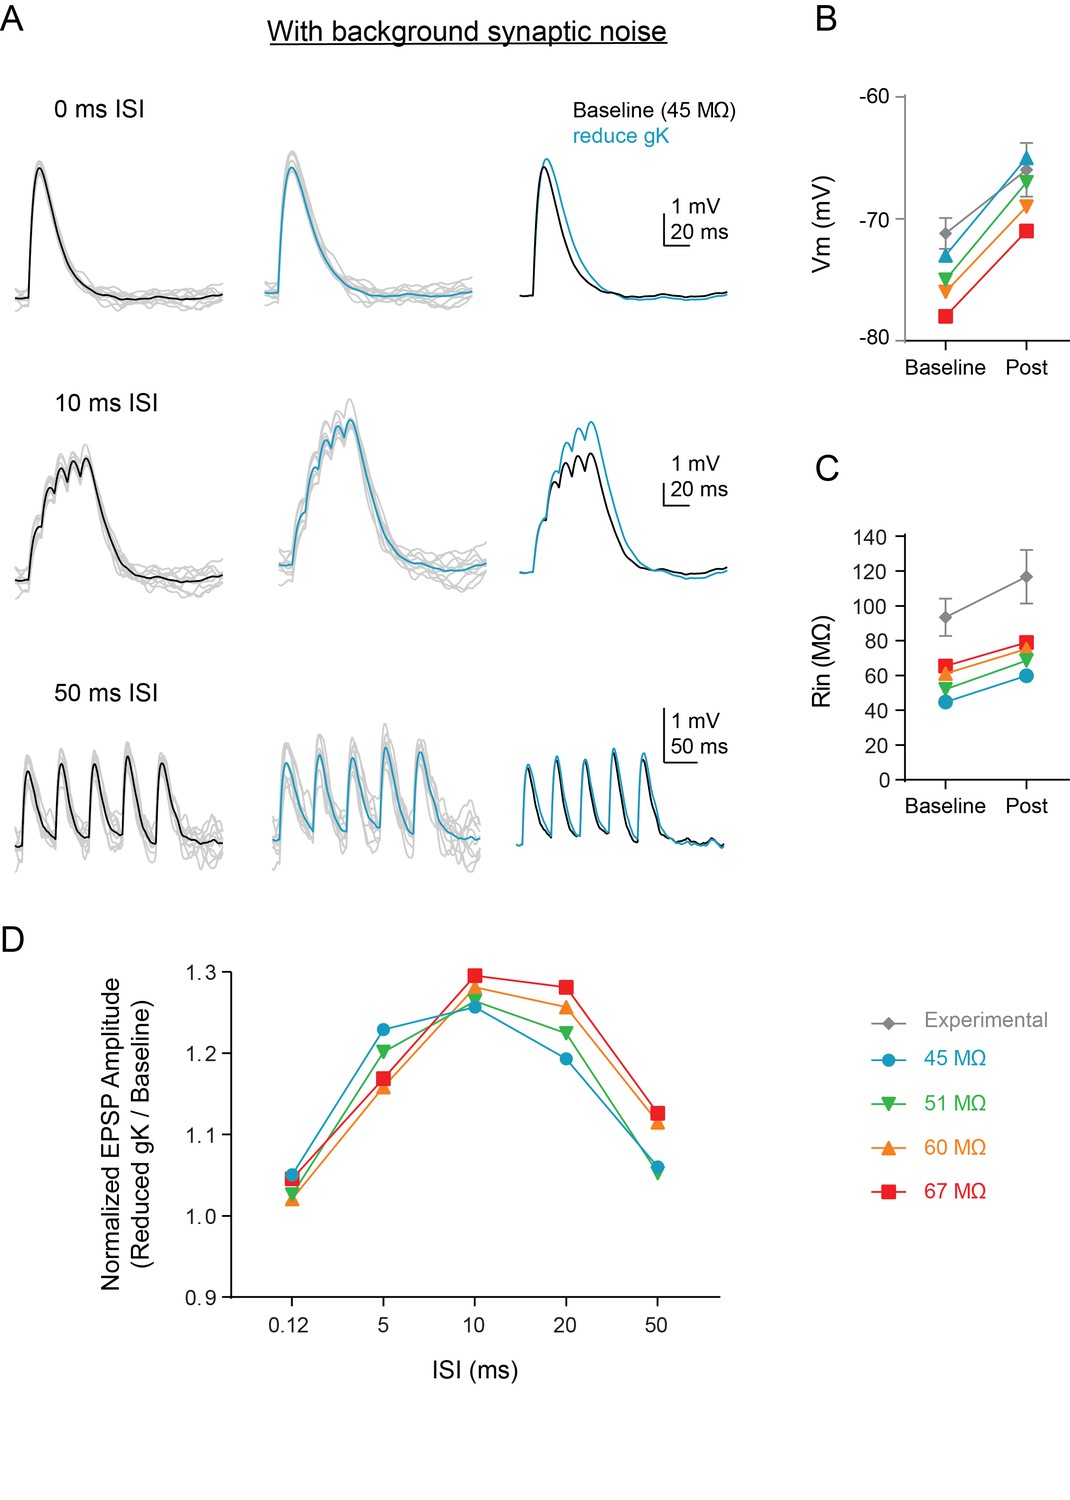
Background synaptic noise does not change summation enhancement.
(A) Experimental design: Synaptic noise was included at various levels in a subset of dendrites of the compartmental model and synapses in model (Figure 6C) were stimulated at variable ISIs. Example traces for compound EPSPs at baseline (black, left) and after reducing gK by 70% (blue, middle) when initial input resistance was 45 MΩ to closely match in vivo conditions. Gray traces are single example trials. (B–C) Comparisons of model (colored) and experimental (gray) intrinsic properties at baseline (circles) and after manipulations (colored = model: reducing gK by 70%, black = experimental: application of 5HT). (D) The ratio of amplitude of the fifth EPSP (Reduced gK/Baseline) as a function of interval for different levels of synaptic noise to change baseline Rin.
Figure 7 with 2 supplements
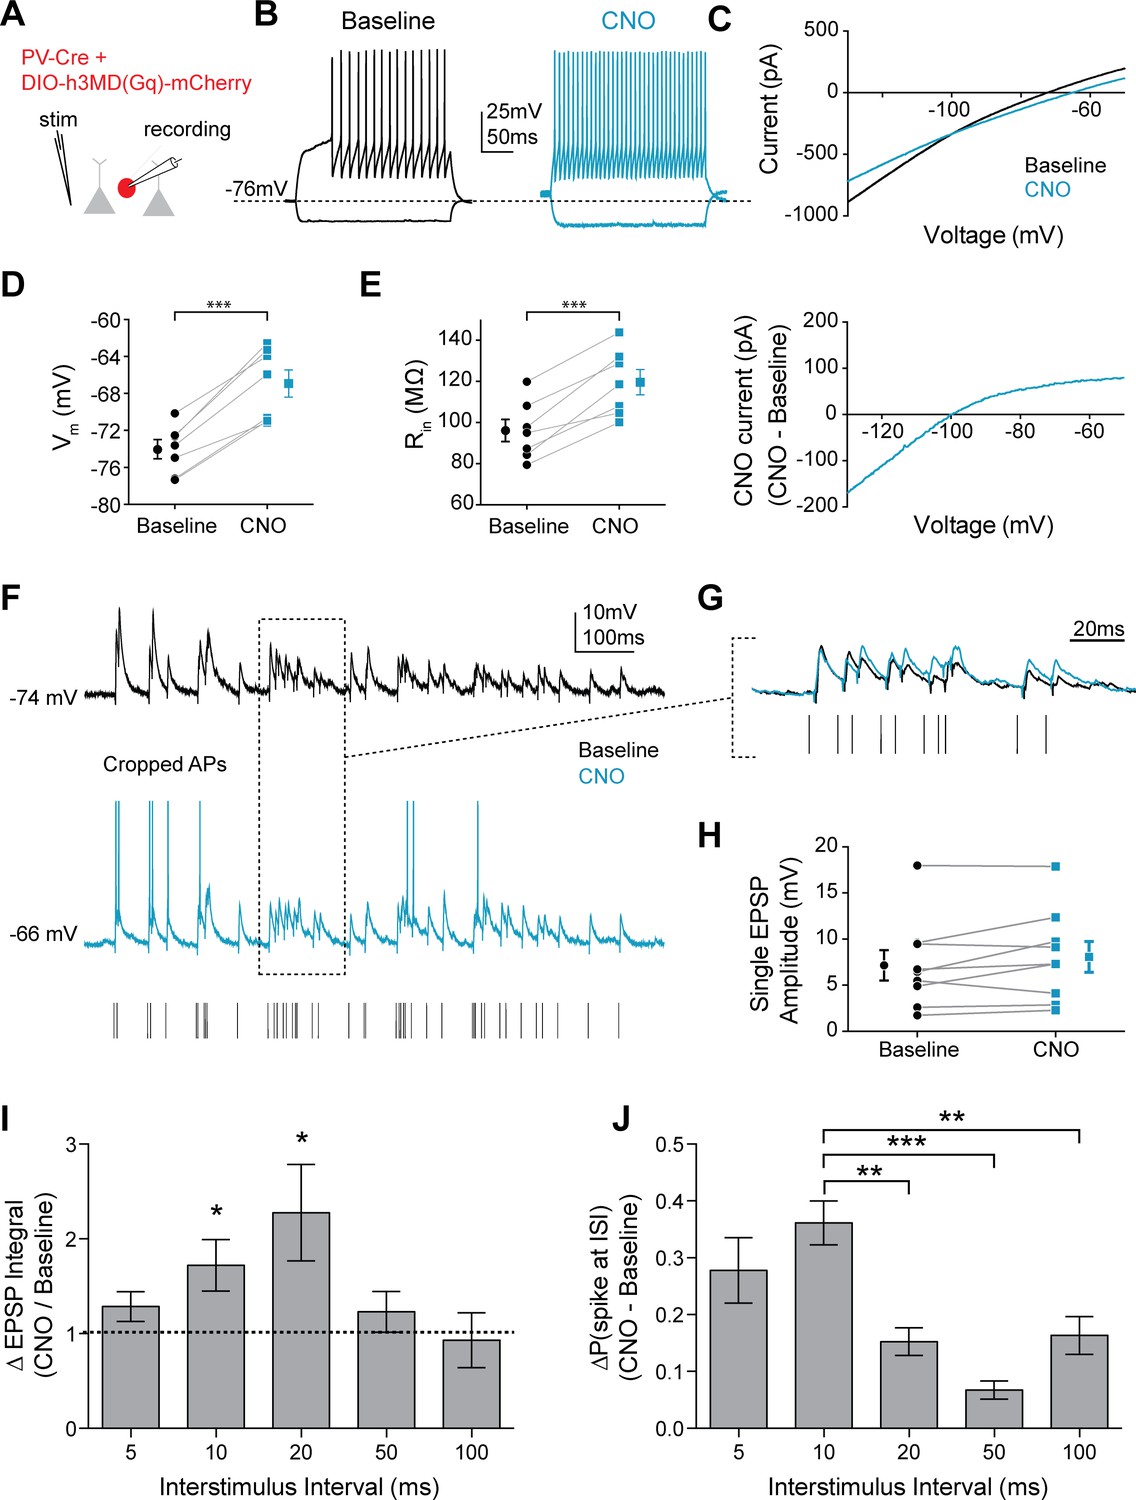
Mimicking 5HT effects elicits preferential firing to gamma frequency inputs in FSIs.
(A) Experimental design: The Gq-coupled Designer Receptor Exclusively Activated by Designer Drugs (DREADD) was expressed specifically in FSIs using a Cre-dependent virus injected into PV-Cre mice. FSIs were identified with fluorescence for patching. (B) Example FSI responses to hyperpolarizing and depolarizing current steps at baseline (black) and after application of CNO to activate the Gq-DREADD (1 µM, blue). (C) Top: Current recorded during a voltage ramp (3 s) from −150 mV to −50 mV before (black) and after CNO (blue). Bottom: The raw currents from the I-V curves subtracted from each other to show the current modulated by CNO. (D–E) Changes in membrane potential (D) and input resistance (E) before and after CNO. (F) Experimental design: A stimulating electrode was placed in the tissue within 100 µm of the recorded FSI and a 2 s train of randomly distributed stimulating current pulses (200 µs) with varied interstimulus intervals (ISIs = 5, 10, 20, 50, 100 ms) was delivered. Example FSI responses to stimulus train at baseline (black) and after application of CNO (blue). (G) Expanded view of subthreshold responses indicated by dotted box in F. (H) Change in single EPSP amplitude with CNO. (I) Normalized change in EPSP integral (CNO/Baseline) with CNO application for different ISIs. (J) Change in the percentage of all spikes occurring at each ISI after CNO. *p<0.05, **p<0.01 ***p<0.005.
Figure 7—figure supplement 1
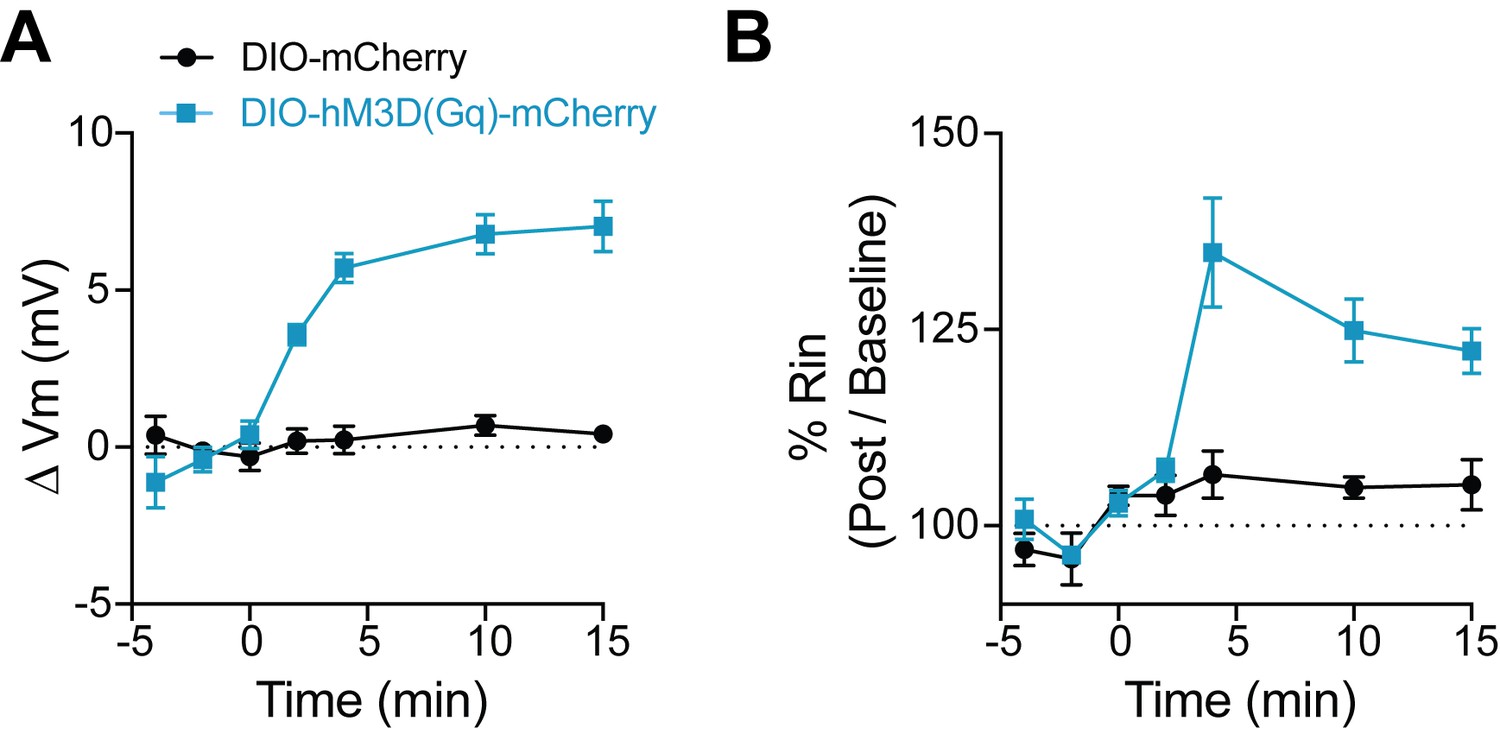
CNO has no effect on FSIs not expressing DREADD.
(A–B) Change in membrane potential (A) and input resistance (B) over time with application of CNO in FSIs that either express the Gq-coupled DREADD, hM3D(Gq)-mCherry (blue) or a control fluorophore, mCherry (black). CNO application begins at time 0.
Figure 7—figure supplement 2
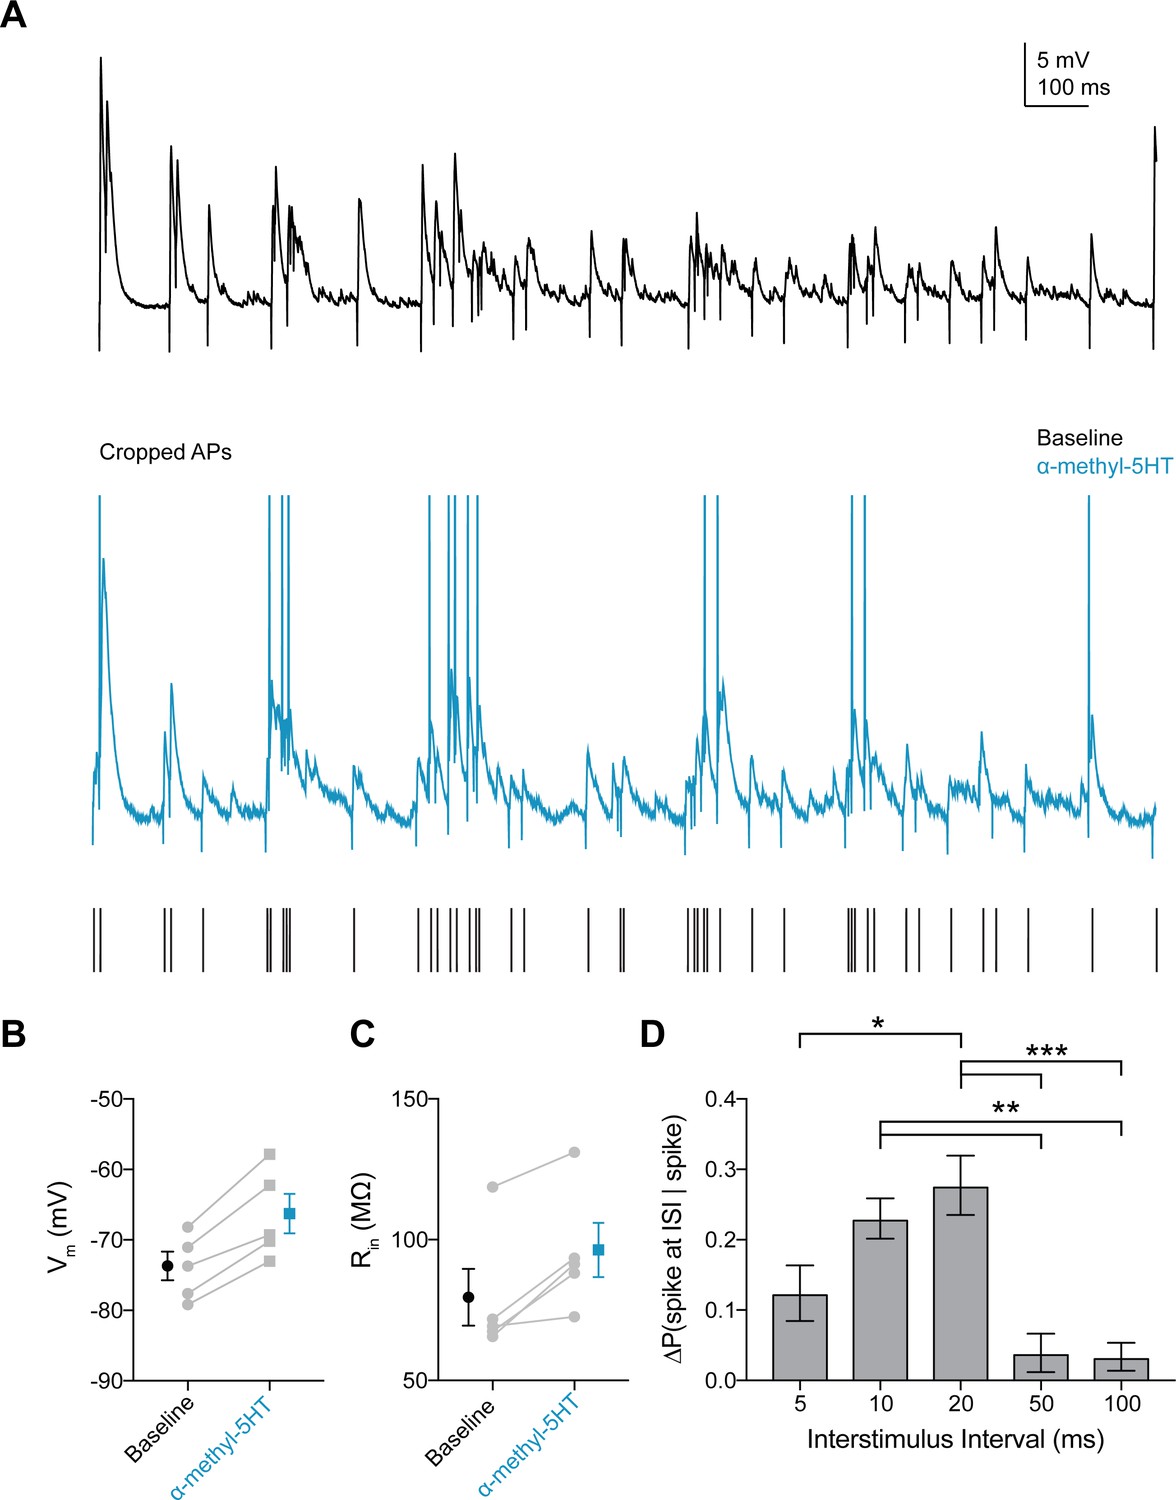
5HT2A agonist increases probability of FSI firing in response to gamma frequency inputs.
(A) Experimental design: A stimulating electrode was placed in the tissue within 100 µm of the recorded FSI and a 2 s train of randomly distributed stimulating current pulses (200 µs) with varied interstimulus intervals (ISIs = 5, 10, 20, 50, 100 ms) was delivered. Example FSI responses to stimulus train at baseline (black) and after application of the 5HT2A agonist α-methyl-5HT (blue). (B–C) Change in membrane potential (B) and input resistance (C) with application of α-methyl-5HT. (D–E) Change in amplitude (B) and tau (C) for subthreshold events with application of α-methyl-5HT. (F) Change in the percentage of all spikes occurring at each ISI after CNO. *p<0.05, **p<0.01 ***p<0.005.
Figure 8
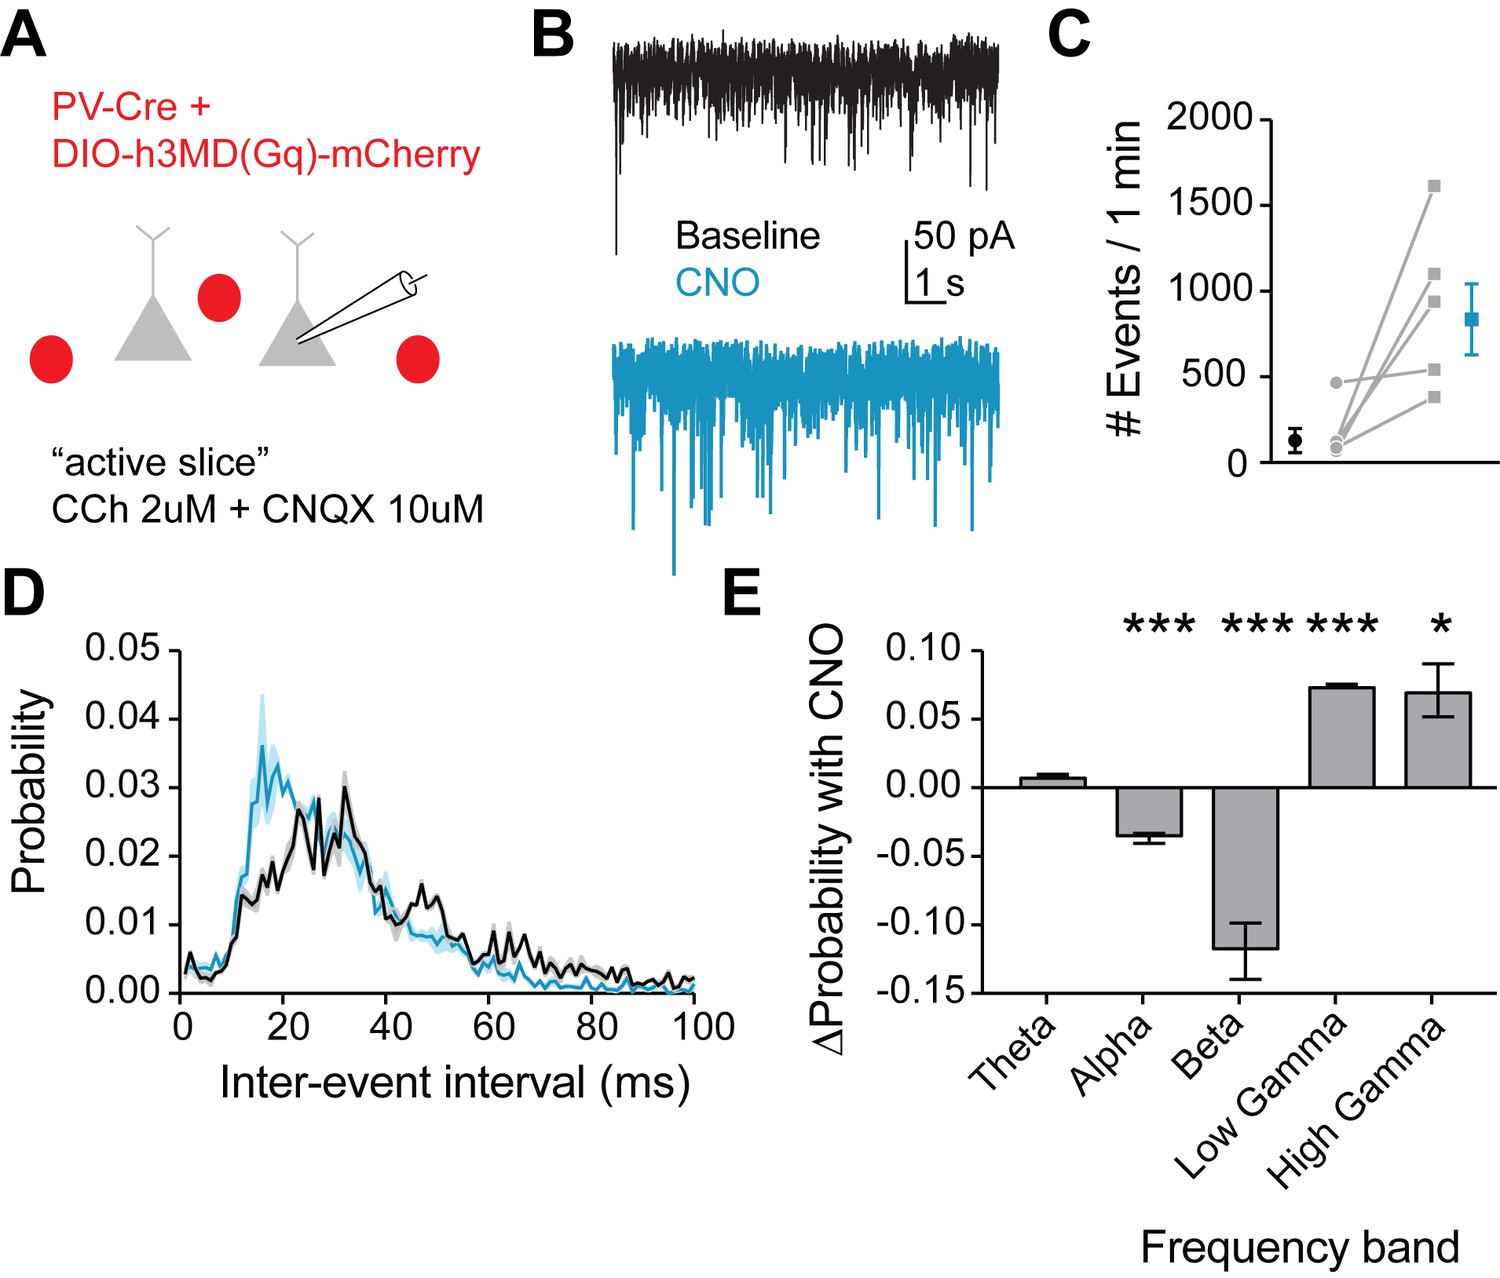
Mimicking 5HT effects in FSIs produces gamma frequency events in downstream pyramidal neurons.
(A) Experimental design: The Gq-DREADD was expressed specifically in FSIs using a cre-dependent virus injected into PV-Cre mice. Prefrontal slices were bathed in carbachol (2 µM) to induce spontaneous background synaptic activity. Non-fluorescent pyramidal neurons were chosen for patching using a high chloride internal solution to elicit inward IPSCs. CNQX (10 µM) was included in the bath to block AMPA currents. (B) Example traces of spontaneous IPSCs recorded at baseline (black) and after wash-in of CNO (blue). (C) Total number of IPSC events in 1 min at baseline and after CNO application. (D) Probability distribution of inter-event intervals for IPSCs recorded at baseline and after CNO. (E) Change in probability of inter-event intervals of different frequency bands. Theta = 48 Hz, alpha = 8–12 Hz, beta = 13–29 Hz, low gamma = 39–59 Hz, high gamma = 61–100 Hz. *p<0.05, **p<0.01 ***p<0.005.
Tables
Key resources table
| Reagent type (species) or resource | Designation | Source or reference | Identifiers | Additional information |
|---|---|---|---|---|
| genetic reagent (M. musculus) | PV-Cre | Jackson Laboratory | Stock#:017320 | |
| genetic reagent (M. musculus) | Ai14 | Jackson Laboratory | Stock#:007914 | |
| genetic reagent (M. musculus) | SERT-Cre | Jackson Laboratory | Stock#:014554 | |
| transfected construct (virus) | AAV5-Ef1-DIO-ChR2-eYFP | UNC Vector Core | AAV5-Ef1a-DIO-hChR2(H134R)-EYFP-WPRE-pA | |
| transfected construct (virus) | AAV5-CaMKII-ChR2-eYFP | UNC Vector Core | AAV5-CaMKIIa-hChR2(H134R)-EYFP | |
| transfected construct (virus) | AAV-DJ-Ef1a-DIO-hM3D(Gq)-mCherry | Stanford Vector Core | GVVC-AAV-130 | |
| transfected construct (virus) | AAV-DJ-Ef1a-mCherry | Stanford Vector Core | GVVC-AAV-14 | |
| chemical compound, drug | DL-AP5 | Tocris | Catalog#:3693 | |
| chemical compound, drug | CNQX | Tocris | Catalog#:1045 | |
| chemical compound, drug | Gabazine | Tocris | Catalog#:1262 | |
| chemical compound, drug | 5HT | Tocris | Catalog#:3457 | |
| chemical compound, drug | MDL100907 | Tocris | Catalog#:4173 | |
| chemical compound, drug | α−methyl−5ΗT | Tocris | Catalog#:0557 | |
| chemical compound, drug | Carbachol | Tocris | Catalog#:2810 | |
| chemical compound, drug | MNI-Glutamate | Tocris | Catalog#:1490 | |
| antibody (rabbit) | Rabbit anti-5HT | Immunostar | Catalog#:20080 | 1:500 |
| antibody (mouse) | mouse anti-GFP | Invitrogen | Catalog#:A11120 | 1:500 |
| antibody (goat) | Alexa 405 goat anti-rabbit | Invitrogen | Catalog#:A31556 | 1:250 |
| antibody (goat) | Alexa 488 goat anti-mouse | Invitrogen | Catalog#:A11029 | 1:250 |
Additional files
-
Transparent reporting form
- https://doi.org/10.7554/eLife.31991.020
Download links
A two-part list of links to download the article, or parts of the article, in various formats.
Downloads (link to download the article as PDF)
Open citations (links to open the citations from this article in various online reference manager services)
Cite this article (links to download the citations from this article in formats compatible with various reference manager tools)
Serotonin enhances excitability and gamma frequency temporal integration in mouse prefrontal fast-spiking interneurons
eLife 6:e31991.
https://doi.org/10.7554/eLife.31991


