Inhibition of oxidative stress in cholinergic projection neurons fully rescues aging-associated olfactory circuit degeneration in Drosophila
- Technical University of Munich, Germany
- Free University of Berlin, Germany
- Charité-Universitätsmedizin Berlin, Germany
- Max-Planck Institute of Neurobiology, Germany
- Ludwig-Maximilians-Universität München, Germany
- Leibniz-Forschungsinstitut für Molekulare Pharmakologie, Germany
Figures
Figure 1 with 1 supplement
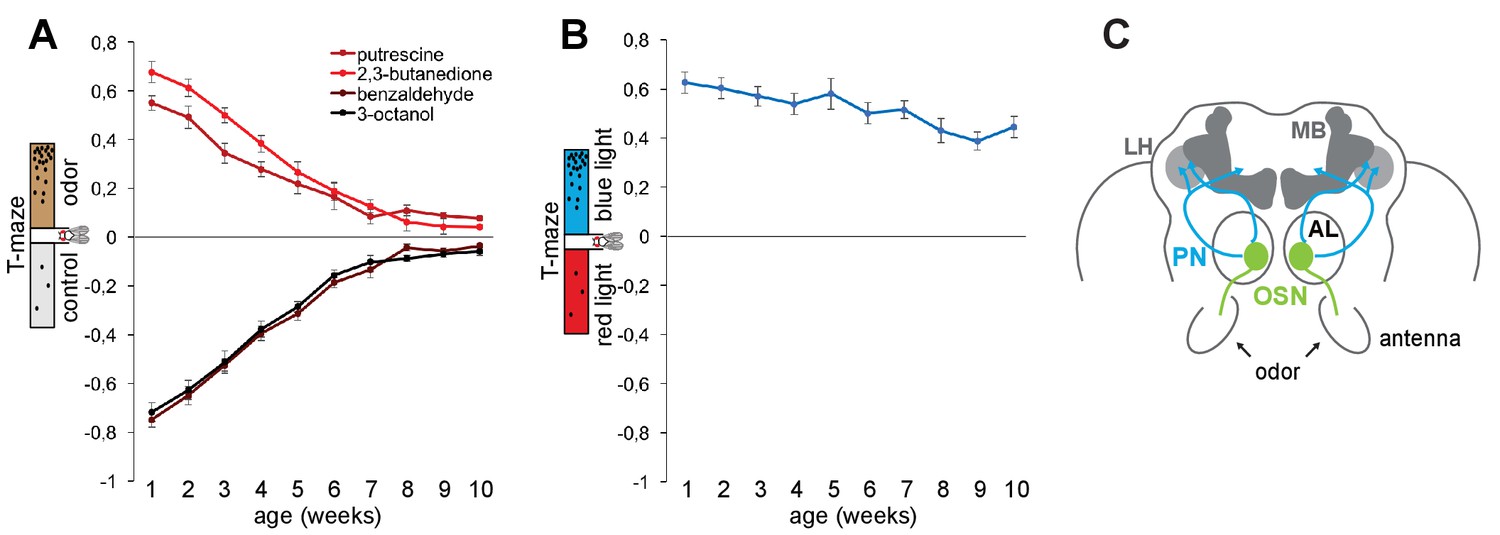
The sense of smell ages faster than the sense of vision.
(A) Olfactory preference index of aging Canton S flies to aversive (benzaldehyde, 3-octanol) and attractive odors (2,3-butanedione, putrescine) in the T-maze assay. There is a gradual and significant (p≤0.01) decrease in olfactory preference with aging (1–10 weeks). For additional odors see Figure 1—figure supplement 1. (B) Preference index (X-axis) of flies to blue light versus red light in the T-maze assay against age (Y-axis). There was no significant difference between the data points. Graphs show mean value ±SEM (n = 8 trials, 60 flies/trial 30 ♀ and 30 ♂). (C) Schematic illustration of the fly brain and antennal appendages with olfactory sensory neurons (OSNs). OSNs project into the antennal lobe (AL), where they innervate a specific glomerulus (green). Projection neurons (PNs, blue) send the information mainly to two higher brain centres, the mushroom body (MB) and the lateral horn (LH) (top).
-
Figure 1—source data 1
Source data for Figure 1 and Figure 1—figure supplement 1.
- https://doi.org/10.7554/eLife.32018.004
Figure 1—figure supplement 1
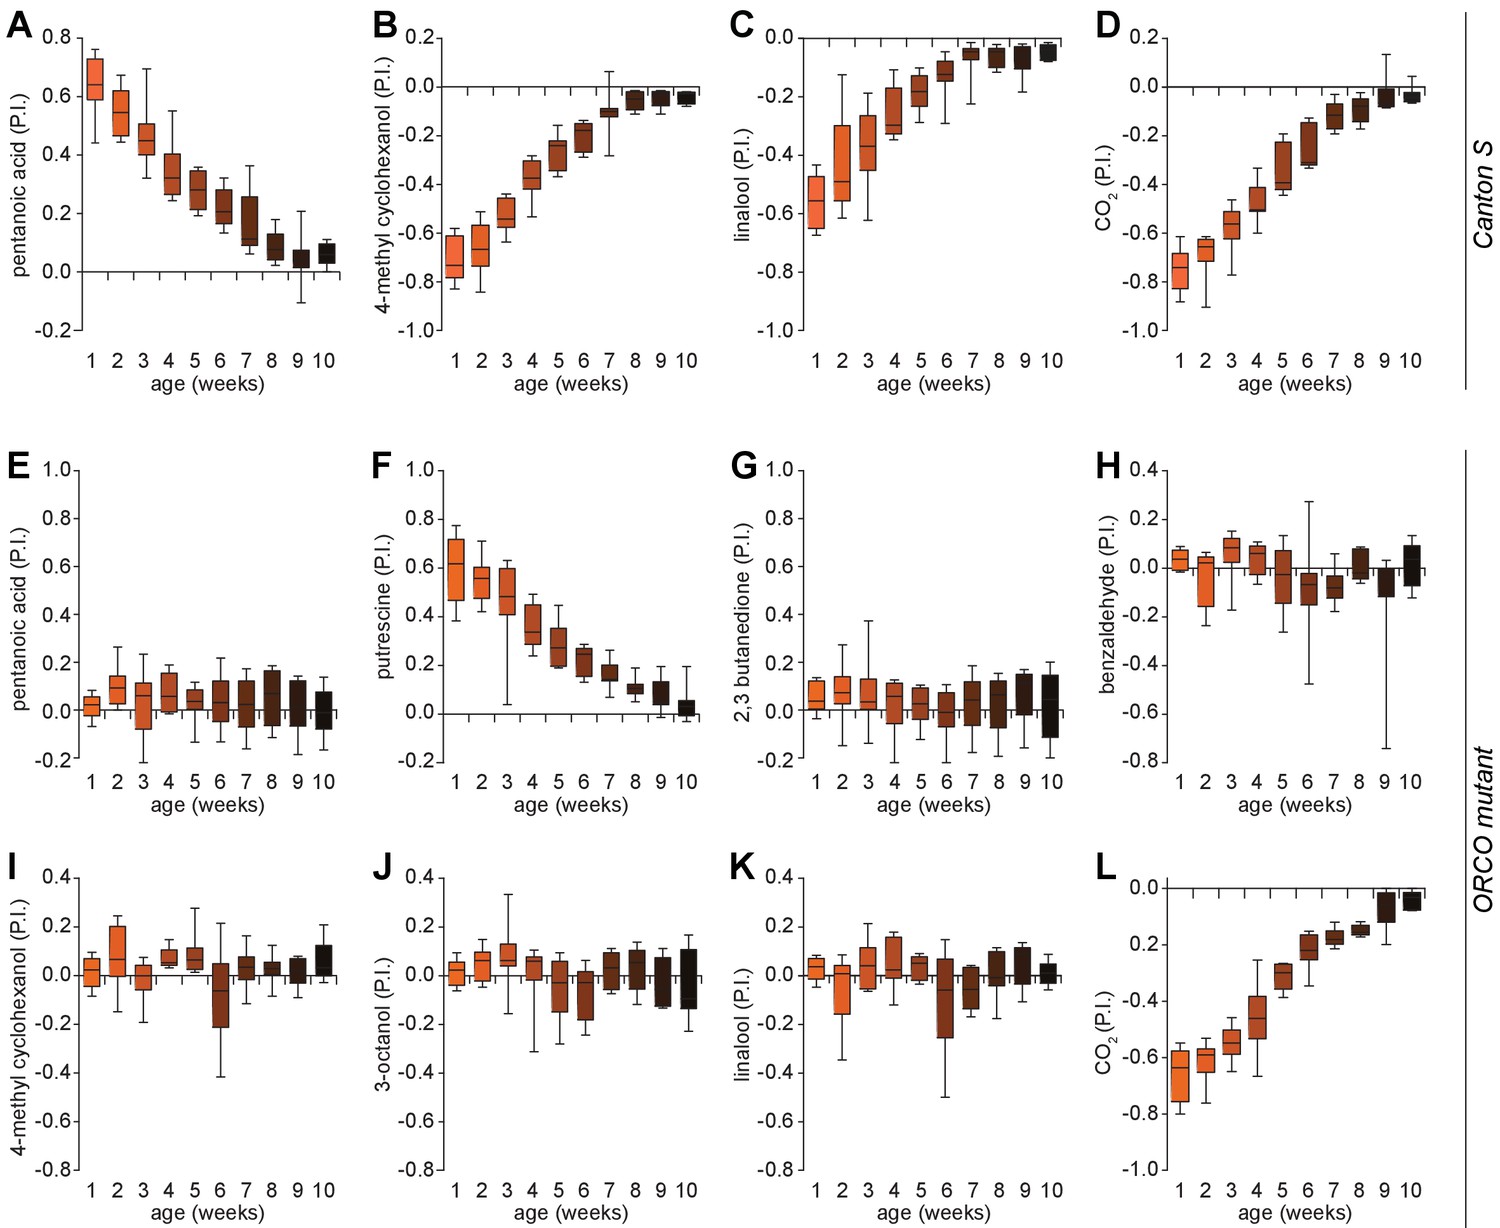
Functional decline affects odors detected by all receptor classes.
(A–D) Olfactory preference index of aging Canton S flies to attractive (pentanoic acid) and aversive odors (4-methyl cyclohexanol, Linalool, CO2) in the T-maze assay. Y-axis indicates the preference index (P.I.) to odors while X-axis denotes the age (weeks) of the tested flies. (E–G) Aging affects all classes of OSNs. Olfactory preference index of the odorant receptor co-receptor ORCO mutant aging flies in the T-maze assay in response to three attractive odors (pentanoic acid, putrescine, 2–3 butanedione). Y-axis indicates the preference index (P.I.s) to odors while X-axis denotes age (weeks) of the tested flies. Flies show response to putrescine (F), because it is detected by ionotropic receptors class (IR41a) instead of olfactory receptors (Hussain et al., 2016a). (H–L) Olfactory preference index of the aging Canton S flies in the T-maze assay in response to five aversive odors (Benzaldehyde, four methyl cyclohexanol, 3-octanol, Linalool, and CO2). Flies show response to CO2 (L), because it is detected by gustatory receptors (Gr21a, Gr63a) (Jones et al., 2007) instead of olfactory receptors. Box plot shows median and upper/lower quartiles (n = 8, 60 flies/trial 30 ♀ and 30 ♂). All p-values were calculated via two-way ANOVA with the Bonferroni multiple comparison posthoc test (ns >0.05, *p≤0.05, **p≤0.01, ***p≤0.001).
Figure 2 with 3 supplements
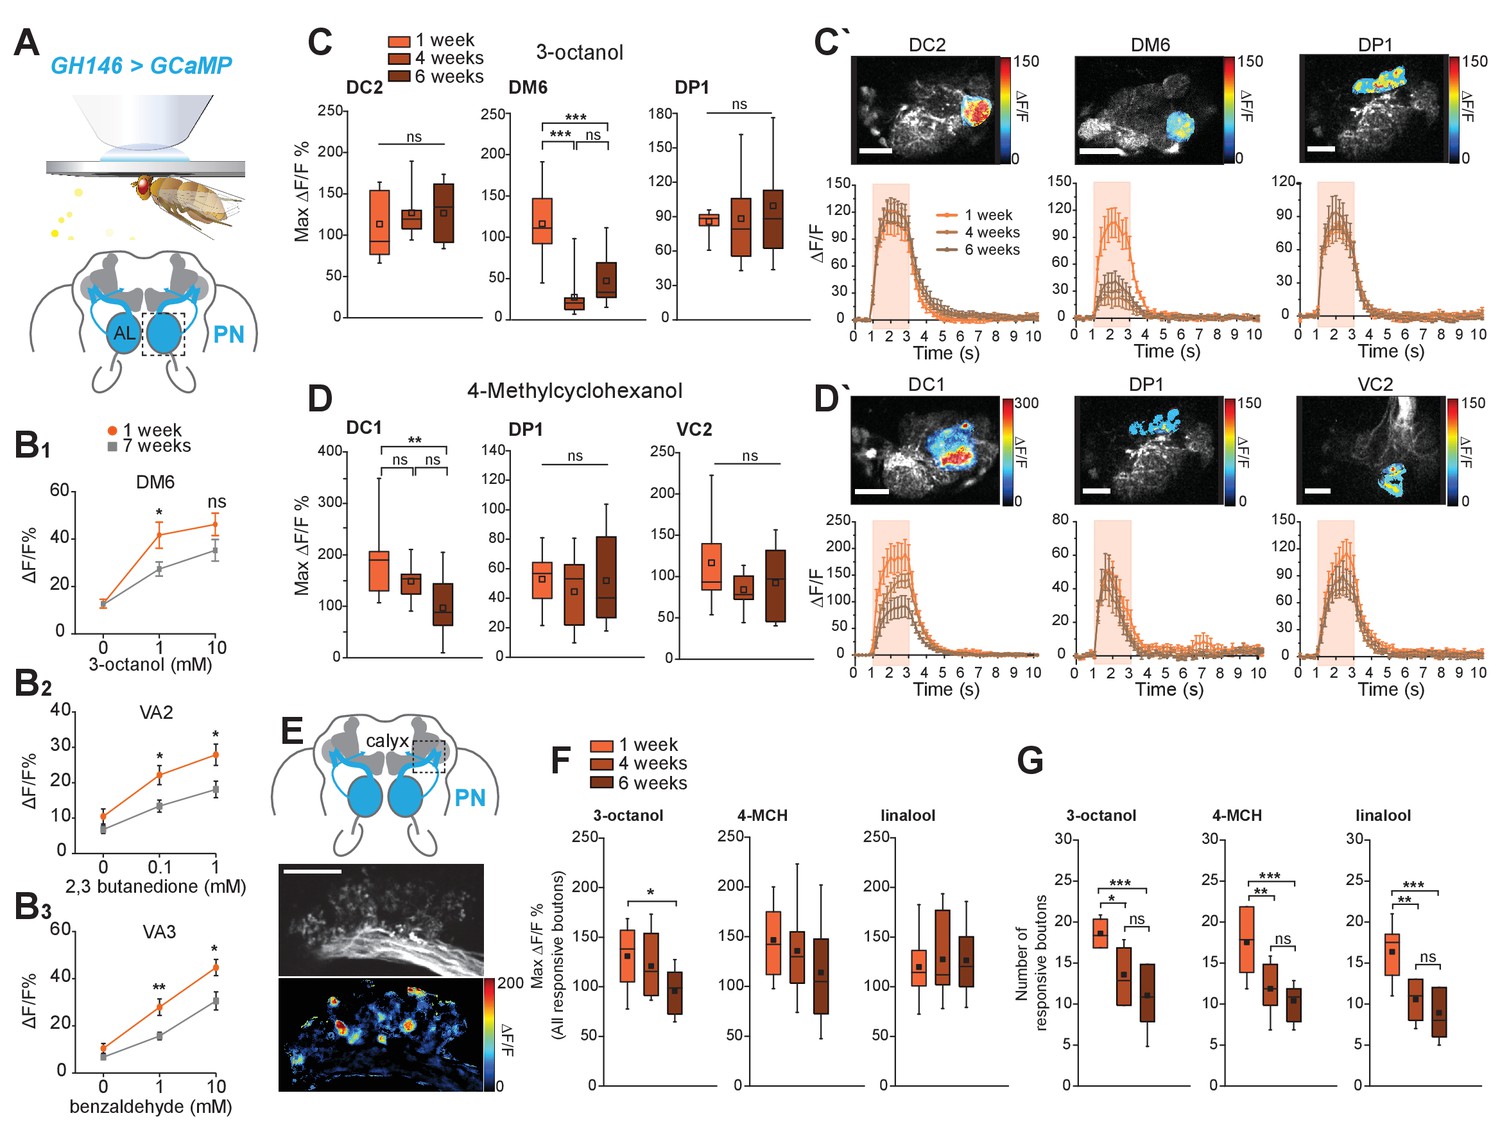
Cholinergic projection neurons functionally decay with age.
(A) Scheme of in vivo functional imaging preparation. The Ca2+ sensor GCaMP3 is expressed in projection neurons (PNs) under the control of GH146-Gal4 (GH146-Gal4;UAS-GCaMP3 or GH146 > GCaMP). (B1-3) In vivo calcium imaging in PNs (GH146-Gal4;UAS-GCaMP3.0) at the level of the AL using epifluorescence microscopy. The neural response of 1 week and 7 weeks old flies to increasing concentrations of benzaldehyde, 2,3-butanedione and 3-octanol was compared (n = 8 ± SEM). Graphs represent the quantification of neural peak ΔF responses (in %ΔF/F) in the strongest responding glomeruli to different concentrations of odors for 1 week and 7 weeks old flies (n = 8 ± SEM). All GCaMP3-fluorescence responses were calculated in %ΔF/F. All p-values were calculated via Student’s t-test (ns > 0.05, *p≤0.05, **p≤0.01). (C, C´) GCaMP fluorescence changes are recorded in three different responsive glomeruli (DC2, DM6 and DP1) upon stimulation with 3-octanol (12 mM). (D-D´) GCaMP fluorescence changes were measured in three responsive glomeruli (DC1, DP1 und VC2) upon stimulation with 4-methylcyclohexanol (16 mM) in 1, 4 and 6 weeks old flies. (C, D) Maximum fluorescence changes of GCaMP3 upon odor stimulation in three different glomeruli. Scale bars: 20 µm. (C´, D´) Odor-induced fluorescence change of GCaMP3 is indicated as false color images (top row) for one representative animal. Fluorescence changes over time are shown in the lower row for each different glomerulus. The pink bars represent the time window of odor presentation. n = 9; one-way ANOVA with post hoc Bonferroni tests. ns, not significant (p>0.05). *p<0.05. **p<0.01. ***p<0.001. (E–G) Expression of the Ca2+ sensor GCaMP3 in PNs under the control of GH146-Gal4 visualized in two focal planes in presynaptic boutons of projection neurons in calyces. Scale bars: 20 µm. (E) Representative image of in vivo two-photon imaging of fluorescence of GCaMP3 in PNs (GH146 > GCaMP) at their axonal extensions (boutons) in the mushroom body calyx is shown in the top image. Odor-induced fluorescence changes of GCaMP3 are indicated as false color images (bottom image) for one representative animal. (F) Maximal fluorescence changes of GCaMP3 in individual responsive boutons and (G) number of responsive boutons upon stimulation with 3-octanol (12 mM), 4-methylcyclohexanol (16 mM) or linalool (11 mM) in the two imaged focal planes. n = 9–11; one-way ANOVA with post hoc Bonferroni tests. ns, not significant (p>0.05). *p<0.05. **p<0.01. ***p<0.001. All traces represent mean ±SEM of ΔF/F values. Box plots indicate means, medians, interquartile ranges, and 1–99% ranges.
-
Figure 2—source data 1
Source data for Figure 2 and Figure 2—figure supplements 1—3.
- https://doi.org/10.7554/eLife.32018.009
Figure 2—figure supplement 1
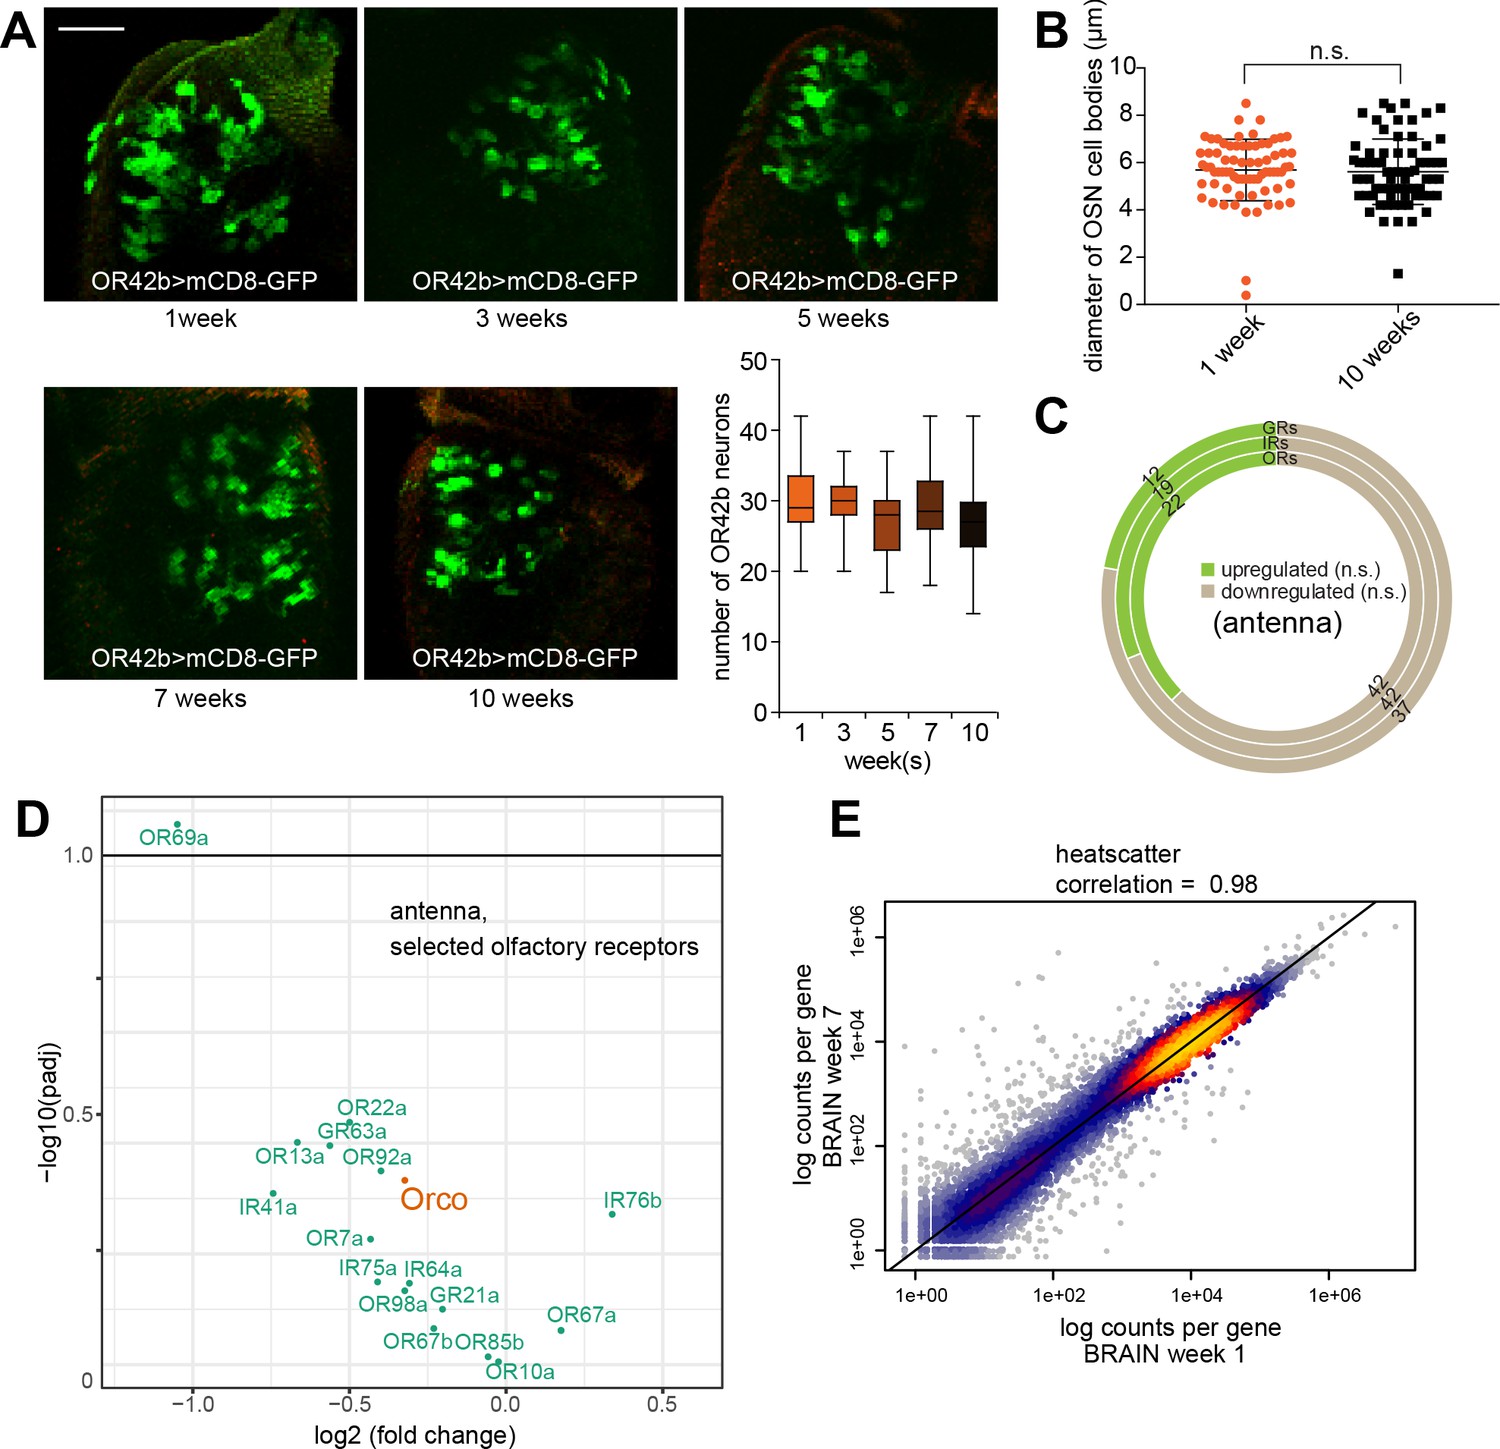
Olfactory receptor neuron are not affected by aging.
(A) Expression of a reporter construct for specific olfactory sensory neurons (OSN) in 1–10 weeks old flies with a transgenic reporter construct (Or42b-Gal4;UAS-mCD8GFP). Scale bars: 15 µm. Box plot shows median and upper/lower quartiles for the number of OR42b neurons in 1–10 weeks old flies. No difference in OSN number was detected between young (1 week) and older flies (10 weeks). P-value was calculated via one-way ANOVA (ns >0.05, *p≤0.05, **p≤0.01, ***p≤0.001). (B) The size of OSN cell bodies did not change during aging (OR42b > mCD8 GFP labeled cell bodies of 1 week vs. 10 weeks old flies; N = 20 flies per group, n = 71 and 72 neurons). P-value was calculated using Standard t-test. (C) Number of all ORs, IRs, and GRs upregulated and downregulated (non-significantly) in 7 weeks old fly antenna during aging. In addition, some receptors remained unchanged between the two conditions. (D) Volcano plot of RNA-sequencing data of selected olfactory receptor genes displaying the receptors that are involved in recognition of the tested odorants. Only genes above the cutoff of –log10 (p-value adjusted (padj)) are considered significantly changed. (E) Scatter plot displaying the correlation of gene expression between samples from 1 and 7 weeks old brains. The high correlation indicates that the majority of genes in the brain remains unchanged, while a smaller number of genes change their expression.
Figure 2—figure supplement 2

Olfactory receptor neurons still respond to odors in aged animals.
(A) Schematic illustration of the electrophysiology setup. (B–H) Neural activity of olfactory sensory neurons (OSNs) in electrophysiological single sensilum recordings (SSR) in response to 10 mM of attractive (2,3-butanedione, hexanoic acid, 1-propanol) and aversive (acetophenone,1-octen-3-ol, Benzaldehyde, CO2, 3-octanol) odors. The responses were compared between 1 week and 5 weeks old flies (n = 8 ± SEM). Each graph shows responses (spike/sec) on the Y-axis while the X-axis indicates the age (weeks) of the flies. (n = 8). Sample response traces are displayed on the right side of each graph. (J) Neural activity response (spike/sec) of young (1 week) and old (7 weeks) flies that show normal aversion (responders) and no aversion (non-responders) in T-maze assay, to aversive odor 3-octanol. The flies were sorted by behavioral performances before the SSR experiments. Responders were flies that showed the expected young fly behavioural response to an odor, while non-responder flies did not respond to an odor as expected in the olfactory behaviour assay. Y-axis shows neural response (spike/sec) whereas X-axis indicates the concentration of the odor (n = 8). (K) Neural activity response (spike/sec) of young (1 week) and old (7 weeks) flies that show normal attraction (responders) and no attraction (non-responders) in the T-maze assay, to attractive odor 2,3-butanedione. Y-axis shows neural responses (spike/sec), whereas the X-axis indicates the concentration of the odor (n = 8). These data suggest that behavioral changes do not correlate with responses of OSNs to odors.
Figure 2—figure supplement 3
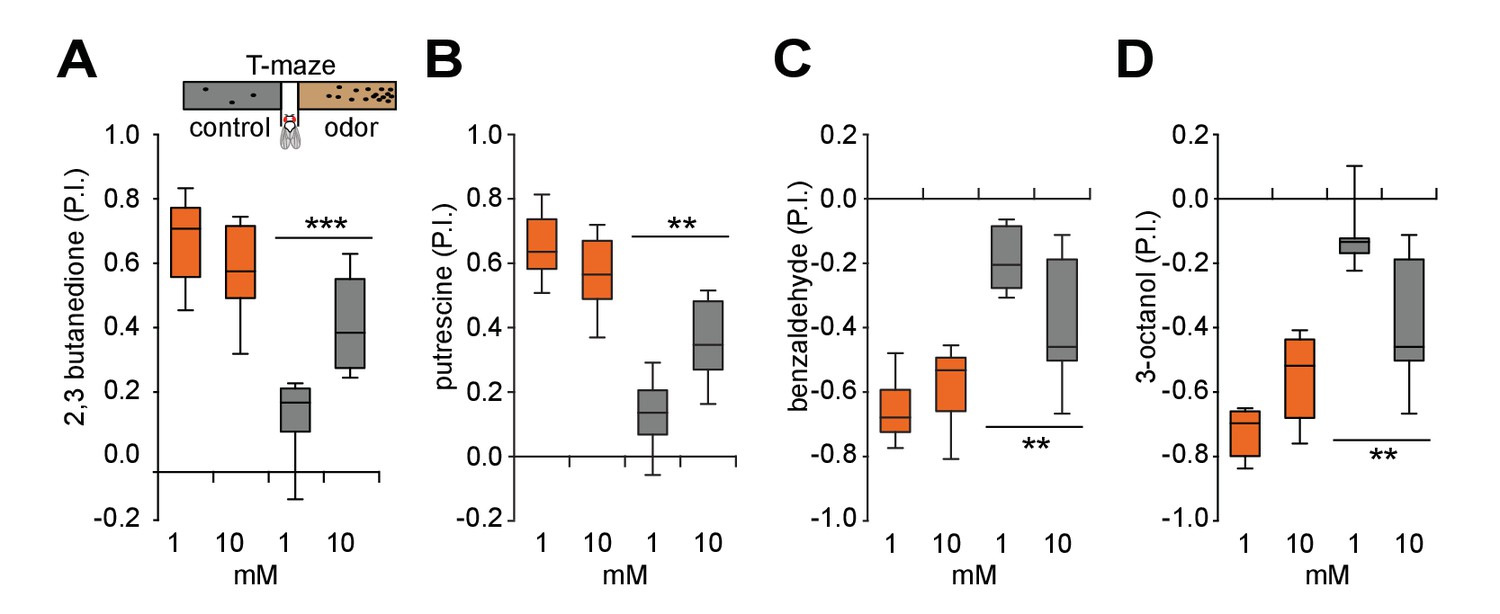
Older flies show strongly improved behavior to higher odor concentrations.
(A-D) Schematic illustration of the T-maze olfactory assays (top, left). Olfactory preference index of the 1 week (orange) and 7 weeks (grey) old wildtype (Canton S) flies to standard 1 mM and increased 10 mM attractive (2,3-butanedione, putrescine) and aversive (benzaldehyde, 3-octanol) odors in the T-maze assay. Y-axis indicates the preference index (P.I.) to odors, while the X-axis denotes concentration of the tested odors. Note that the increase in odor concentration strongly improves the flies’ performance in the test suggesting that flies suffer from decreased sensitivity but not from failure to recognize and evaluate the odor. Box plot show median and upper/lower quartiles (n = 8, 60 flies/trial 30 ♀ and 30 ♂).
Figure 3

Changes in axon and synapse integrity could affect projection neuron function.
(A) Projection neurons (PNs) of a 1 and a 7 weeks old brains are labeled with a reporter line (GH146-Gal4;UASGCaMP3 or GH146 >GCaMP3) and stained with an anti-GFP antibody (green). AL, antennal lobe; cx, mushroom body calyx; LH, lateral horn; lateral cell body cluster is shown in dotted box. Scale bar: 25 µm. (B) Average number of PNs in the lateral, dorsal clusters and the total of both clusters. Orange boxes represent young flies (1 week), while grey boxes represent old flies (7 weeks) in all figures. There is a mild but significant decrease in the number of reporter-labeled PNs in aged flies (Students t-test, n = 19–21) (C) Average diameter of projection neuron cell body sizes of 1 (orange) and 7 (grey) weeks old flies. The cell bodies of PNs of aged flies are significantly smaller (Students t-test, n = 19–21). (D) The box plot shows that there is no change in the expression of NCad in the defined areas for quantification (antibody staining against N-cadherin as a synaptic marker) in 1 (orange) and 7 (grey) weeks old flies AL and LH (Students t-test, n = 19–21). (E) Normalized expression levels of the GCaMP reporter protein in PNs (GH146 >GCaMP3) in young and old flies. The expression was normalized to Ncad antibody staining. There is no reduction of GCaMP expression in old as compared to young flies, but instead a slight but significant increase (Students t-test, n = 19–21). (F) Volcano plot of RNA-sequencing data of selected genes displaying the genes that are downregulated and upregulated in 7 weeks old brains compared to 1 week old brains, respectively. Only genes above the cutoff of –log10 (p-value adjusted (padj)) are considered significantly changed (above black line). While several AChR receptors were significantly downregulated in the brain, this was not the case in the antenna (Figure 4—figure supplement 2C). In addition, several aging-related genes are upregulated in older brains. Selected genes are displayed and were color-labeled by gene ontology analysis (orange: aging; green: neuronal function). (G) Reporter construct showing the localization of acetylcholine receptor (AChR) Dα7 (GH146-Gal4;UAS-Dα7-GFP, stained with anti-GFP antibody (green)) and ToPro nuclear marker (shown in pink) in the AL and lateral horn (LH). There is a decline at PN postsynaptic sites in the AL supporting an aging-related decline in the integrity of cholinergic synapses. For instance, the localization of Dα7 at presynaptic terminals and axons is lost in old flies (n = 20/20) in contrast to young animals (n = 0/20). See missing signal in axon and presynaptic terminals in the MB calyx and LH. Scale bar: 25 µm (H) Quantification of mean gray value (MGV) of ToPro staining of cell bodies in the area of the LH revealed a decrease in the number of cells in old as compared to young flies (n = 20). (I) A box plot shows a significant reduction in the AChR Dα7 reporter construct signal (mean grey value, MGV) of 7 weeks old flies (grey) compared to 1 week old flies (orange) at the level of the AL. Box plots show median and upper/lower quartiles. All p-values represent: ns > 0.05, *p≤0.05, **p≤0.01, ***p≤0.001. (J) Representative images of antennal lobes of 1 and 7 weeks old flies. Brains express the reporter mito-mcherry in PNs (GH146-Gal4;UAS-mito-mcherry; anti-RFP, red) and are stained for anti-ChAT (blue). (K) Representative images of the mushroom body calyx of 1 and 7 weeks old flies. (L) Quantification of relative expression of a mitochondria reporter (GH146-Gal4;UAS-mito-mcherry) and ChAT in AL, LH, and calyx. Note that mitochondria and ChAT staining are significantly reduced in the MB calyx as compared to an mito-mcherry or ChAT expression in other parts of the brain in old flies as compared to younger animals (see methods). This suggests that ChAT does not decrease equally in all brain parts, but in particular in areas such as the MB calyx. Graphs display mean relative levels ± SEM. Student’s t-test: ns > 0.05, *p≤0.05, **p≤0.01, ***p≤0.001. (M) Confocal and high-resolution STED microscopy images in the calyx of flies expressing BRP-shortGFP under control of GH146-Gal4 driver line. Green and magenta represent anti-GFP and anti-Drep2C-Term immunostaining, respectively. White squares in (M, left column) indicate the magnified region in (M, right column). Scale bars represent 2 μm in (M, left) and 0.5 μm in (M, right). (N) Number of active zones and (O) postsynaptic densities significantly decrease upon aging. n = 10–12; Student’s t-test. ***p<0.001. Box plots indicate means, medians, interquartile ranges, and 1–99% ranges.
-
Figure 3—source data 1
Source data for Figure 3.
- https://doi.org/10.7554/eLife.32018.011
Figure 4 with 3 supplements
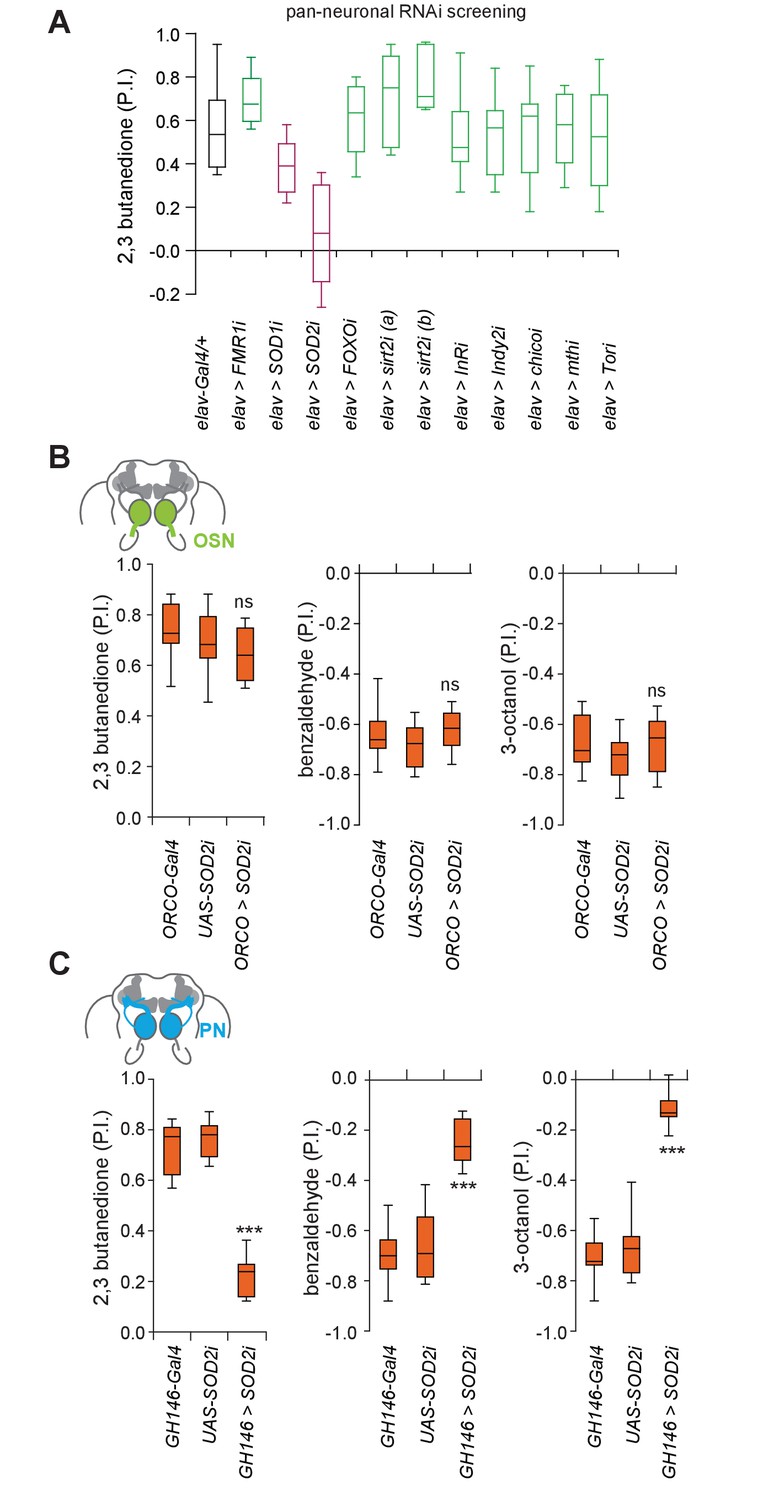
Superoxide dismutase two is selectively required in projection neurons.
(A) RNAi knockdown behavioral screening of selected candidate genes involved in systemic aging, in the T-maze assay. RNAi Knockdown of SOD2 (superoxide dismutase 2) pan-neuronally using the line elav-Gal4 (elav >SOD2 i) in 3 weeks old flies significantly reduced olfactory attraction to 2,3 butanedione. In addition, two mutants (3 weeks of age) of autophagy genes did not show a defect in olfactory preference behavior (see Figure 4—figure supplement 1A) (B) RNAi knock-down of SOD2 in OSNs had no effect on the flies’ olfactory preference suggesting that OSNs might be less sensitive to oxidative stress. Box plots show olfactory PIs of 1 week old flies expressing an RNAi knock-down construct for SOD2 under the control of ORCO, which is expressed broadly in OSNs (ORCO-Gal4;UAS-SOD2-RNAi) and their genetic controls to 2,3-butanedione, benzaldehyde and 3-octanol in the T-maze assay. (C) RNAi knock-down of SOD2 in PNs using the GH146-Gal4 (GH146-Gal4;UAS-SOD2-RNAi), results in strongly diminished olfactory preference of flies to 2,3-butanedione, benzaldehyde and 3-octanol. Box plots show median and upper/lower quartiles (n = 8, 60 flies/trial, 30 ♀ and 30 ♂). All p-values were calculated via one-way ANOVA with the Bonferroni multiple comparison posthoc test (ns >0.05, *p≤0.05, **p≤0.01, ***p≤0.001).
-
Figure 4—source data 1
Source data for Figure 4 and Figure 4—figure supplements 1 and 3.
- https://doi.org/10.7554/eLife.32018.016
Figure 4—figure supplement 1

Autophagy mutants show normal olfactory behavior.
(A) Olfactory preference index of two different autophagy gene mutant (atg-/-) flies (3 weeks old) to attractive (putrescine, 2,3-butanedione) and aversive odors (benzaldehyde, 3-octanol) in the T-maze assay suggests that autophagy is not involved in innate olfaction. Box plot shows median and upper/lower quartiles (n = 8, 60 flies/trial 30 ♀ and 30 ♂). (B) Box plots show olfactory preference index (P.I.) of 1 week old transgenic flies carrying an in vivo RNAi construct to knock-down SOD2 pan-neuronally under the control of elav-Gal4 (elav-Gal4;UAS-SOD2-RNAi) and their genetic controls to 2,3-butanedione, benzaldehyde and 3-octanol in the T-maze assay. P-values were calculated via one-way ANOVA with the Bonferroni multiple comparison posthoc test (A) or with the t-test (B) (ns >0.05, *p≤0.05, **p≤0.01, ***p≤0.001).
Figure 4—figure supplement 2

SOD1 and SOD2 are downregulated in aged brains.
(A) RNA-seq expression of the total number of genes expressed in the 1 week (orange) and 7 weeks (grey) fly antenna. Y-axis represents total number of genes expressed in the antenna, while the x-axis shows the age of flies in weeks. Doughnut chart represents the number of genes upregulated (green) and downregulated (light brown) in 7 weeks old antennae compared to one week old. (B) RNA-seq expression of the total number of genes expressed in 1 week (orange) and 7 weeks (grey) old fly brains. Y-axis represents total number of genes expressed in the brain, while the x-axis shows the age of flies in weeks. Doughnut chart represents the number of genes upregulated (green) and downregulated (light brown) in 7 weeks old brains, compared to one week old. (C) Volcano plot of RNA-sequencing data of selected genes displaying the genes that are downregulated and upregulated in 7 weeks old antennae and brains, respectively. Only genes above the cutoff of –log10 (p-value adjusted (padj)) are considered significantly changed. Note that SOD1 and 2 expression does not change significantly in the antenna. Both genes, however, are significantly downregulated in the brain of old flies. (D) Box plot show olfactory preference index (P.I.) of 1 week old transgenic flies expressing a knockdown-construct of SOD2 pan-neuronally under the mature neuron driver nsyb (nsyb-Gal4;UAS-SOD2-RNAi) and their genetic controls to 2,3-butanedione, benzaldehyde and 3-octanol in the T-maze assay. Box plot shows median and upper/lower quartiles (n = 8, 60 flies/trial 30 ♀ and 30 ♂). All p-values were calculated via two-way ANOVA with the Bonferroni multiple comparison posthoc test (ns >0.05, *p≤0.05, **p≤0.01, ***p≤0.001).
Figure 4—figure supplement 3

Lifespan of experimental and control groups.
(A) Survivorship of flies with RNAi knockdown of SOD2 in projection neurons using the GH146-Gal4 (GH146-Gal4;UAS-SOD2-RNAi) and their genetic control (GH146-Gal4) shown in line graphs. Y-axis represents % survivorship, while the x-axis shows the age of flies in weeks (n = 200 ± SEM). (B) Survivorship of flies with overexpression of SOD2 in PNs using the GH146-Gal4 (GH146-Gal4;UAS-SOD2) and their genetic controls (GH146-Gal4) shown in the line graph. Y-axis represents % survivorship, while the x-axis shows the age of the flies in weeks (n = 100 ± SEM, three replicates). (C) Survivorship of flies raised from day one on Resveratrol (grey line), L. plantarum (lime green), and standard fly food (magenta). Y-axis represents % survivorship, while the x-axis shows the age of flies in weeks (n = 100 ± SEM, three replicates). Please note that these survival curves are not intended to test the effect of the treatment on lifespan, but rather to correlate the lifespan of individual test and control groups with their behavioral performance to exclude unspecific effects of general health.
Figure 5
SOD2 deprived PNs resemble neurons in aged brains.
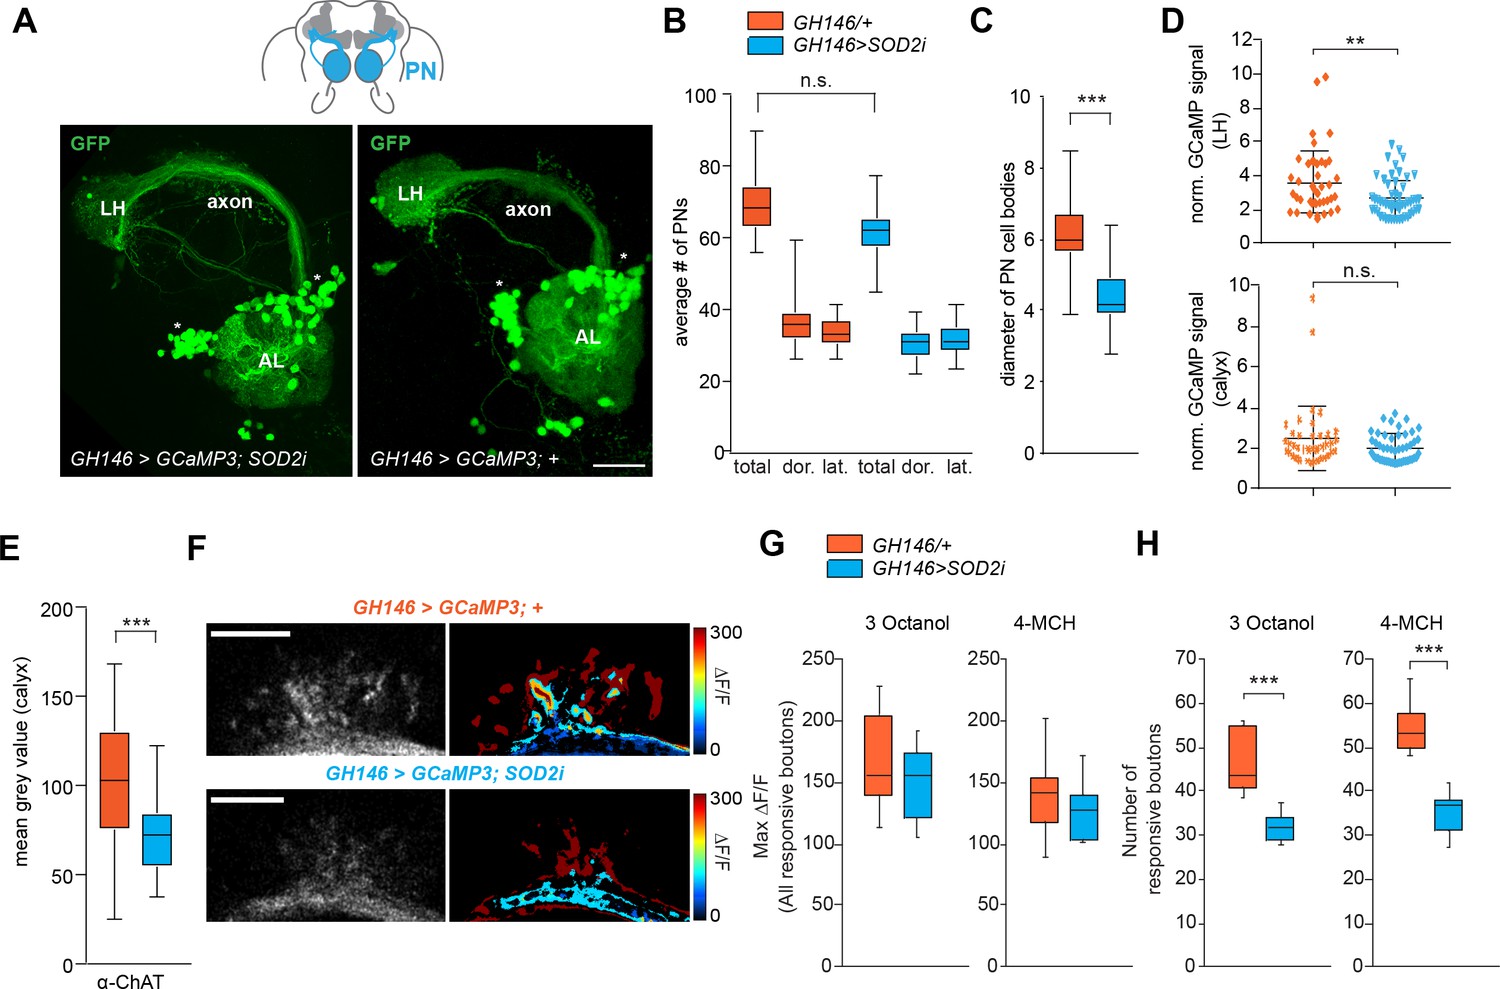
(A) SOD2 RNAi (GH146-Gal4;UAS-SOD2i) expressing and SOD2 RNAi negative controls labeled with the reporter line (GH146-Gal4;UASGCaMP3 or GH146 >GCaMP3) and stained with an anti-GFP antibody (green). AL, antennal lobe; cx, mushroom body calyx; LH, lateral horn; lateral cell body cluster is shown in dotted box. Scale bar: 25 µm. (B) Average number of PNs in the lateral, dorsal clusters and the total of both clusters. Orange boxes represent 1 week control flies, while blue boxes represent flies carrying GH146 >SOD2 i in all figures. There is no significant decrease in the number of reporter-labeled PNs upon SOD2 knock-down (Students t-test, n = 19–21) (C) Average diameter of projection neuron cell body sizes of controls (orange) and SOD2 knock-down flies (blue). The cell bodies of PNs are significantly smaller when SOD2 is reduced exclusively in PNs (Student’s t-test, n = 19–21). (D) Scatter plots showing normalized GCaMP signal stained with α-GFP antibody (MGV). The intensity of staining within the LH (upper panel) and within the calyx (bottom panel) was normalized to the background signal in a non-GFP positive brain area of the same brain (Student’s t-test, n = 28). (E) Mean gray value (MGV) of anti-ChAT antibody staining in the MB calyx. Note that knocking-down SOD2 in PNs significantly reduced the ChAT signal (Student’s t-test, n = 28). (F) Representative image of in vivo two-photon imaging of fluorescence of GCaMP3 in PNs (GH146 >GCaMP) at their axonal extensions (boutons) in the mushroom body calyx for test (GH146 >GCaMP;SOD2i) and control flies (GH146 >GCaMP;+). Odor-induced fluorescence change of GCaMP3 are indicated as false color images (right column) for one representative animal of each genotype. Scale bars: 20 µm. (G) maximal fluorescence changes of GCaMP3 in individual responsive boutons and (H) number of responsive boutons upon stimulation with 3-octanol (12 mM) or 4-methylcyclohexanol (16 mM) in the two imaged focal planes. n = 10; Student’s t-test. (ns >0.05, *p≤0.05, **p≤0.01, ***p≤0.001). Box plots indicate means, medians, interquartile ranges, and 1–99% ranges.
-
Figure 5—source data 1
Source data for Figure 5.
- https://doi.org/10.7554/eLife.32018.018
Figure 6 with 1 supplement
Expression of SOD2 in single neuron subtype fully rescues olfactory degeneration.
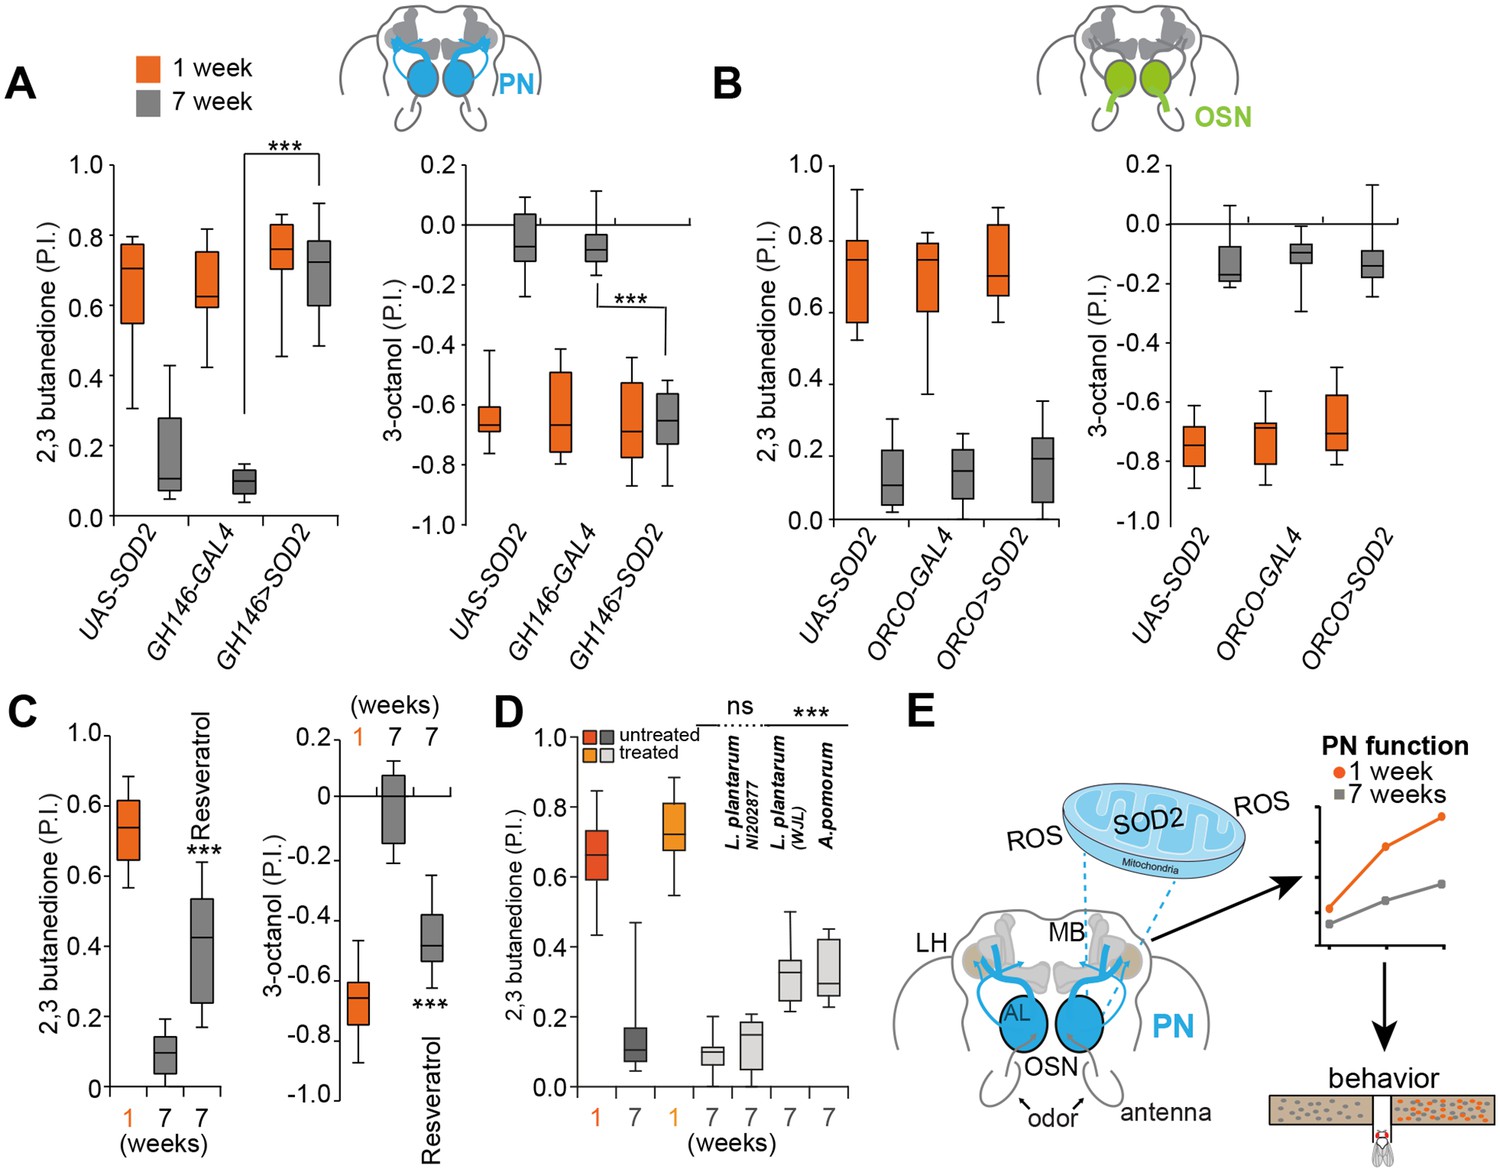
(A) Box plots show PIs of 1 week old (orange boxes) and 7 weeks old (grey boxes) transgenic flies overexpressing SOD2 exclusively in projection neurons (PNs) (GH146-Gal4;UAS-SOD2) and their genetic controls in response to attractive (2,3-butanedione) and aversive (3-octanol) odors. Note that expression of SOD2 exclusively in PNs fully rescues olfactory performance in 7 weeks old flies indicating that sensitivity to oxidative stress of PNs represents a key player in the aging-associated decline of the olfactory system. (B) Box plots show PIs of 1 week old (orange) and 7 weeks old (grey) transgenic flies overexpressing SOD2 under the control of ORCO-Gal4 in OSNs (ORCO-Gal4;UAS-SOD2) and their genetic controls in response to attractive (2,3-butanedione) and aversive (3-octanol) odors. Importantly, overexpression of SOD2 under the control of ORCO-Gal4 in OSNs had no effect on the behavior of old flies. (C) Box plots show preference of 1 week old and 7 weeks old flies raised on standard fly food (first two boxes) and 7 weeks old flies raised on standard fly food mixed with Resveratrol (third grey box) in response to attractive (2,3-butanedione) and aversive (3-octanol) odors. All p-values were calculated via t-test (ns >0.05, *p≤0.05, **p≤0.01, ***p≤0.001). In all figures, asterisks above a single bar refer to p-values of comparison to the control (7 weeks old flies in second bar). (D) Box plots show untreated and treated (flies were inoculated with the indicated bacterial strain after being pretreated to become germfree) 1 week old (light (treated) and dark orange (not germfree, standard conditions as in all other experiments before) and 7 weeks old (dark and light grey) flies. Treated flies were inoculated with Lactobacillus plantarum NI202877, L. plantarum WJL, Acetobacter pomorum (A.p.), while control flies were just raised on standard fly food. P.I.s of flies to the attractive odor 2,3-butanedione is shown. All p-values were calculated via two-way ANOVA with the Bonferroni multiple comparison posthoc test (ns >0.05, *p≤0.05, **p≤0.01, ***p≤0.001). Asterisks above a single box refer to p-values of comparison to the control (7 weeks old treated control). Box plot show median and upper/lower quartiles (n = 8, 60 flies/trial 30 ♀ and 30 ♂). (E) Summary and model of presented results. SOD2, the mitochondrial form of SOD, protects projection neurons (PN) from oxidative stress. Their vulnerability to oxidative stress and reactive oxygen species (ROS) appears to be the weak point of the olfactory system of Drosophila. The decline in function of PNs ultimately results in strongly reduced sensitivity to odors and accordingly diminishes behavioural responses.
-
Figure 6—source data 1
Source data for Figure 6 and Figure 6—figure supplement 1.
- https://doi.org/10.7554/eLife.32018.021
Figure 6—figure supplement 1
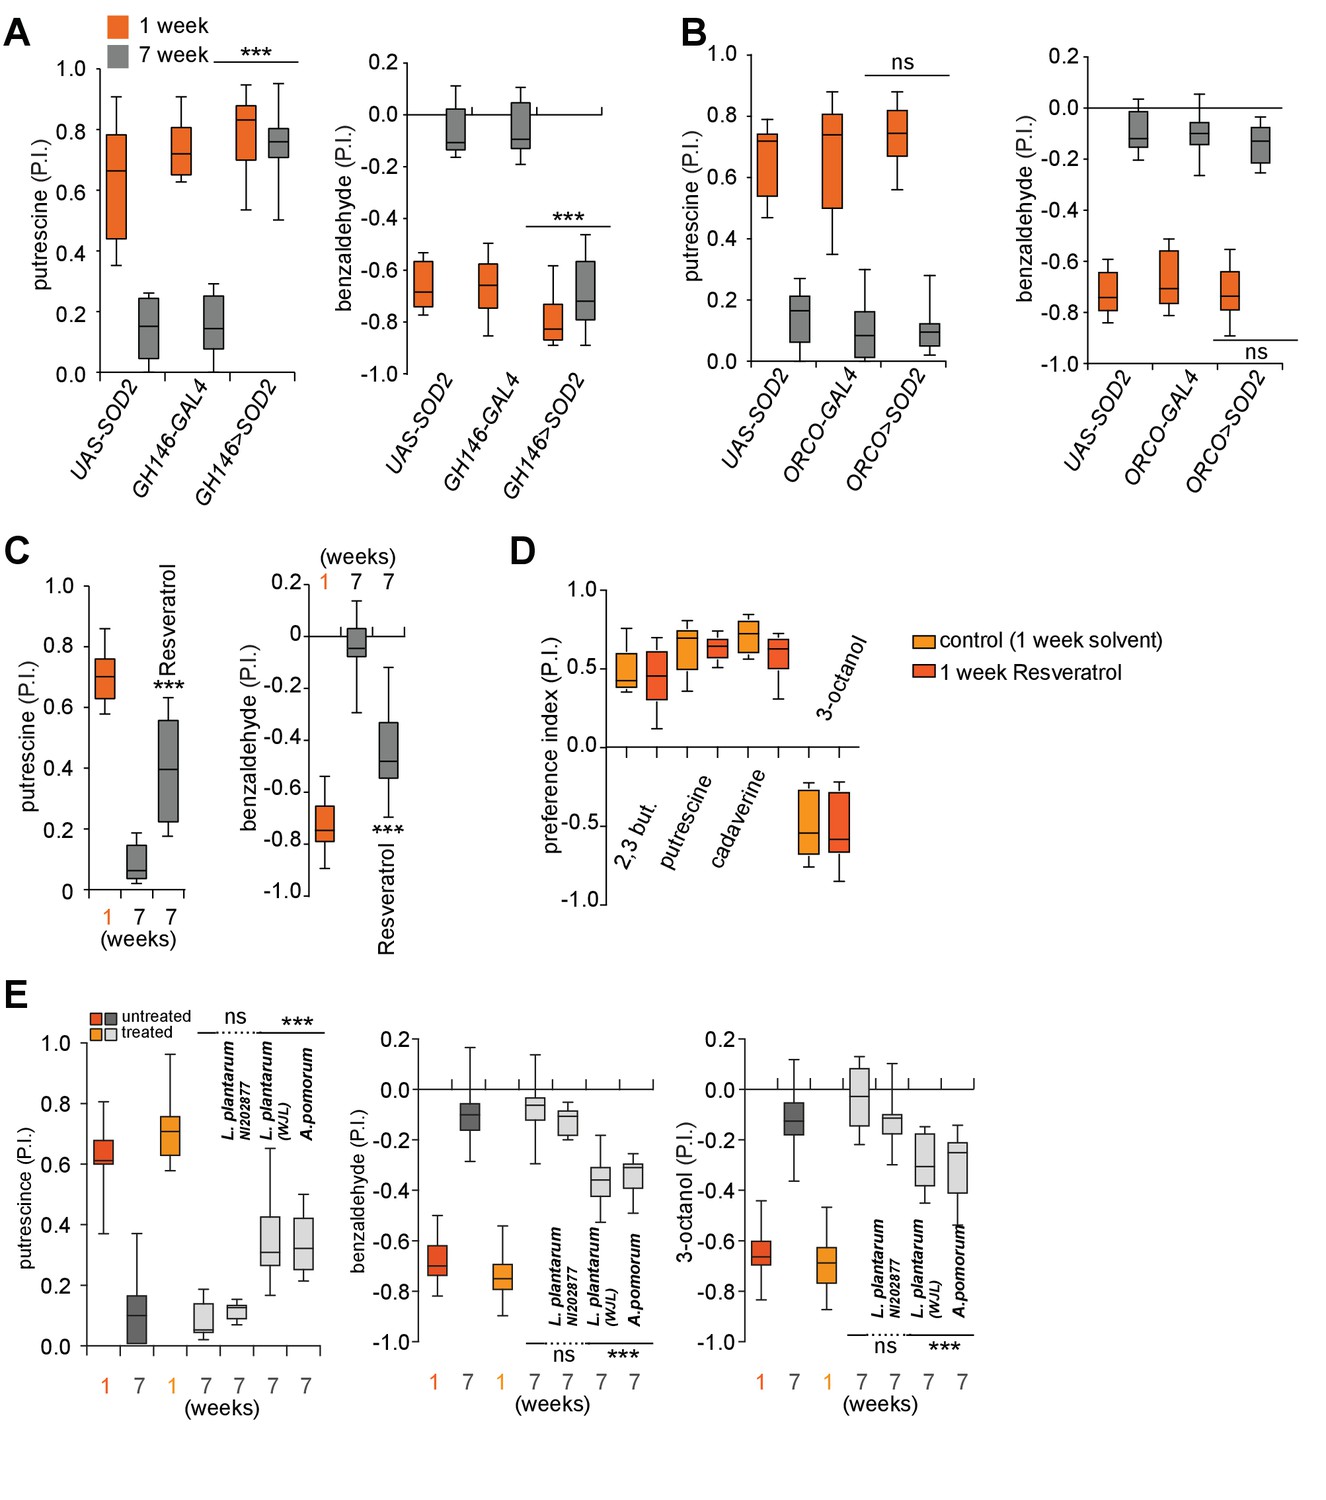
SOD2 and antioxidants slow down aging-associated olfactory decline.
(A) Box plots show P.I.s of 1 week old (orange bars) and 7 weeks old (grey bars) transgenic flies overexpressing SOD2 exclusively in projection neurons (PNs) (GH146-Gal4;UAS-SOD2) and their genetic controls in response to attractive (putrescine) and aversive (benzaldehyde) odors. (B) Box plots show P.I.s of 1 week old (orange bars) and 7 weeks old (grey bars) transgenic flies overexpressing SOD2 under the control of ORCO-Gal4 in OSNs (ORCO-Gal4;UAS-SOD) and their genetic controls in response to attractive (putrescine) and aversive (3-octanol) odors. (C) Box plots show preference of 1 week old and 7 weeks old flies raised on standard fly food (first two bars) and 7 weeks old flies raised on standard fly food mixed with Resveratrol (third grey bar) in response to attractive (putrescine) and aversive (benzaldehyde) odors. All p-values were calculated via t-test (ns >0.05, *p≤0.05, **p≤0.01, ***p≤0.001). In all figures, asterisks above a single bar refer to p-values of comparison to the control (7 weeks old flies in second bar). (D) Box plots show 1–2 weeks old flies raised on standard food with solvent or on standard fly food supplemented with Resveratrol for 1 week. There is no significant difference between the treated and control flies (n = 8). (E) Box plots show untreated and treated (flies were inoculated with the indicated bacterial strain after being pretreated to become germfree) 1 week old (light (treated) and dark orange (not germfree, standard conditions as in all other experiments before) and 7 weeks old (dark and light grey) flies. Treated flies were inoculated with Lactobacillus plantarum NI202877, L. plantarum WJL, Acetobacter pomorum (A.p.), while control flies were just raised on standard fly food. P.I.s of flies to attractive (putrescine) and aversive (benzaldehyde, 3-octanol) odors is shown. All p-values were calculated via two-way ANOVA with the Bonferroni multiple comparison posthoc test (ns >0.05, *p≤0.05, **p≤0.01, ***p≤0.001). Asterisks above a single bar refer to p-values of comparison to the control (7 weeks old treated control). Box plot show median and upper/lower quartiles (n = 8, 60 flies/trial 30 ♀ and 30 ♂).
Author response image 1
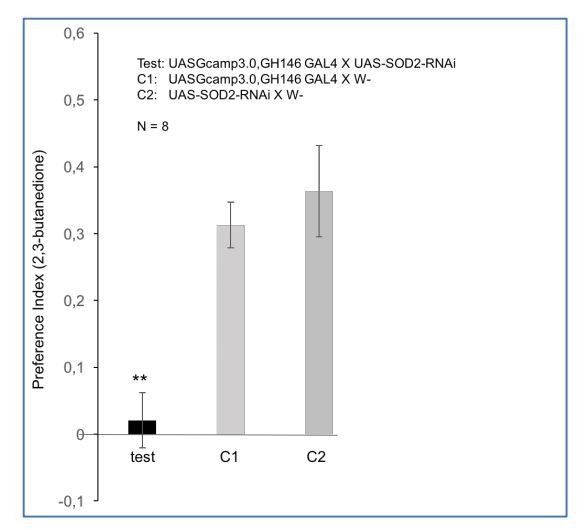
Figure shows olfactory preference index of 1 week old flies to 2,3-butanedione.
The effect of this alternative RNAi construct of SOD2 (Stock #32983) is similar to the effect observed for the construct used throughout our study. Please note that for this experiment, the flies also carried UAS-GCaMP3.0.
Author response image 2
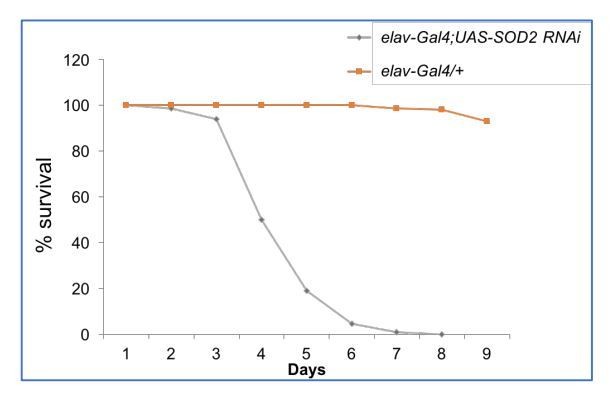
Figure shows lifespan measurements of flies overexpressing UAS-SOD2-RNAi (Stock #24489) under the control of a Pan-neuronal driver elav-Gal4 and the Gal4/+ control.
The results confirm previous results by Kirby et al., 2002.
Additional files
-
Source data 1
RNA sequencing all figures.
- https://doi.org/10.7554/eLife.32018.022
-
Supplementary file 1
Genes upregulated in brains of 7 weeks old flies vs. brains of 1 week old flies organized by GO (gene ontology) terms.
- https://doi.org/10.7554/eLife.32018.023
-
Supplementary file 2
Genes downregulated in brains of 7 weeks old flies vs. brains of 1 week old flies organized by GO (gene ontology) terms.
- https://doi.org/10.7554/eLife.32018.024
-
Transparent reporting form
- https://doi.org/10.7554/eLife.32018.025
Download links
A two-part list of links to download the article, or parts of the article, in various formats.
Downloads (link to download the article as PDF)
Open citations (links to open the citations from this article in various online reference manager services)
Cite this article (links to download the citations from this article in formats compatible with various reference manager tools)
Inhibition of oxidative stress in cholinergic projection neurons fully rescues aging-associated olfactory circuit degeneration in Drosophila
eLife 7:e32018.
https://doi.org/10.7554/eLife.32018


