The mechanism of variability in transcription start site selection
- Rutgers University, United States
- Institut de Biologie de l’Ecole Normale Supérieure (IBENS), CNRS, INSERM, PSL Research University, France
- Ligue Contre le Cancer, France
- Institut Jacques Monod, CNRS, UMR7592, University Paris Diderot, France
Figures
Figure 1 with 2 supplements
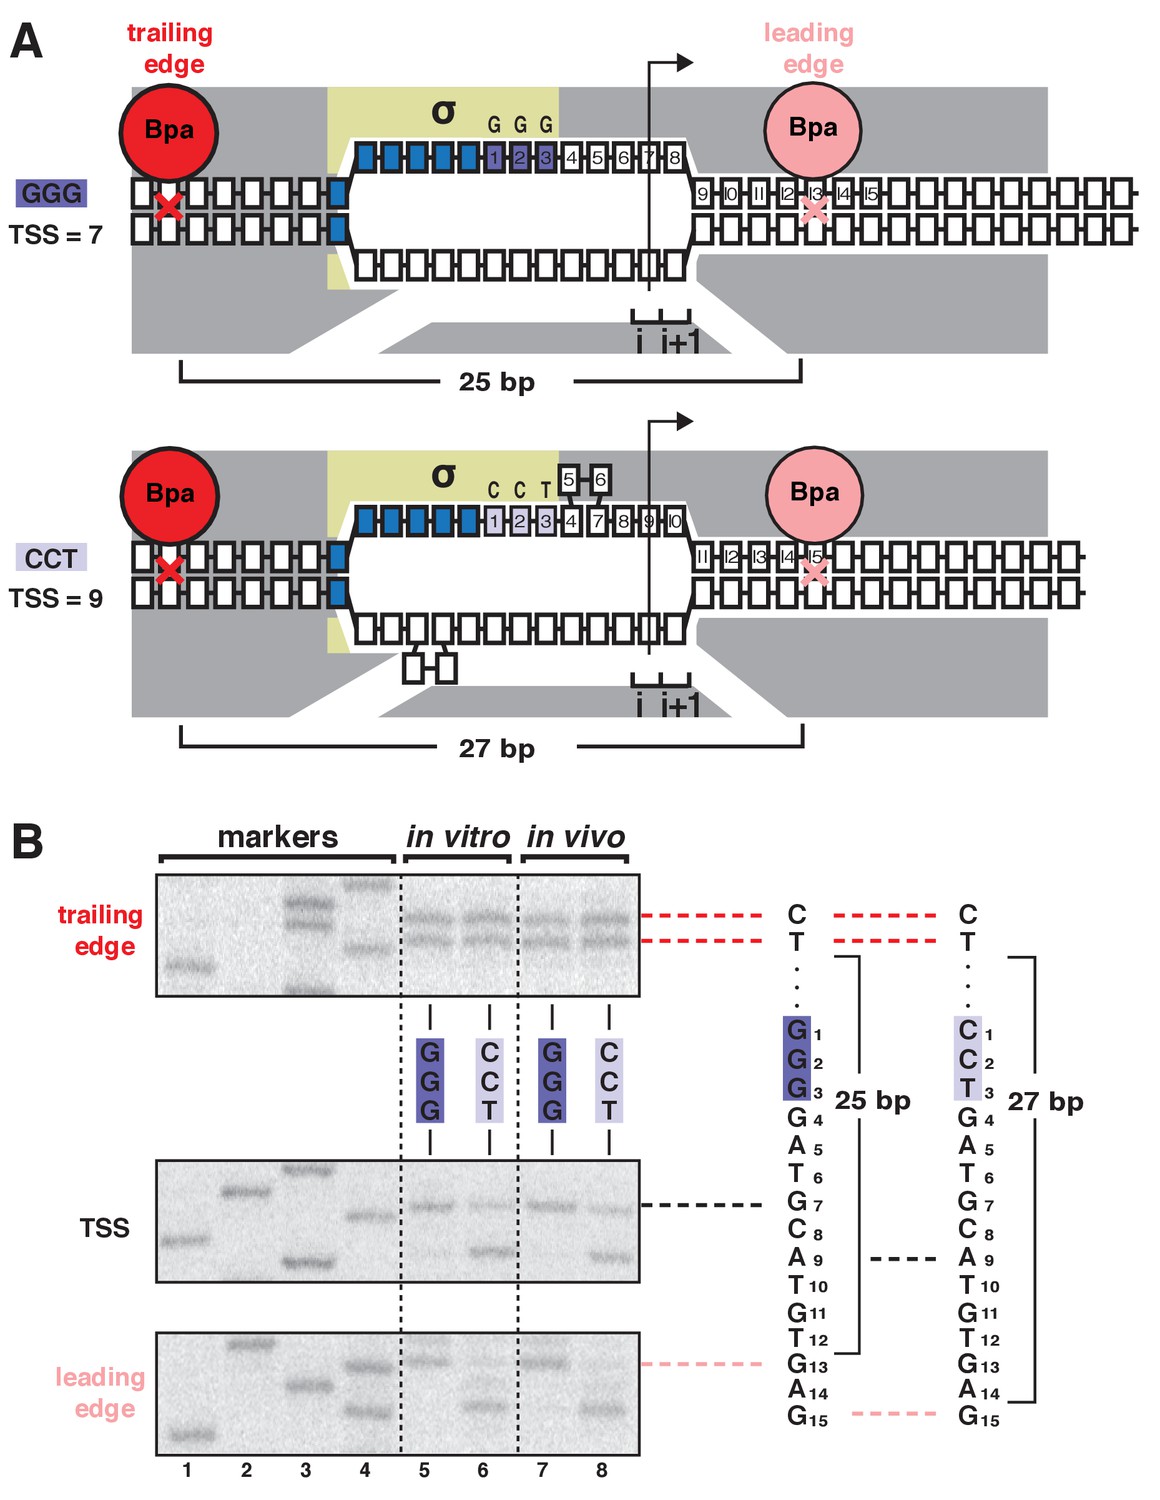
TSS selection exhibits first hallmark of scrunching--movement of RNAP leading edge but not RNAP trailing edge--both in vitro and in vivo.
(A) RNAP leading-edge and trailing-edge positions at promoters having GGG discriminator (TSS 7 bp downstream of −10 element; top) and CCT discriminator (TSS 9 bp downstream of −10 element; bottom). Changes in TSS selection result from changes in discriminator-sequence-dependent DNA scrunching. Gray, RNAP; yellow, σ; blue, −10-element nucleotides; dark purple, GGG-discriminator nucleotides; light purple, CCT-discriminator nucleotides; i and i + 1, NTP binding sites; arrow, TSS; boxes, DNA nucleotides (nontemplate-strand nucleotides above template-strand nucleotides; nucleotides downstream of −10 element numbered); red, trailing-edge Bpa and nucleotide crosslinked to Bpa; pink, leading-edge Bpa and nucleotide crosslinked to Bpa. Scrunching is indicated by bulged-out nucleotides. Distance between leading-edge and trailing-edge crosslinks is indicated below RNAP. (B) RNAP trailing-edge crosslinking (top), TSS (middle), and RNAP leading-edge crosslinking (bottom) for promoters having GGG discriminator and CCT discriminator, in vitro (lanes 5–6) and in vivo (lanes 7–8). Horizontal dashed lines relate bands on gel (left) to nucleotide sequences (right).
Figure 1—figure supplement 1
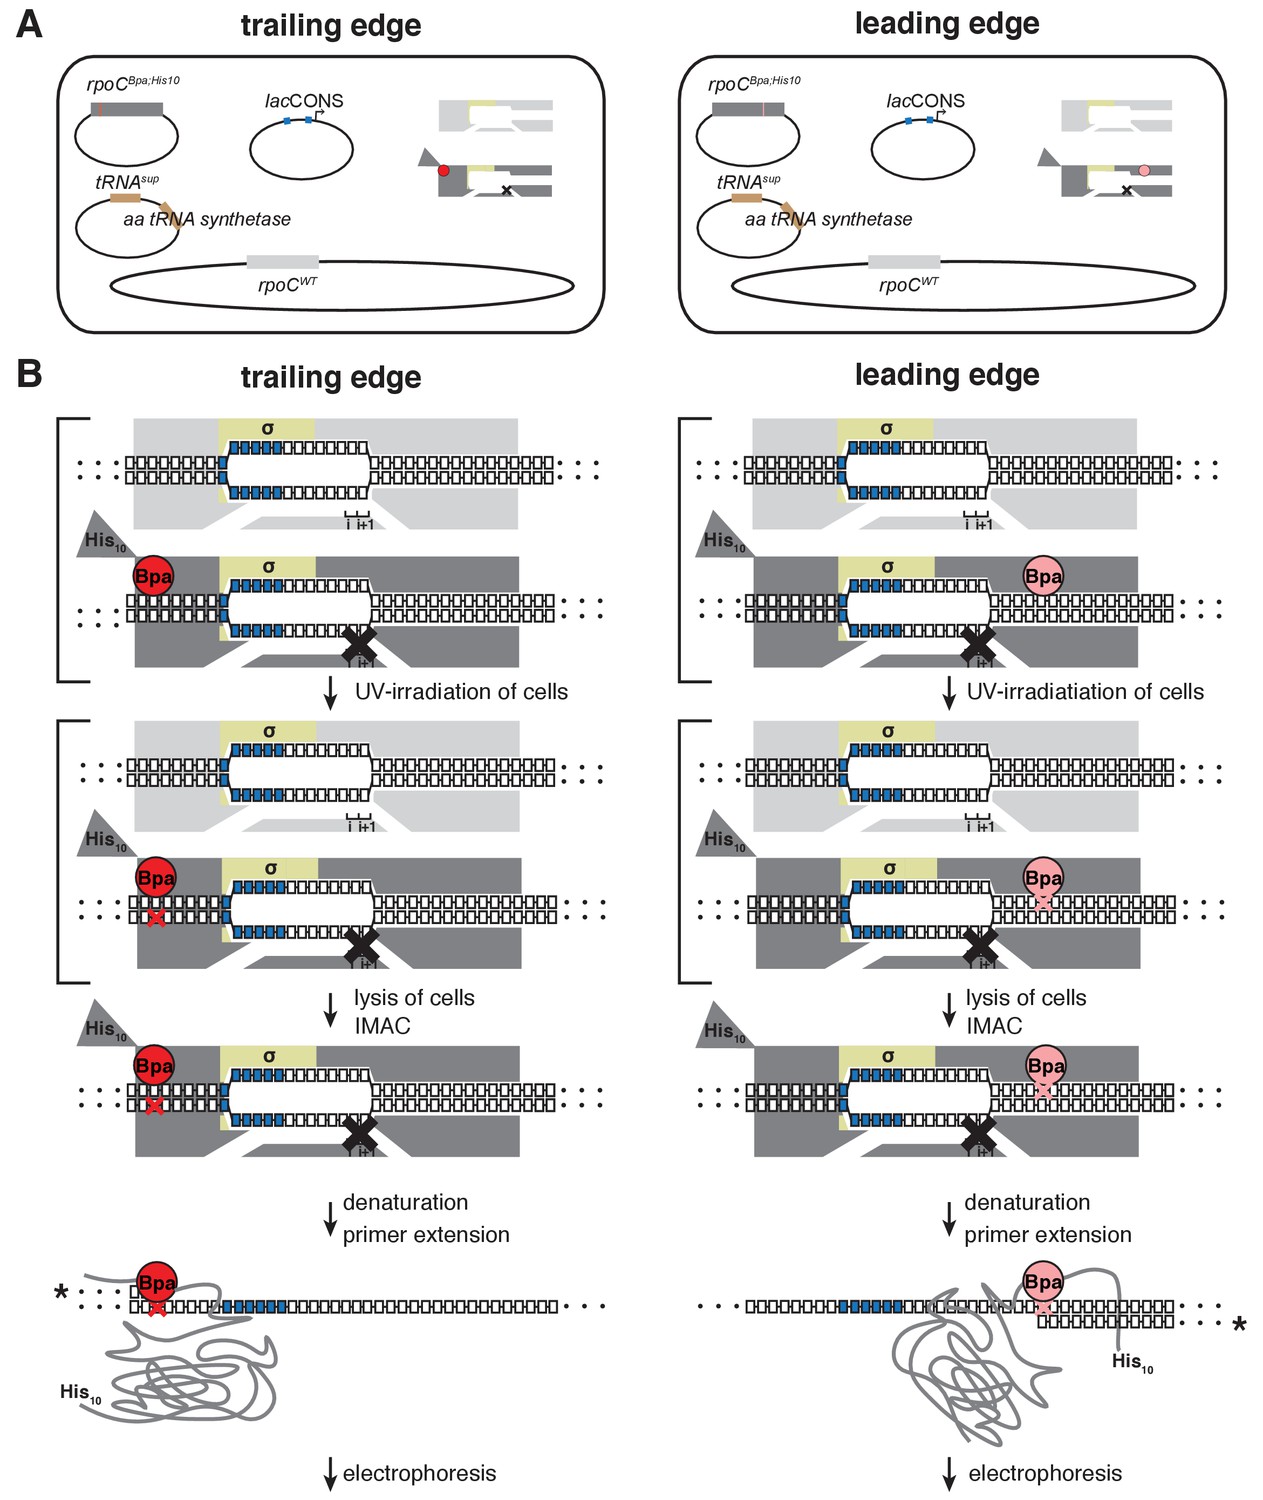
Unnatural-amino-acid mutagenesis and protein-DNA photocrosslinking in vivo.
Left column, procedure for mapping RNAP trailing edge relative to DNA in vivo. Right column, procedure for mapping RNAP leading edge relative to DNA in vivo. (A) Three-plasmid merodiploid system for co-production, in E. coli cells, of Bpa-labeled, decahistidine-tagged, mutationally inactivated, RNAP-derivative (gray, with red or pink circle indicating Bpa, triangle indicating decahistidine tag, and black X indicating mutational inactivation), in presence of unlabeled, untagged, wild-type RNAP (light gray). First plasmid carries gene for RNAP subunit with a nonsense (TAG) codon at the site for incorporation of Bpa (residue βʹT48 for trailing edge; residue βʹR1148 for leading edge); second plasmid carries genes for engineered Bpa-specific nonsense-supressor tRNA and Bpa-specific amino-acyl-tRNA synthetase; third plasmid carries promoter of interest; and chromosome carries wild-type RNAP subunit genes. (B) Procedure for protein-DNA photocrosslinking, entailing UV-irradiation of cells, lysis of cells, immobilized-metal-ion affinity chromatography (IMAC), denaturation, primer extension with 32P-5’-end-labeled primer (asterisk denotes label), electrophoresis, and storage-phosphor imaging. Brackets represent steps performed in cells.
Figure 1—figure supplement 2
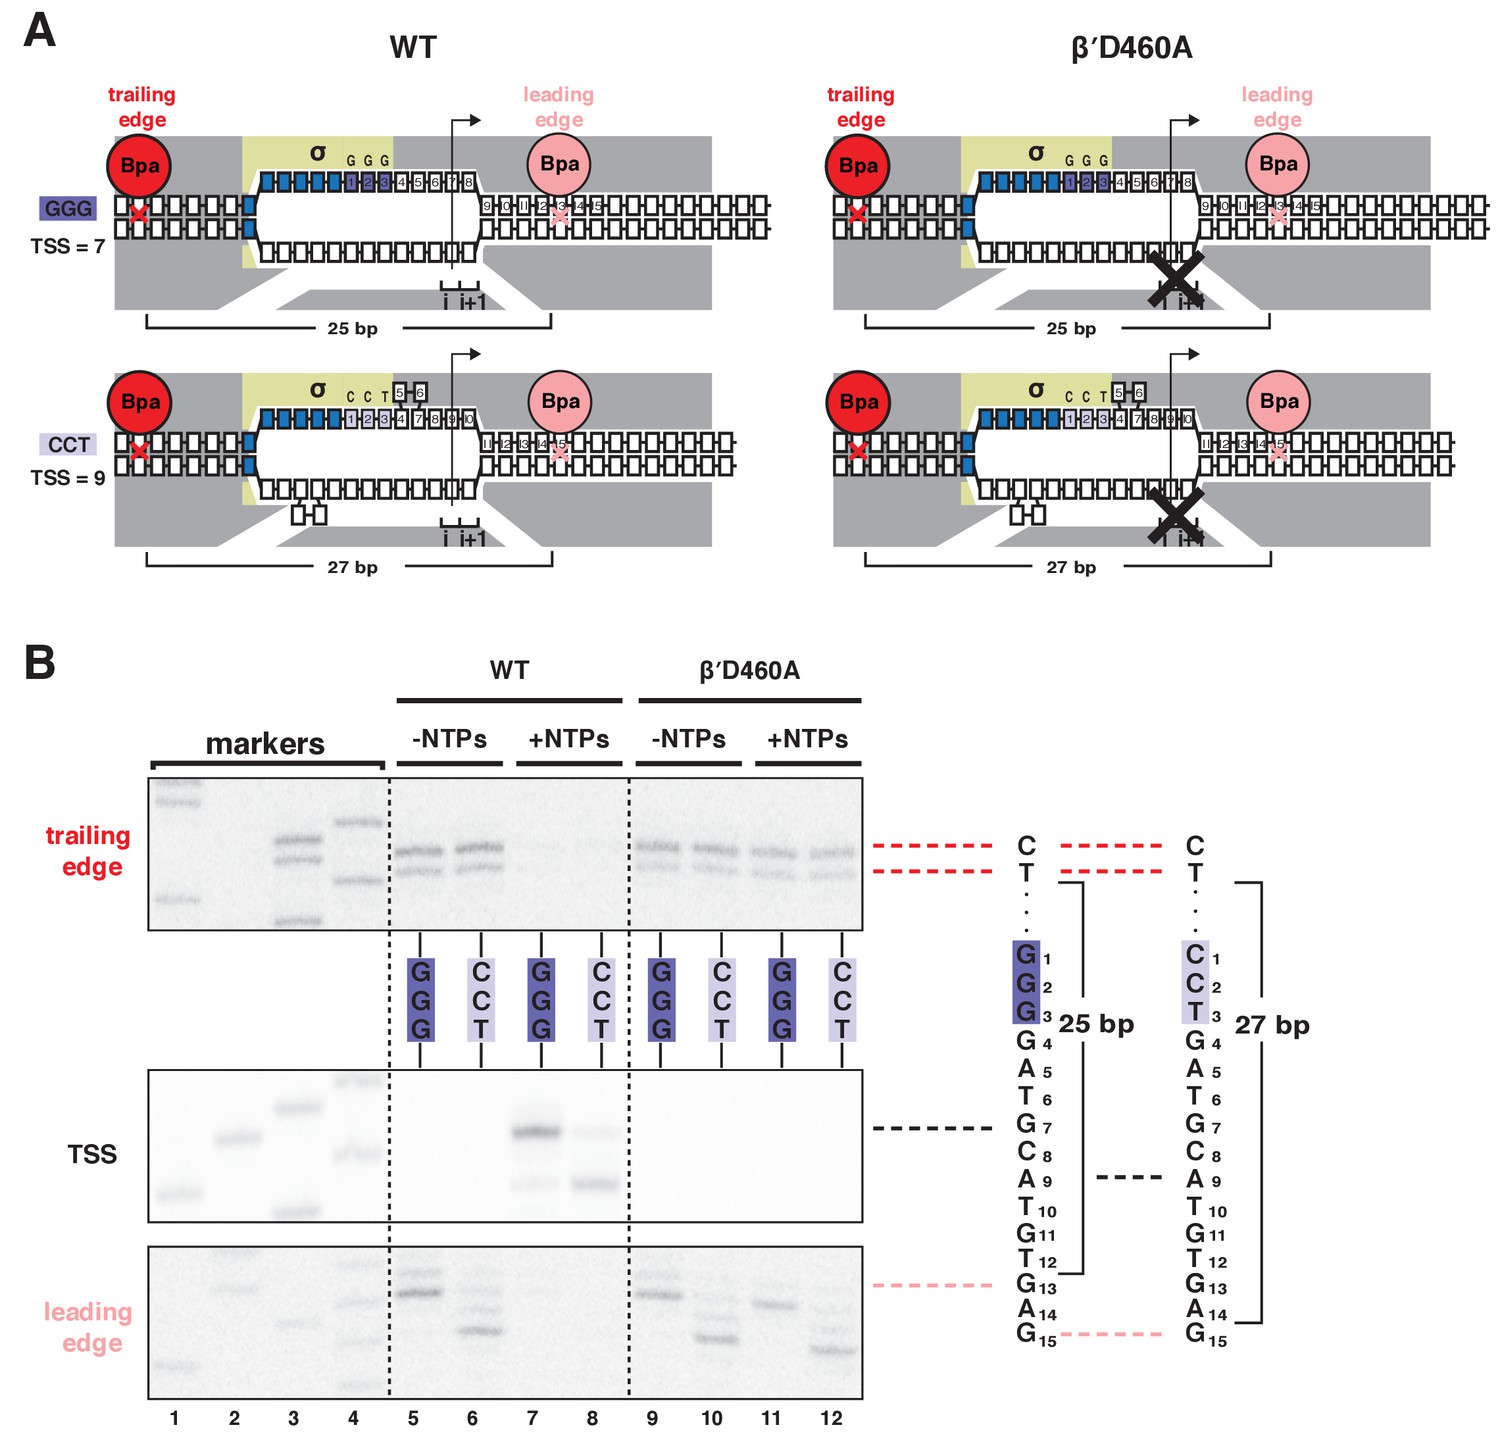
Mutationally inactivated RNAP derivative traps RPo in presence of NTPs, enabling protein-DNA photocrosslinking of RPo in presence of NTPs.
(A) RNAP leading-edge and trailing-edge positions for wild-type RNAP (WT; left) and mutationally inactivated RNAP (βʹD460A; right) at promoters having GGG discriminator (TSS 7 bp downstream of −10 element; top) and CCT discriminator (TSS 9 bp downstream of −10 element; bottom). Black X, mutational inactivation due to βʹD460A substitution. Other colors as in Figure 1A. (B) RNAP trailing-edge crosslinking (top), TSS (middle), and RNAP leading-edge crosslinking (bottom) for wild-type RNAP (WT; left) and mutationally inactivated RNAP (βʹD460A; right) at promoters having GGG discriminator and CCT discriminator, in absence and presence of NTPs. Horizontal dashed lines relate bands on gel (left) to nucleotide sequences (right).
Figure 2
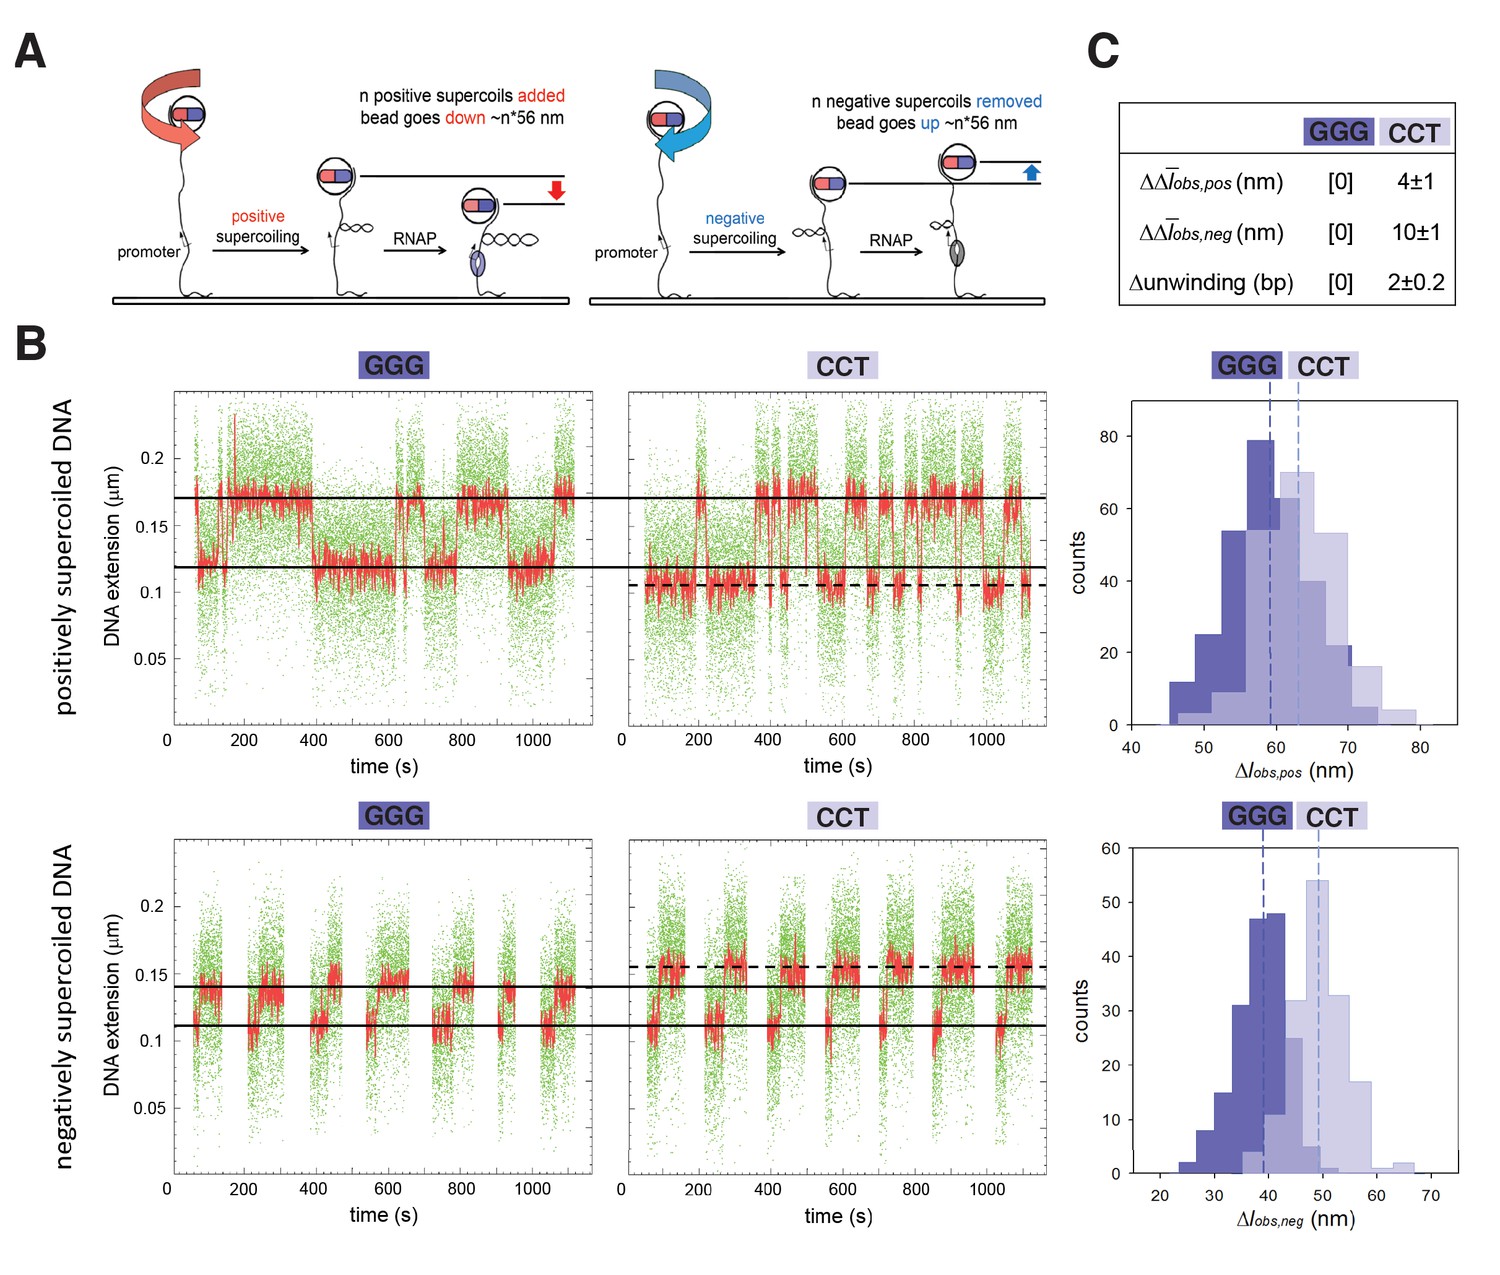
TSS selection exhibits second hallmark of scrunching--change in size of transcription bubble.
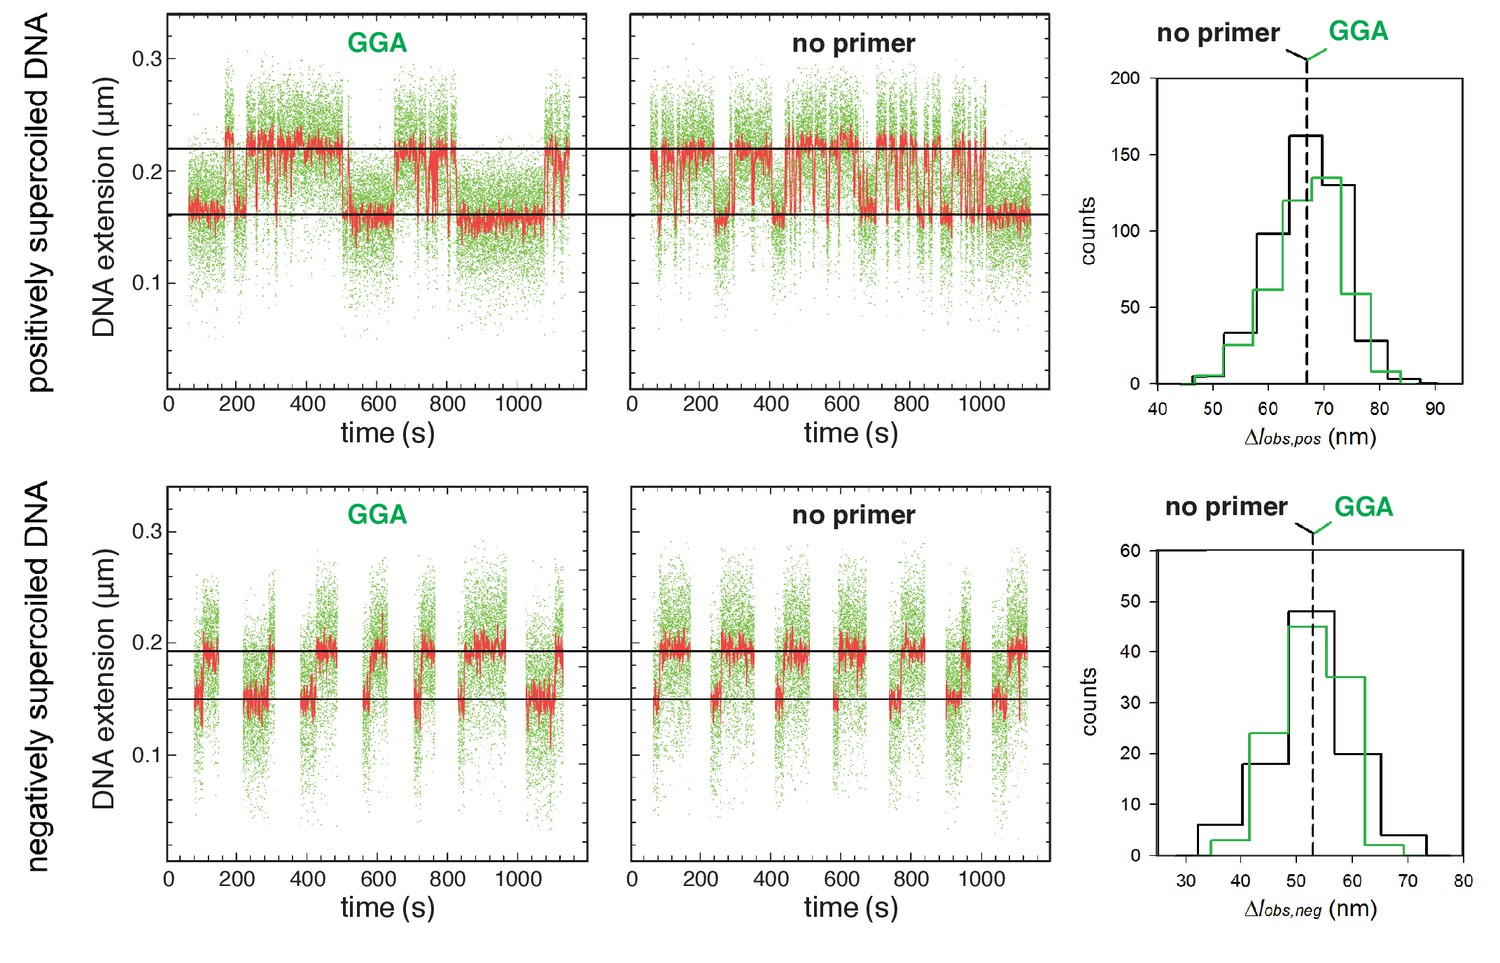
(A) Magnetic-tweezers single-molecule DNA nanomanipulation (Revyakin et al., 2004; Revyakin et al., 2005; Revyakin et al., 2006). End-to-end extension (l) of a mechanically stretched, positively supercoiled (left), or negatively supercoiled (right), DNA molecule is monitored. Unwinding of n turns of DNA by RNAP results in compensatory gain of n positive supercoils or loss of n negative supercoils, and movement of the bead by n*56 nm. (B) Single-molecule time traces and transition-amplitude histograms for RPo at promoters having GGG discriminator or CCT discriminator. Upper subpanel, positively supercoiled DNA; lower subpanel, negatively supercoiled DNA. Green points, raw data (30 frames/s); red points, averaged data (1 s window); horizontal black lines, wound and unwound states of GGG promoter; dashed horizontal black line, unwound state of CCT promoter; vertical dashed lines, means; Δlobs,pos, transition amplitude with positively supercoiled DNA; Δlobs,neg, transition amplitude with negatively supercoiled DNA; Δobs,pos, mean Δlobs,pos; Δobs,neg, mean Δlobs,neg. (C) Differences in Δobs,pos, Δobs,neg, and DNA unwinding between GGG-discriminator promoter and CCT-discriminator promoter (means ± SEM).
Figure 3 with 1 supplement
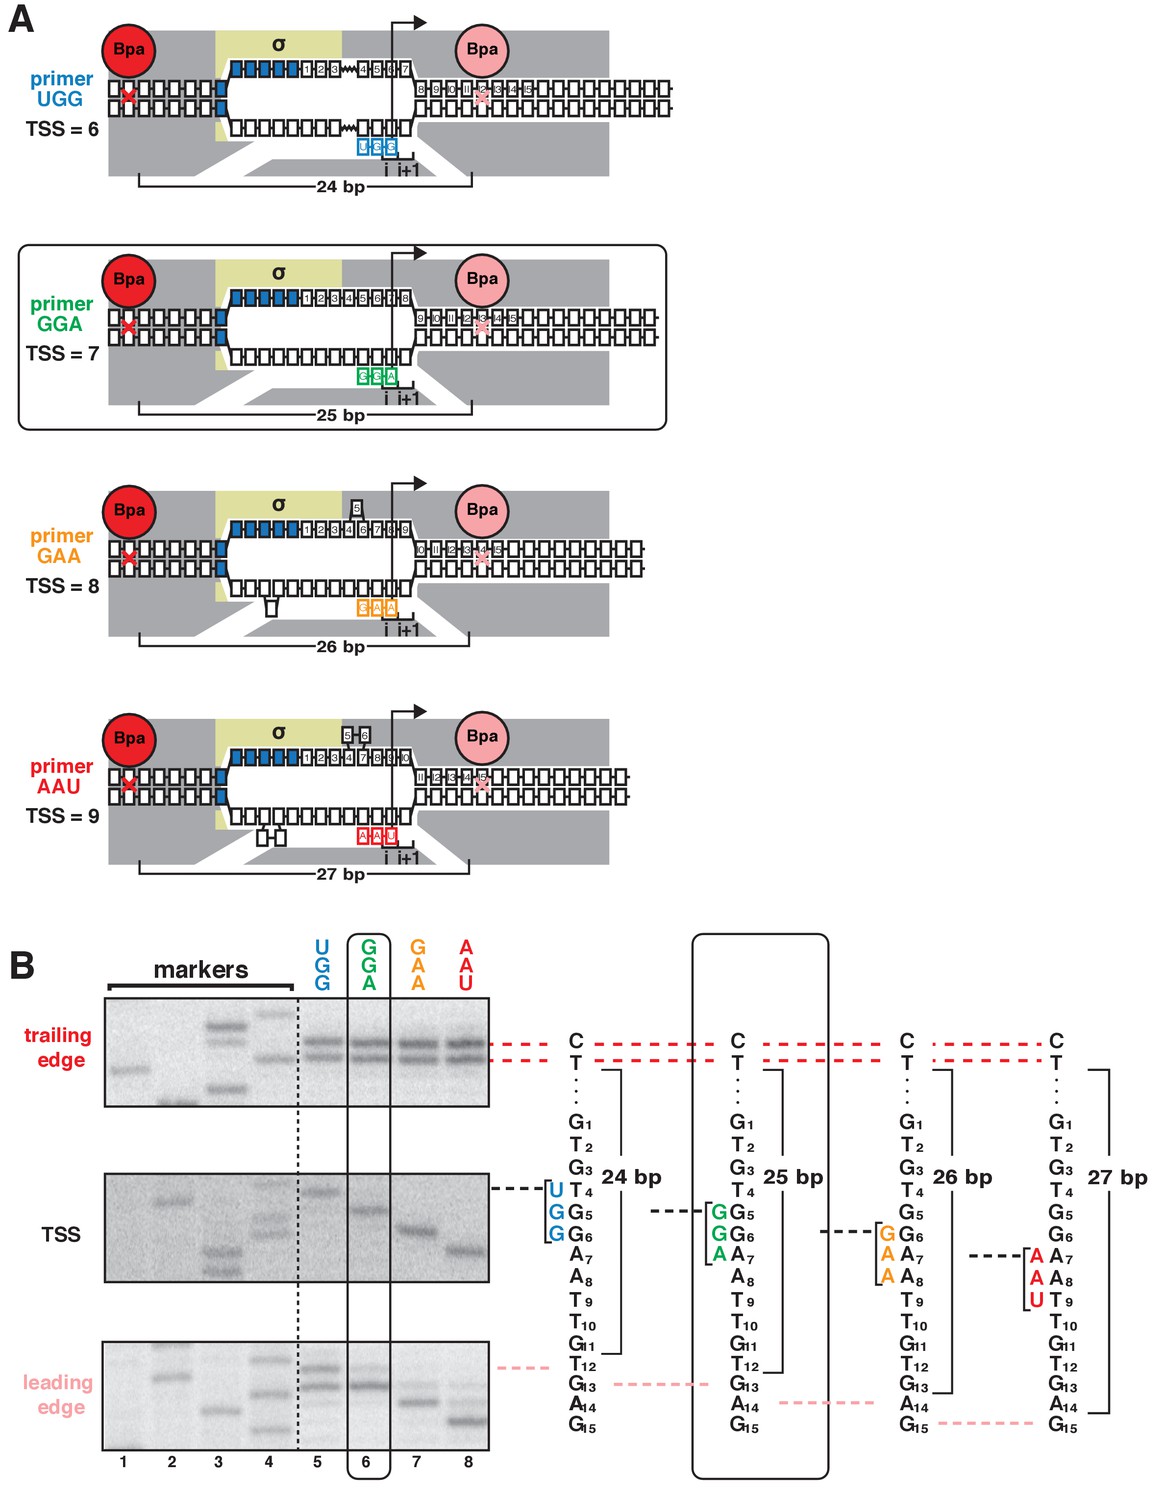
TSS selection downstream and upstream of the modal TSS involves, respectively, forward and reverse movements of RNAP leading edge.
(A) Ribotrinucleotide primers program TSS selection at positions 6, 7, 8, and 9 bp downstream of −10 element (UGG, GGA, GAA, and AAU). Cyan, green, orange, and red denote primers UGG, GGA, GAA, and AAU, respectively. Rectangle with rounded corners highlights case of primer GGA, which programs TSS selection at same position as in absence of primer (7 bp downstream of −10 element). Other colors as in Figure 1A. (B) Use of protein-DNA photocrosslinking to define RNAP leading-edge and trailing-edge positions in vitro. RNAP trailing-edge crosslinking (top), TSS (middle), and RNAP leading-edge crosslinking (bottom) with primers UGG, GGA, GAA, and AAU (lanes 5–8). Horizontal dashed lines relate bands on gel (left) to nucleotide sequences (right).
Figure 3—figure supplement 1
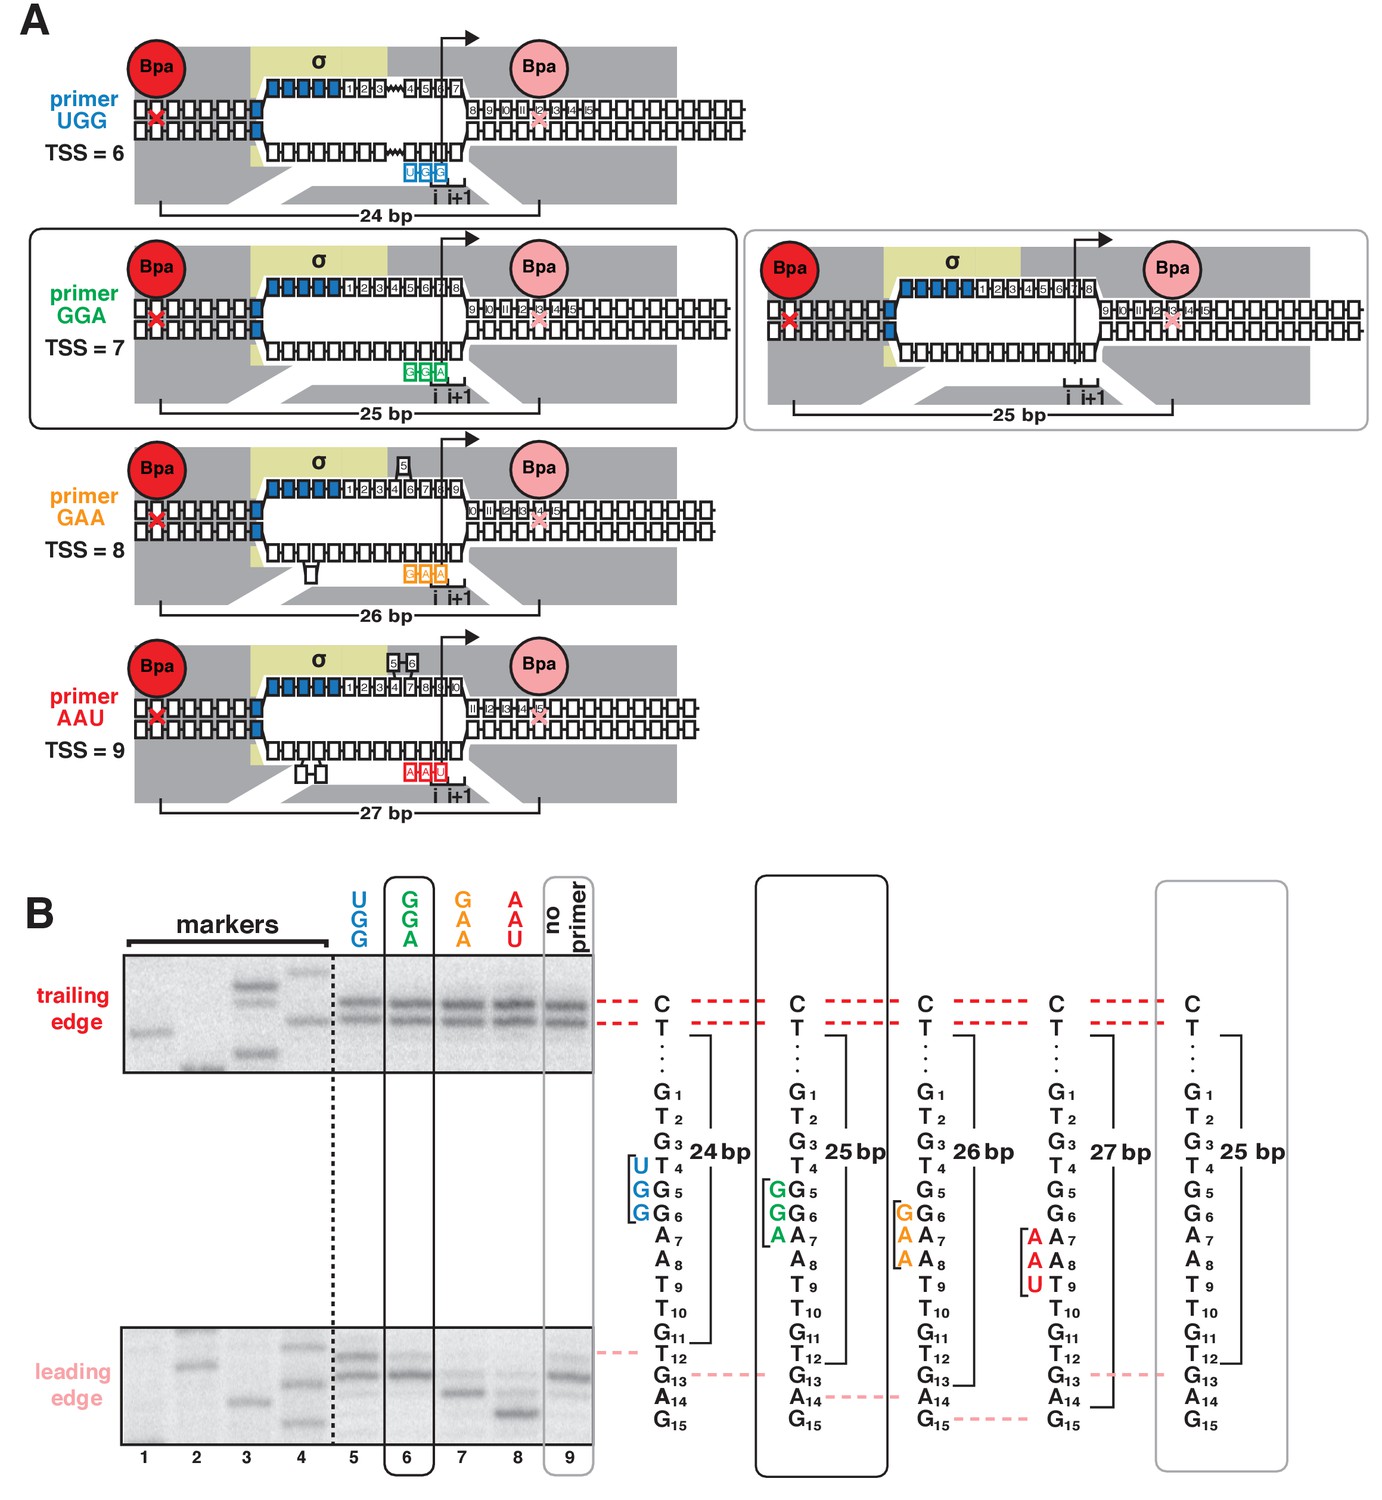
Protein-DNA photocrosslinking in primer-programmed TSS selection: primer GGA yields same pattern of RNAP leading-edge and trailing-edge crosslinking as in absence of primer.
(A) RNAP leading-edge and trailing-edge positions and RNAP-dependent DNA unwinding with primers programming TSS selection at positions 6, 7, 8, and 9 bp downstream of −10 element (left panel), and with no primer (right panel). Black rectangle with rounded corners highlights case of primer GGA, which programs TSS selection at position 7. Gray rectangle with rounded corners highlights case of no primer, which also yields TSS selection at position 7. (B) Use of protein-DNA photocrosslinking to define RNAP leading-edge and RNAP trailing-edge positions. RNAP trailing-edge crosslinking (top), and RNAP leading-edge crosslinking (bottom) with primers UGG, GGA, GAA, and AAU (lanes 5–8), and with no primer (lane 9). Horizontal dashed lines relate bands on gel (left) to nucleotide sequences (right).
Figure 4 with 2 supplements
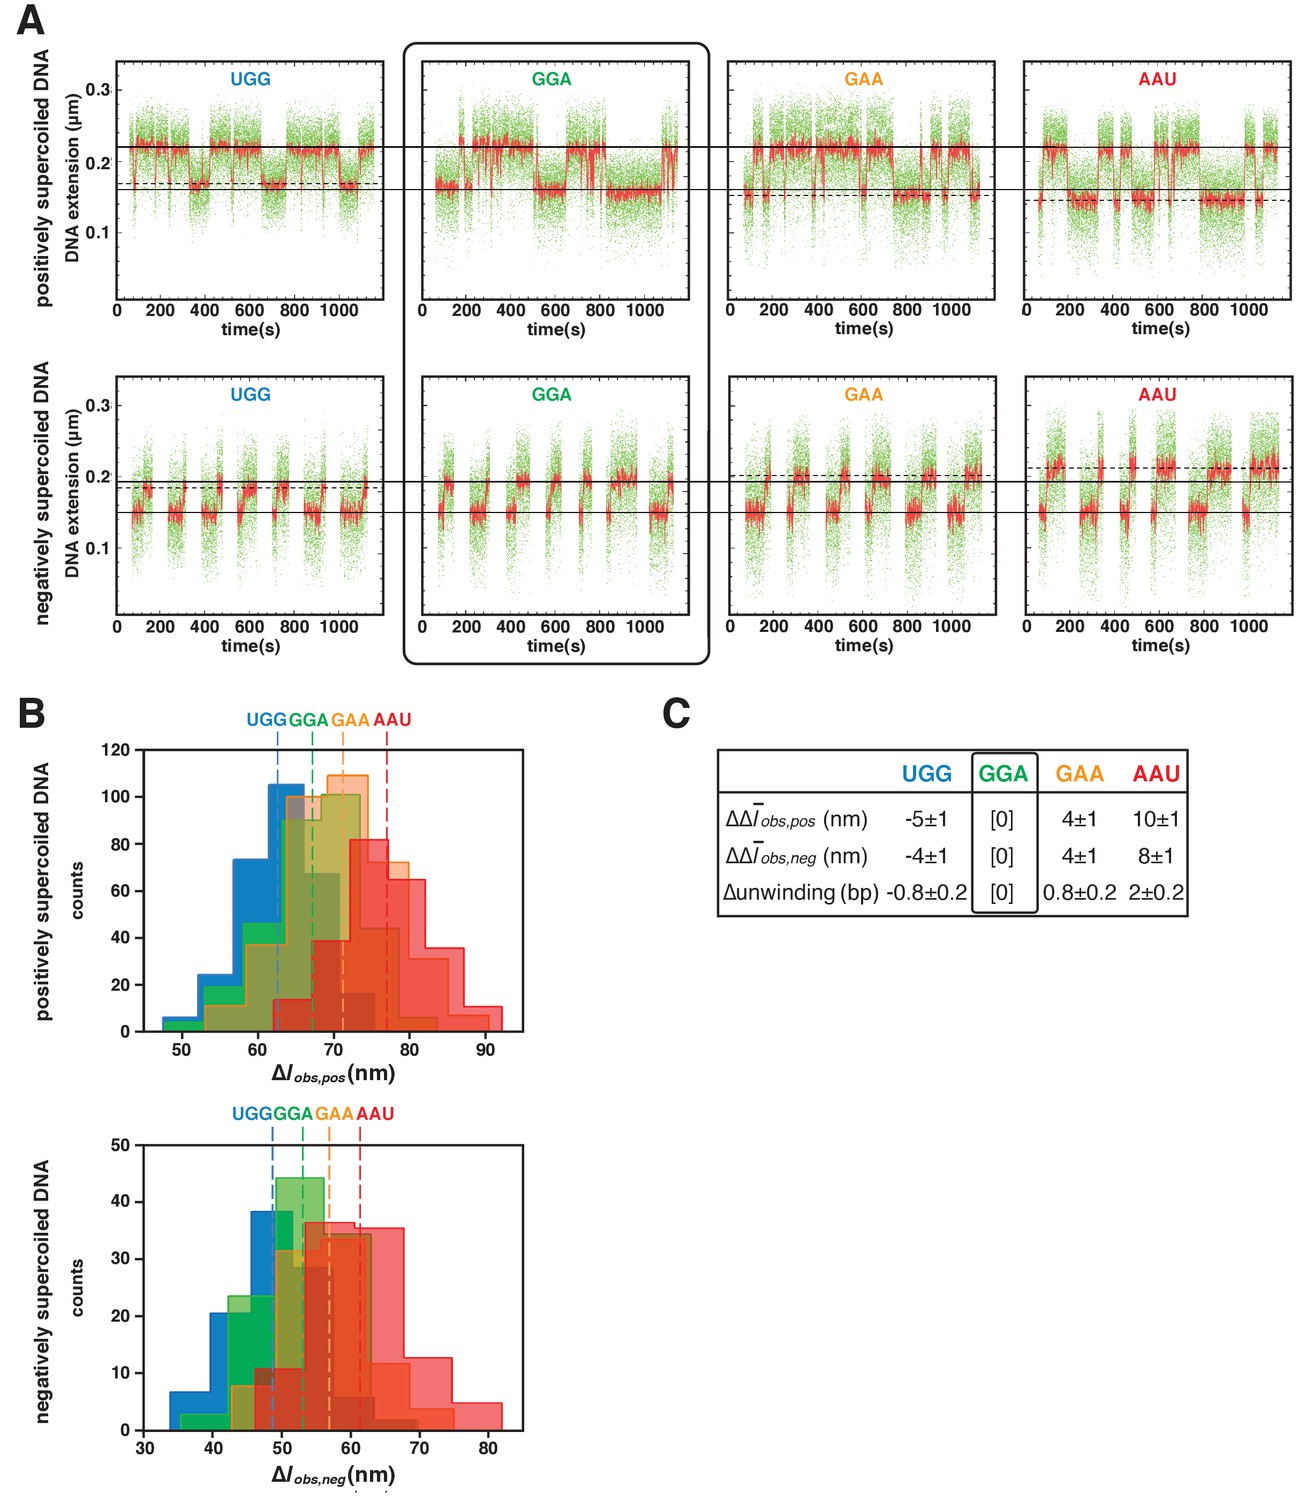
TSS selection downstream and upstream of the modal TSS involves, respectively: increases and decreases in RNAP-dependent DNA unwinding.
(A) Use of single-molecule DNA nanomanipulation to define RNAP-dependent DNA unwinding. Single-molecule time traces with primers UGG, GGA, GAA, and AAU (positively supercoiled DNA in upper panel; negatively supercoiled DNA in lower panel). Rectangle with rounded corners highlights case of primer GGA, which programs TSS selection at position 7. Colors as in Figure 2B. (B) Transition-amplitude histograms (positively supercoiled DNA in upper panel; negatively supercoiled DNA in lower panel). (C) Differences in Δobs,pos, Δobs,neg, and DNA unwinding (bottom panel) with primers UGG, GGA, GAA, and AAU (means ± SEM).
Figure 4—figure supplement 1
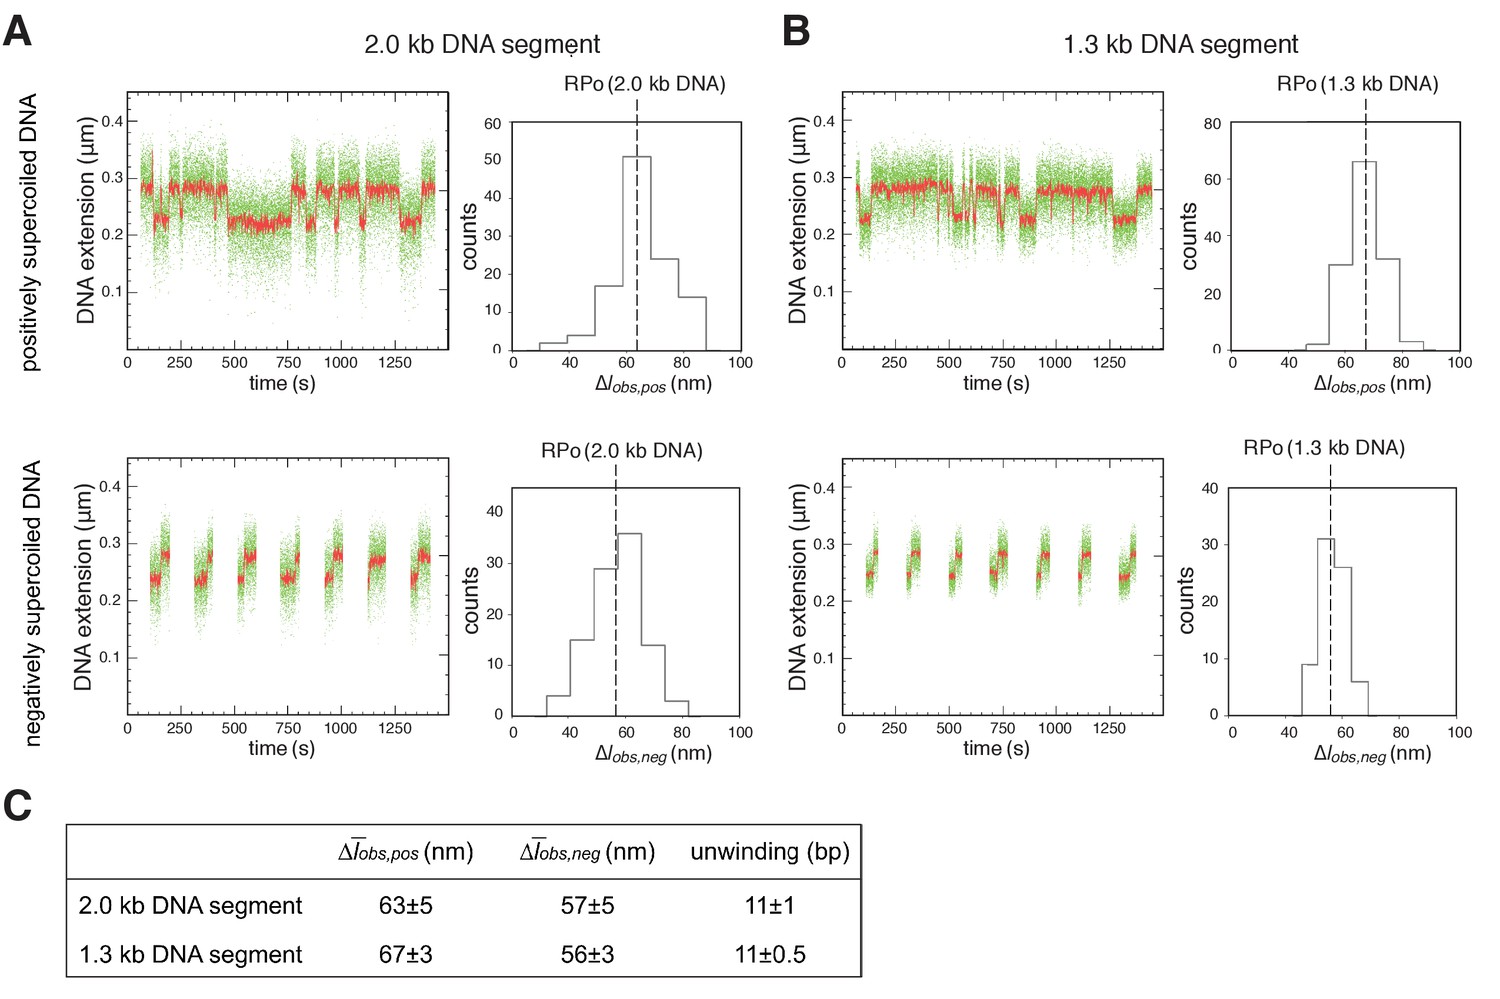
Single-molecule DNA-nanomanipulation: shorter DNA fragment enables detection of RNAP-dependent DNA unwinding with single-base-pair resolution.
(A–B) Single-molecule time traces and transition-amplitude histograms with 2.0 kb DNA fragment [fragment length in previous work (Revyakin et al., 2004; Revyakin et al., 2005) and in Figure 2] (A), and with 1.3 kb DNA fragment (fragment length in Figure 4 and Figure 4—figure supplement 2) (B). Data for positively supercoiled DNA are at top; data for negatively supercoiled DNA are at bottom. Green points, raw data (30 frames/s); red points, averaged data (1 s window). (C) Mean transition amplitudes on positively supercoiled DNA (Δobs,pos), mean transition amplitudes on negatively supercoiled DNA (Δobs,neg), and DNA unwinding (means ± SEM). Use of 1.3 kb DNA segment provides SEM = 0.5 bp for data subsets of n = 30, sufficient for single-base-pair resolution.
Figure 4—figure supplement 2
Single-molecule DNA-nanomanipulation: analysis of primer-programmed TSS selection with primer GGA.
Single-molecule time traces and transition-amplitude histograms with GGA, which programs TSS selection 7 bp downstream of the −10 element, and and with no primer, which also yields TSS selection 7 bp downstream of the −10 element (data for positively supercoiled DNA at top; data for negatively supercoiled DNA below). Primer GGA results in same RNAP-dependent DNA unwinding as in absence of primer.
Figure 5
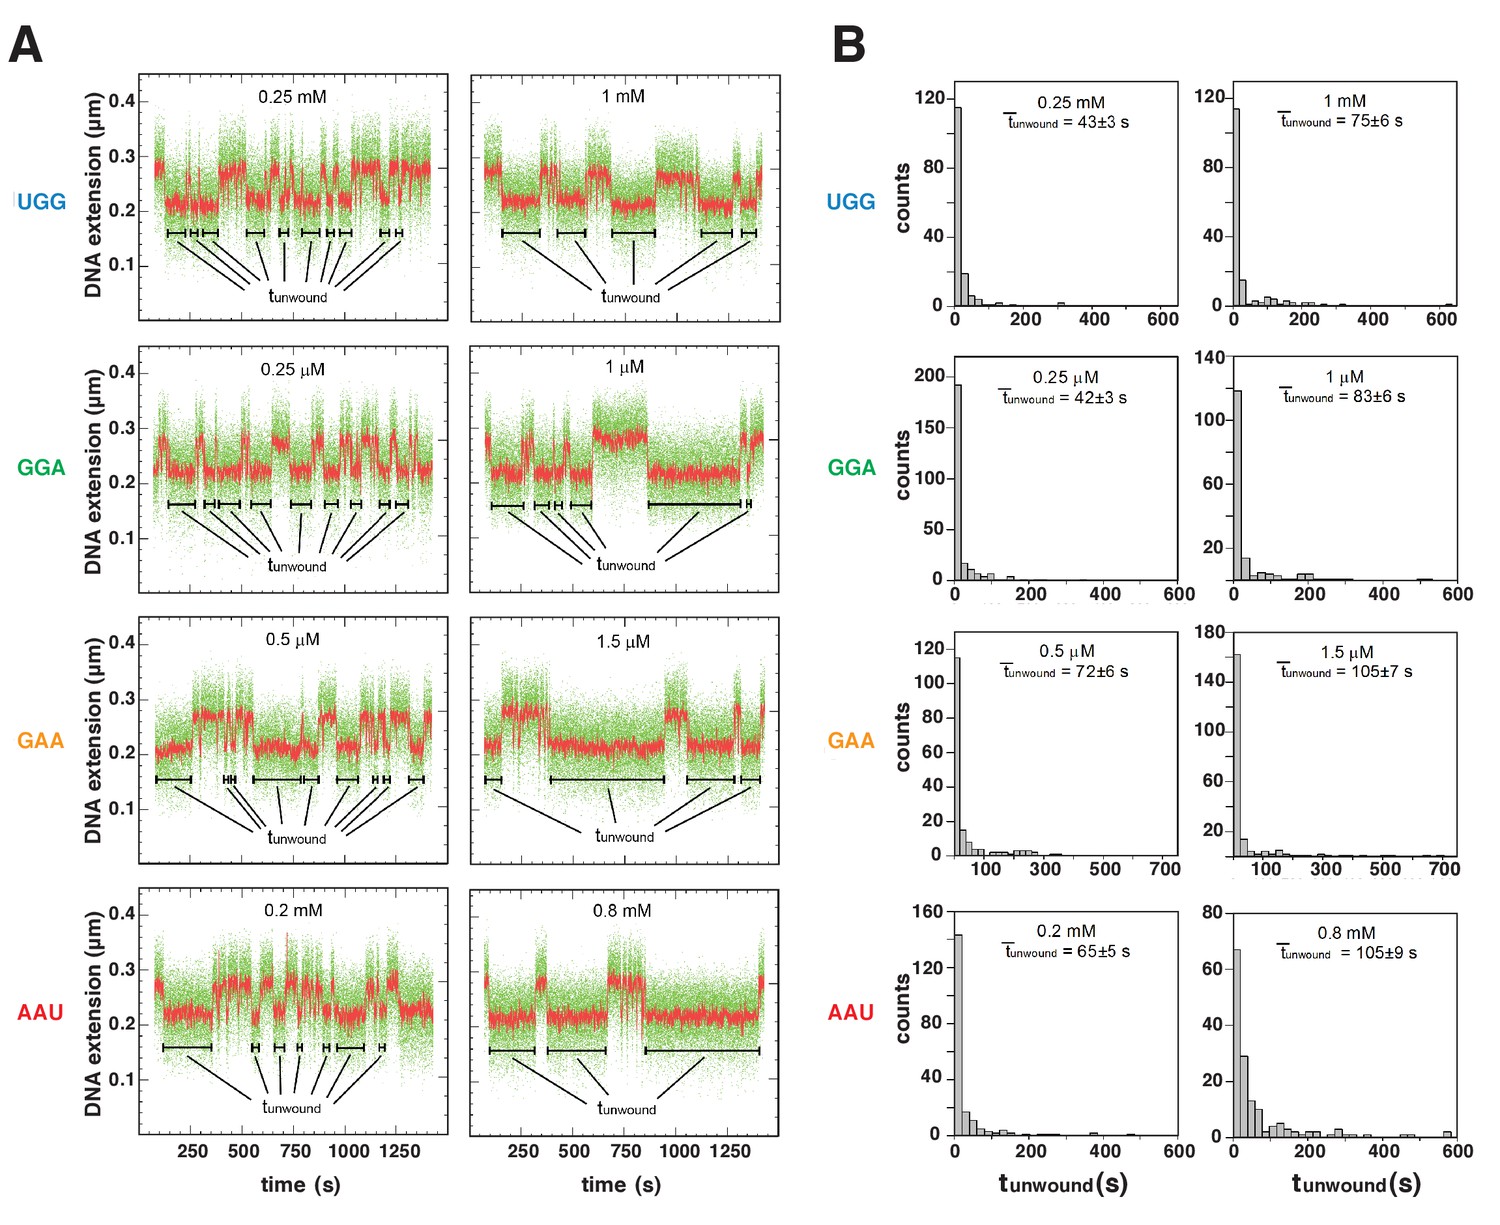
Energetic costs of scrunching and anti-scrunching: primer-concentration dependences of unwound-state lifetimes with primers UGG, GGA, GAA, and AAU.
(A) Single-molecule time traces at low (left) and high (right) primer concentrations. Black bars, lifetimes of unwound states (tunwound). Colors as in Figure 2B. (B) tunwound distributions and mean tunwound (unwound). unwound increases with increasing primer concentrations.
Figure 6 with 1 supplement
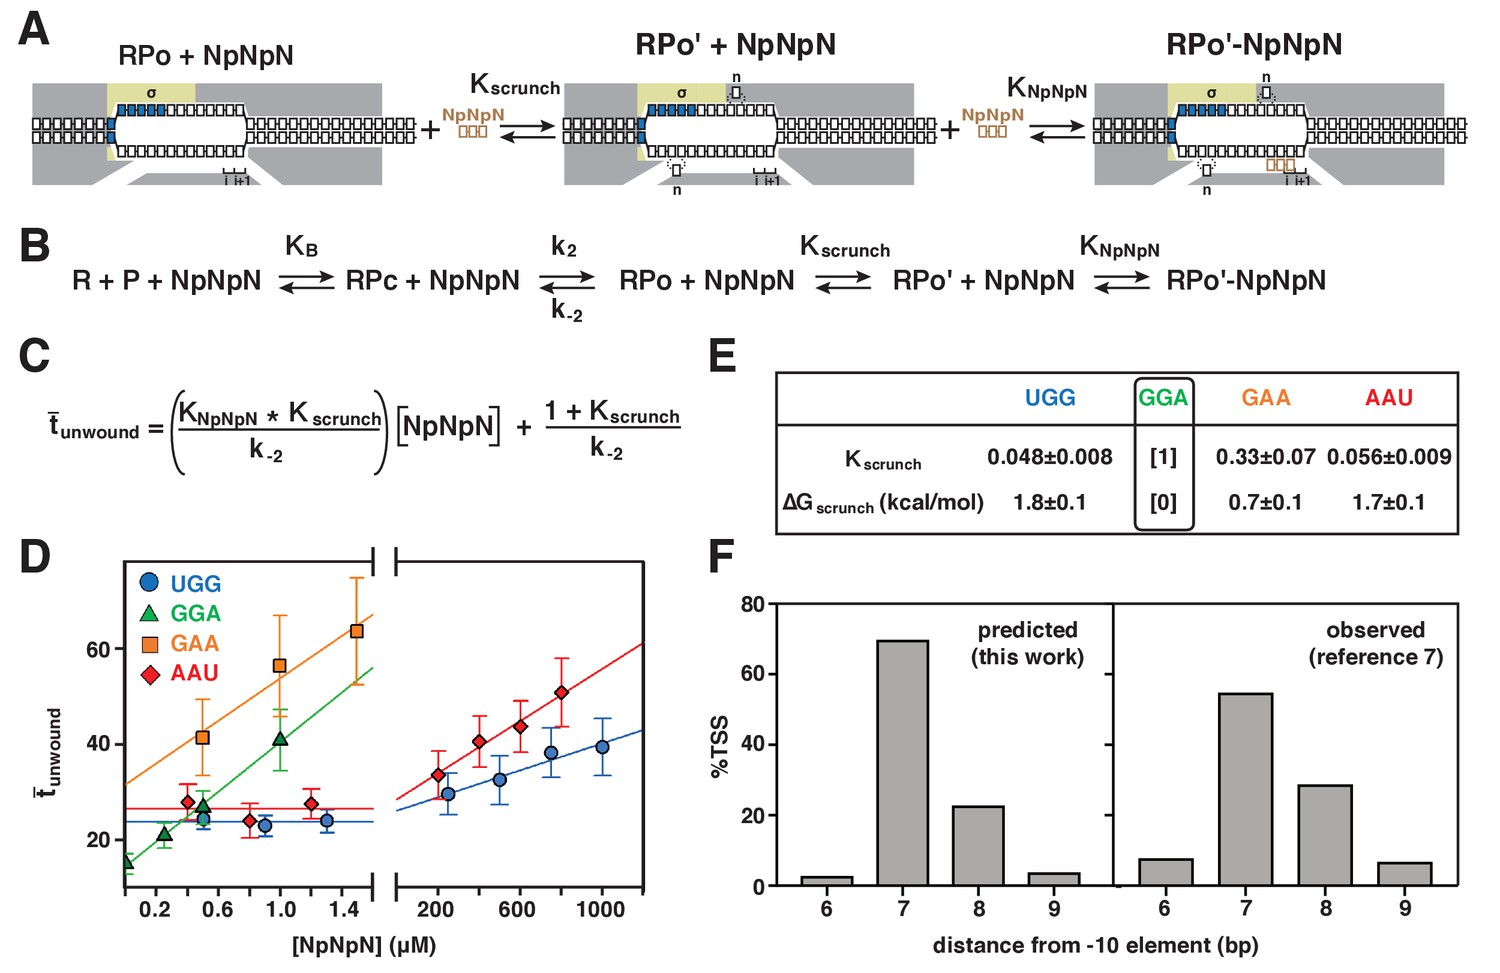
Energetic costs of scrunching and anti-scrunching: calculation of energetic costs and relationship between energetic costs and range and relative utilization of TSS positions.
(A) Coupled equilibria for promoter scrunching or anti-scrunching (Kscrunch) and primer binding (KNpNpN). (B) Equations for promoter binding (KB), promoter unwinding (k2/k-2), promoter scrunching or anti-scrunching (Kscrunch), and primer binding (KNpNpN). (C) Relationship between unwound, Kscrunch, KNpNpN, and primer concentration. (D) Dependences of mean lifetimes of unwound states (unwound) on primer concentration for primers UGG, GGA, GAA, and AAU (means ± SEM). (E) Values of Kscrunch and ΔGscrunch calculated by fitting data in (D) to equation in (C) using k-2 = 1/unwound in absence of primer (Revyakin et al., 2004) (means ± SEM). Colors as in Figure 3. (F) TSS distributions predicted by Boltzmann-distribution probabilities for ΔGscrunch values in (E) (left) and observed in analysis of comprehensive library of TSS-region sequences in Vvedenskaya et al., 2015 (right).
Figure 6—figure supplement 1
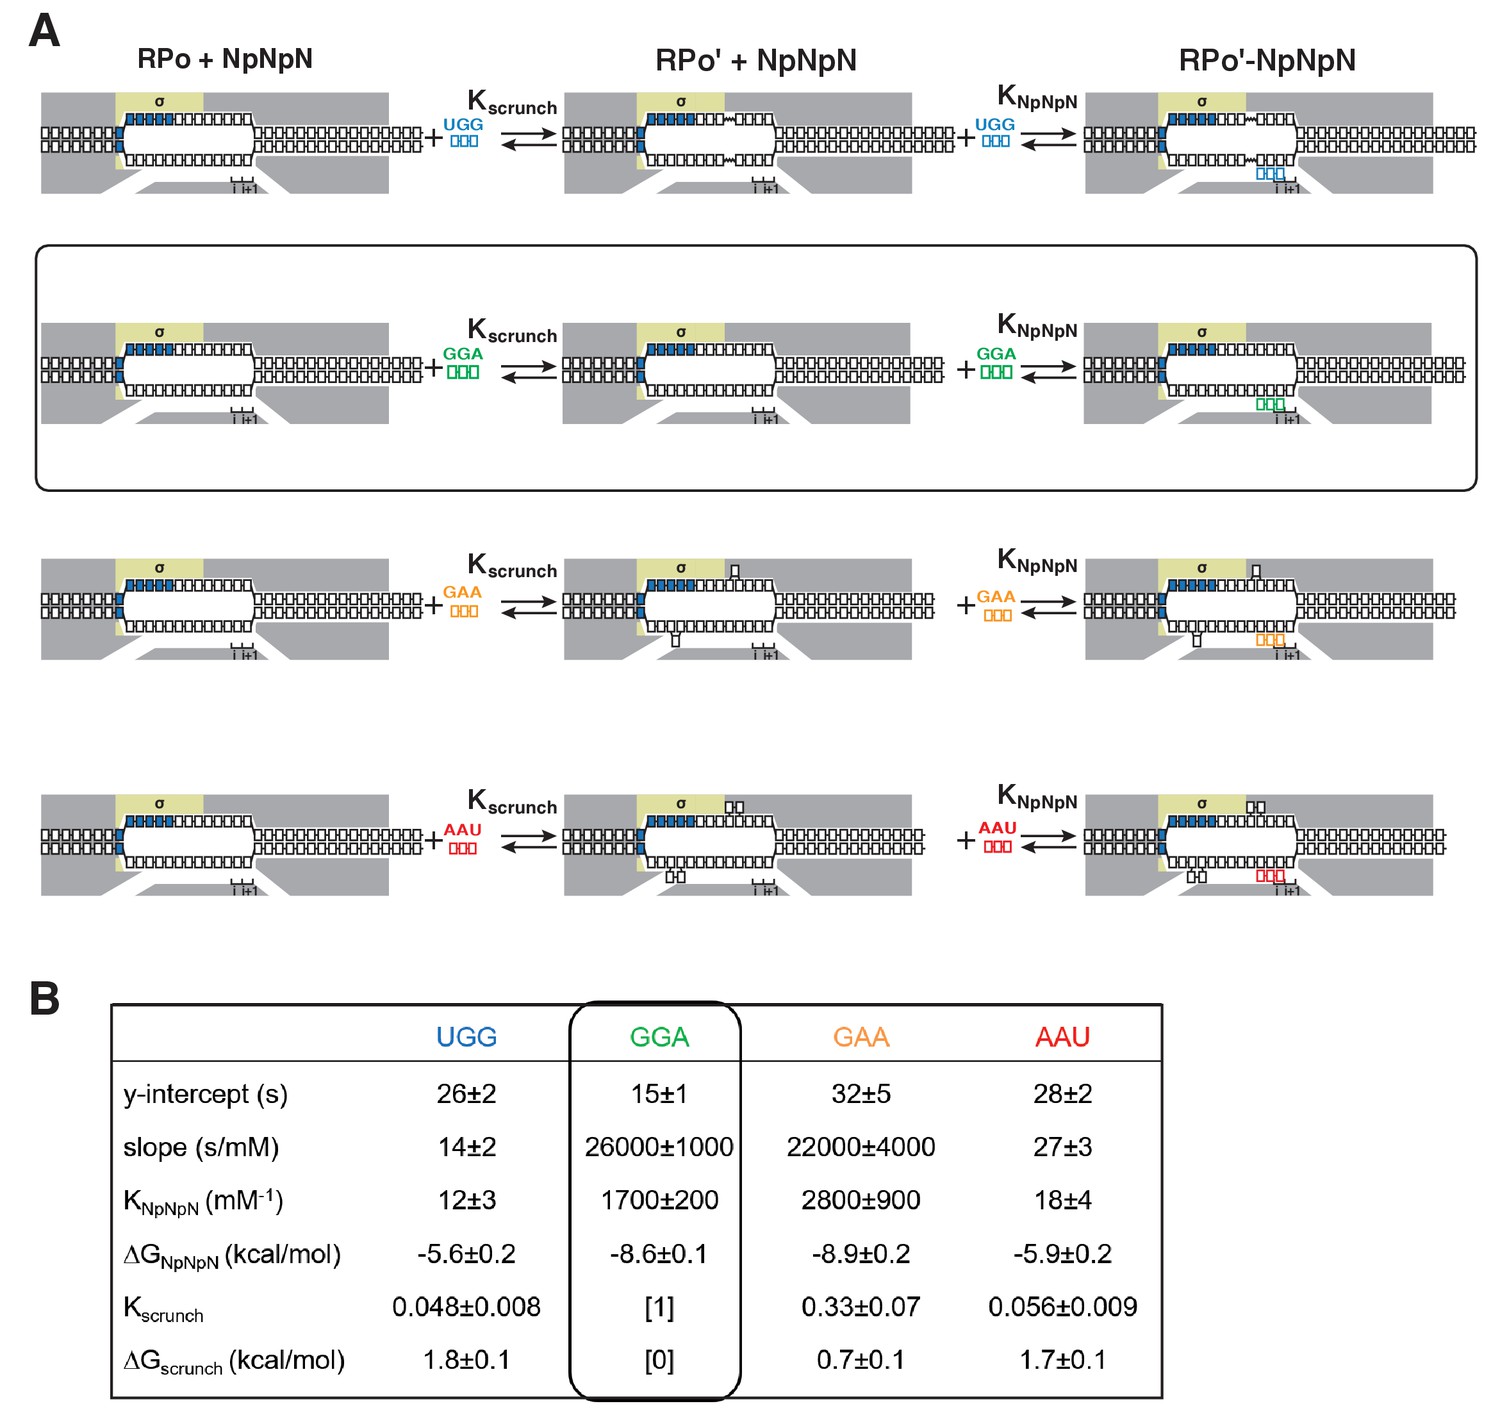
Single-molecule DNA-nanomanipulation: calculation of Kscrunch and ΔGscrunch in primer-programmed TSS selection with primers UGG, GGA, GAA, and AAU.
(A) Coupled equilibria for promoter scrunching or anti-scrunching (Kscrunch) and primer binding (KNpNpN) with primers UGG, GGA, GAA, and AAU. Rectangle with rounded corners highlights case of primer GGA, which programs TSS selection corresponding to modal TSS in absence of primer (7 bp downstream of −10 element). Colors as in Figure 3A. (B) Intercepts and slopes of linear-regression plots of primer-concentration dependence of unwound (lines 1–2; Figure 6D), and KNpNpN, ΔGNpNpN, Kscrunch, and ΔGscrunch calculated from intercepts and slopes (lines 3–6; calculated using equation of Figure 6C and k-2 = 1/unwound in absence of primer) (Revyakin et al., 2004).
Tables
Key resources table
| Reagent type (species) or resource | Designation | Source or reference | Identifiers | Additional information |
|---|---|---|---|---|
| strain, strain background(E. coli) | BL21(DE3) | New England BioLabs | Cat# C2527I | |
| strain, strain background(E. coli) | NiCo21(DE3) | New England BioLabs | Cat# C2529H | |
| strain, strain background (T. thermophilus) | HB8 | ATCC | Cat# ATCC 27634 | |
| recombinant DNA reagent | pUC18 | Thermo-Fisher | ||
| recombinant DNA reagent | pUC18-T20C2-lacCONS-CCT (plasmid) | this paper | progenitors: PCR of T. thermophilus HB8, pUC18 | |
| recombinant DNA reagent | pUC18-T20C2-lacCONS-CCT (plasmid) | this paper | progenitors: PCR of T. thermophilus HB8, pUC18 | |
| recombinant DNA reagent | pUC18-T20C2-lacCONS-CCT (plasmid) | this paper | progenitors: PCR of T. thermophilus HB8, pUC18 | |
| recombinant DNA reagent | pVS10 (plasmid) | PMID: 12511572 | ||
| recombinant DNA reagent | pIA900 (plasmid) | PMID: 25665556 | ||
| recombinant DNA reagent | pIA900-beta'R1148Bpa (plasmid) | PMID: 26257284 | ||
| recombinant DNA reagent | pIA900-beta'T48Bp | PMID: 26257284 | ||
| recombinant DNA reagent | pIA900-beta'R1148Bpa;beta'D460A | this paper | progenitor: pIA900 | |
| recombinant DNA reagent | pIA900-beta'T48Bpa;beta'D460A | this paper | progenitor: pIA900 | |
| recombinant DNA reagent | pEVOL-pBpF (plasmid) | PMID: 12154230; Addgene | cat# 31190 | |
| sequence-based reagent | UGG (oligoribonucleotide) | Trilink Biotechnologies | ||
| sequence-based reagent | GGA (oligoribonucleotide) | Trilink Biotechnologies | ||
| sequence-based reagent | GAA (oligoribonucleotide) | Trilink Biotechnologies | ||
| sequence-based reagent | AAU (oligoribonucleotide) | Trilink Biotechnologies | ||
| sequence-based reagent | JW 30 (oligodeoxyribonucleotide) | Integrated DNA Technologies | ||
| sequence-based reagent | JW 61 (oligodeoxyribonucleotide) | Integrated DNA Technologies | ||
| sequence-based reagent | JW 62 (oligodeoxyribonucleotide) | Integrated DNA Technologies | ||
| sequence-based reagent | JW 85 (oligodeoxyribonucleotide) | Integrated DNA Technologies | ||
| sequence-based reagent | LY10 (oligodeoxyribonucleotide) | Integrated DNA Technologies | ||
| sequence-based reagent | LY11 (oligodeoxyribonucleotide) | Integrated DNA Technologies | ||
| sequence-based reagent | S128a (oligodeoxyribonucleotide) | Integrated DNA Technologies | ||
| sequence-based reagent | S1219 (oligodeoxyribonucleotide) | Integrated DNA Technologies | ||
| sequence-based reagent | S1220 (oligodeoxyribonucleotide) | Integrated DNA Technologies | ||
| sequence-based reagent | RPOC820 (oligodeoxyribonucleotide) | Integrated DNA Technologies | ||
| sequence-based reagent | RPOC3140 (oligodeoxyribonucleotide) | Integrated DNA Technologies | ||
| sequence-based reagent | SbfRPOC50 (oligodeoxyribonucleotide) | Integrated DNA Technologies | ||
| sequence-based reagent | Taq_rpoC_F (oligodeoxyribonucleotide) | Integrated DNA Technologies | ||
| sequence-based reagent | Taq_rpoC_R (oligodeoxyribonucleotide) | Integrated DNA Technologies | ||
| sequence-based reagent | XbaRPOC4050 (oligodeoxyribonucleotide) | Integrated DNA Technologies | ||
| peptide, recombinant protein (E.coli) | RNAP polymerase core enzyme | PMID: 12511572 | ||
| peptide, recombinant protein (E.coli) | sigma70 | PMID: 9157885 | ||
| peptide, recombinant protein (E.coli) | RNAP core enzyme derivative beta'R1148Bpa | PMID: 26257284 | ||
| peptide, recombinantprotein (E.coli) | RNAP core enzyme derivative beta'T48Bpa | PMID: 26257284 | ||
| peptide, recombinantprotein (E.coli) | RNAP core enzyme derivative beta'R1148Bpa;D460A | this work | ||
| peptide, recombinant protein (E.coli) | RNAP core enzyme derivative beta'R1148Bpa;D460A | this work | ||
| peptide, recombinant protein | Dam methyltransferase | New England BioLabs | Cat# M0222S | |
| peptide, recombinantprotein | restriction endonuclease SbfI-HF | New England BioLabs | Cat# R3642S | |
| peptide, recombinantprotein | restriction endonuclease XbaI | New England BioLabs | Cat# R0145S | |
| peptide, recombinant protein | T4 polynucleotide kinase | New England BioLabs | Cat# M0201S | |
| antibody | anti-digoxigenin antibody | Sigma-Aldrich | Cat# 11333089001 | |
| commercial assay or kit | Dynabeads MyOne Streptavidin C1 | Thermo-Fisher | Cat# 650.01 | |
| commercial assay or kit | MagneHis protein purification system | Promega | Cat# V8500 | |
| commercial assay or kit | TRI reagent | Molecular Research Center | Cat# TR118 | |
| chemical compound,drug | carbenicillin | Gold Biotechnology | cat# c-103-25 | |
| chemical compound,drug | chloramphenicol | Gold Biotechnology | cat# c-105-25 | |
| chemical compound,drug | spectinomycin | Gold Biotechnology | cat# 22189-32-8 | |
| chemical compound,drug | streptomycin | Omnipur | cat# 3810-74-0 | |
| software, algorithm | SigmaPlot | Systat Software | ||
| software, algorithm | xvin | PMID: 16156080 |
Additional files
-
Supplementary file 1
Oligonucleotides
- https://doi.org/10.7554/eLife.32038.015
-
Transparent reporting form
- https://doi.org/10.7554/eLife.32038.016
Download links
A two-part list of links to download the article, or parts of the article, in various formats.
Downloads (link to download the article as PDF)
Open citations (links to open the citations from this article in various online reference manager services)
Cite this article (links to download the citations from this article in formats compatible with various reference manager tools)
The mechanism of variability in transcription start site selection
eLife 6:e32038.
https://doi.org/10.7554/eLife.32038


