Histone Deacetylase 7 mediates tissue-specific autoimmunity via control of innate effector function in invariant Natural Killer T Cells
- Gladstone Institute of Virology and Immunology, United States
- University of California, San Francisco, United States
- Buck Institute for Research on Aging, United States
Figures
Figure 1 with 3 supplements
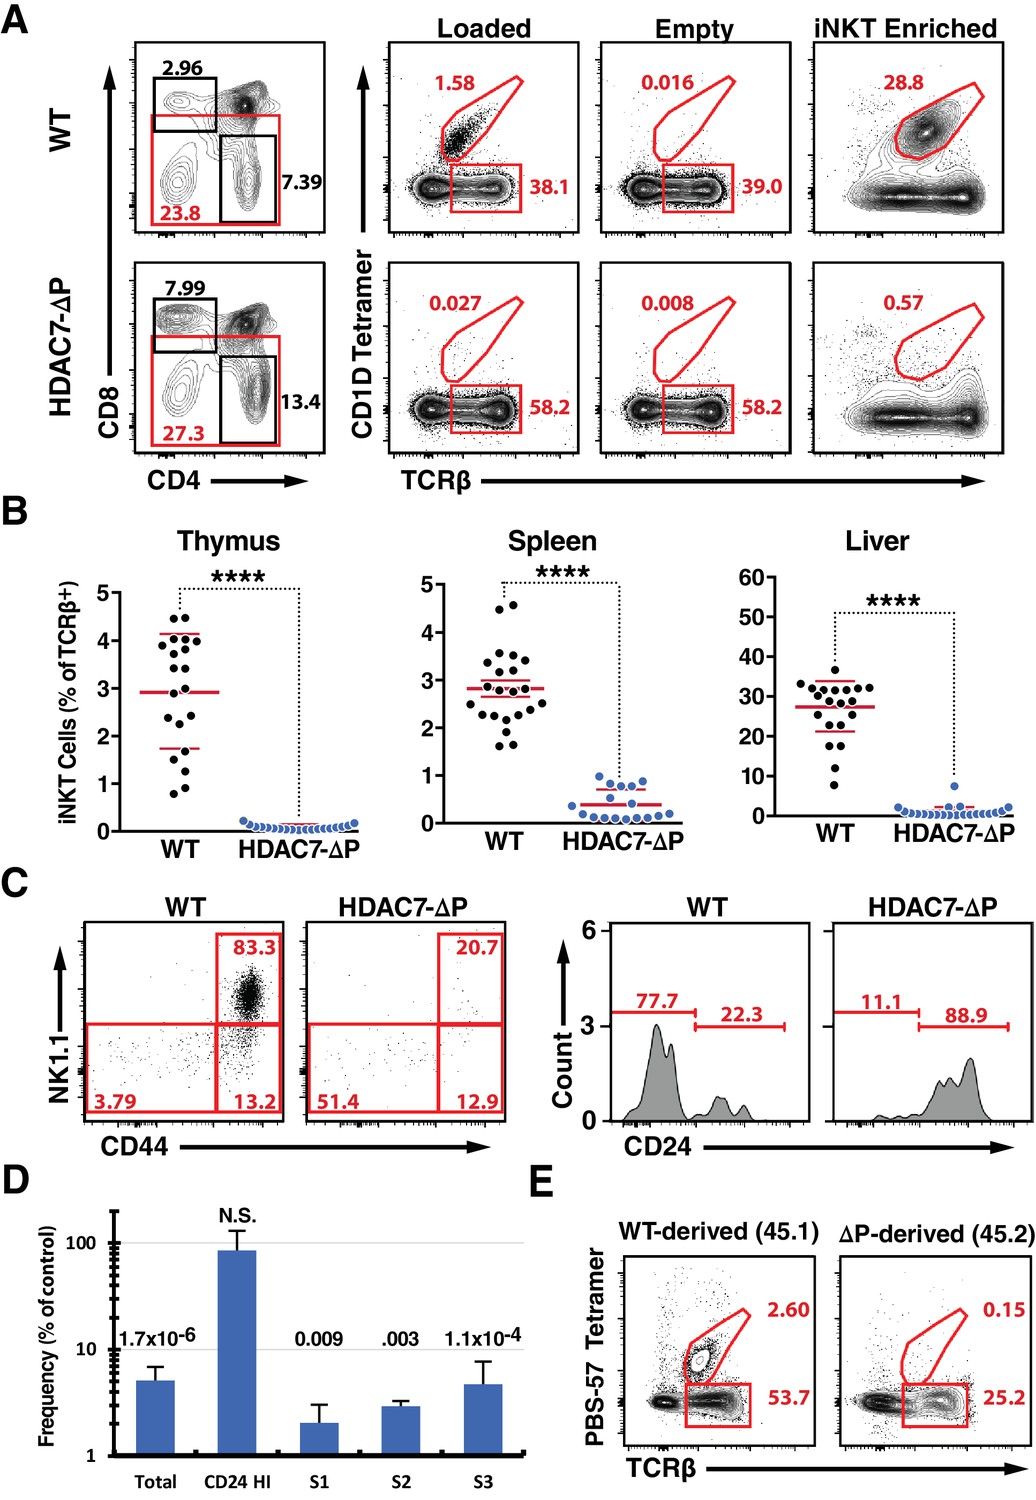
A Gain-of-Function HDAC7 Mutant, HDAC7-ΔP, Arrests Thymic iNKT Development.
(A) Representative flow cytometric plots of iNKT cells and conventional αβ T-cells, identified by staining with TCRβ and CD1D tetramer, empty or loaded with αGalCer as indicated, in thymocytes from WT (top) and HDAC7-ΔP (bottom) mice. Staining after magnetic enrichment of 2 × 10⁷ cells with loaded tetramer is shown at right. (B) Quantification of iNKT cell frequency in Thymus (left), spleen (center), and liver (right) of WT (black symbols) and HDAC7-ΔP (blue symbols) mice (C) Representative flow plots showing conventional staging of iNKT development by CD44 and NK1.1 expression (left) and CD24 expression (right) in magnetically enriched Tet+ TCRβ+ thymic iNKT cells from WT and HDAC7-ΔP mice as indicated. (D) Quantification of difference in frequency of magnetically enriched iNKT cells at the indicated stages, as defined in (C), for five littermate pairs WT and HDAC7-ΔP mice. Difference is expressed as (% of live cells / % of live cells) * 100 for HDAC7-ΔP/WT. Numbers above each column indicate P-value by 2-tailed Student’s T-test. (E) Representative flow cytometric plots and of iNKT from thymus in WT (CD45.1): HDAC7-ΔP (CD45.2) mixed bone-marrow chimeras. Data in (B) are combined from eight independent experiments involving 1–3 littermate pairs; data in (C) are representative of 5 WT: HDAC7-ΔP littermate pairs. Data in (E) are representative of 3 sets of chimeras with 3–6 mice per group. Statistical significance was determined using unpaired two-tailed t tests; ****p≤0.0001.
-
Figure 1—source data 1
Multi-sheet Microsoft Excel workbook containing numerical data matrices for all figure panels (on separate sheets) in which individual data points are not represented graphically.
- https://doi.org/10.7554/eLife.32109.007
Figure 1—figure supplement 1
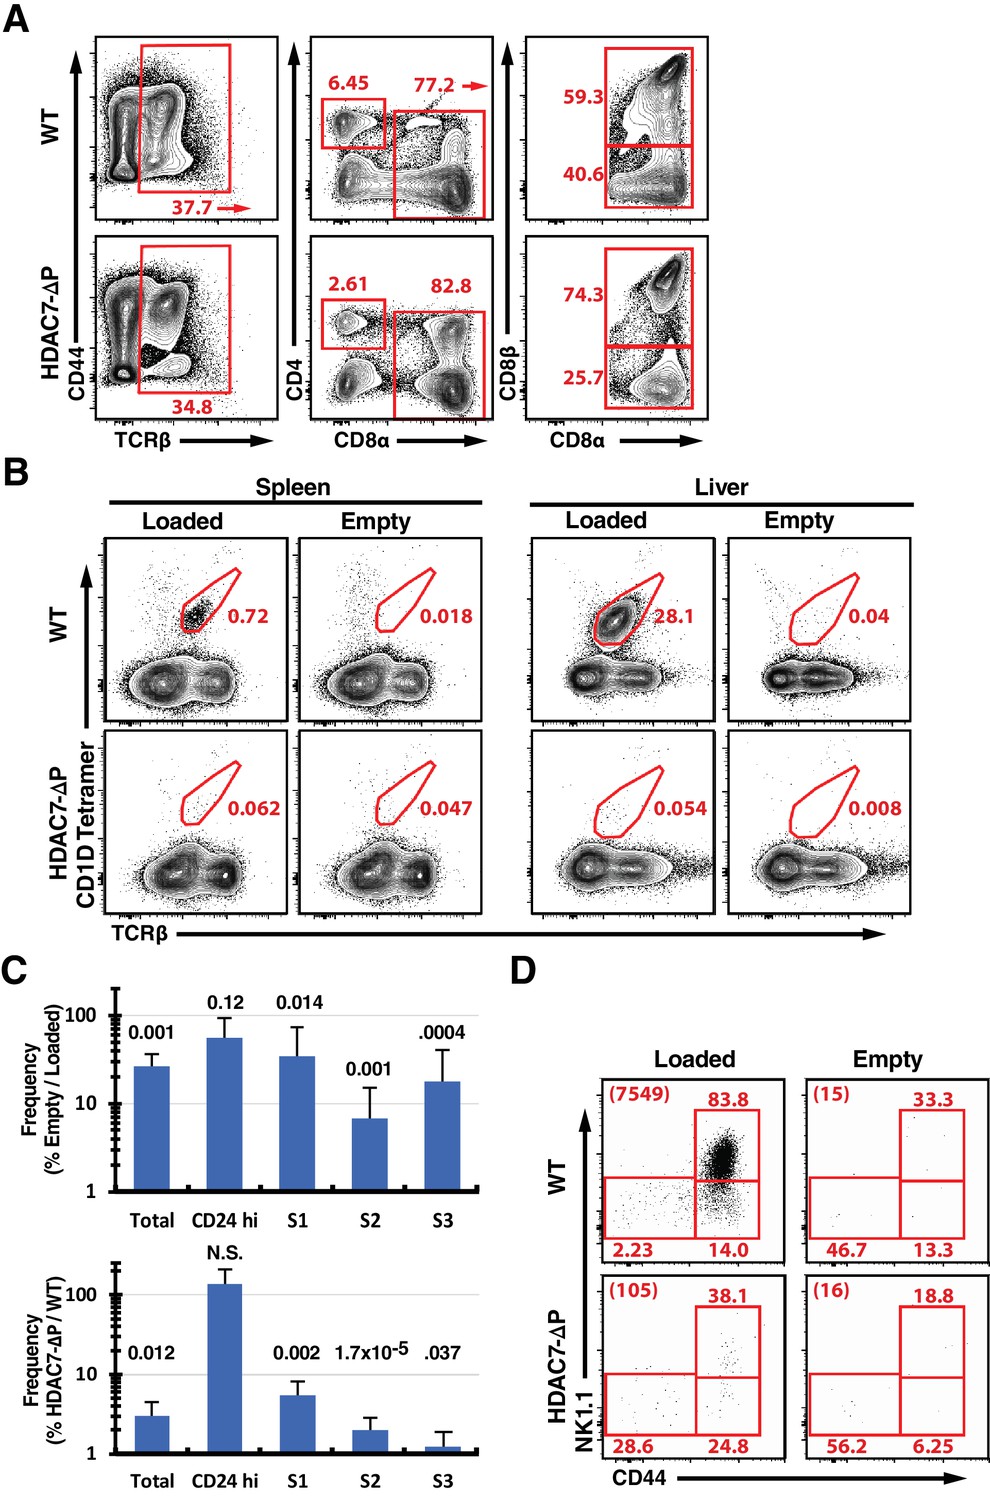
Supporting Data on iNKT Phenotype of HDAC7-ΔP Transgenic Mice.
(A) Representative flow scatter plots showing expression of CD44 vs. TCRβ (left), CD4 vs. CD8α (center), and CD8α vs. CD8β (right) in intra-epithelial lymphocytes isolated from small intestines of WT littermate (top) and HDAC7-ΔP mice (bottom). Data are representative of 3 independent experiments. Plots at center and right show the populations indicated by arrows in the plots to their left. (B) Representative flow scatter plots showing staining of splenocytes (left) or liver-resident lymphocytes (right) from WT littermate (top) or HDAC7-ΔP (bottom) mice with αGalCer-loaded or empty CD1D tetramers, as indicated. (C) Data from five independent littermate pair comparisons showing the percent ratio (as percent of live cells/percent of live cells) of the frequency of total tetramer-positive cells or tetramer-positive cells at the indicated stages, based on the gating shown in Figure 1C. Graph at top shows percent ratios for empty/loaded CD1D tetramer in HDAC7-ΔP mice. Graph at bottom shows percent ratios for loaded tetramer in thymocytes from HDAC7-Δp/WT littermate mice. Numbers above columns indicate P-values by 2-tailed, paired Student’s T-test. (D) Representative flow plot showing CD44 vs. NK1.1 staining of tetramer-positive thymocytes from WT littermate (top) or HDAC7-ΔP (bottom) mice with αGalCer-loaded or empty CD1D tetramers, as indicated. Numbers at upper left of each plot indicate the total number of cells falling in the iNKT gate for approximately 2 million total events.
Figure 1—figure supplement 2
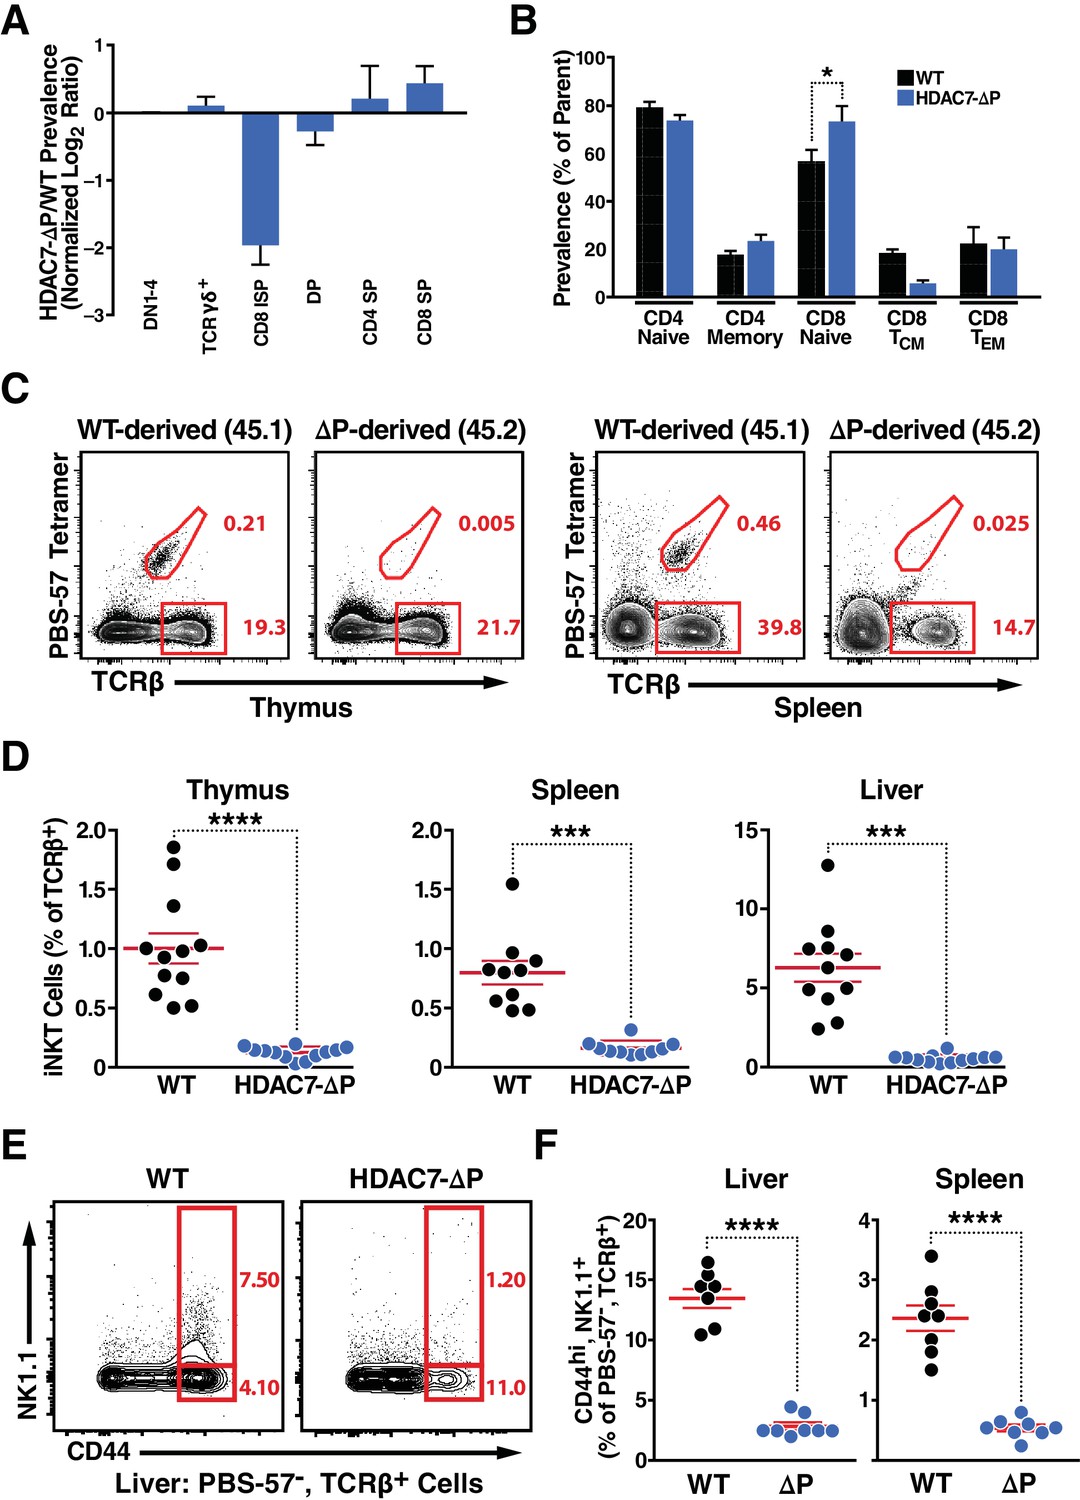
Supporting Data on the iNKT Phenotype of WT: HDAC7-ΔP Mixed Hematopoietic Chimeras.
(A) Log2 fold ratio of HDAC7-ΔP-derived (CD45.2) to WT-derived (CD45.1) cells at the indicated thymocyte stages. A composite DN1-4 engraftment ratio (Lin-CD4-CD8-) was calculated per mouse to normalize the ratio at each successive stage. (B) Proportion of T-cell subsets plotted as percentage of parent from HDAC7-ΔP-derived (CD45.2) or WT-derived (CD45.1) in mixed chimeras. CD4 naïve are defined as CD44loCD4+, CD4 memory as CD44hiCD4+, CD8 naïve as CD44loCD62LhiCD8+, CD8 central memory (TCM) as CD44hiCD62LhiCD8+, and CD8 effector memory (TEM) as CD44hiCD62LloCD8+. (C) Representative flow plots showing TCRβ vs. PBS-57 tetramer staining for WT and HDAC7-ΔP-derived populations in thymus (left) or spleen (right) of WT: HDAC7-ΔP Mixed Hematopoietic Chimeras. Frequency of iNKT cells and Tconv is indicated. (D) Quantification of iNKT cell frequency in mixed WT: HDAC7-ΔP mixed bone-marrow chimeras from thymus, spleen and liver. Bars on graphs indicate mean ±SEM; symbols represent individual mice. (E, F) Representative flow cytometric plots (E) from liver and total quantification (F) from liver and spleen of type II iNKT cells (Tet- CD44hi NK1.1+ TCRβ+) in mixed bone-marrow chimeras depending on bone marrow of origin. Data in (D) are derived from 3 sets of chimeras with 3–6 mice per group. Data in (F) are derived from 2 sets of chimeras with 3 and 4 mice. Statistical significance was determined using unpaired two-tailed t tests; ***p≤0.001, ****p≤0.0001.
Figure 1—figure supplement 3
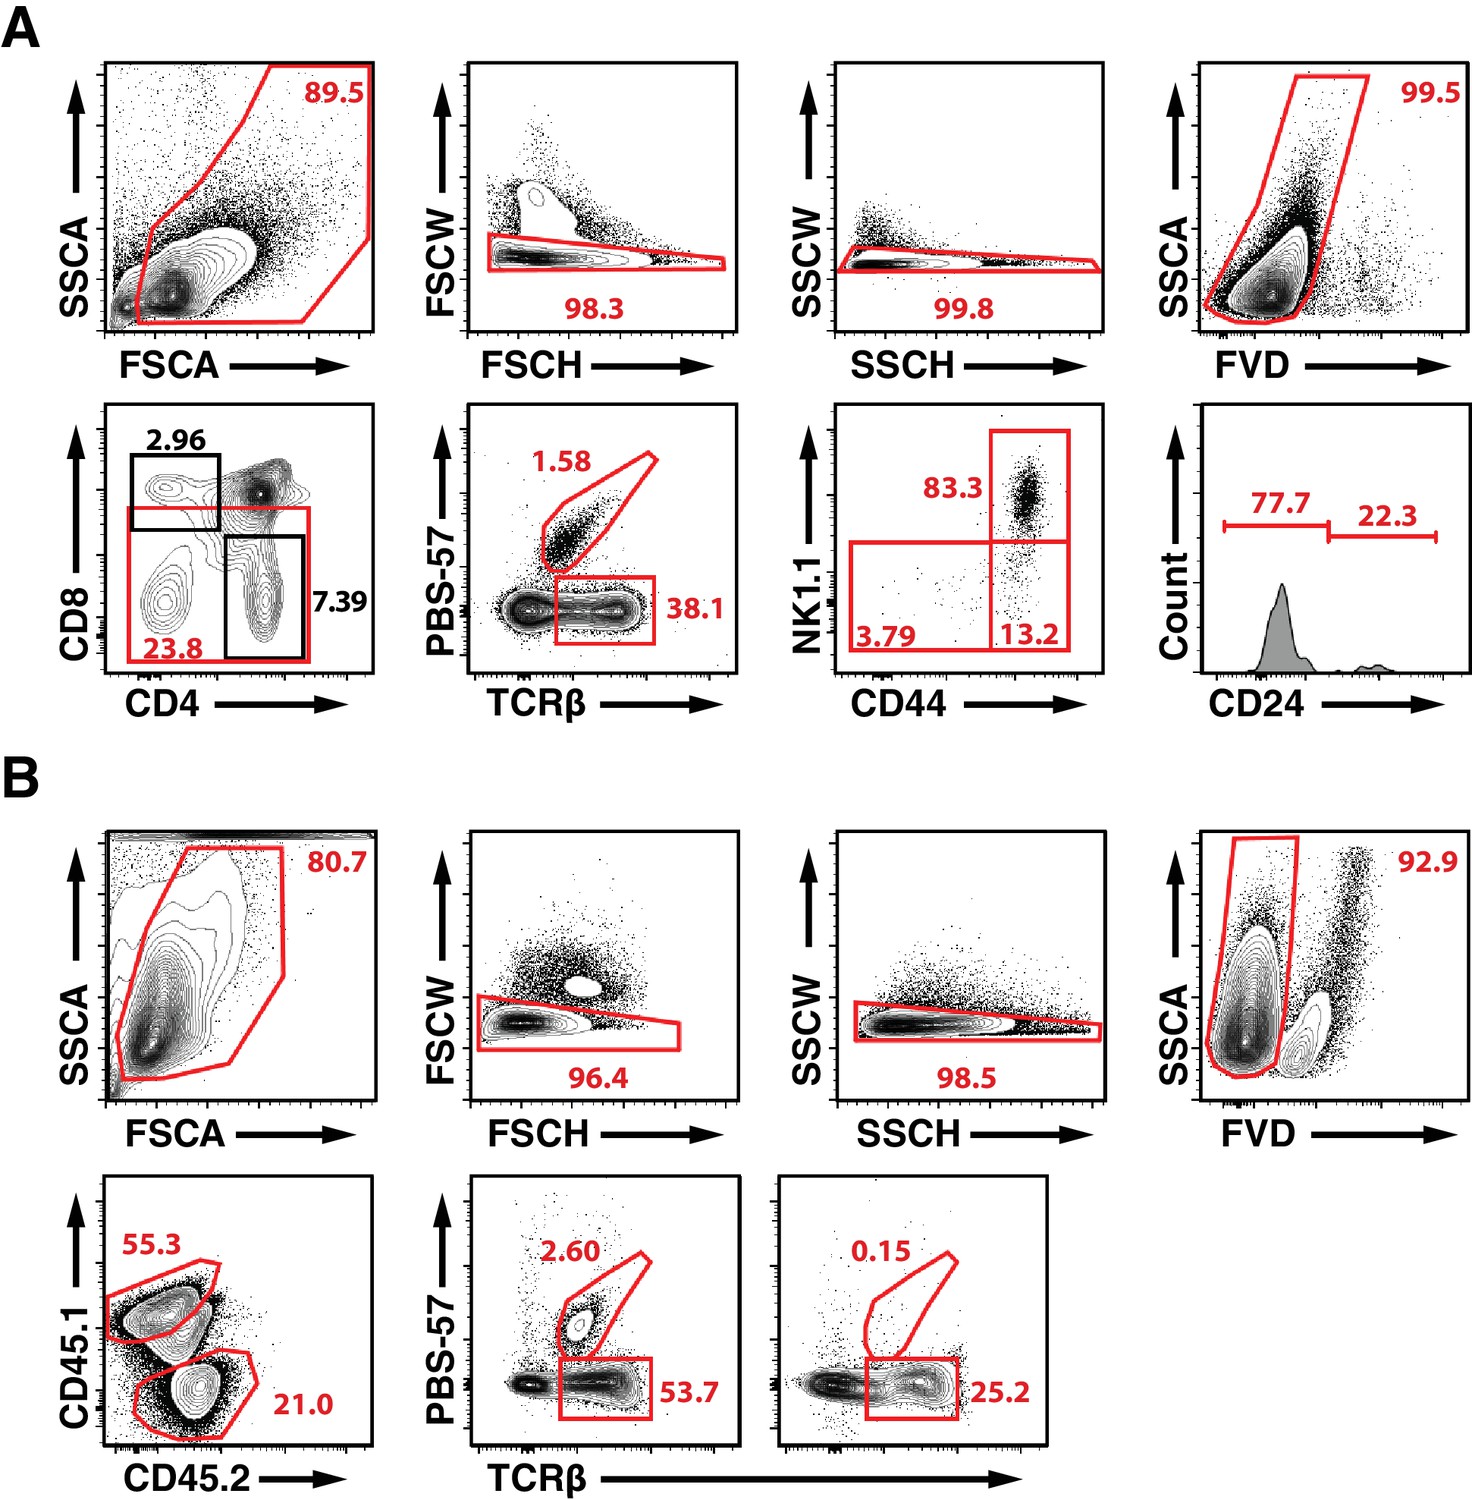
Full Gating Strategy for Detection and Staging of iNKT Cells in HDAC7-ΔP Transgenic Mice and WT: HDAC7-ΔP Mixed Hematopoietic Chimeras.
(A) Full gating for representative panels from thymus shown in Figure 1A and C. Bottom row of plots is as shown in Figure 1A and C. From left to right, top row shows gating for leukocytes by FSC area vs. SSC area, gating for singlets using chained FSC height vs. width and SSC height vs. width, then gating for live cells using eFluor 520 fixable viability dye vs. SSC. This scheme was employed for all data shown in Figures 1–4, Figure 8, and their associated supplements. (B) Full gating for analysis of liver-resident lymphocytes WT: HDAC7-ΔP Mixed Hematopoietic Chimeras. Last two panels in bottom row are as shown in Figure 1E. Top row shows gating for live single leukocytes as for (A). First panel in bottom row shows gating for WT and HDAC7-ΔP -derived cells using CD45.1 and CD45.2. HDAC7-ΔP cells are 45.2+/45.1-, WT cells 45.1+/45.2-, and host-derived cells are 45.1/45.2 double-positive.
Figure 2 with 2 supplements
Deletion of HDAC7 in thymocytes Reduces iNKT Numbers and Expands an Innate-Memory CD8 Population.
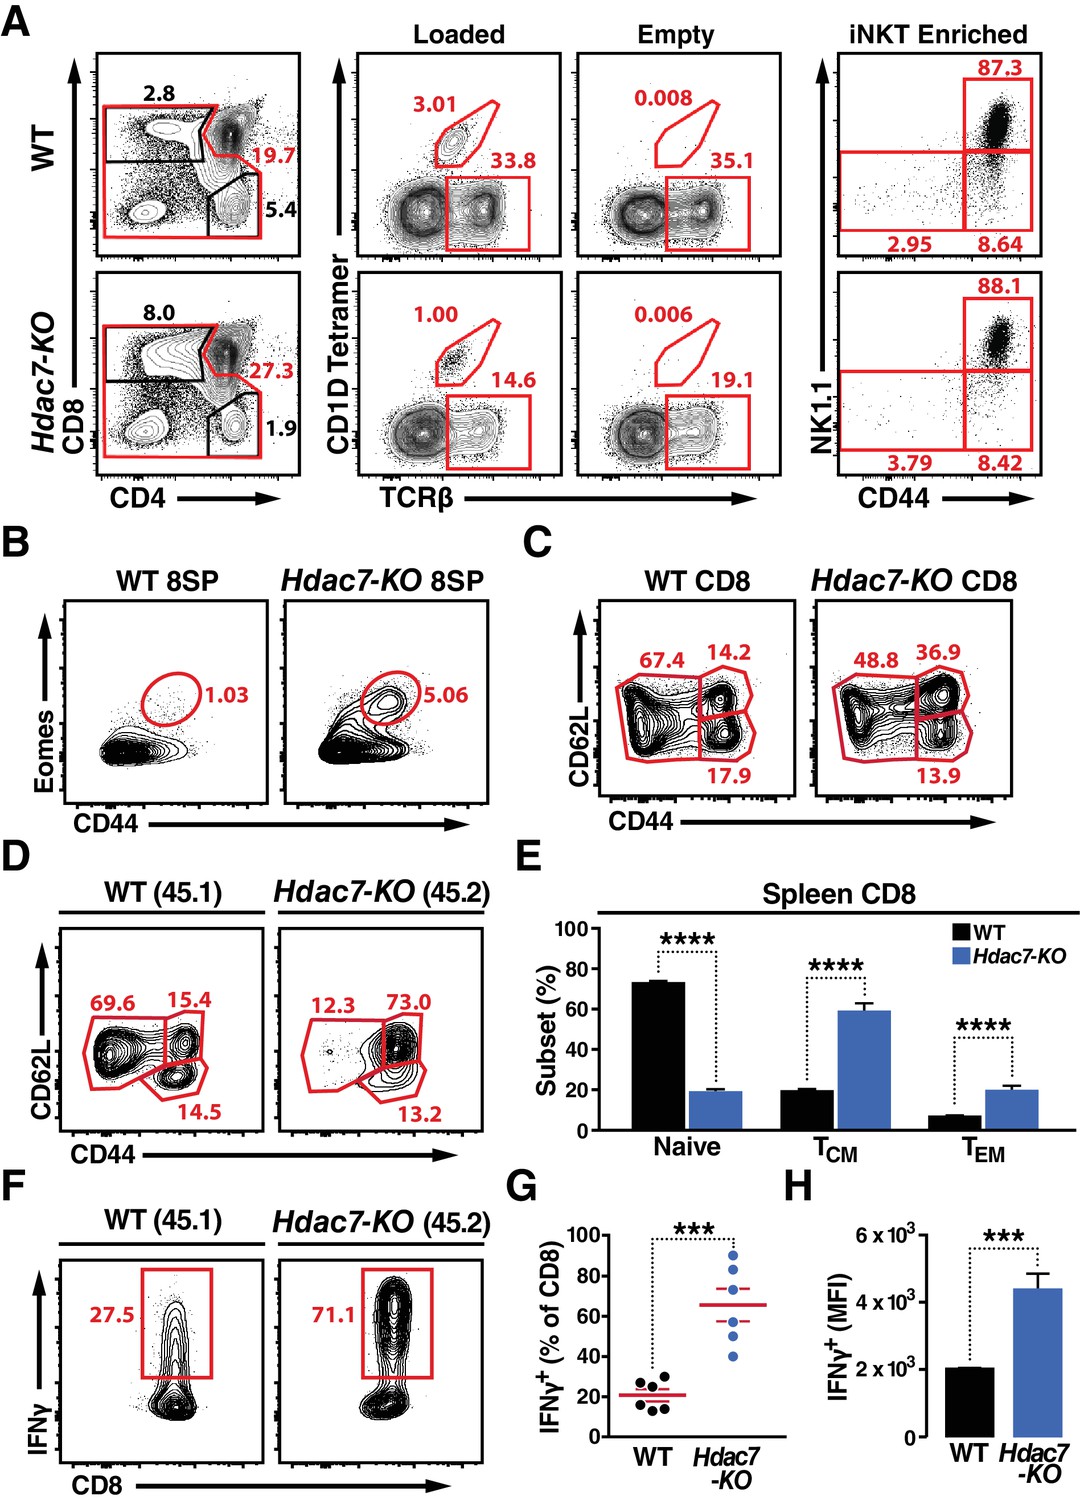
(A) Representative flow plots showing CD4/CD8 expression (left), loaded and empty CD1D tetramer reactivity (center), and CD44/NK1.1 expression of magnetically enriched iNKT cells (right) from thymus of WT (top) and Hdac7-KO (bottom) thymocytes. (B) Representative flow plots showing an expanded CD44hi Eomes+ innate memory population in mature CD8SP thymocytes from Hdac7-KO mice. Mature CD8 SP thymocytes are identified as TCRβ+CD8+CD4-. (C) Expression of CD44 and CD62L in CD8 T-cells from spleens of WT and Hdac7-KO littermate mice. Data are representative of 3 independent experiments with N = 2–4 mice per group. (D, E) Representative flow plots (D) and total quantification (E) of peripheral naive, central memory (TCM), and effector memory (TEM) CD8 T-cell populations from WT (CD45.1) and Hdac7-KO (CD45.2) derived bone marrow in mixed hematopoietic chimeras. (F, G, H) Representative flow plots (F) and total quantification (G, H) of IFNγ secretion in ex vivo stimulated CD8 T-cells. Splenocytes were harvested from mixed WT (CD45.1)/Hdac7-KO (CD45.2) hematopoietic chimeras, and stimulated ex vivo for 4 hr with PMA/Ionomycin. Percent of cells secreting IFNγ (G) and median fluorescence intensity (MFI) of IFNγ secretion (H) are shown. Bars on graphs indicate mean ±SEM (error bars). Data in (E) are combined from three independent experiments with at least three mice per group; data in (G, H) are combined from three independent experiments with two mice per group. Statistical significance was determined using either unpaired two-tailed T-test (E, H) or two-way ANOVA (G); ***p≤0.001, ****p≤0.0001. A Bonferroni post-test was used for pairwise comparisons in (E).
-
Figure 2—source data 1
Microsoft Excel workbook containing numerical data matrices for all figure panels (on separate sheets) in which individual data points are not represented graphically.
- https://doi.org/10.7554/eLife.32109.011
Figure 2—figure supplement 1

Supporting Data on T Cell Phenotypes of Hdac7-KO Mice.
(A) Representative flow scatter plots showing analysis of WT (top) and HDAC7-ΔP TG (bottom) thymocytes for the frequency of γδ T cells (second column), and their Vδ6.3-positive (third column) and PLZF-positive (fourth column) subsets. (B) Quantification of CD44+/Eomes + cells among mature CD8SP thymocytes. Data are combined from four independent experiments with 1–2 mice per group. ****: p≤0.0001, 2-tailed Student’s T-test. (C) Quantification of total γδ T cells, as well as Vδ6.3-positive and PLZF-positive subsets, as represented in (A), based on six independent comparisons of WT and Hdac7-KO mice. Based on a 2-tailed Student’s T-test, p>0.05 for all comparisons except total γδ T cells (p=0.043). (C) Surface expression of Ly6C and CXCR3 from peripheral CD8 T-cells. Black unfilled histograms correspond to WT, blue-filled to Hdac7-KO. Plots represent three independent experiments with 2–4 mice per group.
Figure 2—figure supplement 2
Supporting Data on Memory Markers and Cytokine Production in WT: Hdac7-KO Mixed Hematopoietic Chimeras.
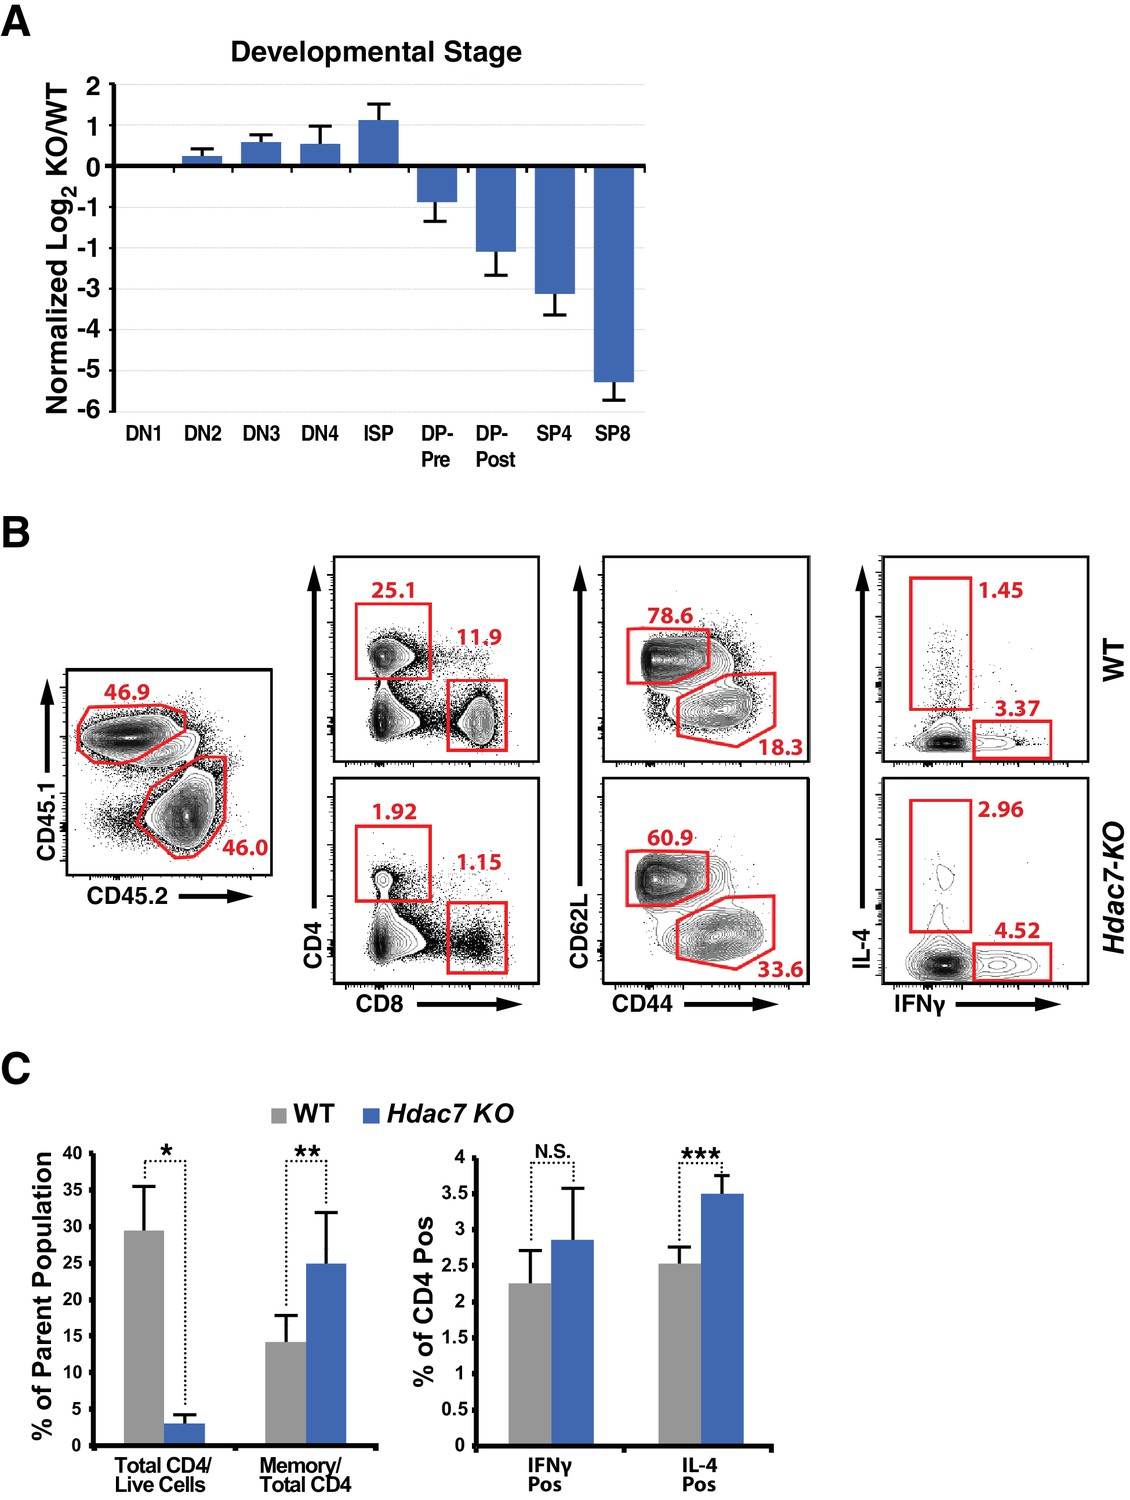
(A) Bar chart showing log2 ratios of Hdac7-KO/WT cells present in WT: Hdac7-KO hematopoietic chimeras at the indicated thymic developmental stages. (B) Representative flow plots showing gating for analysis of memory markers and cytokine secretion in WT: Hdac7-KO mixed hematopoietic chimeras. (C) Quantification for 8 WT: Hdac7-KO mixed chimeras of total CD4/CD8 prevalence and expression of memory markers in CD4 cells (left), or for 6 chimeras of expression of IL-4 and IFNγ in CD4 cells (right). *: p=3.07×10⁻⁸, **: p=0.0083. ***: p=0.016.
Figure 3 with 1 supplement
HDAC7-ΔP Blocks Innate Effector Development in iNKT Cells and Converts Them to Naive-Like T-cells.
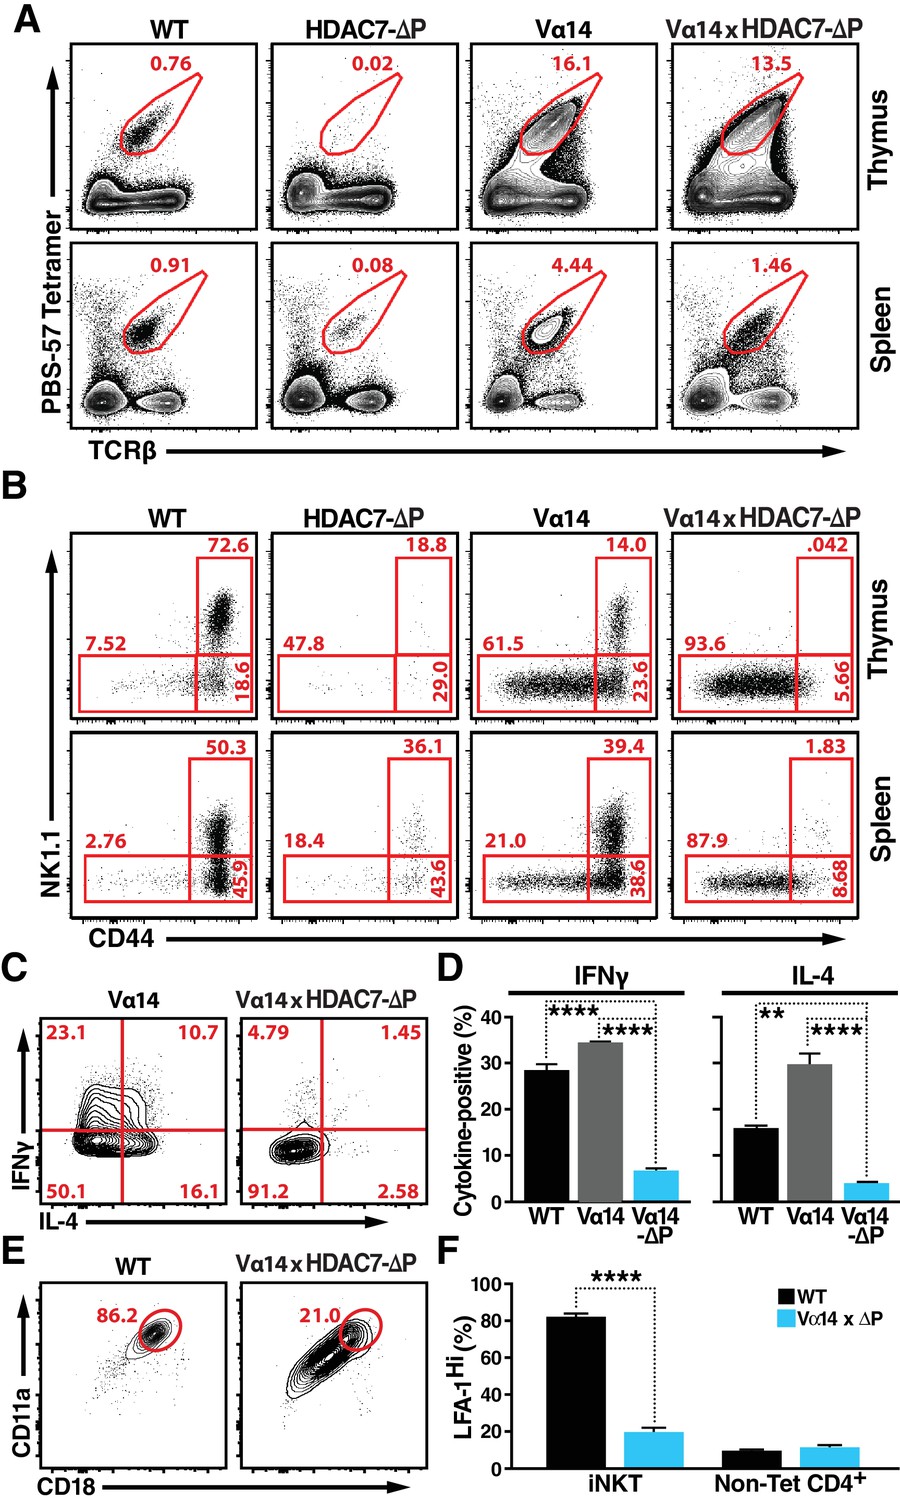
(A, B) Representative flow cytometric plots showing TCRβ vs. PBS-57 tetramer staining (A), and CD44 vs. NK1.1 staining of iNKT cells (B) in thymus (top) and spleen (bottom) of littermate mice with the indicated genotypes. (C, D) Representative staining (C) and total quantification (D) of IFNγ and IL-4 secretion in total splenocytes from littermate mice of the indicated genotypes, stimulated ex vivo for 4 hr with PMA/Ionomycin. (E, F) Representative flow plots (E) showing surface expression of LFA-1 (CD11a/CD18) in splenic iNKT (Tet+/TCRβ+) cells, with quantification for four littermate pairs shown in (F). Bars on graphs indicate mean ±SEM. Data in (D, F) are from three independent experiments. Statistical significance was determined using one-way (E) or two-way (F) ANOVA; *p≤0.05, **p≤0.01, ***p≤0.001, ****p≤0.0001. Tukey (E) or Bonferroni post-tests (F) were used for pairwise comparisons.
-
Figure 3—source data 1
Microsoft Excel workbook containing numerical data matrices for all figure panels (on separate sheets) in which individual data points are not represented graphically.
- https://doi.org/10.7554/eLife.32109.014
Figure 3—figure supplement 1
Supporting Data on iNKT Phenotype of Vα14/Jα18 X HDAC7-ΔP Transgenic Mice.
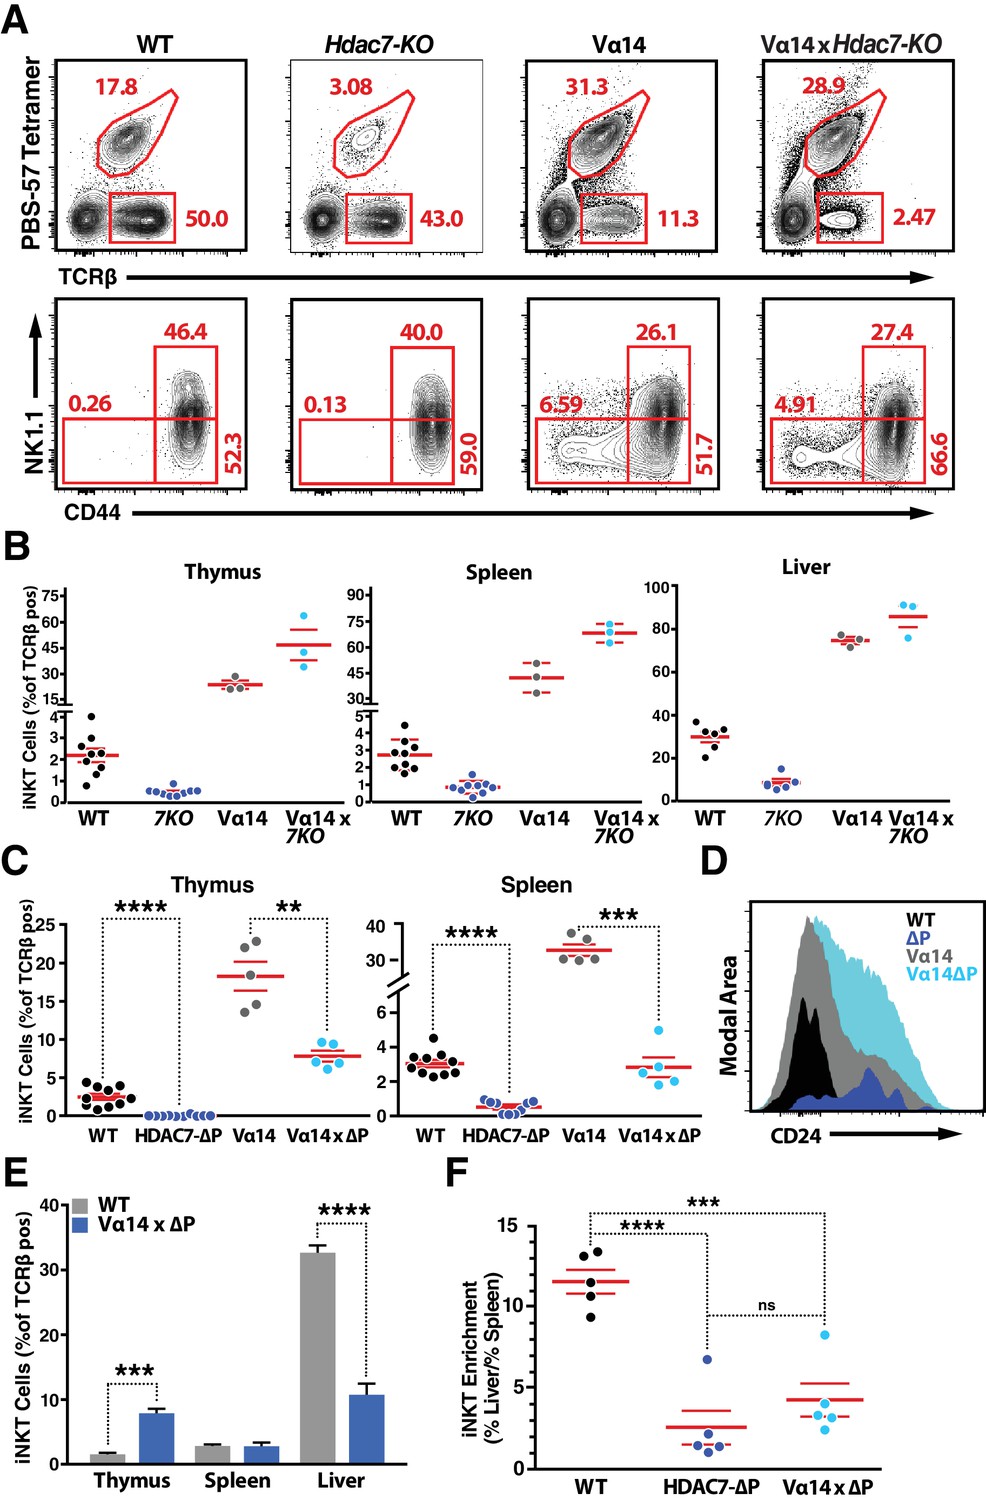
(A, B) Restoration of iNKT cells (Tet + TCRβ+) in Hdac7-KO mice by expression of the Vα14-Jα18 TCR transgene (A, top row), as well as representative CD44/NK1.1 staging for each genotype (bottom row). Representative plots for the indicated genotypes shown in (A) with total quantification shown in (B) for liver (left), thymus (center), and spleen (right) for at least 3 pairs of littermate mice. (C) Proportion of iNKT cells expressed as percent of total TCRβ+T cells in thymus (left) and spleen (right) from WT, HDAC7-ΔP, Vα14, and Vα14 x HDAC7-ΔP mice. (D) Overlaid histograms of CD24 expression in the CD44-NK1.1- populations from thymocytes of the indicated genotypes, as shown in Figure 3B. (E) Proportion of iNKT cells expressed as percent of total TCRβ+T cells in thymus, spleen and liver from WT and Vα14 x HDAC7-ΔP mice. (F) Fold enrichment of iNKT cells in liver (% total TCRβ+) over spleen (% total TCRβ+) in WT and Vα14 x HDAC7-ΔP mice. Statistical significance was determined using unpaired two-tailed t tests; ***p≤0.001, ****p≤0.0001.
Figure 4
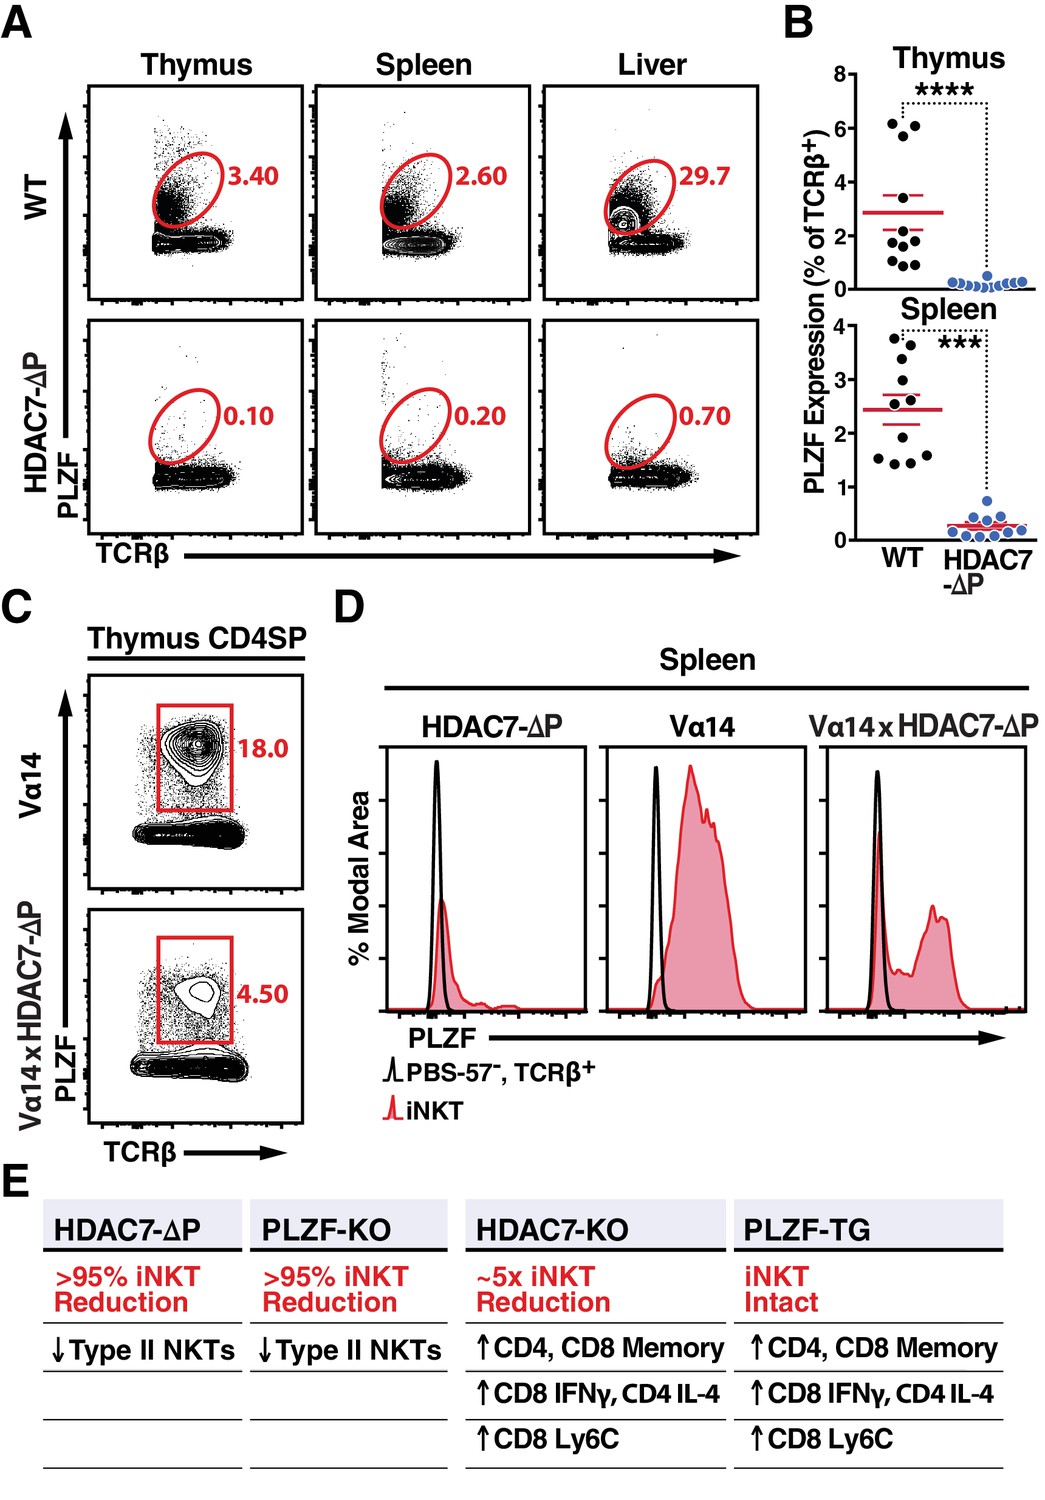
Nuclear HDAC7 Retention Restricts PLZF Expression and Mirrors PLZF-Associated T Cell Phenotypes.
(A, B) Representative flow cytometric plots (A) and total quantification (B) of PLZF expression in TCRβ+ cells from thymus, spleen, and liver. (C) PLZF expression in mature CD4 SP (CD4+ CD8- TCRβ+) thymocytes from Vα14 (top) and Vα14 X HDAC7-ΔP (bottom) transgenic animals. (D) PLZF expression in peripheral iNKT (Tet+ TCRβ+) cells from spleen. Black unfilled histograms correspond to conventional (Tet-TCRβ+) T-cells, red tinted to iNKT (Tet+TCRβ+) cells. (E) Summary table comparing phenotypes in HDAC7-ΔP, PLZF KO, Hdac7-KO and PLZF Tg mice with respect to iNKT and conventional T-cell development. Bars on graphs in (B) indicate mean ±SEM; symbols represent individual mice. Data in (B) are combined from four independent experiments with at least two mice per group; data in (D) are representative of 3 independent experiments with two mice per group; Statistical significance was determined using unpaired two-tailed T-tests (B); ***p≤0.001, ****p≤0.0001 vs. WT.
Figure 5 with 1 supplement
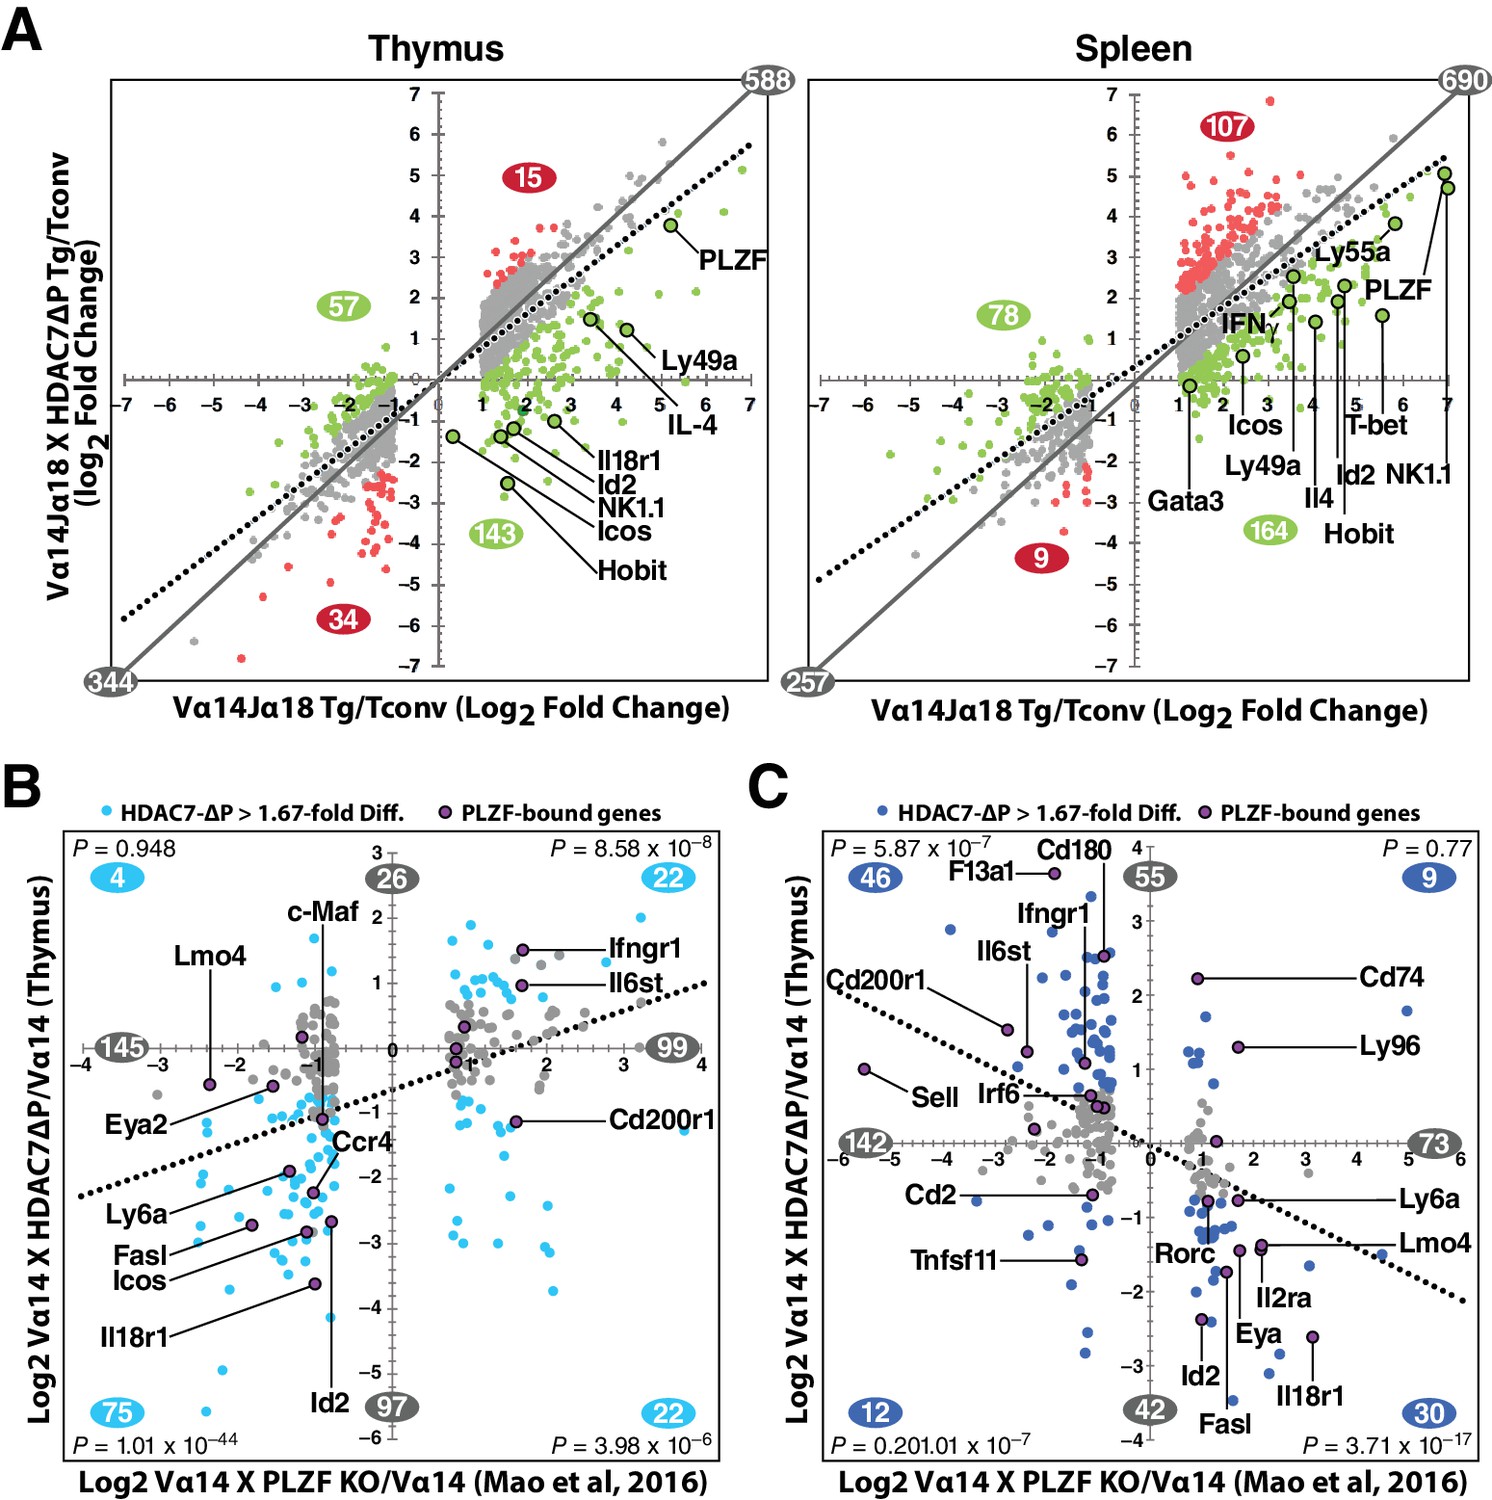
HDAC7 Regulates a Cassette of Genes in Glycolipid-Reactive Cells That is Highly Relevant to Innate Effector Function, Inflammation, Autoimmunity, and Autoimmune Liver Disease.
(A) Scatter charts showing gene expression changes in Cd1d/αGalCer-reactive Vα14 Tg (X axis) and Vα14 X HDAC7-ΔP Tg (Y axis) thymocytes (left) or CD4 splenocytes (right) vs naïve CD4SP thymocytes or splenocytes, respectively. The solid gray line indicates the plot diagonal and the dotted gray line indicates the Least Squares best-fit line of the plotted data. Genes displayed were expressed at least 1.75-fold differentially between tetramer-reactive and naïve cells, with p<0.05 (2-tailed Student’s T test) for three biological replicates of each genotype. Colored plot points represent genes whose differential expression vs. naïve was enhanced (red points) or suppressed (green points) at least 1.75-fold by co-expression of HDAC7-ΔP (C, D) Scatter charts showing genes > 1.66 fold differentially expressed due to loss of PLZF function (C, horizontal axis), or due to transgenic expression of PLZF (D, horizontal axis) according to (Mao et al., 2016), plotted against effect of HDAC7-ΔP expression in PBS-57 tetramer-reactive Vα14 X HDAC7-ΔP vs Vα14 Transgenic thymocytes in Thymus (C, vertical axis) or spleen (D, vertical axis). Total number of genes > 1.67 fold differentially expressed along each axis are indicated in gray. Numbers of genes, with P-values (binomial distribution) of the overlap, for genes differentially expressed along both axes in each quadrant (blue symbols), are indicated in blue.
Figure 5—figure supplement 1
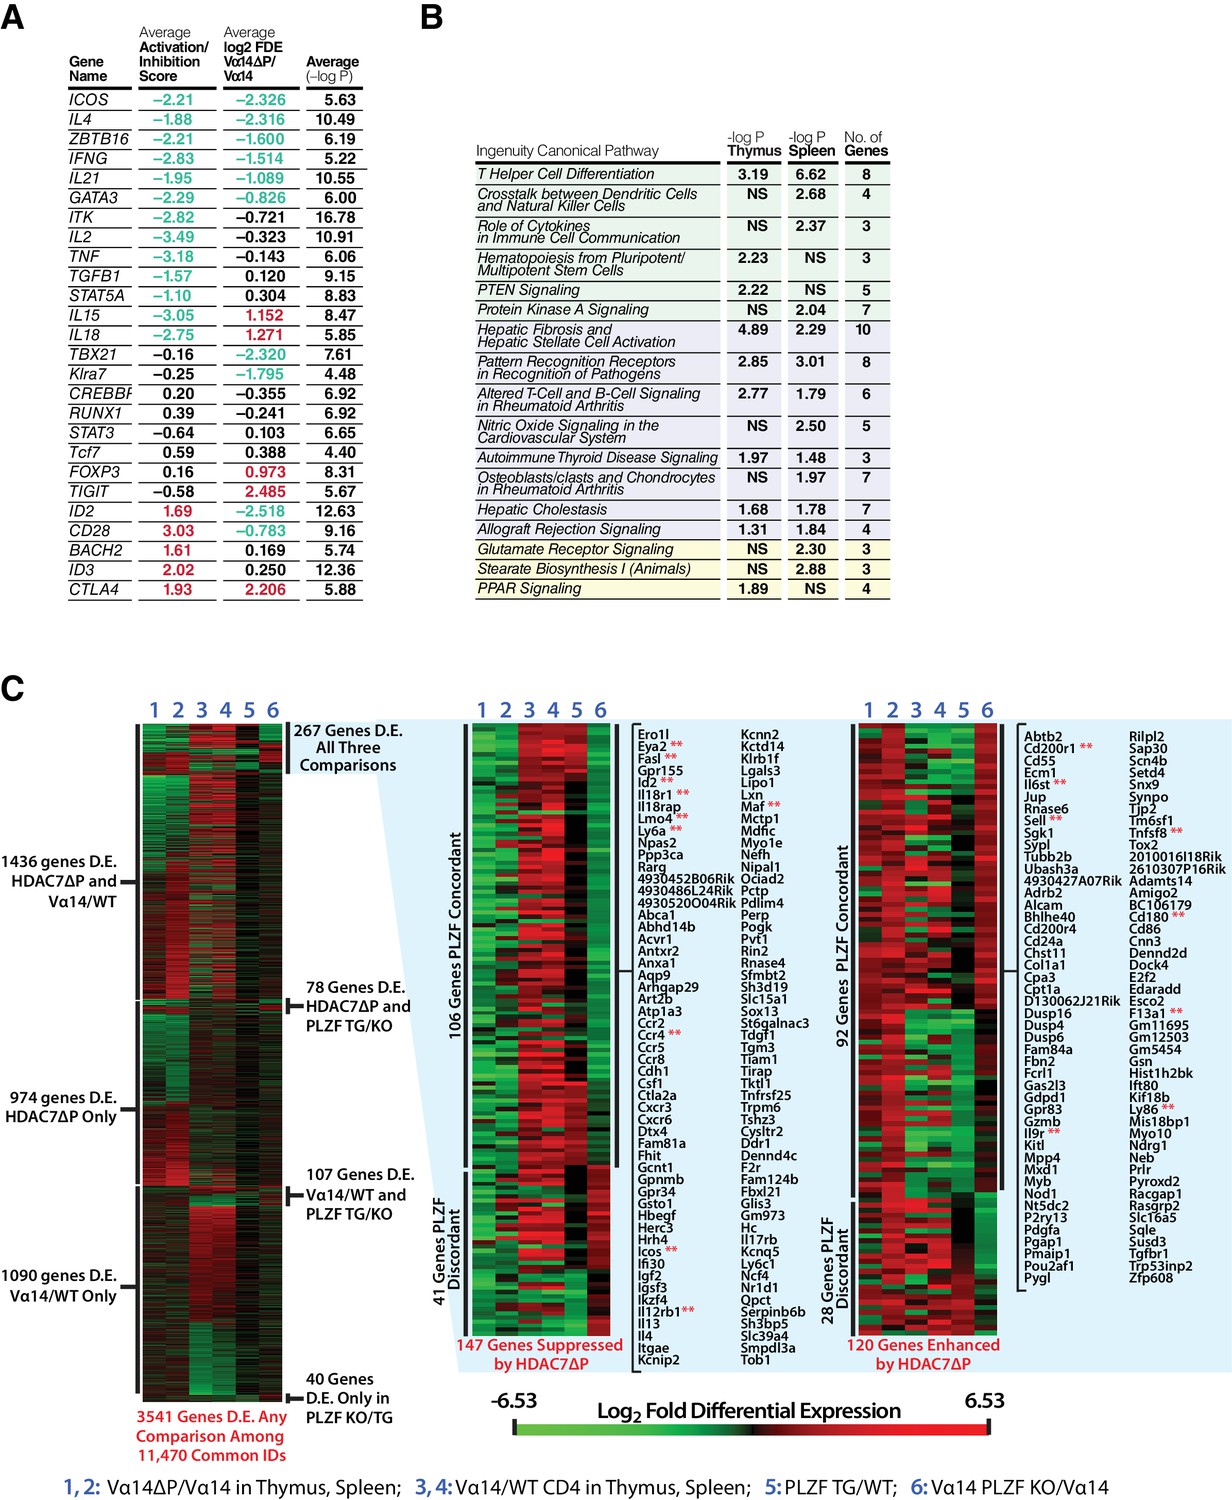
HDAC7 Regulates a Cassette of Genes in Glycolipid-Reactive Cells That is Highly Relevant to Innate Effector Function, Inflammation, Autoimmunity, and Autoimmune Liver Disease.
Related to Figure 5. (A) Table showing top putative upstream regulators (Column 1) of the genes from Figure 5A that were suppressed by HDAC7-ΔP, based on analysis with Ingenuity Pathway Analysis (IPA). Values shown in Columns 2–3 are averages of data from thymocytes and splenocytes. Column 2: average activation/inhibition z-score of putative upstream regulators. Column 3: Average log2 fold differential expression (log2 FDE) of indicated genes in Vα14 X HDAC7-ΔP vs. Vα14 iNKT cells. Column 4: Average (-log10P value) of upstream regulator for thymus and spleen. (B) Table of IPA overrepresented canonical signaling pathways in the set of genes analyzed in (A). Green-shaded pathways are involved in innate effector differentiation or function, purple-shaded pathways in inflammation and autoimmunity. (C) Seriated heat maps showing log2 FDE (red is upregulated, green downregulated) for our RNA-seq data and published data on PLZF in iNKT cell development (Mao et al., 2016). Columns 1–4 show our comparisons and columns 5–6 theirs, as indicated at the bottom of the figure. Heatmap at left shows 3541 genes that are differentially expressed in any comparison among the 11,470 genes sharing common IDs between all datasets. Heatmaps at center and right show data for 267 genes differentially expressed due to HDAC7-ΔP expression (columns 1–2), between Tconv and iNKT cells (columns 3–4), and due to gain/loss of PLZF function (columns 5–6). Among these genes, changes during iNKT development that are suppressed by HDAC7-ΔP are shown at center, and those enhanced by HDAC7-ΔP at right.
Figure 6

The intersection of HDAC7-regulated genes in iNKT development and GWAS hits for IBD and PSC highlights key signaling pathways.
(A) Venn diagram showing enumeration of genes that are GWAS risk loci for PSC and IBD from (Liu et al., 2013; Jostins et al., 2012), and/or also regulated by HDAC7 during NKT development according to our RNA-seq data (FDE >1.66, p<0.05). The indicated P-value is based on the binomial distribution, using the 13,519 genes scored as expressed under any condition as a basis. (B) Heatmap showing the P-values for the cited GWAS studies in the overlapping set of genes (first two rows), regulation of these genes by PLZF (third row, according to [Mao et al., 2016]), by HDAC7 (rows 4–5), and during normal iNKT development, (row 6, according to Immgen stage-specific data [http://www.immgen.org]), as well as scoring for positive (red) or negative (blue) roles in NK/NKT development/function or autoimmunity, according to literature search (rows 7–8, see Supplementary file 1 for citations). (C) Genes that were most relevant to the criteria listed in (B), i.e. positive/significant in four or more measures, were mapped the signaling pathways in which they participate. Shaded areas indicate four distinct, highly populated signaling modules, with number of genes indicated.
Figure 7 with 1 supplement

HDAC7 Can Physically Bind and Functionally Antagonize PLZF Transcriptional Activity.
(A) Immuno-blots showing co-immunoprecipitation with endogenous HDAC7 of PLZF from PLZF-transgenic thymocytes. (B) Immunoblot showing Co-immunoprecipitation of HA-tagged full-length PLZF from transfected 293 T cells with the indicated FLAG-tagged truncation mutants of HDAC7 (C) Immunoblot showing Co-immunoprecipitation of HA-tagged PLZF truncations as indicated, with the FLAG-tagged HDAC7 1–497 (D), (E) Quantification of Immunoprecipitated protein/input protein for the pairs of constructs in (B) and (C) respectively. Ratios shown are normalized to the background signals for each individual experiment. Error bars indicate SEM of 4–7 individual experiments for each pair of constructs. Shaded areas in diagrams in (B) and (C) indicate areas defined as required for interaction based on this analysis. (F) Firefly luciferase activity from 293 T cells transfected with a Gal4(5)/SV40 minimal promoter reporter construct, normalized to Renilla luciferase values from an EF1α promoter-driven reporter construct. In addition to the reporters, cells were transfected with constructs encoding the Gal4 DNA-binding domain (1-142) fused to the indicated segments of PLZF, as well as empty vector, full-length HDAC7, or HDAC7 1–497 fused to the HSV VP16 transcriptional activation domain (410-490). Error bars represent SEM of four individual experiments.
-
Figure 7—source data 1
Microsoft Excel workbook containing numerical data matrices for all figure panels (on separate sheets) in which individual data points are not represented graphically (Figure 7D,E,F).
- https://doi.org/10.7554/eLife.32109.021
Figure 7—figure supplement 1
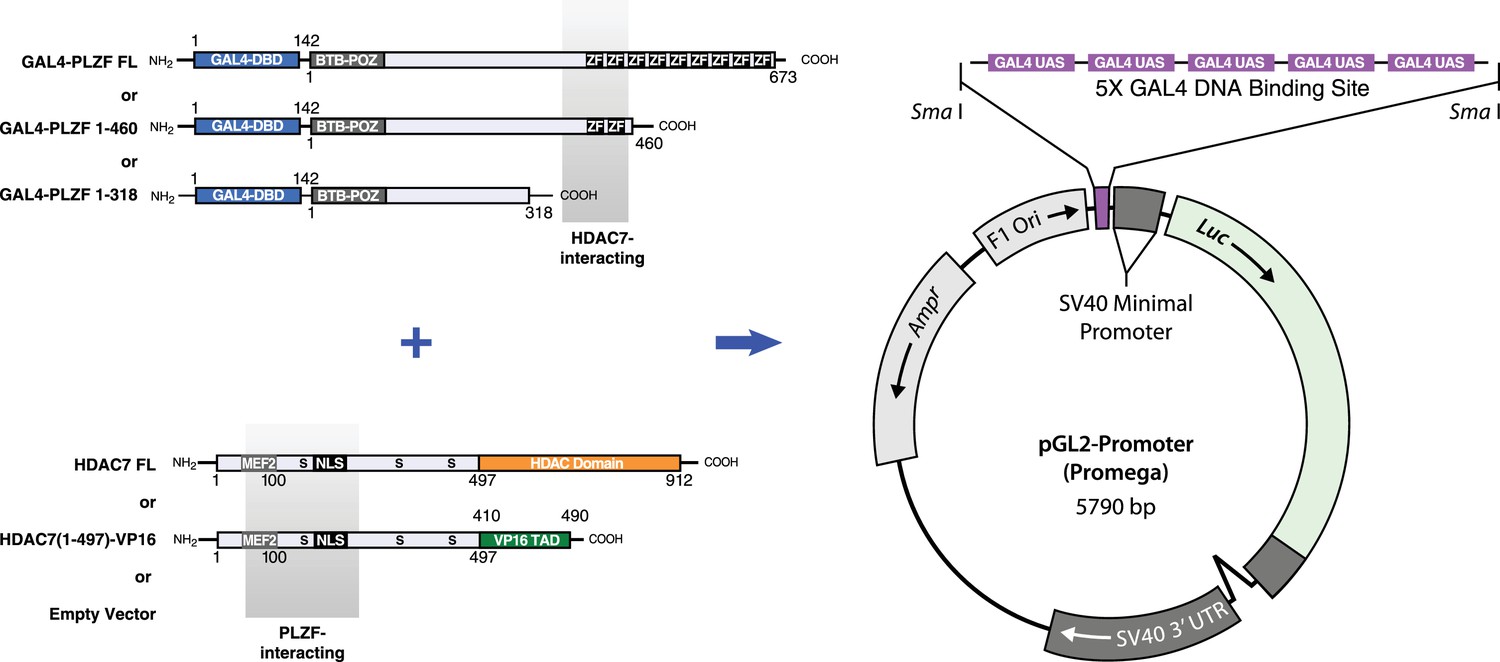
Diagram of GAL4-PLZF, HDAC7, and GAL4 reporter constructs employed in experiments shown Figure 7F in main text.
The GAL4 DBD-PLZF fusion and HDAC7 constructs shown were co-transfected into HEK293T cells, together with the 5XGAL4 site-containing pGL2 Promoter luciferase reporter shown at right.
Figure 8 with 1 supplement
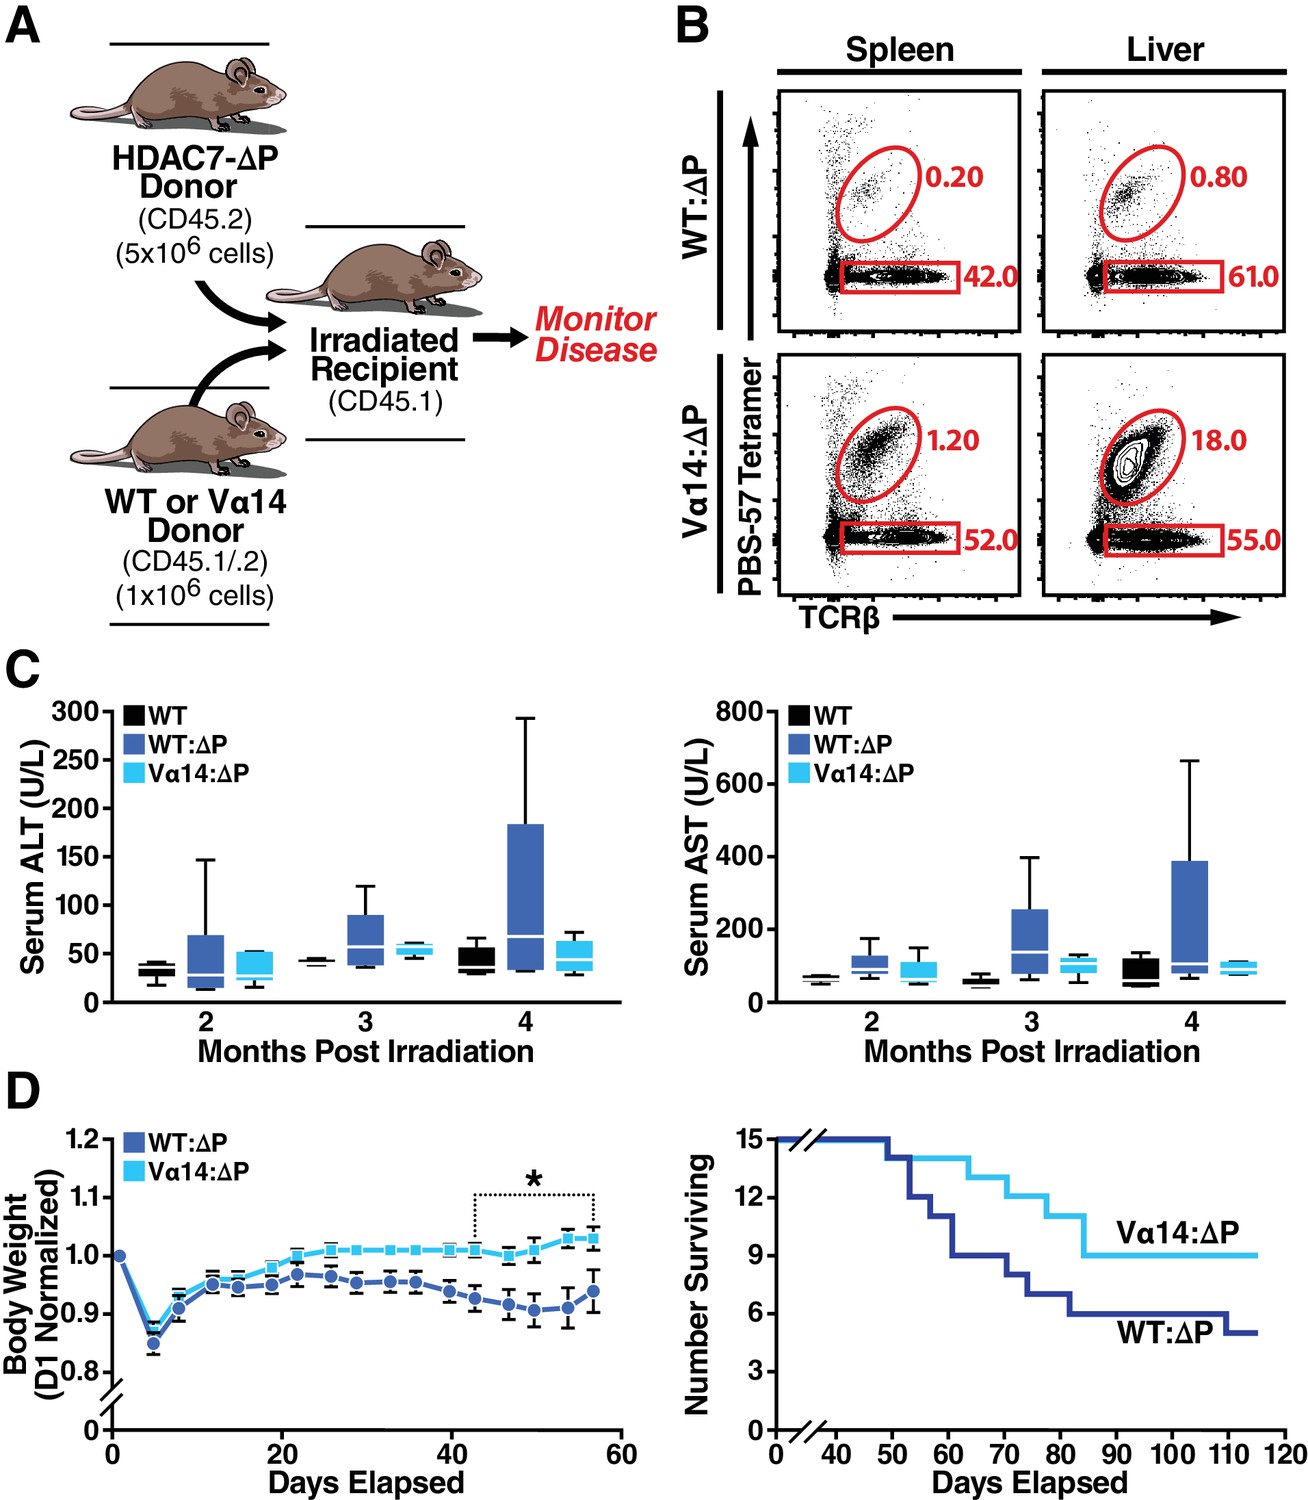
Loss of iNKT Cells in HDAC7ΔP Mice Contributes to Tissue-Specific Autoimmunity.
(A) Schematic of mixed BM chimeras used to monitor HDAC7-ΔP-mediated autoimmunity time course and severity. Lethally irradiated CD45.1 BoyJ recipients were reconstituted (6 × 10⁶ cells) with a 1:5 mixture of either WT (CD45.1): HDAC7-ΔP (CD45.2) or Vα14 (CD45.1): HDAC7ΔP (CD45.2) bone marrow cells. (B) Vα14 bone marrow (bottom) robustly restores peripheral iNKT cells (Tet+ TCRβ+ in liver and spleen in mixed BM chimeras, while WT bone marrow does not. Plots are representative of two sets of independently made chimeras. (C) Plasma concentration of liver (ALT, AST) markers of tissue damage over time measured in WT mice compared to Vα14: HDAC7-ΔP and WT: HDAC7-ΔP BM chimeras. (D) Body weight (left) and survival (right) of mixed BM chimeras over time post-irradiation. Weights in (D) were normalized to starting weight on Day one post-irradiation and measured twice a week thereafter. Survival (D, right) was assessed by monitoring for spontaneous death twice a week or by euthanasia after reaching a clinical endpoint of at least 20% body weight loss compared to peak weight post-irradiation. Using Kaplan-Meier analysis, p=0.0616 by Gehan-Breslow-Wilcoxon tests. Bars on graphs indicate mean ±SEM (error bars); whiskers on box-and-whiskers plots represent min to max. Data in (C) were collected from N = 6 mice per group; data in (D) and (E) were combined from three independent experiments with N = 16 mice total per group. Statistical significance in (D) was determined using two-way ANOVA; *p≤0.05. Bonferroni post-tests were used for pairwise comparisons.
-
Figure 8—source data 1
Microsoft Excel workbook containing numerical data matrices for all figure panels (on separate sheets) in which individual data points are not represented graphically.
- https://doi.org/10.7554/eLife.32109.024
Figure 8—figure supplement 1
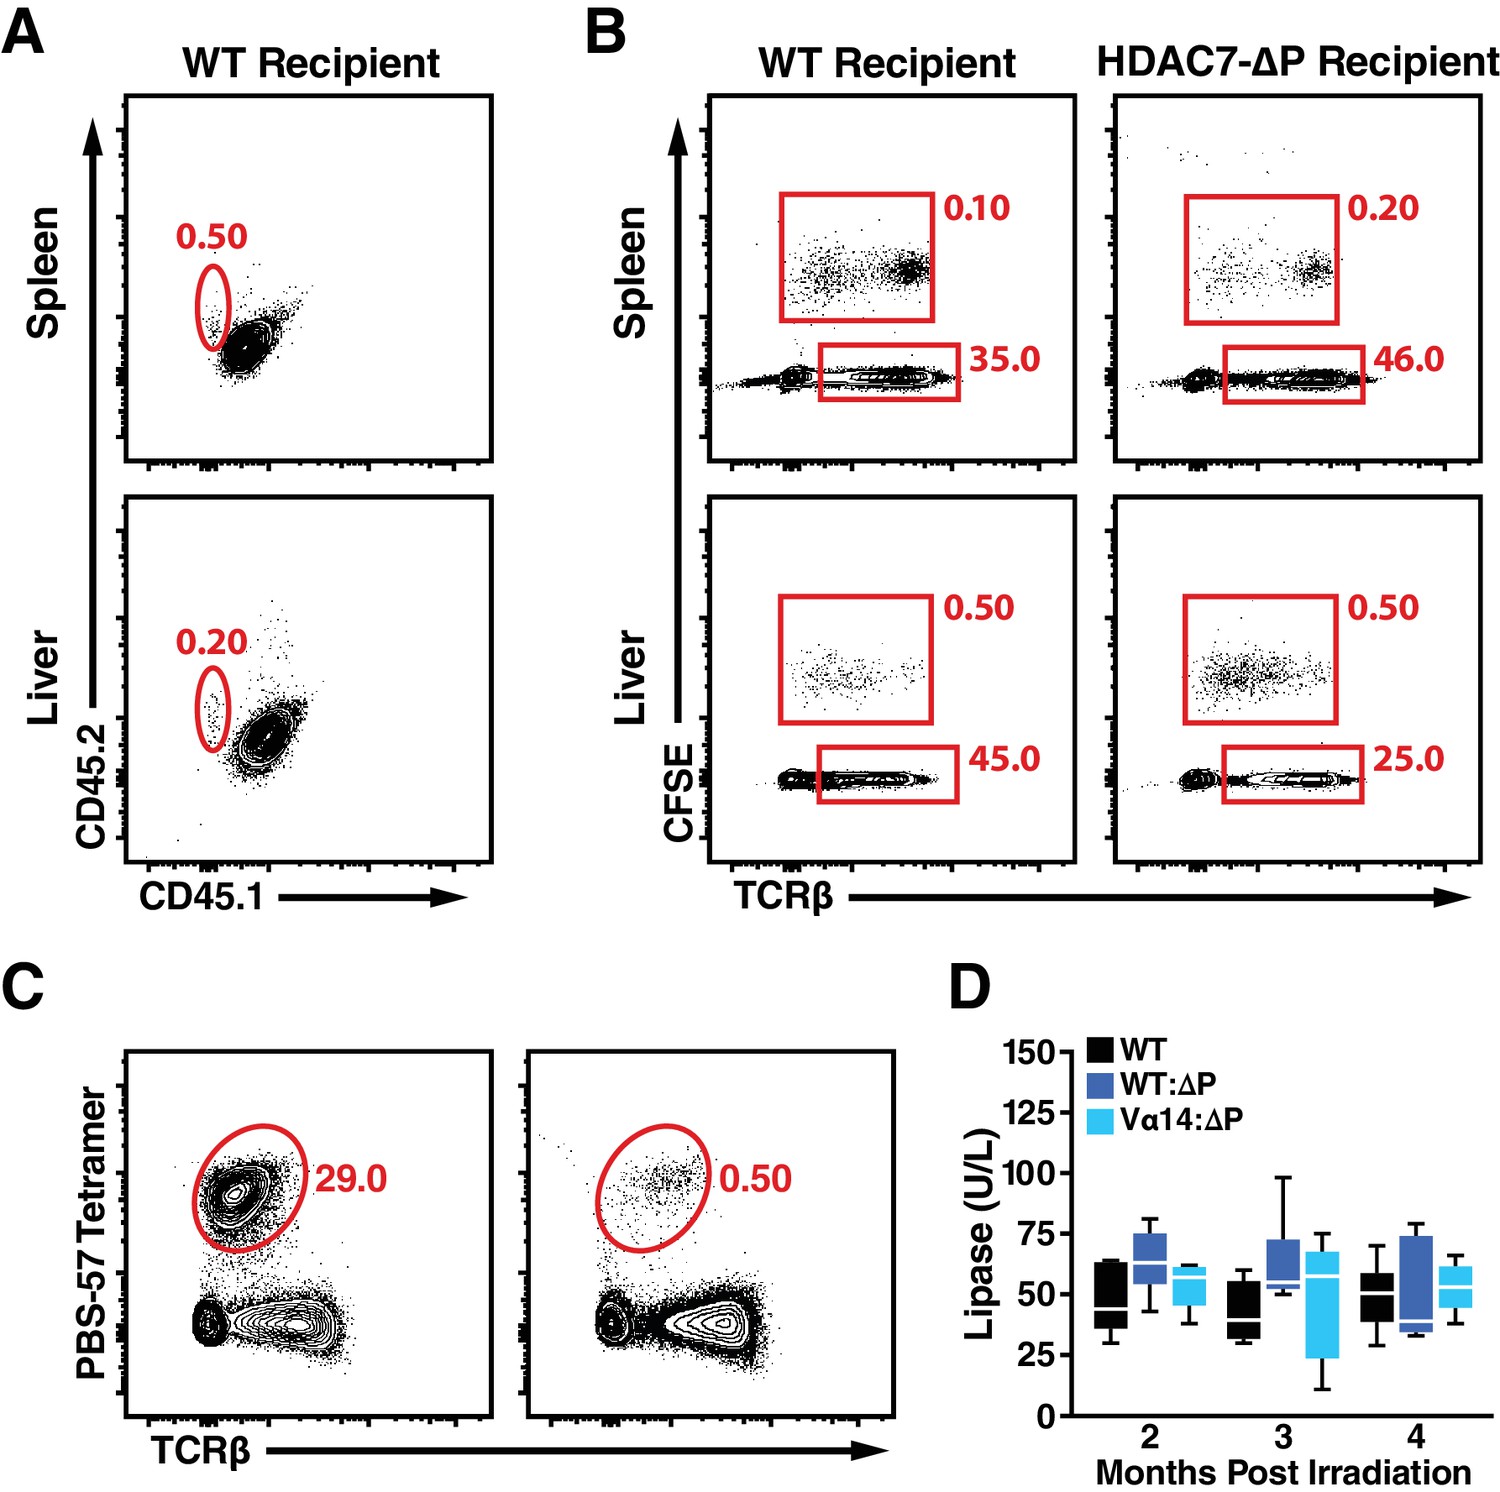
Supporting Data on restoration of iNKTs in HDAC7-ΔP mixed chimeras with Vα14-Jα18 TG bone marrow and autoimmune disease course.
(A) Representative flow scatters showing CD45.1 vs. CD45.2 expression in spleens and livers of WT CD45.1/.2 heterozygote recipients, three days after retro-orbital transfer of 5 × 10⁶ CD45.2 iNKT cells. (B) Identification of CFSE-labeled adoptively transferred T-cells in liver and spleen of WT and HDAC7-ΔP in mice from (A). (C) Representative flow scatter plots showing, TCRβ+, PBS-57 tetramer-reactive cells in Livers of mice from (A). Transferred iNKT cells were isolated from spleens and livers of Vα14-Jα18 transgenic mice and enriched to 85+% before transfer. Data are representative of two independent experiments, N = 3 mice per group total. (D) Plasma concentration of lipase over time in WT mice versus Vα14-Jα18: HDAC7-ΔP and WT: HDAC7-ΔP BM chimeras. Samples were obtained from a subset of the cohorts described in Figure 7D–E, with N = 6 mice per group.
Tables
Key resources table
| Reagent type (species) or resource | Designation | Source or reference | Identifiers | Additional information |
|---|---|---|---|---|
| Gene (Homo sapiens) | Histone Deacetylase 7 (HDAC7) | NA | HDAC7 | Coding sequence used for HDAC7 expression constructs and the HDAC7-ΔP transgene. |
| Gene (Homo sapiens) | Promyelocytic Leukemia, Zinc Finger (PLZF) | NA | ZBTB16 | Coding sequence used for PLZF expression constructs. |
| Strain, strain background (Mus musculus) | C57/BL6 | Jackson Laboratories | Stock Number: 000664 | |
| Strain, strain background (Mus musculus) | Boyj (B6.SJL-Ptprca Pepcb/BoyJ) | Jackson Laboratories; PMID: 11698303 | Stock Number: 002014 | B6 strain congenic for Cd45.1 |
| Genetic reagent (Mus musculus) | Vα14/Jα18 Transgenic, Tg(Cd4-TcraDN32D3)1Aben | Jackson Laboratories; PMID: 18031695 | MGI:4880641 | Vα14/Jα18 Transgenic from Bendelac laboratory |
| Genetic reagent (Mus musculus) | Lck-Cre Transgenic, Tg(Lck-cre)548Jxm | Jackson Laboratories; PMID: 8618846 | MGI: 2176199 | Cre strain for thymicHdac7 deletion |
| Genetic reagent (Mus musculus) | Hdac7flox/flox, Hdac7tm2Eno | Eric Olson, UTSW; PMID: 16873063 | MGI: 1891835 | HDAC7 floxed allele |
| Genetic reagent (Mus musculus) | Hdac7-/+, Hdac7tm1Eno | Eric Olson, UTSW; PMID: 16873063 | MGI: 1891835 | HDAC7 null allele |
| Genetic reagent (Mus musculus) | Lck-PLZF transgenic, C57BL/6-Tg(Cd4-Zbtb16)1797Aben/J | Jackson Laboratories; PMID: 18703361 | MGI:4881493 | PLZF Transgenic strain from Bendelac Laboratory |
| Genetic reagent (Mus musculus) | HDAC7-ΔP Transgenic | Our laboratory; PMID: 23103766 | NA | Transgenic expression of HDAC7-ΔP under control of Lcl proximal promoter/CD2 LCR in C57BL/6 |
| Recombinant DNA reagent | pCDNA 3.1(+) FLAG-HDAC7 FL | this paper | NA | Expression construct for FL FLAG-tagged human HDAC7 |
| Recombinant DNA reagent | pCDNA 3.1(+) FLAG-HDAC7 1–497 | this paper | NA | Expression construct for FLAG-tagged human HDAC7 truncation mutant |
| Recombinant DNA reagent | pCDNA 3.1(+) FLAG-HDAC7 65–497 | this paper | NA | Expression construct for FLAG-tagged human HDAC7 truncation mutant |
| Recombinant DNA reagent | pCDNA 3.1(+) FLAG-HDAC7 120–497 | this paper | NA | Expression construct for FLAG-tagged human HDAC7 truncation mutant |
| Recombinant DNA reagent | pCDNA 3.1(+) FLAG-HDAC7 1–220 | this paper | NA | Expression construct for FLAG-tagged human HDAC7 truncation mutant |
| Recombinant DNA reagent | pCDNA 3.1(+) FLAG-HDAC7 1–180 | this paper | NA | Expression construct for FLAG-tagged human HDAC7 truncation mutant |
| Recombinant DNA reagent | pCDNA 3.1(+) HA-PLZF FL | this paper | NA | Expression construct for FL HA-tagged human PLZF |
| Recombinant DNA reagent | pCDNA 3.1(+) HA-PLZF 1–318 | this paper | NA | Expression construct for HA-tagged human PLZF truncation mutant |
| Recombinant DNA reagent | pCDNA 3.1(+) HA-PLZF 1–405 | this paper | NA | Expression construct for HA-tagged human PLZF truncation mutant |
| Recombinant DNA reagent | pCDNA 3.1(+) HA-PLZF 105–460 | this paper | NA | Expression construct for HA-tagged human PLZF truncation mutant |
| Recombinant DNA reagent | pCDNA 3.1(+) HA-PLZF 280–673 | this paper | NA | Expression construct for HA-tagged human PLZF truncation mutant |
| Recombinant DNA reagent | pCDNA 3.1(+) HA-PLZF 320–673 | this paper | NA | Expression construct for HA-tagged human PLZF truncation mutant |
| Recombinant DNA reagent | pCDNA 3.1(+) HA-PLZF 395–673 | this paper | NA | Expression construct for HA-tagged human PLZF truncation mutant |
| Recombinant DNA reagent | pCDNA 3.1(+) HA-PLZF 455–460 | this paper | NA | Expression construct for HA-tagged human PLZF truncation mutant |
| Recombinant DNA reagent | pCDNA 3.1(+) GAL4-PLZF FL | this paper | NA | Expression construct for GAL4 DNA-binding domain (1-142) fused to full-length PLZF |
| Recombinant DNA reagent | pCDNA 3.1(+) GAL4-PLZF 455–460 | this paper | NA | Expression construct for GAL4 DNA-binding domain (1-142) fused to PLZF1 - 460 truncation mutant |
| Recombinant DNA reagent | pCDNA 3.1(+) GAL4-PLZF 455–460 | this paper | NA | Expression construct for GAL4 DNA-binding domain (1-142) fused to PLZF1 - 318 truncation mutant |
| Software, algorithm | Ingenuity Pathway Analysis | Qiagen | RRID:SCR_008653 | Tool for pathway mapping and other gene ontology analysis from RNAseq transcript abundance data. |
| Software, algorithm | Bowtie 2.0 | Johns Hopkins University; PMID: 22388286 | RRID:SCR_005476 | Tool for aligning raw sequence reads to genome |
| Software, algorithm | SeqMonk | Babraham Institute | RRID:SCR_001913 | Tool for calculating RNA transcript abundances from Bowtie-mapped sequence reads (.SAM files) |
Additional files
-
Supplementary file 1
Excel spreadsheet containing SeqMonk Normalized expression values for all present RNAs in our 18 samples (six genotypes, three biological replicates each, as defined in Materials and methods), with means for each genotype (Columns A-Z), summary statistics for key comparisons (mean, log2 mean/mean, and T-test, Columns AA-AK), and aligned data from relevant published studies (Columns AL-AT).
Additional notes and PMIDs for gene-specific published findings for disease-associated GWAS loci are provided in Columns AY-BA.
- https://doi.org/10.7554/eLife.32109.025
-
Supplementary file 2
Full table of Ingenuity Pathway Analysis overrepresented pathways for the comparison of genes expressed in CD4 SP cells for Vα14Jα18 TG X HDAC7-ΔP TG mice vs Vα14Jα18 TG littermates in spleen and thymus.
- https://doi.org/10.7554/eLife.32109.026
-
Supplementary file 3
Full table of Ingenuity Pathway Analysis predicted upstream regulators and their targets for the comparison of genes expressed in CD4 SP cells for Vα14Jα18 TG X HDAC7-ΔP TG mice vs Vα14Jα18 TG littermates in spleen and thymus.
- https://doi.org/10.7554/eLife.32109.027
-
Transparent reporting form
- https://doi.org/10.7554/eLife.32109.028
Download links
A two-part list of links to download the article, or parts of the article, in various formats.
Downloads (link to download the article as PDF)
Open citations (links to open the citations from this article in various online reference manager services)
Cite this article (links to download the citations from this article in formats compatible with various reference manager tools)
Histone Deacetylase 7 mediates tissue-specific autoimmunity via control of innate effector function in invariant Natural Killer T Cells
eLife 7:e32109.
https://doi.org/10.7554/eLife.32109


