YTH-RNA-binding protein prevents deleterious expression of meiotic proteins by tethering their mRNAs to nuclear foci
- National Institute for Basic Biology, Japan
- Center for Novel Science Initiatives, National Institutes of Natural Sciences, Japan
- School of Life Science, SOKENDAI (The Graduate University for Advanced Studies), Japan
Figures
Figure 1 with 2 supplements
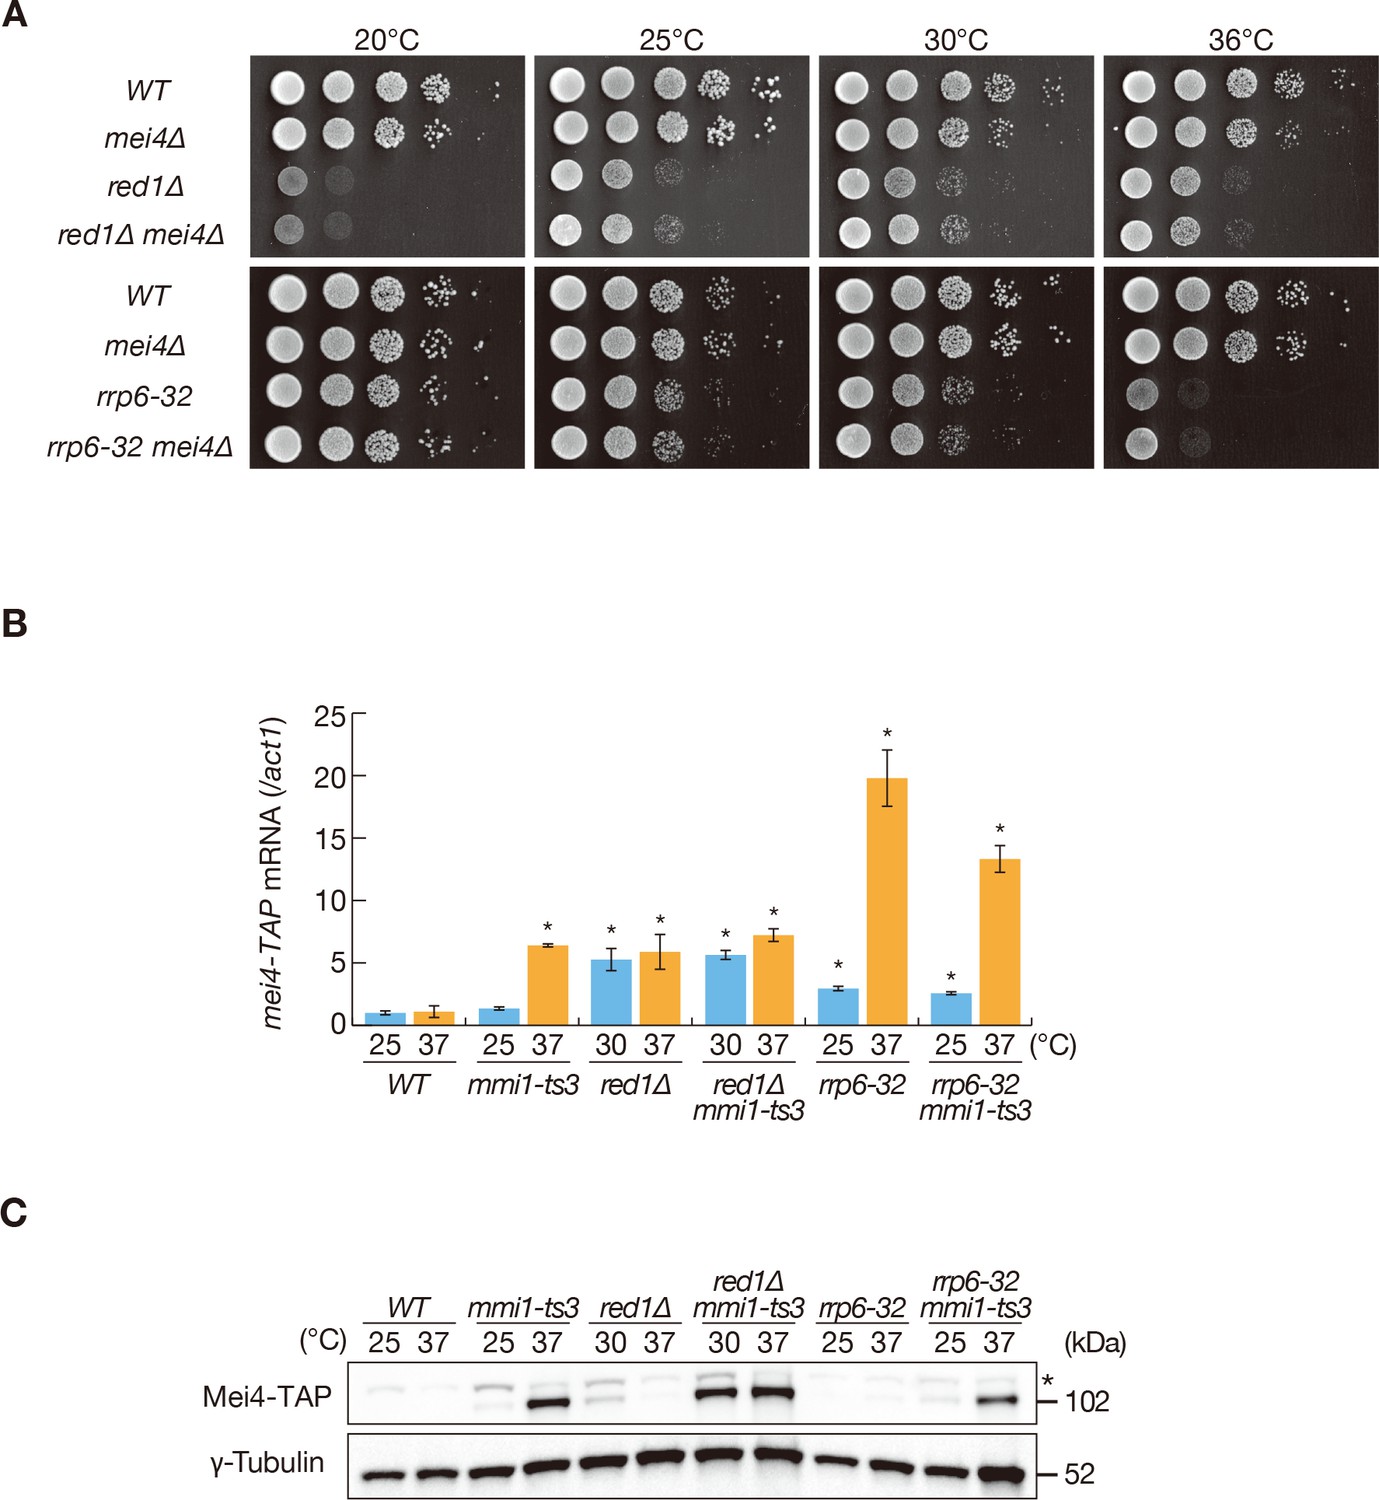
Mmi1 prevents expression of proteins encoded by ectopically accumulated meiotic transcripts.
(A) Growth profiles of red1∆ mei4∆ and rrp6-32 mei4∆ double mutant cells. 10-fold serial dilutions of wild-type (WT), mei4∆, red1∆, red1∆ mei4∆, rrp6-32, and rrp6-32 mei4∆ cells were spotted on YE media and incubated at the indicated temperatures. (B) Expression of mei4-TAP mRNAs in WT, mmi1-ts3, red1∆, red1∆ mmi1-ts3, rrp6-32, and rrp6-32 mmi1-ts3 strains. Cells of WT, mmi1-ts3, rrp6-32, and rrp6-32 mmi1-ts3 expressing mei4-TAP from the endogenous locus were grown at 25°C and shifted to 37°C for 4 hr. Cells of red1∆ and red1∆ mmi1-ts3 were grown at 30°C and shifted to 37°C for 4 hr; this was done because red1∆ cells display cold sensitivity. mei4 transcripts were quantified by quantitative RT-PCR and normalized to act1 encoding actin. Error bars represent standard error from three independent samples. *p<0.05 compared with the wild-type strain at 37°C (Student’s t-test). (C) Expression levels of Mei4-TAP protein in the same conditions as (B). γ-tubulin was used as a loading control. The asterisk indicates non-specific bands.
-
Figure 1—source data 1
Source data relating to Figure 1B and Figure 1—figure supplement 1A.
qRT-PCR analysis for mei4-TAP and ssm4-3GFP mRNAs.
- https://doi.org/10.7554/eLife.32155.005
Figure 1—figure supplement 1
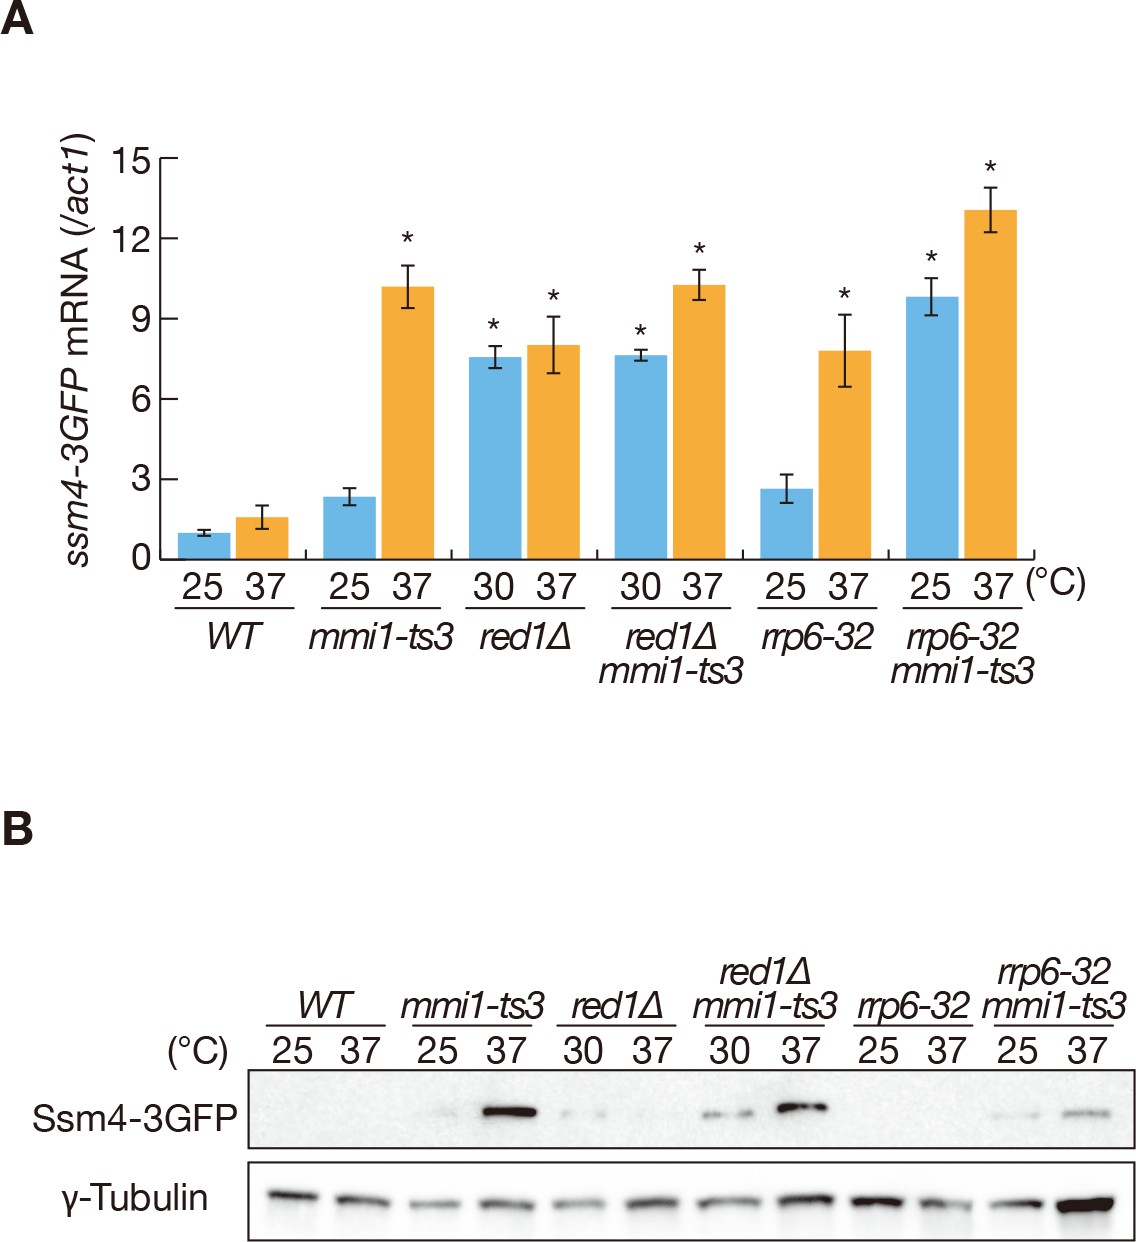
Expression of Ssm4 protein is prevented by Mmi1.
(A) Expression of ssm4-3GFP mRNAs in wild-type (WT), mmi1-ts3, red1∆, red1∆ mmi1-ts3, rrp6-32, and rrp6-32 mmi1-ts3 strains. Cells of WT, mmi1-ts3, rrp6-32, and rrp6-32 mmi1-ts3 expressing ssm4-3GFP from the endogenous locus were grown at 25°C and shifted to 37°C for 4 hr. Cells of red1∆ and red1∆ mmi1-ts3 were grown at 30°C and shifted to 37°C for 4 hr. ssm4 transcripts were quantified by quantitative RT-PCR and normalized to act1 encoding actin. Error bars represent standard error from three independent samples. *p<0.05 compared with the wild-type strain at 37°C (Student’s t-test). (B) Expression levels of Ssm4-3GFP protein in the same conditions as (A). γ-tubulin was used as a loading control.
Figure 1—figure supplement 2
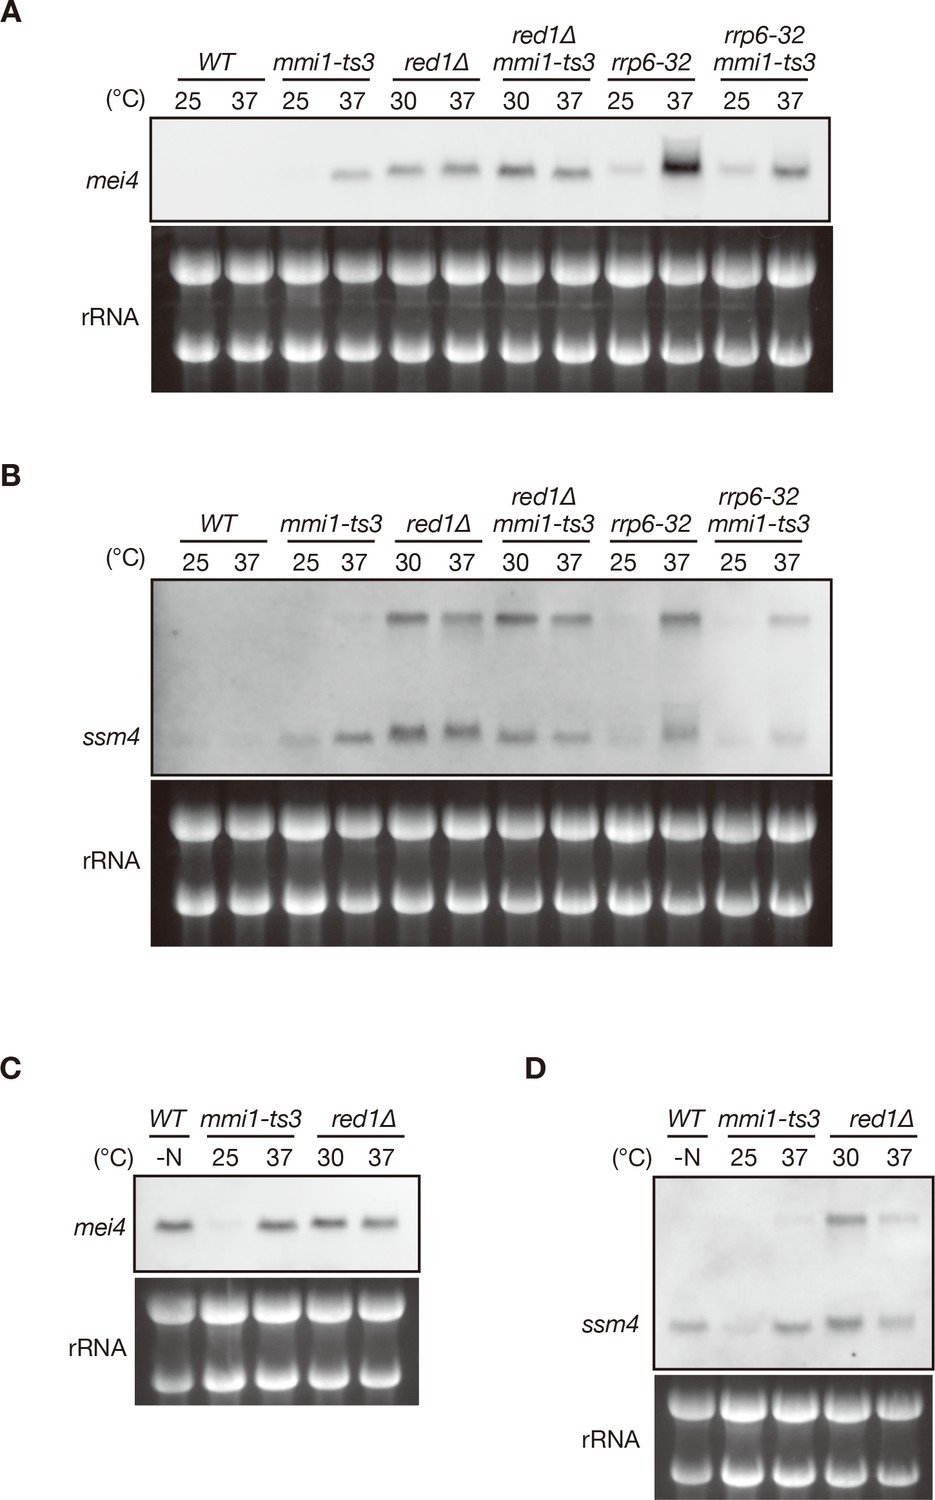
DSR-containing meiotic transcripts are accumulated when Mmi1-mediated RNA degradation is impaired.
(A, B) Expression of mei4 and ssm4 transcripts in wild-type (WT), mmi1-ts3, red1∆, red1∆ mmi1-ts3, rrp6-32, and rrp6-32 mmi1-ts3 strains. Cells of WT, mmi1-ts3, rrp6-32, and rrp6-32 mmi1-ts3 were grown at 25°C and shifted to 37°C for 4 hr. Cells of red1∆ and red1∆ mmi1-ts3 were grown at 30°C and shifted to 37°C for 4 hr. Transcripts were analyzed by northern blot analysis using a DNA probe for mei4 (A) or ssm4 (B). rRNA stained with ethidium bromide was used as a loading control. (C, D) Comparison of mei4 (C) and ssm4 (D) transcripts in meiotic WT, mmi1-ts3, and red1∆ cells. WT cells were grown at 30°C up to mid-log phase and shifted to nitrogen-depleted medium for 4 hr. The same samples as in (A, B) were used for mmi1-ts3 and red1∆ cells.
Figure 2 with 1 supplement
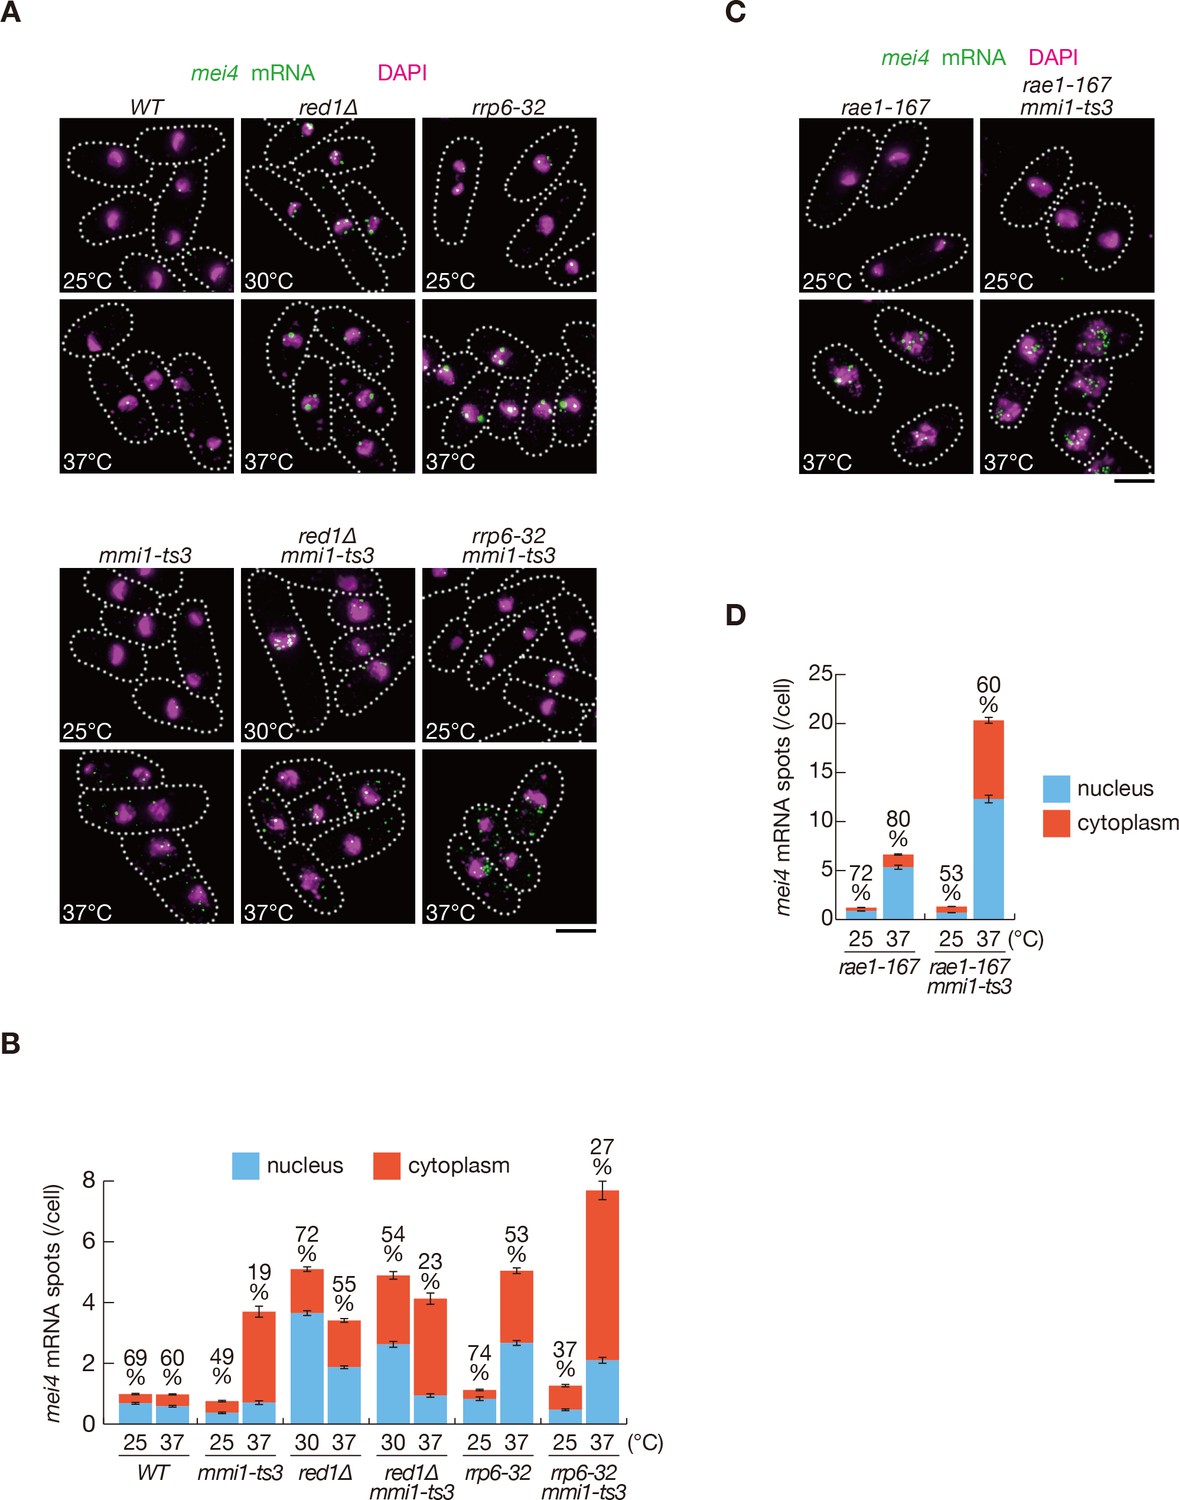
Meiotic mRNAs are accumulated in the nucleus depending on Mmi1.
(A) Localization of mei4 mRNAs in wild-type (WT), red1∆, rrp6-32, mmi1-ts3, red1∆ mmi1-ts3, and rrp6-32 mmi1-ts3 strains. Cells of WT, rrp6-32, mmi1-ts3, and rrp6-32 mmi1-ts3 were grown at 25°C and shifted to 37°C for 4 hr. Cells of red1∆ and red1∆ mmi1-ts3 were grown at 30°C and shifted to 37°C for 4 hr. Single-molecule FISH detected mei4 mRNAs (green). Nuclear DNA was stained with DAPI (magenta). Dotted lines indicate the shape of cells. Scale bar: 5 µm. (B) Quantification of mei4 mRNA localization in cells shown in (A). Number of nuclear (blue) and cytoplasmic (red) signals from each cell was measured. The mean ±standard error of mean from more than 100 cells is shown. Percentages of mei4 mRNAs in the nucleus are shown above. (C) Localization of mei4 mRNAs in rae1-167 and rae1-167 mmi1-ts3 strains. Cells were grown at 25°C and shifted to 37°C for 4 hr. Single-molecule FISH detected mei4 mRNAs (green). Nuclear DNA was stained with DAPI (magenta). Dotted lines indicate the shape of cells. Scale bar: 5 µm. (D) Quantification of mei4 mRNA localization in cells shown in (C). Number of nuclear (blue) and cytoplasmic (red) signals of each cell was measured. The mean ±standard error of mean from more than 100 cells is shown. Percentages of mei4 mRNAs in the nucleus are shown above.
-
Figure 2—source data 1
Source data relating to Figure 2B,D and Figure 2—figure supplement 1B,D.
Quantification of smFISH for mei4 and ssm4 mRNA.
- https://doi.org/10.7554/eLife.32155.008
Figure 2—figure supplement 1
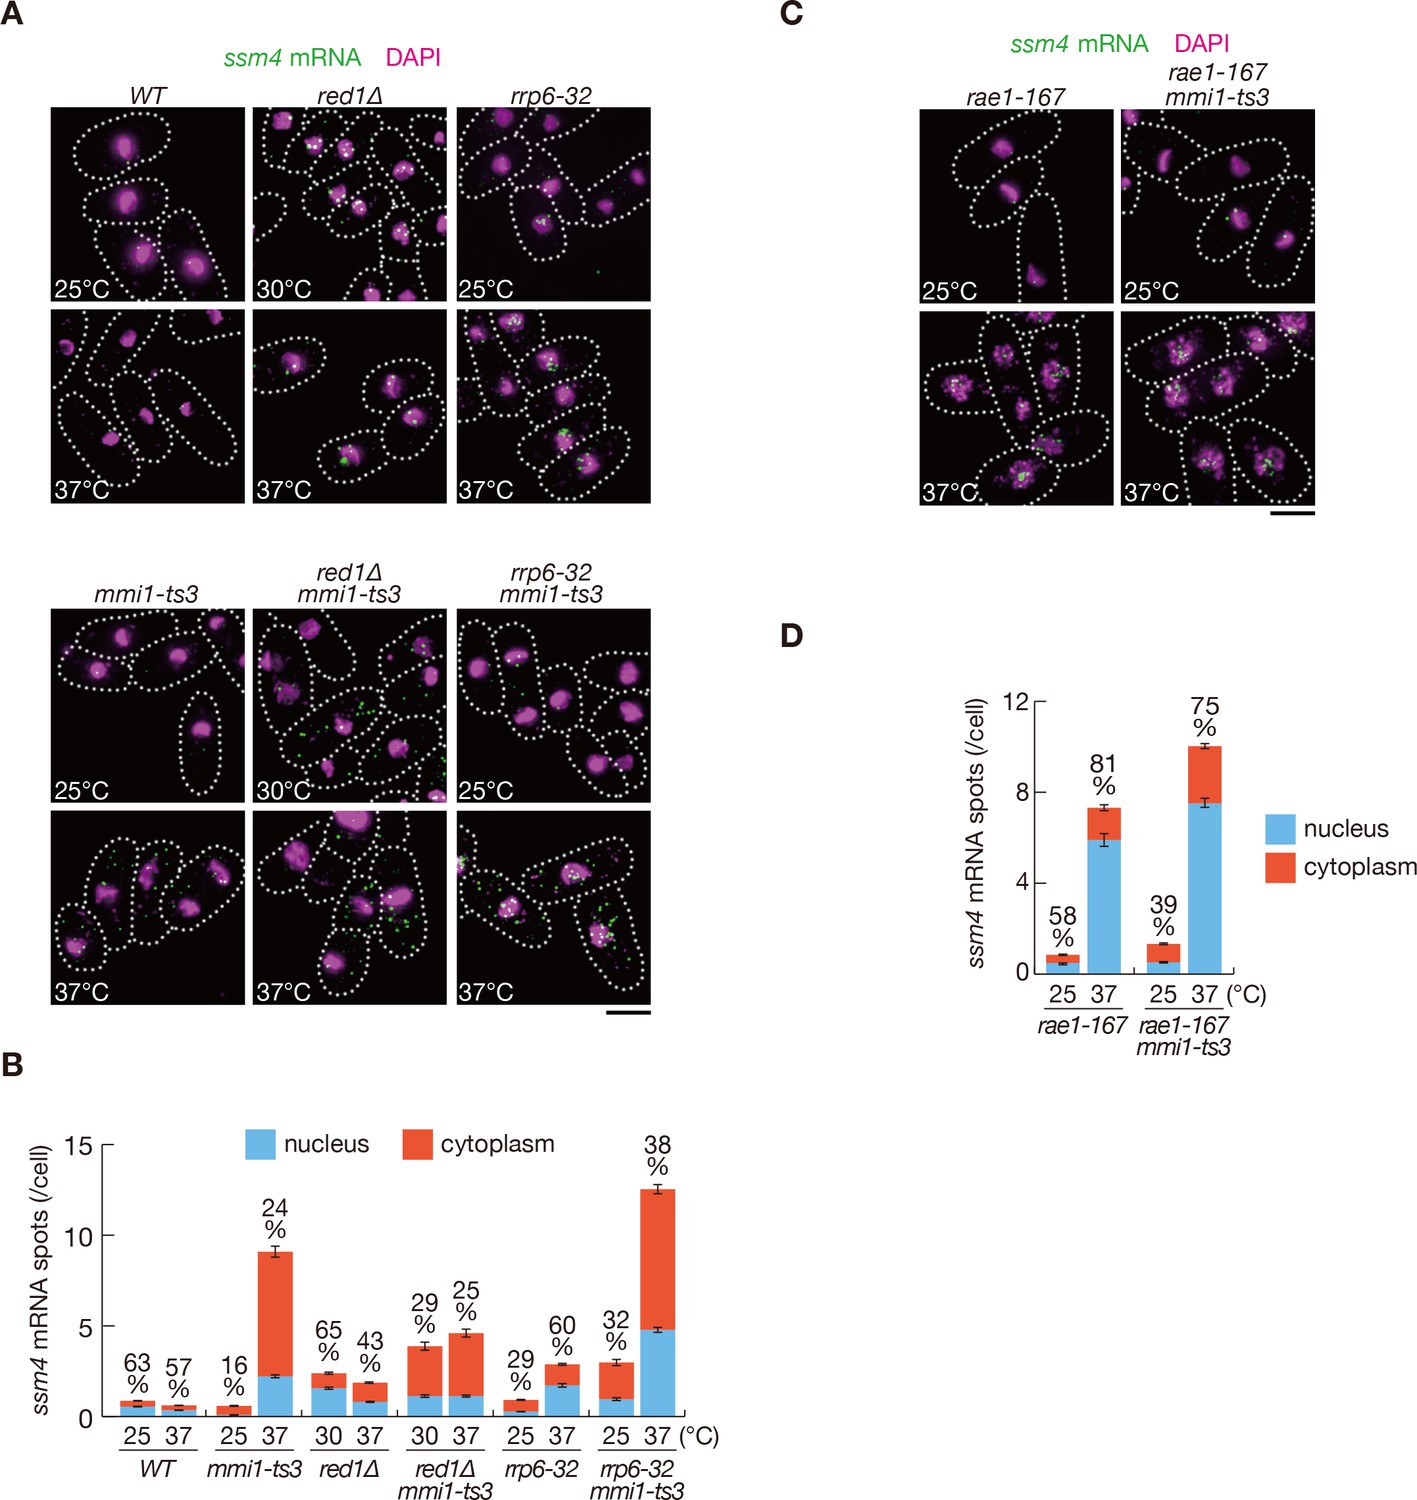
ssm4 mRNAs are accumulated in the nucleus, dependent on Mmi1.
(A) Localization of ssm4 mRNAs in wild-type (WT), red1∆, rrp6-32, mmi1-ts3, red1∆ mmi1-ts3, and rrp6-32 mmi1-ts3 strains. Cells of WT, rrp6-32, mmi1-ts3, and rrp6-32 mmi1-ts3 were grown at 25°C and shifted to 37°C for 4 hr. Cells of red1∆ and red1∆ mmi1-ts3 were grown at 30°C and shifted to 37°C for 4 hr. Single-molecule FISH detected ssm4 mRNAs (green). Nuclear DNA was stained with DAPI (magenta). Dotted lines indicate the shape of cells. Scale bar: 5 µm. (B) Quantification of ssm4 mRNA localization in cells shown in (A). Number of nuclear (blue) and cytoplasmic (red) signals of each cell was measured. The mean ±standard error of mean from more than 100 cells is shown. Percentages of ssm4 mRNAs in the nucleus are shown above. (C) Localization of ssm4 mRNAs in rae1-167 and rae1-167 mmi1-ts3 strains. Cells were grown at 25°C and shifted to 37°C for 4 hr. Single-molecule FISH detected ssm4 mRNAs (green). Nuclear DNA was stained with DAPI (magenta). Dotted lines indicate the shape of cells. Scale bar: 5 µm. (D) Quantification of ssm4 mRNA localization in cells shown in (C). Number of nuclear (blue) and cytoplasmic (red) signals of each cell was measured. The mean ± standard error of mean from more than 100 cells is shown. Percentages of ssm4 mRNAs in the nucleus are shown above.
Figure 3 with 2 supplements
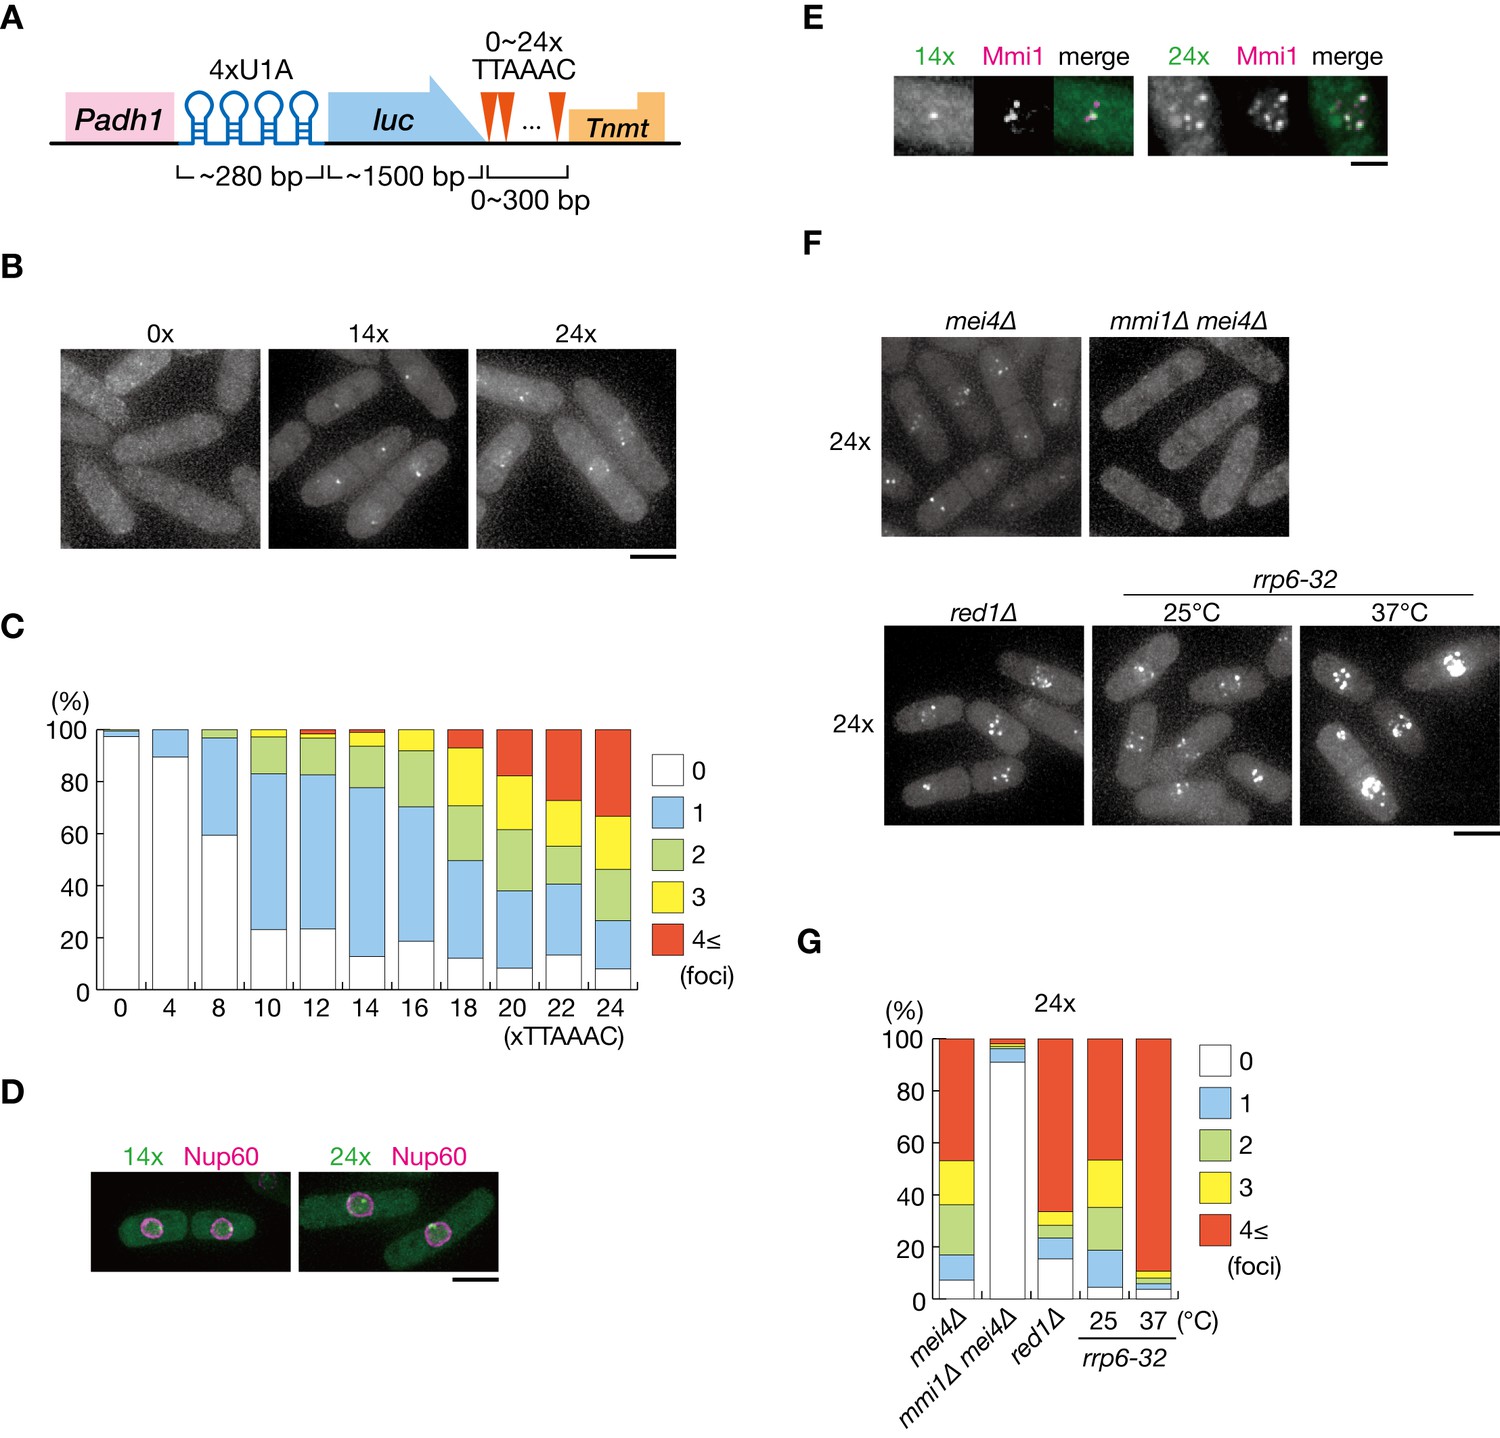
DSR-containing transcripts form Mmi1-dependent nuclear foci.
(A) Schematic of the DSR-containing reporter gene composed of the adh1 promoter, 4x U1A tag, the luciferase ORF, 0–24 copies of the DSR motif (TTAAAC), and the nmt1 terminator. RNA was visualized by coexpressing U1A-YFP. (B) Localization of reporter transcripts carrying 0, 14, and 24 copies of the DSR motif in wild-type cells. Scale bar: 5 µm. (C) Percentages of cells containing 1, 2, 3, or 4 and more reporter transcripts foci (n > 100). (D) Localization of reporter transcripts carrying 14 and 24 copies of the DSR motif (green) and the nucleoporin Nup60 (magenta) in wild-type cells. Scale bar: 5 µm. (E) Localization of reporter transcripts with 14 and 24 copies of the DSR motif (green) and Mmi1 (magenta) in wild-type cells. Images of the nuclear region are shown. Scale bar: 2 µm. (F) Localization of reporter transcripts with 24 copies of the DSR motif in mei4∆, mmi1∆ mei4∆, red1∆, and rrp6-32 strains. mei4∆, mmi1∆ mei4∆, and red1∆ cells were grown at 30°C. rrp6-32 cells were grown at 25°C and then shifted to 37°C for 4 hr. Scale bar: 5 µm. (G) Percentages of cells containing 1, 2, 3, or 4 and more reporter transcript foci with 24 copies in mei4∆, mmi1∆ mei4∆, red1∆, and rrp6-32 strains (n > 100).
-
Figure 3—source data 1
Source data relating to Figure 3C,G, and Figure 3—figure supplement 2B.
Quantification of cells containing 1, 2, 3, or 4 and more reporter transcript foci.
- https://doi.org/10.7554/eLife.32155.012
Figure 3—figure supplement 1

DSR-containing transcripts form intranuclear foci.
(A) Expression of reporter transcripts in wild-type cells. Transcripts were analyzed by northern blot analysis using a DNA probe for U1A. rRNA stained with ethidium bromide was used as a loading control. (B) Localization of reporter transcripts carrying 4, 8, 10, 12, 16, 18, 20, and 22 copies of the DSR motif in wild-type cells. Scale bar: 5 µm.
Figure 3—figure supplement 2
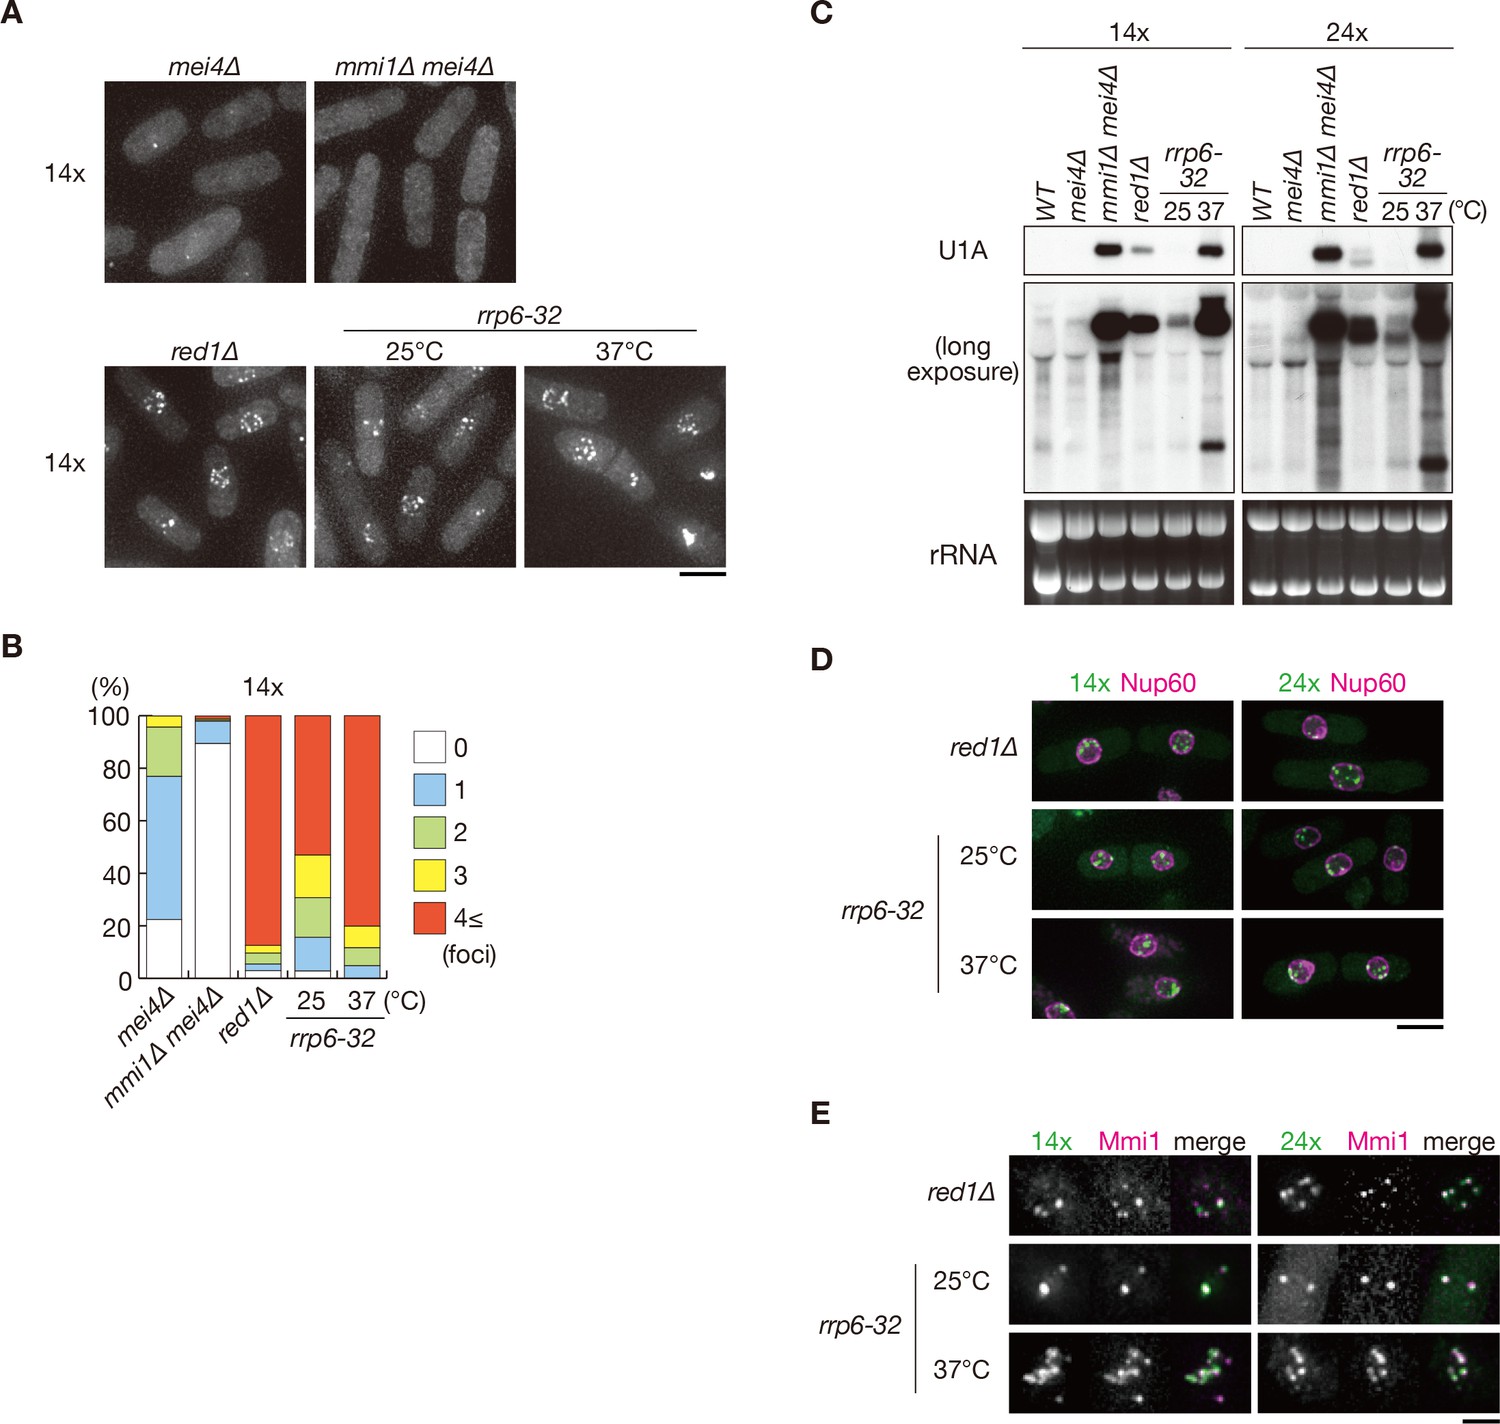
Foci formation of DSR transcripts is dependent on Mmi1, but not on Red1 or Rrp6.
(A) Localization of reporter transcripts with 14 copies of the DSR motif in mei4∆, mmi1∆ mei4∆, red1∆ and rrp6-32 strains. mei4∆, mmi1∆ mei4∆, and red1∆ cells were grown at 30°C. rrp6-32 cells were grown at 25°C and then shifted to 37°C for 4 hr. Scale bar: 5 µm. (B) Percentages of cells containing 1, 2, 3, or 4 and more reporter transcript foci with 14 copies in mei4∆, mmi1∆ mei4∆, red1∆, and rrp6-32 strains (n > 100). (C) Expression of reporter transcripts with 14 and 24 copies of the DSR motif in wild-type (WT), mei4∆, mmi1∆ mei4∆, red1∆, and rrp6-32 strains in the same conditions as (A). Transcripts were analyzed by northern blot analysis using a DNA probe for U1A. rRNA stained with ethidium bromide was used as a loading control. (D) Localization of reporter transcripts carrying 14 and 24 copies of the DSR motif (green) and the nucleoporin Nup60 (magenta) in red1∆ and rrp6-32 cells in the same conditions as (A). Scale bar: 5 µm. (E) Localization of reporter transcripts with 14 and 24 copies of the DSR motif (green) and Mmi1 (magenta) in red1∆ and rrp6-32 cells in the same conditions as (A). Images of the nuclear region are shown. Scale bar: 2 µm.
Figure 4 with 1 supplement
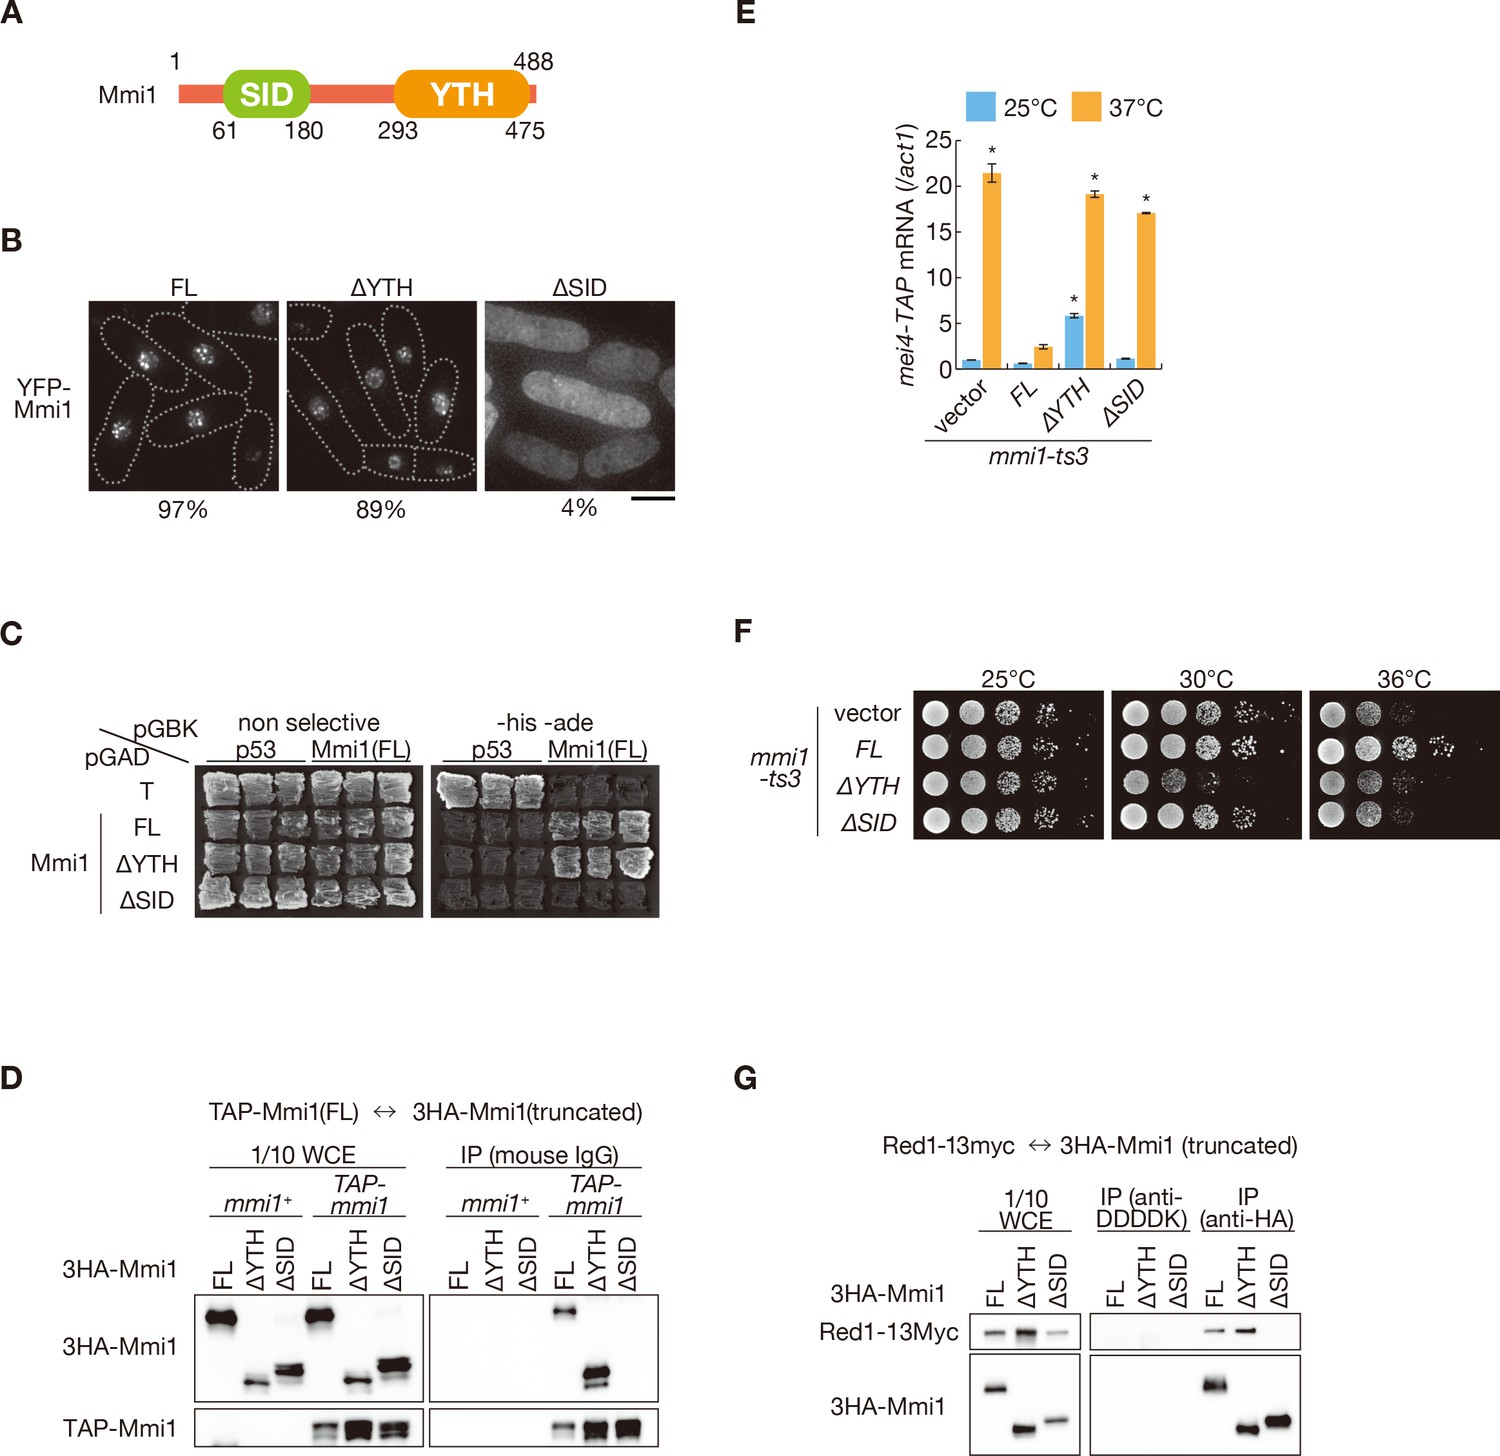
Mmi1 interacts with itself through the N-terminal SID region.
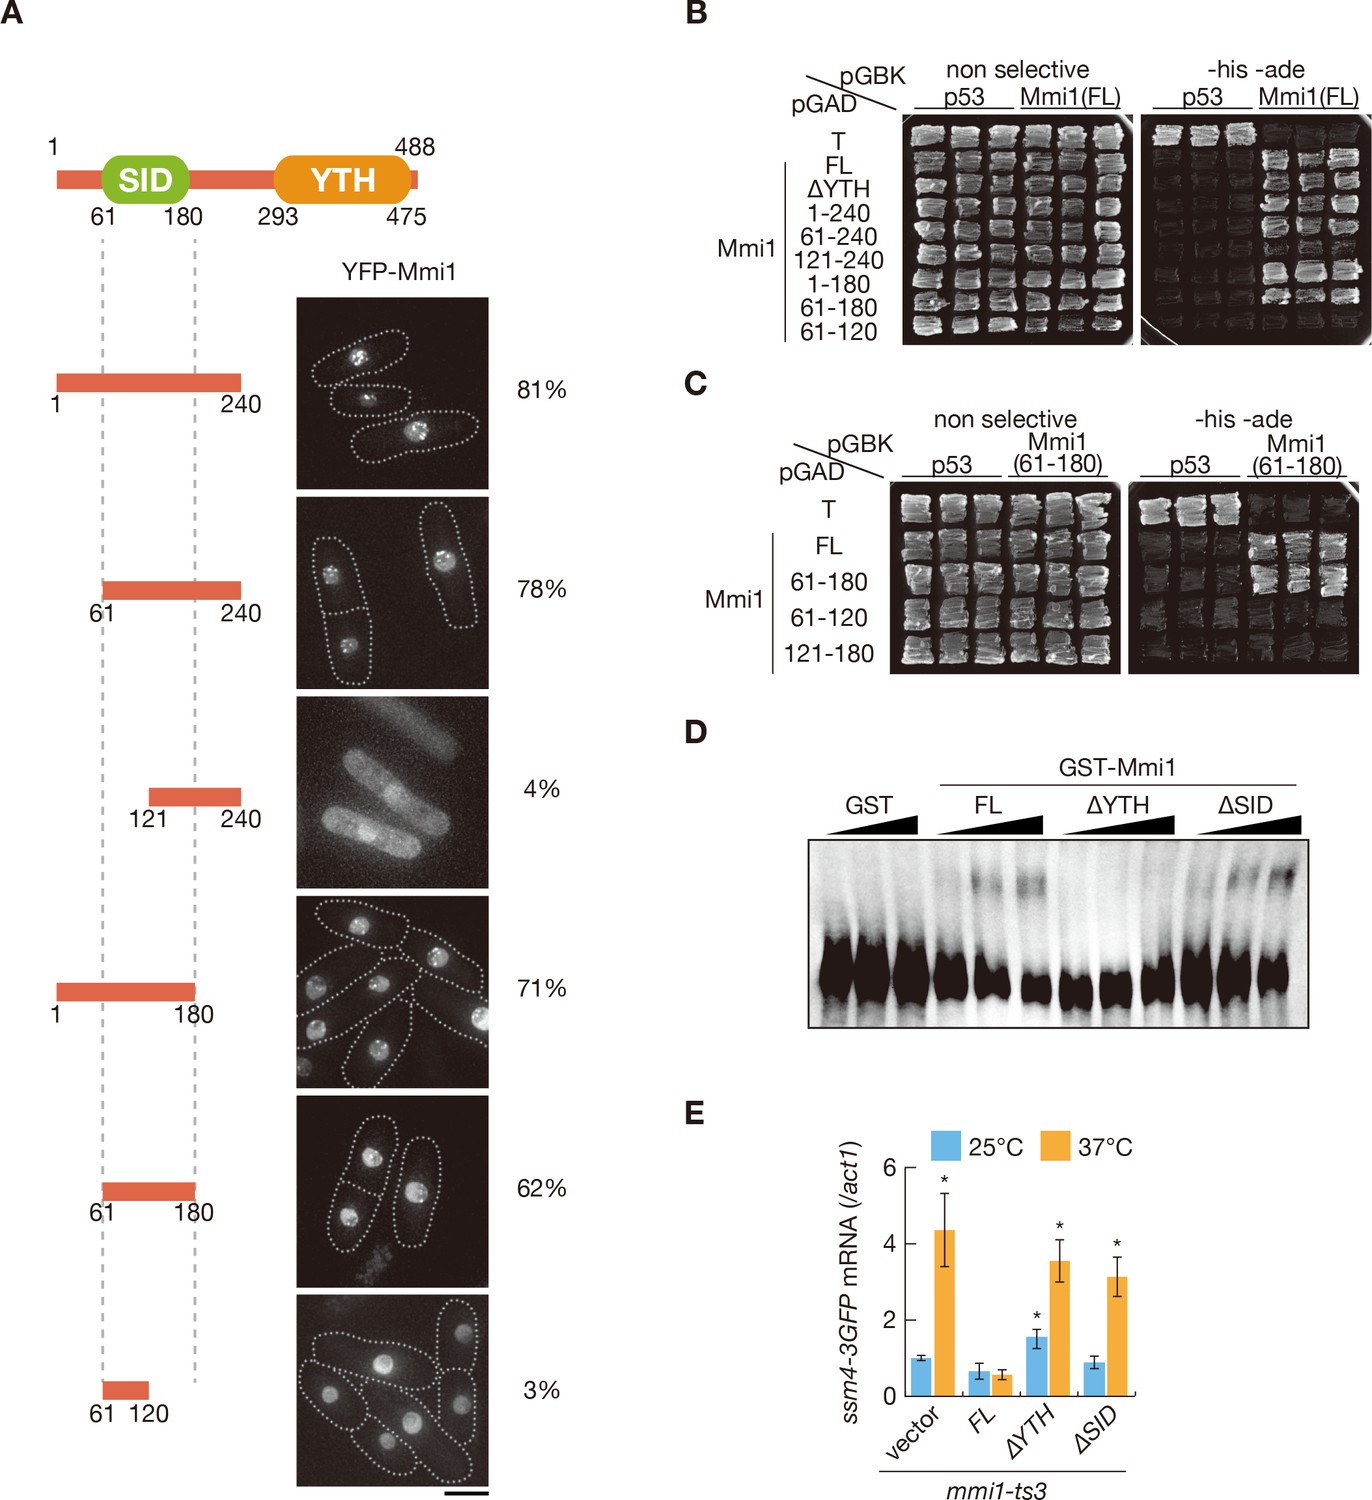
(A) Schematic of the structure of Mmi1. (B) Localization of full-length Mmi1 and Mmi1 lacking the YTH domain or the SID region. YFP-tagged full-length or truncated Mmi1 was expressed from the plasmid with a mild promoter. Frequencies of cells carrying nuclear Mmi1 foci are indicated below (n > 100). Dotted lines indicate the shape of cells. Scale bar: 5 µm. (C) Two-hybrid interaction of full-length Mmi1 with truncated Mmi1. p53 and T antigen were used as controls. (D) Mmi1 self-interaction in wild-type cells. Cell extracts prepared from wild-type cells expressing TAP-tagged full-length Mmi1 and HA-tagged full-length or truncated Mmi1 were subjected to immunoprecipitation. Precipitates and 1/10 cell extracts were then immunoblotted. (E) Expression of mei4-TAP mRNAs was analyzed by quantitative RT-PCR in mmi1-ts3 cells expressing full-length Mmi1, Mmi1-∆YTH, or Mmi1-∆SID. mmi1-ts3 cells were grown at 25°C and then shifted to 37°C for 4 hr. mei4 transcripts were quantified and normalized to act1. Error bars represent standard error from three independent samples. *p<0.05 compared with cells expressing full-length Mmi1 at 37°C (Student’s t-test). (F) Growth profiles of mmi1-ts3 cells expressing Mmi1 lacking YTH or lacking SID. 10-fold serial dilutions of mmi1-ts3 cells expressing full-length Mmi1, Mmi1-∆YTH, and Mmi1-∆SID from the plasmid were spotted on MM media and incubated at the indicated temperatures. (G) Interaction of Mmi1-∆YTH and Mmi1-∆SID with Red1. Cell extracts prepared from wild-type cells expressing HA-tagged full-length Mmi1, Mmi1-∆YTH or Mmi1-∆SID, and Myc-tagged Red1 were subjected to immunoprecipitation with an anti-HA antibody. An anti-DDDDK antibody was used as negative control. Precipitates and 1/10 cell extracts were then immunoblotted.
-
Figure 4—source data 1
Source data relating to Figure 4E and Figure 4—figure supplement 1E.
qRT-PCR analysis for mei4-TAP and ssm4-3GFP mRNAs in mmi1-ts3 cells expressing full-length Mmi1, Mmi1-∆YTH, or Mmi1-∆SID.
- https://doi.org/10.7554/eLife.32155.015
Figure 4—figure supplement 1
The N-terminal SID region is essential for Mmi1 self-interaction.
(A) Localization of N-terminal fragments of Mmi1. Each YFP-tagged fragment was expressed from the plasmid with a mild promoter. Frequencies of cells carrying nuclear foci are indicated below (n > 100). Dotted lines indicate the shape of cells. Scale bar: 5 µm. (B) Two-hybrid interaction of full-length Mmi1 with full-length Mmi1, Mmi1-∆YTH, and the N-terminal fragments. p53 and T antigen were used as controls. (C) Two-hybrid interaction of SID (residues 61–180) with full-length Mmi1 and the N-terminal fragments. (D) Electrophoretic mobility shift assay for the binding of GST-Mmi1, GST-Mmi1 lacking YTH, and GST-Mmi1 lacking SID to the DSR region of mei4. A bacterially purified GST-Mmi1 variant (0.3, 3, 30 nM) or GST alone (30 nM) was incubated with DIG-labeled RNA probes of mei4 DSR (0.1 nM) transcribed in vitro. (E) Expression level of ssm4-3GFP mRNAs was analyzed by quantitative RT-PCR in mmi1-ts3 cells expressing full-length Mmi1, Mmi1-∆YTH or Mmi1-∆SID. mmi1-ts3 cells were grown at 25°C and then shifted to 37°C for 4 hr. ssm4 transcripts were quantified and normalized to act1. Error bars represent standard error from three independent samples. *p<0.05 compared with cells expressing full-length Mmi1 at 37°C (Student’s t-test).
Figure 5 with 3 supplements
Mmi1 self-interaction is crucial for nuclear retention of DSR-containing transcripts and prevention of their protein expression.
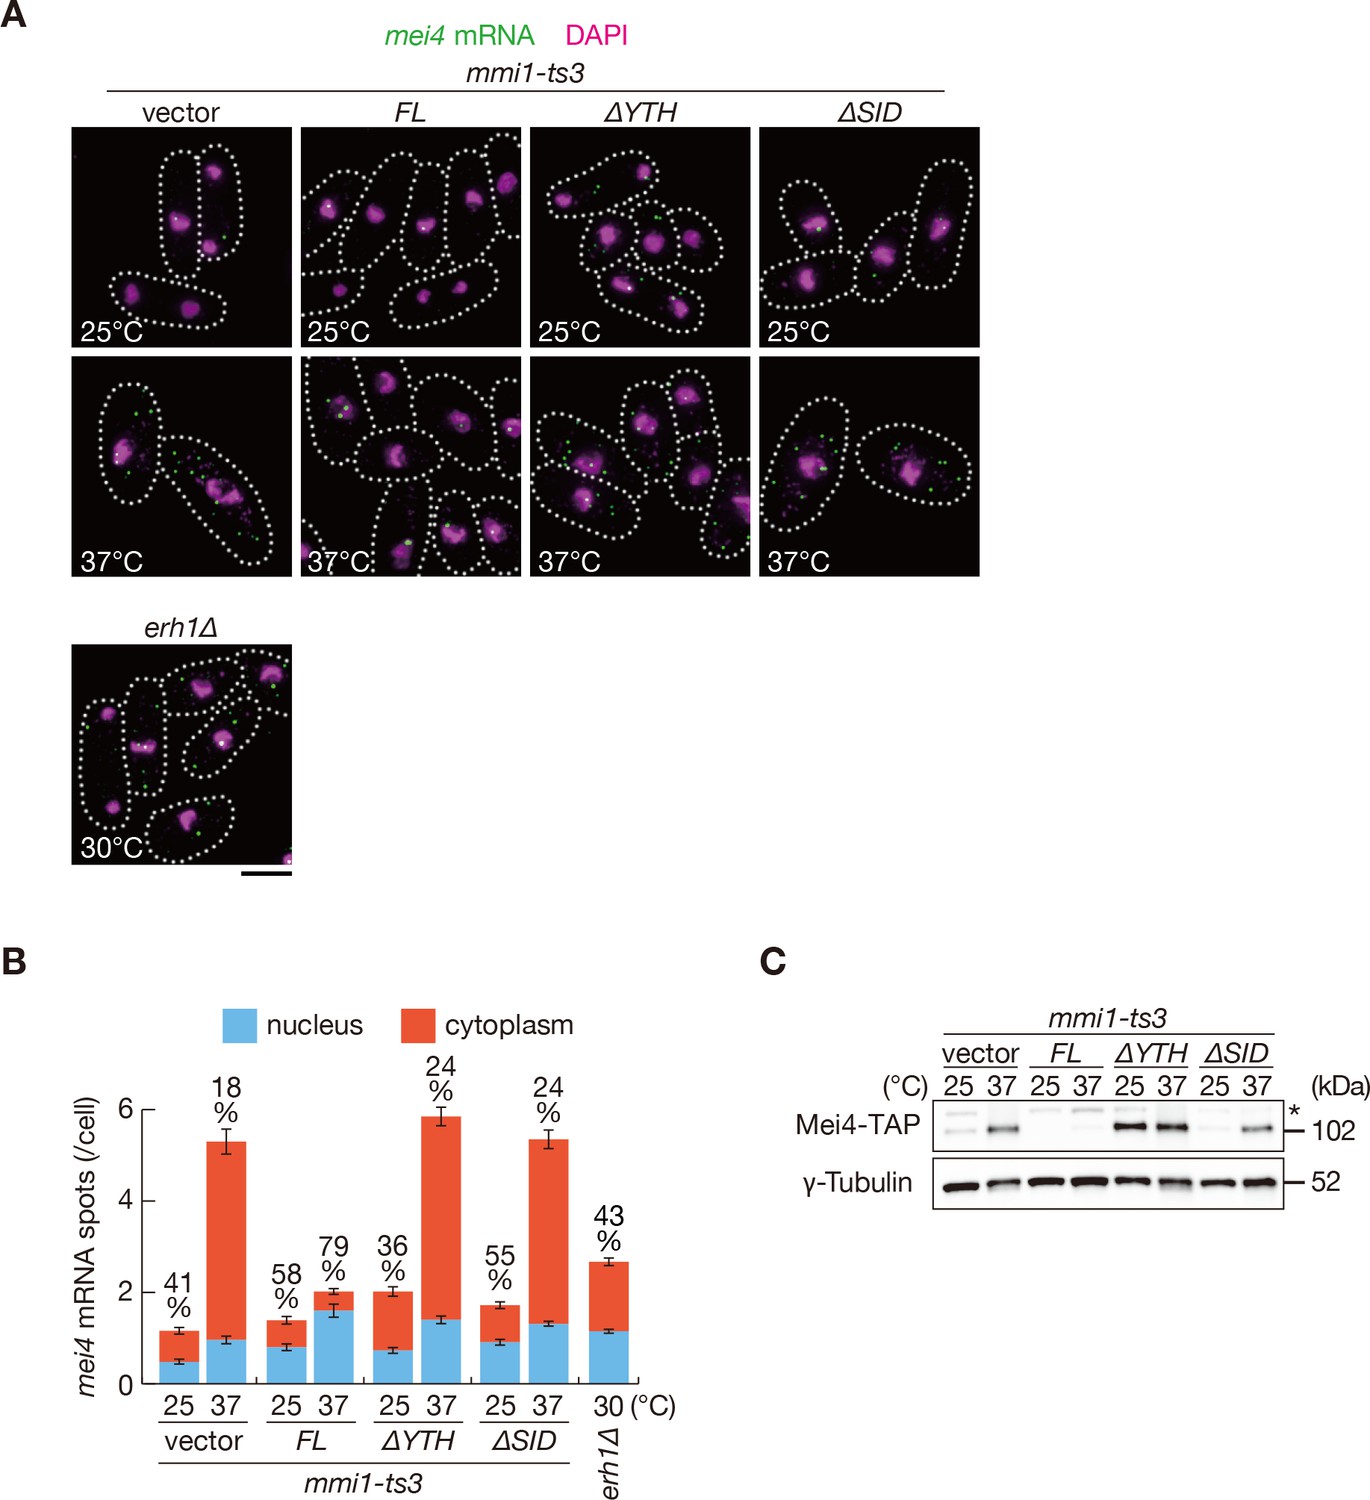
(A) Localization of mei4 mRNAs in mmi1-ts3 cells expressing full-length Mmi1, Mmi1-∆YTH, or Mmi1-∆SID from the plasmid, and in erh1∆ cells. mmi1-ts3 cells were grown at 25°C and then shifted to 37°C for 4 hr. erh1∆ cells were grown at 30°C. Single molecule FISH detected mei4 mRNAs (green). Nuclear DNA was stained with DAPI (magenta). Dotted lines indicate the shape of cells. Scale bar: 5 µm. (B) Quantification of mei4 mRNA localization in cells shown in (A). Number of nuclear (blue) and cytoplasmic (red) signals from each cell was measured. The mean ±standard error of mean from more than 100 cells is shown. Percentages of mei4 mRNAs in the nucleus are shown above. (C) Expression levels of Mei4-TAP protein in mmi1-ts3 cells expressing full-length Mmi1, Mmi1-∆YTH, or Mmi1-∆SID. mmi1-ts3 cells were grown at 25°C and then shifted to 37°C for 4 hr. γ-Tubulin was used as a loading control. The asterisk indicates non-specific bands.
-
Figure 5—source data 1
Source data relating to Figure 5B and Figure 5—figure supplement 1B, 2B.
Quantification of smFISH for mei4 and ssm4 mRNA in mmi1-ts3 cells expressing full-length Mmi1, Mmi1-∆YTH, or Mmi1-∆SID, and in erh1∆ cells and quantification of cells containing 1, 2, 3, or 4 and more reporter transcript foci in mmi1∆ mei4∆ cells expressing Mmi1 variants and in erh1∆ cells.
- https://doi.org/10.7554/eLife.32155.020
Figure 5—figure supplement 1
The N-terminal SID region is required for nuclear retention of ssm4 mRNAs.
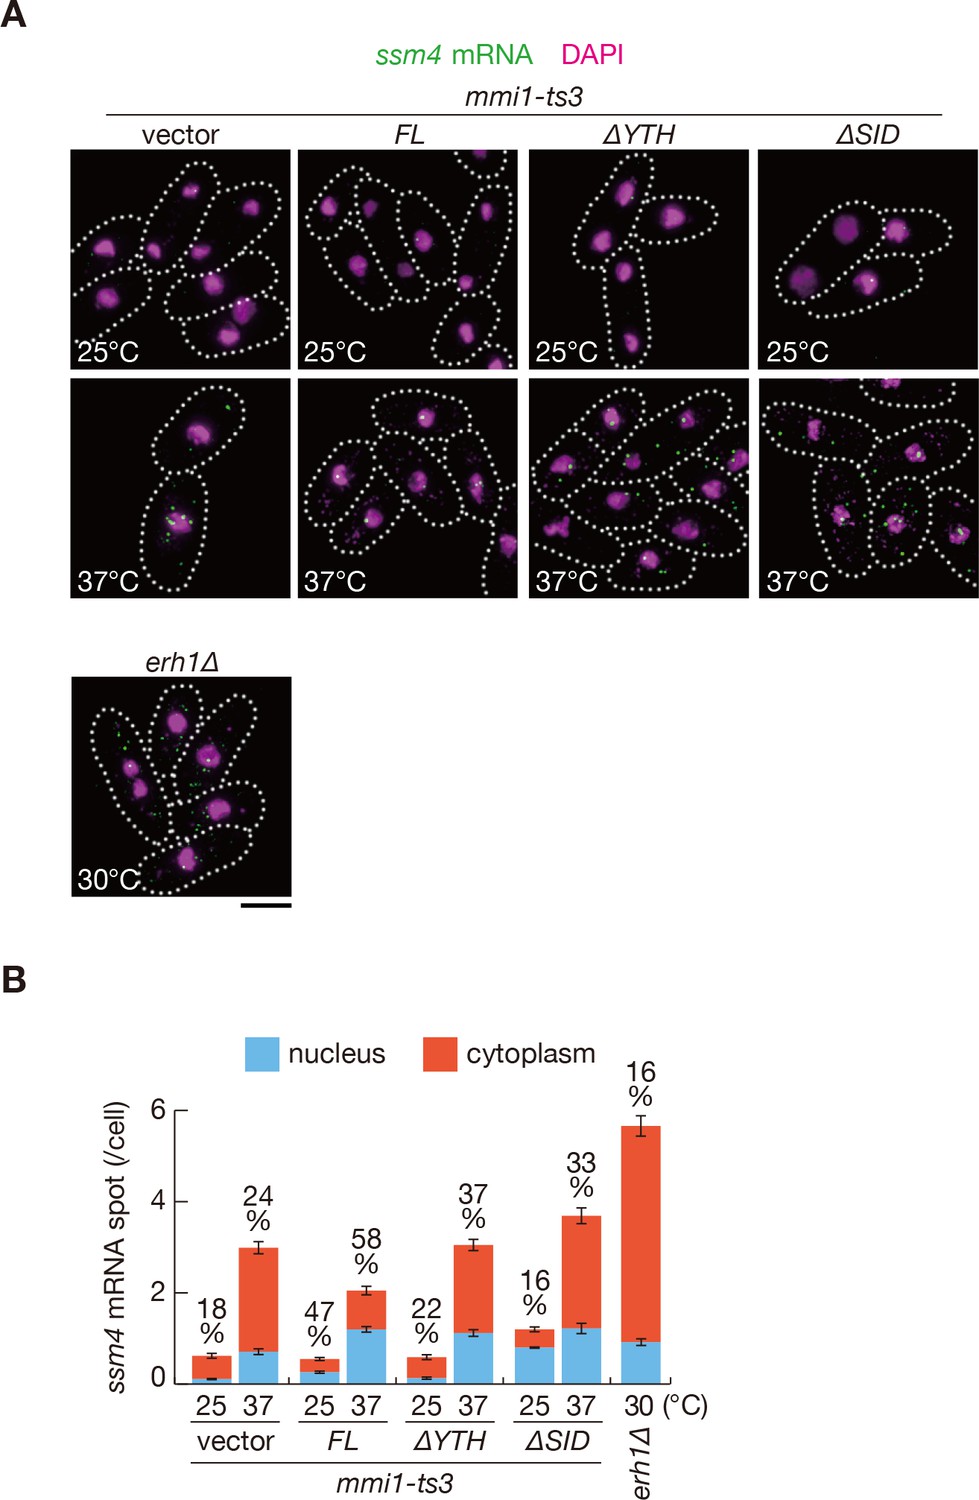
(A) Localization of ssm4 mRNAs in mmi1-ts3 cells expressing full-length Mmi1, Mmi1-∆YTH, or Mmi1-∆SID from the plasmid, and in erh1∆ cells expressing full-length Mmi1 from the endogenous locus. mmi1-ts3 cells were grown at 25°C and then shifted to 37°C for 4 hr. erh1∆ cells were grown at 30°C. Single-molecule FISH detected ssm4 mRNAs (green). Nuclear DNA was stained with DAPI (magenta). Dotted lines indicate the shape of cells. Scale bar: 5 µm. (B) Quantification of ssm4 mRNA localization in cells shown in (A). The number of nuclear (blue) and cytoplasmic (red) signals of each cell was measured. The mean ±standard error of mean from more than 100 cells is shown. Percentages of ssm4 mRNAs in the nucleus are shown above.
Figure 5—figure supplement 2
DSR-containing transcripts form nuclear foci through the Mmi1 self-interaction.
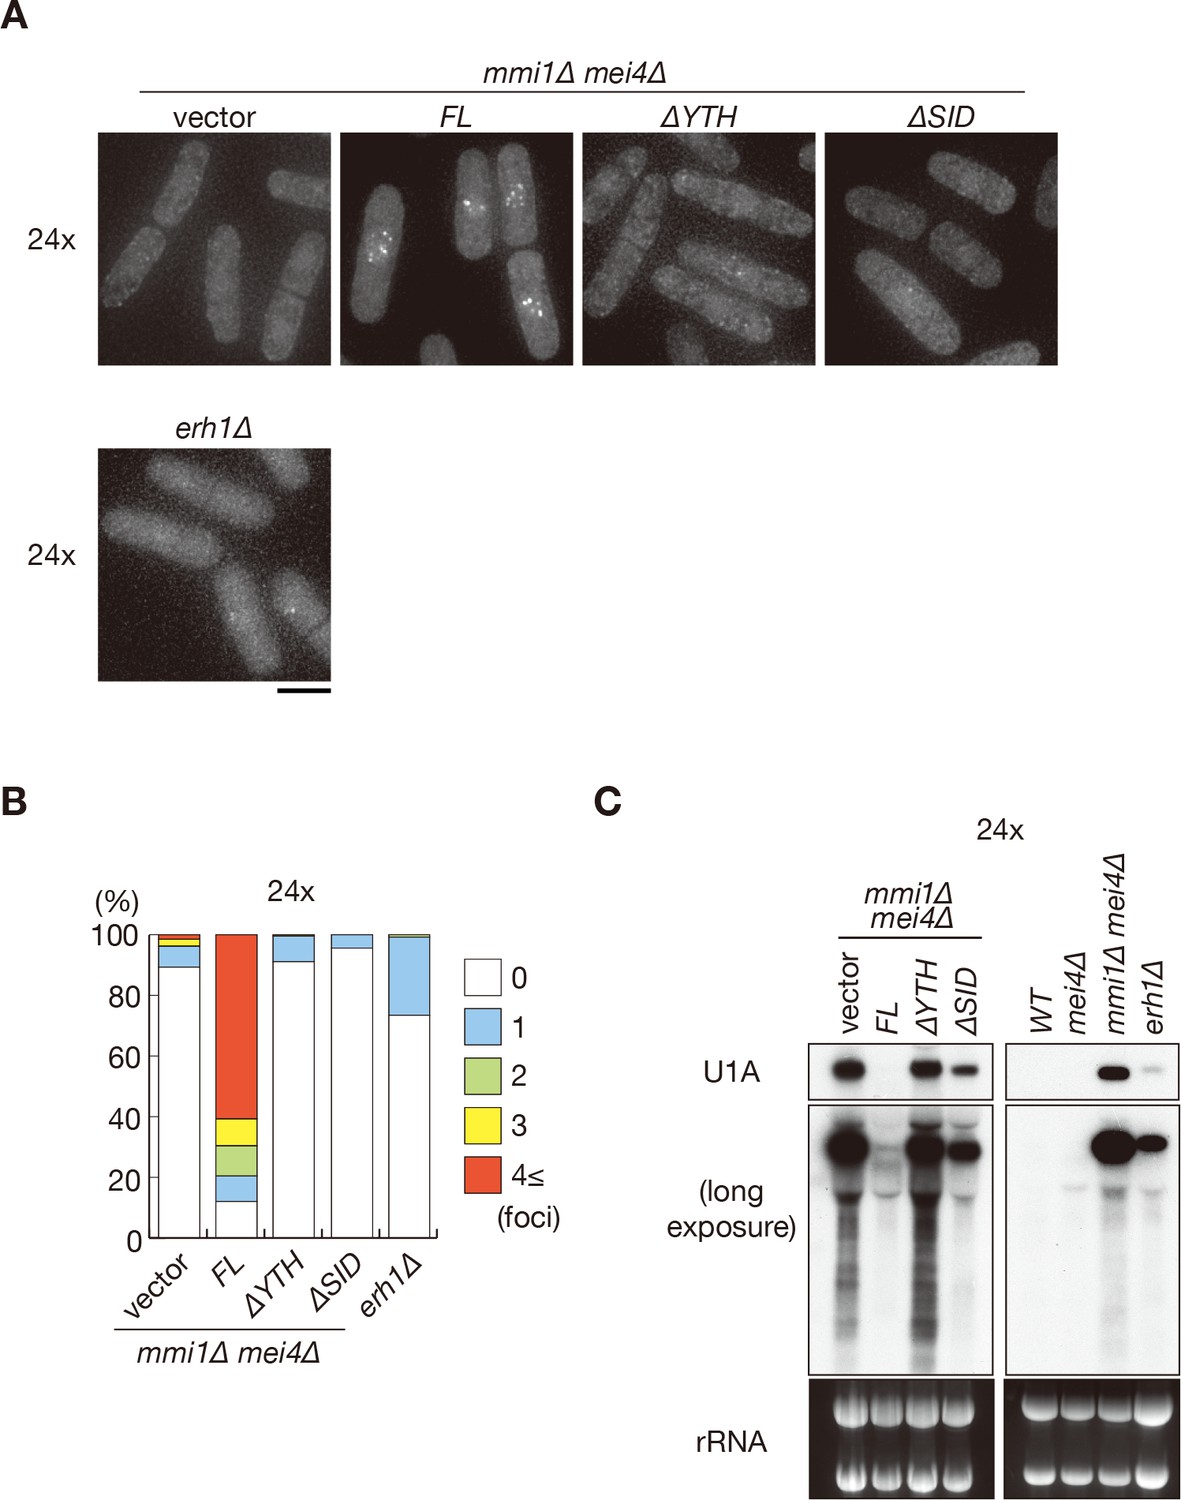
(A) Localization of reporter transcripts carrying 24 copies of the DSR motif in mmi1∆ mei4∆ cells expressing full-length Mmi1, Mmi1-∆YTH, or Mmi1-∆SID from the plasmid, and in erh1∆ cells expressing full-length Mmi1 from the endogenous locus. Scale bar: 5 µm. (B) Percentages of cells containing 1, 2, 3, or 4 and more foci of reporter transcripts in mmi1∆ mei4∆ cells expressing Mmi1 variants and in erh1∆ cells (n > 100). (C) Expression of reporter transcripts with 24 copies of the DSR motif in mmi1∆ mei4∆ cells expressing Mmi1 variants and in wild-type (WT), mei4∆, mmi1∆ mei4∆, and erh1∆ strains. Transcripts were analyzed by northern blot analysis by using a DNA probe for U1A. rRNA stained with ethidium bromide was used as a loading control.
Figure 5—figure supplement 3
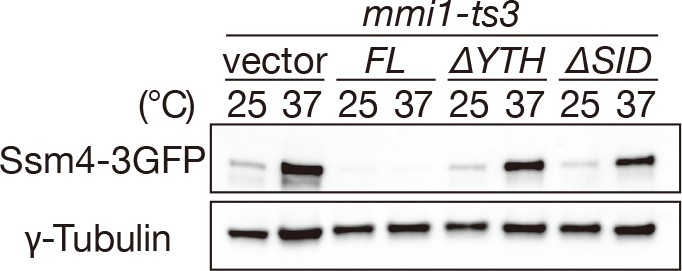
Mmi1 self-interaction is crucial for prevention of Ssm4 protein expression.
Expression levels of Ssm4-3GFP protein in mmi1-ts3 cells expressing full-length Mmi1, Mmi1-∆YTH or Mmi1-∆SID. mmi1-ts3 cells were grown at 25°C and then shifted to 37°C for 4 hr. γ-tubulin was used as a loading control.
Figure 6 with 2 supplements
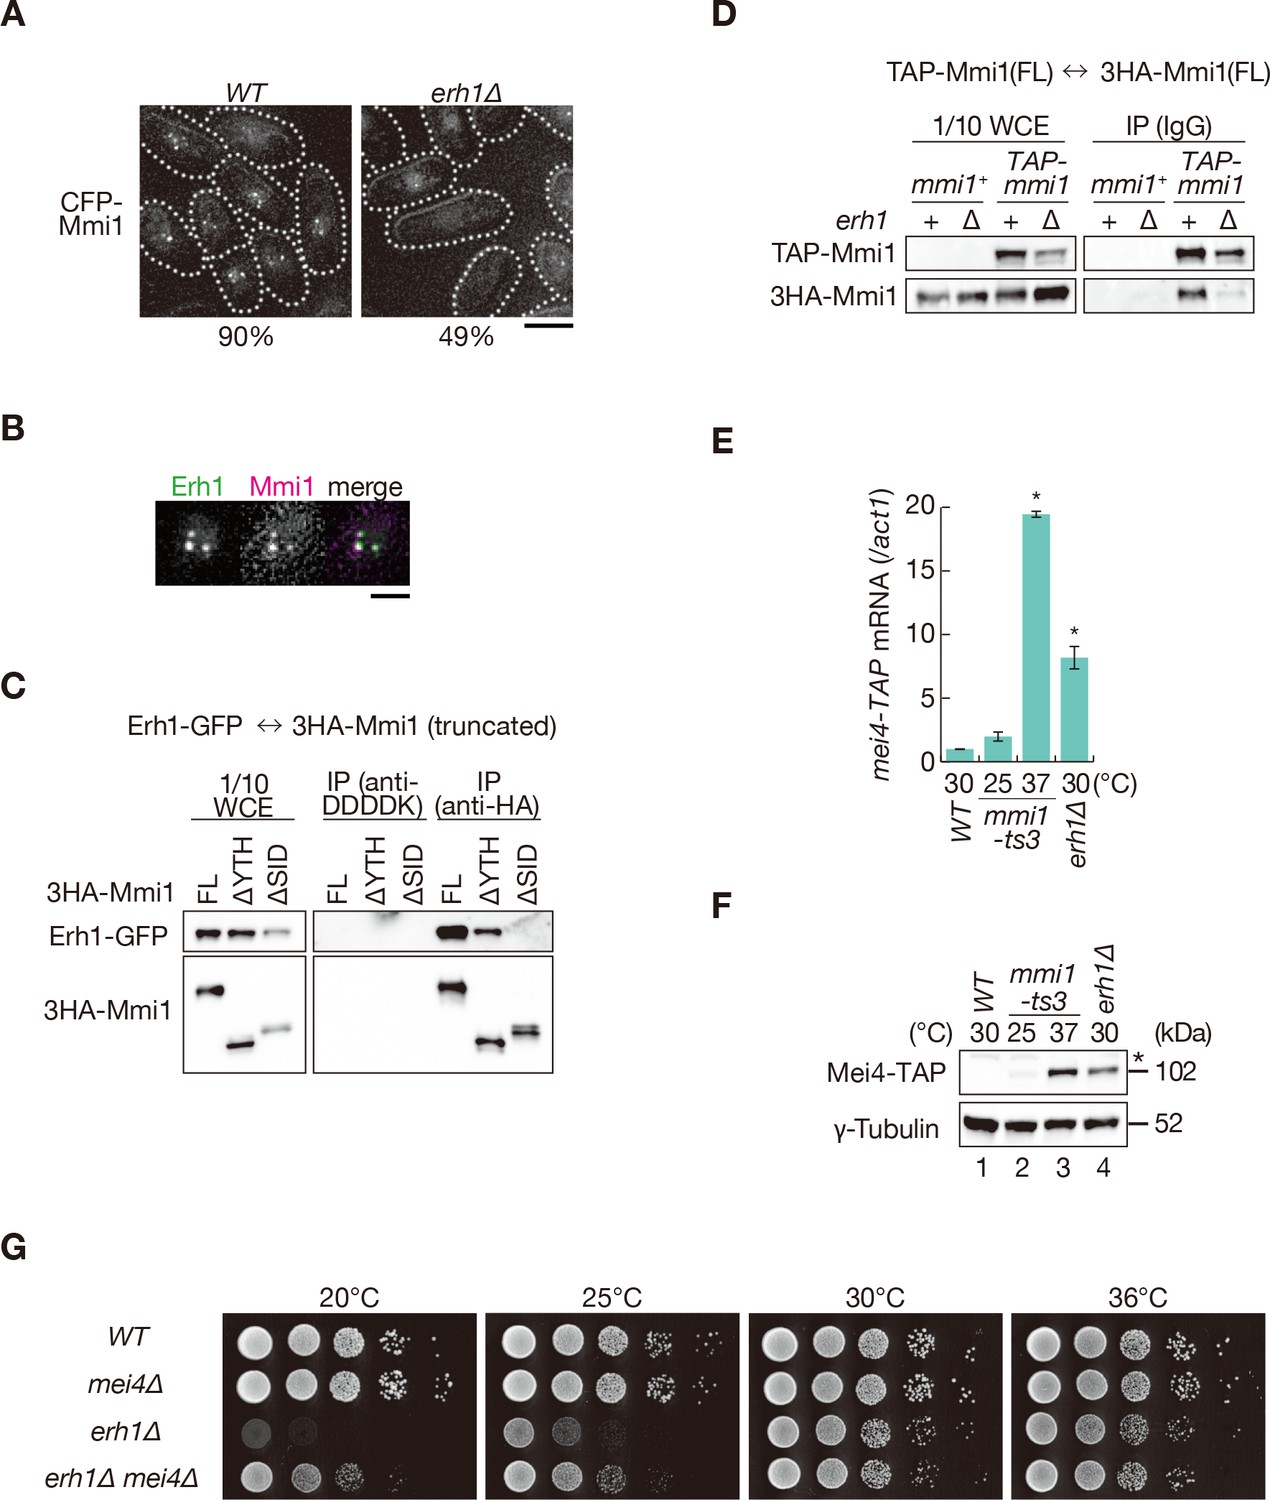
Mmi1 interacts with itself with the assistance of Erh1.
(A) Localization of Mmi1 in erh1∆ cells. Frequencies of cells carrying nuclear Mmi1 foci are indicated below (n > 100). Dotted lines indicate the shape of cells. Scale bar: 5 µm. (B) Localization of YFP-tagged Erh1 expressed from the endogenous locus (green) and CFP-Mmi1 (magenta) in wild-type cells. Images of the nuclear region are shown. Scale bar: 2 µm. (C) Interaction of Mmi1-∆YTH and Mmi1-∆SID with Erh1. Cell extracts prepared from wild-type cells expressing HA-tagged full-length Mmi1, Mmi1-∆YTH or Mmi1-∆SID, and GFP-tagged Erh1 were subjected to immunoprecipitation with an anti-HA antibody. An anti-DDDDK antibody was used as negative control. Precipitates and 1/10 cell extracts were then immunoblotted. (D) Mmi1 self-interaction in erh1∆ cells. Cell extracts prepared from wild-type and erh1∆ cells expressing TAP-tagged Mmi1 and HA-tagged Mmi1 were subjected to immunoprecipitation. Precipitates and 1/10 cell extracts were then immunoblotted. (E) Expression of mei4-TAP mRNAs was analyzed by quantitative RT-PCR in erh1∆ cells. Wild-type (WT) and erh1∆ cells were grown at 30°C. mmi1-ts3 cells were grown at 25°C and then shifted to 37°C for 4 hr. *p<0.05 compared with the wild type strain (Student’s t-test). (F) Expression levels of Mei4-TAP protein in the same conditions as (E). γ-tubulin was used as a loading control. The asterisk indicates non-specific bands. (G) Growth profiles of erh1∆ mei4∆ double mutant cells. 10-fold serial dilutions of wild-type, mei4∆, erh1∆, and erh1∆ mei4∆ cells were spotted on YE media and incubated at the indicated temperatures.
-
Figure 6—source data 1
Source data relating to Figure 6E and Figure 6—figure supplement 1D.
qRT-PCR analysis for mei4-TAP and ssm4-3GFP mRNAs in WT, mmi1-ts3, and erh1∆ cells.
- https://doi.org/10.7554/eLife.32155.024
Figure 6—figure supplement 1
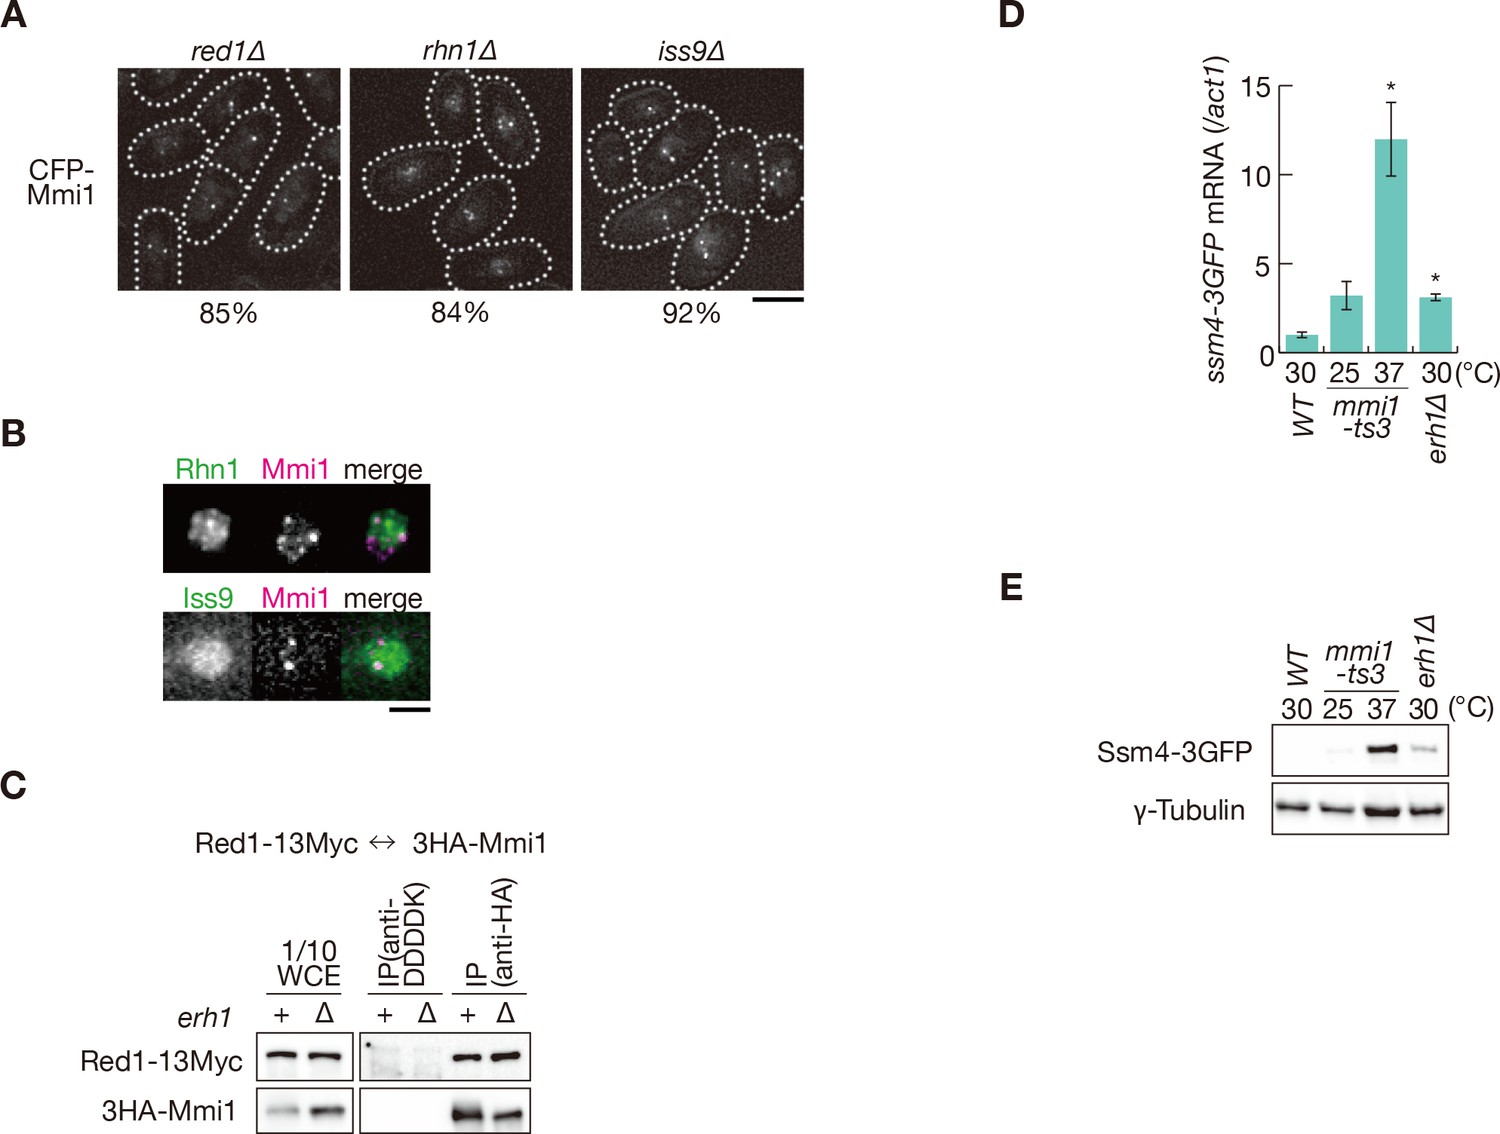
Erh1 assists Mmi1 self-interaction.
(A) Localization of CFP-Mmi1 expressed from the endogenous locus in red1∆, rhn1∆, and iss9∆ cells. Frequencies of cells carrying Mmi1 foci are indicated below (n > 100). Dotted lines indicate the shape of cells. Bar, 5 µm. (B) Localization of YFP-tagged Rhn1 and Iss9 expressed from the endogenous locus (green) and CFP-Mmi1 (magenta) in wild-type cells. Images of the nuclear region are shown. Scale bar: 2 µm. (C) Interaction of Mmi1 with Red1 in erh1∆ cells. Cell extracts prepared from wild-type and erh1∆ cells expressing HA-tagged Mmi1 and Myc-tagged Red1 were subjected to immunoprecipitation with an anti-HA antibody. An anti-DDDDK antibody was used as negative control. Precipitates and 1/10 cell extracts were then immunoblotted. (D) Expression of ssm4-3GFP mRNAs was analyzed by quantitative RT-PCR in erh1∆ cells. Wild-type (WT) and erh1∆ cells were grown at 30°C. mmi1-ts3 cells were grown at 25°C and then shifted to 37°C for 4 hr. *p<0.05 compared with the wild-type strain (Student’s t-test). (E) Expression levels of Ssm4-3GFP protein in the same conditions as (D). γ-tubulin was used as a loading control.
Figure 6—figure supplement 2
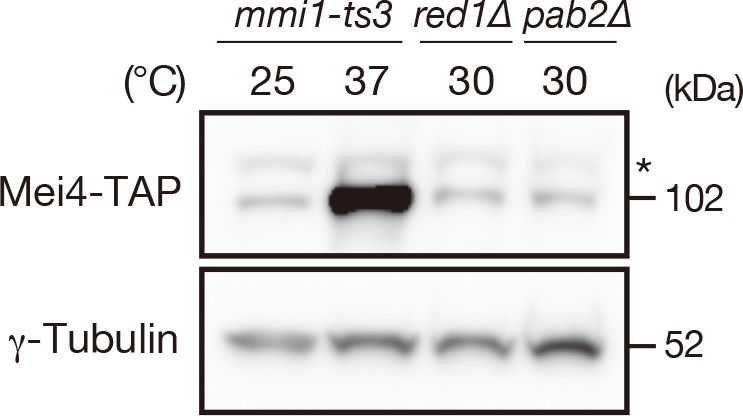
Pab2 is not required for prevention of Mei4 protein expression.
Expression levels of Mei4-TAP protein in mmi1-ts3, red1∆, and pab2∆ strains. mmi1-ts3 cells were grown at 25°C and then shifted to 37°C for 4 hr. red1∆ and pab2∆ cells were grown at 30°C. γ-tubulin was used as a loading control. The asterisk indicates non-specific bands.
Figure 7
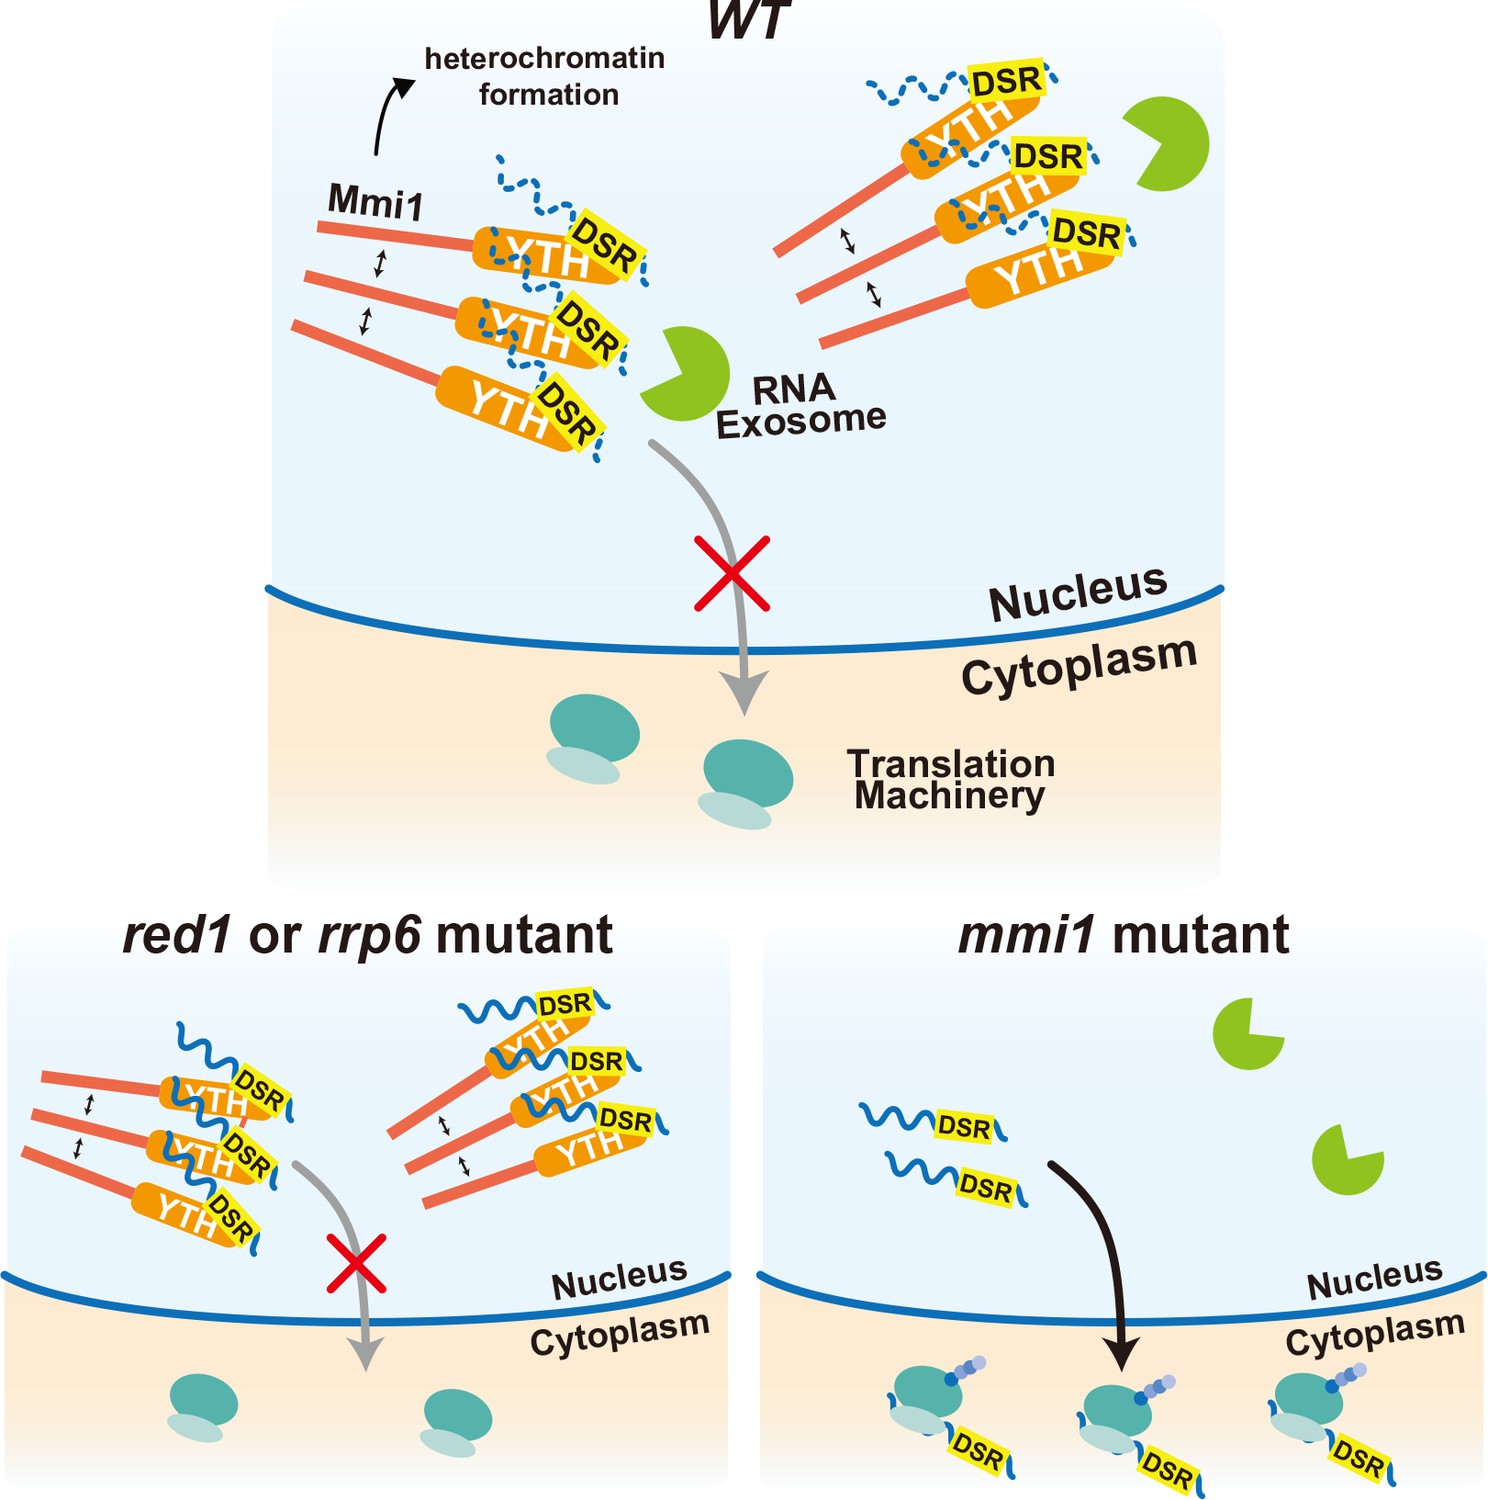
Multi-layered regulation to prevent mistimed expression of meiotic genes by the YTH-domain protein Mmi1.
In wild-type (WT) cells, meiotic transcripts carrying DSR are recognized by Mmi1, localize in nuclear foci through Mmi1 self-interaction, and are degraded by the nuclear exosome. Nuclear export and ectopic protein expression are prevented. Mmi1 also induces heterochromatin formation at its target genes. In red1 and rrp6 mutant cells, degradation of meiotic transcripts is dampened. However, transcripts are tethered to nuclear Mmi1 foci and expression of them is suppressed through sequestration from the translation machinery. In the absence of Mmi1, meiotic transcripts carrying DSR are exported to the cytoplasm and translated, leading to the deleterious expression of meiotic genes.
Additional files
-
Supplementary file 1
Strains used in this study.
- https://doi.org/10.7554/eLife.32155.026
-
Supplementary file 2
Primers used in this study.
- https://doi.org/10.7554/eLife.32155.027
-
Supplementary file 3
Oligonucleotide probes for single-molecule FISH.
- https://doi.org/10.7554/eLife.32155.028
-
Source data 1
Uncropped images of western and northern blots in Figure 1C, Figure 1—figure supplement 1B, Figure 1—figure supplement 2A,B,C,D, Figure 3—figure supplement 1A, Figure 3—figure supplement 2C, Figure 4D,G, Figure 4—figure supplement 1D, Figure 5C, Figure 5—figure supplement 2C, Figure 5—figure supplement 3, Figure 6C,D,F, Figure 6—figure supplement 1C,E, and Figure 6—figure supplement 2.
- https://doi.org/10.7554/eLife.32155.029
-
Transparent reporting form
- https://doi.org/10.7554/eLife.32155.030
Download links
A two-part list of links to download the article, or parts of the article, in various formats.
Downloads (link to download the article as PDF)
Open citations (links to open the citations from this article in various online reference manager services)
Cite this article (links to download the citations from this article in formats compatible with various reference manager tools)
YTH-RNA-binding protein prevents deleterious expression of meiotic proteins by tethering their mRNAs to nuclear foci
eLife 7:e32155.
https://doi.org/10.7554/eLife.32155


